
 Mark A. Fields
- Department of Ophthalmology, Harkness Eye Institute, Columbia University, New York, NY, USA
Objective: To determine the effects of age and topographic location on gene expression in human neural retina. Methods: Macular and peripheral neural retina RNA was isolated from human donor eyes for DNA microarray and quantitative RT-PCR analyses. Results: Total RNA integrity from human donors was preserved. Hierarchical clustering analysis demonstrates that the gene expression profiles of young, old, macula, and peripheral retina cluster into four distinct groups. Genes which are highly expressed in macular, peripheral, young, or old retina were identified, including inhibitors of Wnt Signaling Pathway (DKK1, FZD10, and SFRP2) which are preferably expressed in the periphery. Conclusion: The transcriptome of the human retina is affected by age and topographic location. Wnt pathway inhibitors in the periphery may maintain peripheral retinal cells in an undifferentiated state. Understanding the effects of age and topographic location on gene expression may lead to the development of new therapeutic interventions for age-related eye diseases.
Introduction
In the normal human eye the neural retina develops from mesoderm and forms a multilaminated structure with highly specialized functions for light detection and signal processing (Ye et al., 1999). During retinal aging, neuronal components of retina develop structural and functional changes that can adversely affect retinal function. Examples of age-dependent diseases of the retina include glaucoma and age-related macular degeneration (AMD), in which structural changes leading to visual loss develop in ganglion cells or outer retina, RPE, and choriocapillaris (Nag et al., 2006). The human macula, which is an anatomic region approximately 6 mm in diameter delineated by the optic nerve and the superior and inferior temporal vascular arcades, is adversely affected in AMD (Hornan et al., 2007). As a disease AMD is characterized by cellular changes in RPE, choriocapillaris, and outer retina and by structural changes in Bruch’s membrane (Del Priore and Tezel, 1998; Spraul et al., 1999). Cellular changes that occur in AMD include atrophy of the RPE, choriocapillaris, and outer retina in non-exudative AMD as well as the development of choroidal or intraretinal neovascularization in exudative AMD (Chader, 2002). Ultimately some changes in cellular behavior may be initiated by or reflected in alterations in the gene expression profile of the cells (Radeke et al., 2007; Chen et al., 2008; Kurji et al., 2009; Stadler and Come, 2009). A systematic comparison of the gene expression profiles of young vs. older neural retina is thus important, as analysis of the retinal transcriptome may allow us to define a role for some genes in either initiating or responding to the cellular changes that occur in age-dependent diseases such as AMD. Topographic location may also affect gene expression profiling, since some diseases such as AMD affect the macula and periphery differently (van Soest et al., 2007).
To this end we have compared the gene expression profiles of young vs. old human neural retina, using both macular and peripheral neural retinal explants. In essence, macular and peripheral neural retinas were harvested from young and older human donor eyes and the retinal gene expression profiles were determined using the Affymetrix DNA microarray chip U133 plus 2. We were able to test the expression profile of 54,600 gene probes and determine genes whose expression level (mRNA) was altered by temporal (young vs. older) or spatial (macular vs. peripheral) factors. Knowledge of the function of genes with an altered expression profile may provide insight into the role of age-related changes in gene expression in the pathogenesis of human ocular disease.
Materials and Methods
Preparation of Adult Human Retinal Tissues
Twelve human donor eyes without recorded eye disease history from the National Disease Research Interchange (NDRI, Philadelphia, PA, USA) ranged in donor age from 18 to 79 years. Eyes were separated into a younger (18, 21, 32, 32, 35, and 43-year-old cadaver donors) and older (72, 74, 74, 74, 75, and 79-year-old cadaver donors) age group. All donor eyes were enucleated within 10 h of death and processed in the lab within 32 h of death (Table 1). Since the study involved postmortem tissue without identification of individual patients it was exempt from Institutional Review Board (IRB) approval. Upon receipt in the laboratory, eyes were cleaned of extraocular tissue. The eyes were placed in carbon dioxide-free media (Gibco, Grand Island, NY, USA) and an incision was made through the sclera 3 mm posterior to the limbus and extended circumferentially. Four radial incisions were then made through the sclera and the sclera was peeled away. A full-thickness circumferential incision was made 1 mm posterior to the ora serrata; the anterior segment; and vitreous were removed and discarded. The posterior pole of each eyecup was inspected visually with direct and retroillumination under a dissecting microscope and globes were discarded if there was any evidence of subretinal blood, extensive drusen, or irregular pigmentation of the macular RPE. The choroid-Bruch’s membrane-RPE complex was removed after trimming its attachment to the optic nerve using forceps, leaving the intact human retina as a flat mount. After rinsing three times with cold Dulbecco’s Phosphate Buffered Saline (PBS) the macular retina was isolated from each eye using a 5-mm circular punch; a 5 mm punch of peripheral retina was then obtained by trephination of a circular region whose posterior border was at least 10 mm away from the macular punch. Cut tissues were rinsed again and stored at −80°C prior to isolating RNA. Twelve pairs of eyes from human donors were independently (not pooled samples) used for DNA microarray study; given the expense and availability of human tissue, similar small sample sizes have been used in the past to generate important data on gene expression in human tissue (Wistow et al., 2002; Chowers et al., 2003; Hollborn et al., 2005). Four additional retinal explants (donor age 34, 38, 78, and 81), independent of the samples used in the DNA microarray studies, were also harvested for confirmatory qRT-PCR (quantitative reverse transcriptase polymerase chain reaction) using independent samples (not pooled, Table 1).
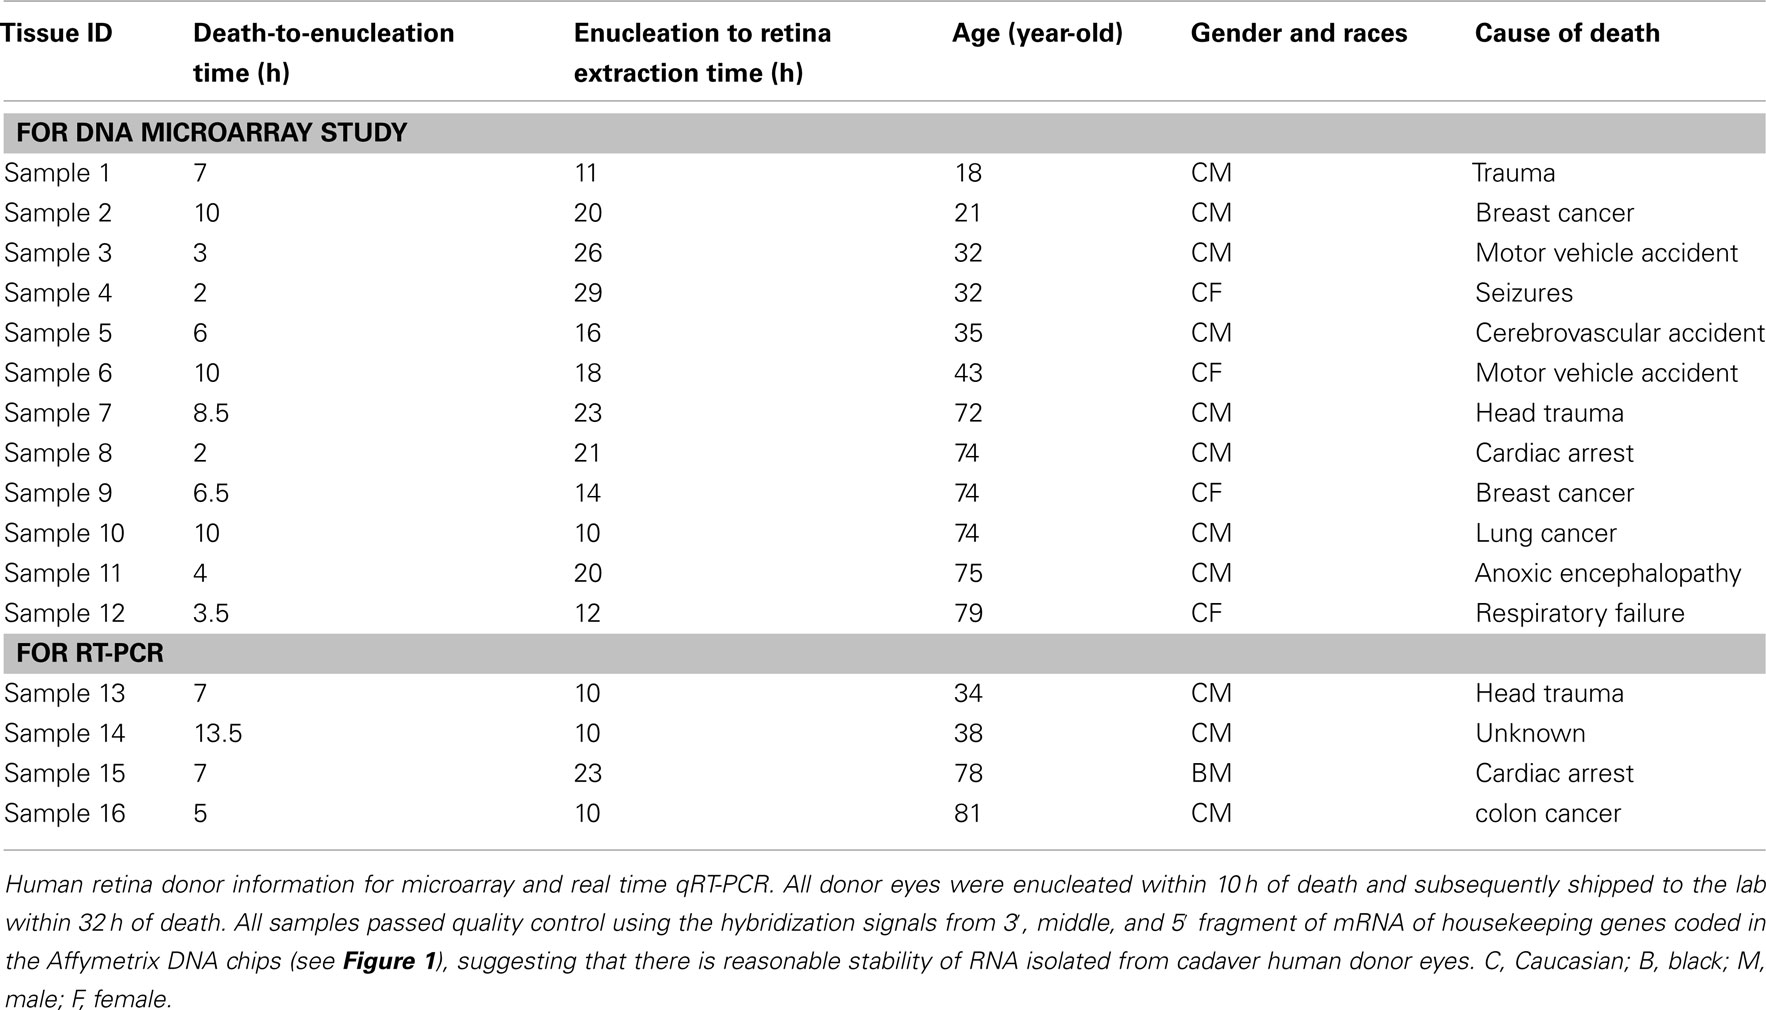
Table 1. Human retina donor information.
Isolation of Total RNA
Human macula and peripheral retina were taken from a −80°C freezer and total RNA was isolated and purified using a Qiagen RNeasy Mini Kit according to manufacturer’s instructions as described previously (Cai and Del Priore, 2006; Gong et al., 2008). Briefly, retinal tissue was disrupted and 600 μl of lysing buffer (RLT) was added to cells in a 1.5-ml microfuge tube. The cell lysate was loaded onto a QIAshredder spin column and spun for 2 min at 13,000 rpm. The homogenized lysate was then mixed with 600 μl of 70% ethanol and applied to an RNeasy mini spin column and centrifuged for 15 s at 13,000 rpm. The specimen was then washed twice by adding 700 μl of Buffer RW1 and Buffer RPE, with subsequent spinning. Sixty microliters RNase-free water was used to elute total RNA from an RNeasy column. Approximately 8 μg of total RNA were extracted from macular and peripheral tissues (one punch each) of one pair of donor eyes. The quality of total RNA was assessed with the RNA denaturing agarose gel electrophoresis and microarray assay (see below).
DNA Microarray Experiments
A T7-(dT)24 oligomer, superscript reverse transcriptase II and DNA Polymerase I (Gibco BRL) were used for first-strand and second-strand cDNA synthesis using 5 μg of total RNA as templates for each sample. Double-stranded cDNA was cleaned with Phase Lock Gels-Phenol/Chloroform extraction and ethanol precipitation. Biotin-labeled antisense cRNA was produced by an in vitro transcription reaction (ENZO BioArray High Yield RNA Transcript Labeling Kit) and incubated with fragmentation buffer (Tris-acetate, KOAc and MgOAc) at 94°C for 35 min. Target hybridization, washing, staining, and scanning probe arrays were done following an Affymetrix GeneChip Expression Analysis Manual. All human retinal samples are processed with individual microarray chips independently. The data then averaged/pooled for analysis and compared (MIAME accession # GSE32614).
Quality Controls, Definitions of Gene Presence or Absence and Statistical Analysis
For assessing the quality of retinal RNA, 1% agarose gel with 0.22 M formaldehyde was used for RNA electrophoresis. One microgram of total RNA isolated from peripheral retinal samples was mixed with 2× loading buffer (Fisher Scientific) and run with 1× MOPS [3-(N-morpholino)propanesulfonic acid] buffer (Fisher Scientific). After ethidium bromide staining RNA bands were visualized with a UV transilluminator and 28S and 18S rRNA band patterns were analyzed.
For quality control the U133 plus 2 DNA microarray chips (Affymetrix, Santa Clara, CA, USA) used include housekeeping gene probes to measure the consistency of the hybridization signals from their 3′, middle, and 5′ fragment of these mRNA coding regions (Hubbell et al., 2002). Gene expression analyses, including global normalization, scaling, and Gene Ontology analysis were performed using the Affymetrix Expression Console (Ver. 1.1.) and GeneSifter Genetic Analysis system (Geospiza, Inc., Seattle, WA, USA). For the purpose of this study, gene expression was labeled as being differentially expressed if they were detected as present in the samples compared (i.e., young vs. old or macula vs. peripheral retina), had expression levels >50 in densitometry, and there was at least 2.0-fold difference in expression level that was statistically significant (p < 0.05 with Benjamini and Hochberg adjusted Student’s t-test; Benjamini et al., 2001). We calculated a z-score to determine the relative gene expression changes (Doniger et al., 2003) and thereby identify biological processes, cellular components, and molecular group functions of those genes that warrant further study (Ashburner et al., 2000).
Real Time Quantitative RT-PCR
Real time Quantitative RT-PCR (qRT-PCR) was performed on retinal samples harvested from different donors (ages 34, 38, 78, and 81 years) than those used to generate the microarray data (Table 1). The LightCycler system (Roche Diagnostics Corp.) was used for real time quantitative RT-PCR. An RNA Amplification Kit SYBR Green I (Roche Molecular Biochemicals, Mannheim, Germany) was used to synthesize the first-strand cDNA and subsequent amplification using gene specific primers (Table 2). The PCR reaction solution contains 0.5 μg of total RNA, 6 mM MgCl2, and 0.5 μM of each primer. Other components in qRT-PCR master mix contain buffer, enzyme, SYBR green and dNTP. For reverse-transcription, reaction capillaries containing 20 μl RT-PCR reaction mix were incubated at 55°C for 10 min, followed by incubation at 95°C for 30 s. qRT-PCR was performed using an initial denaturation for 1 s at 95°C, followed by 35 cycles of denaturation for 1 s at 95°C, annealing for 10 s at 55°C, and extension for 13 s at 72°C in a programmable LightCycler. A melting curve analysis was performed by following the final cycle with incubation at 95°C for 1 s, 65°C for 10 s, followed by a temperature transition rate of 20°C/s to reach 95°C. Negative controls for the qRT-PCR analysis, which contained all reaction components except for RNA, were performed simultaneously to determine when the non-specific exponential amplification cycle number was reached.
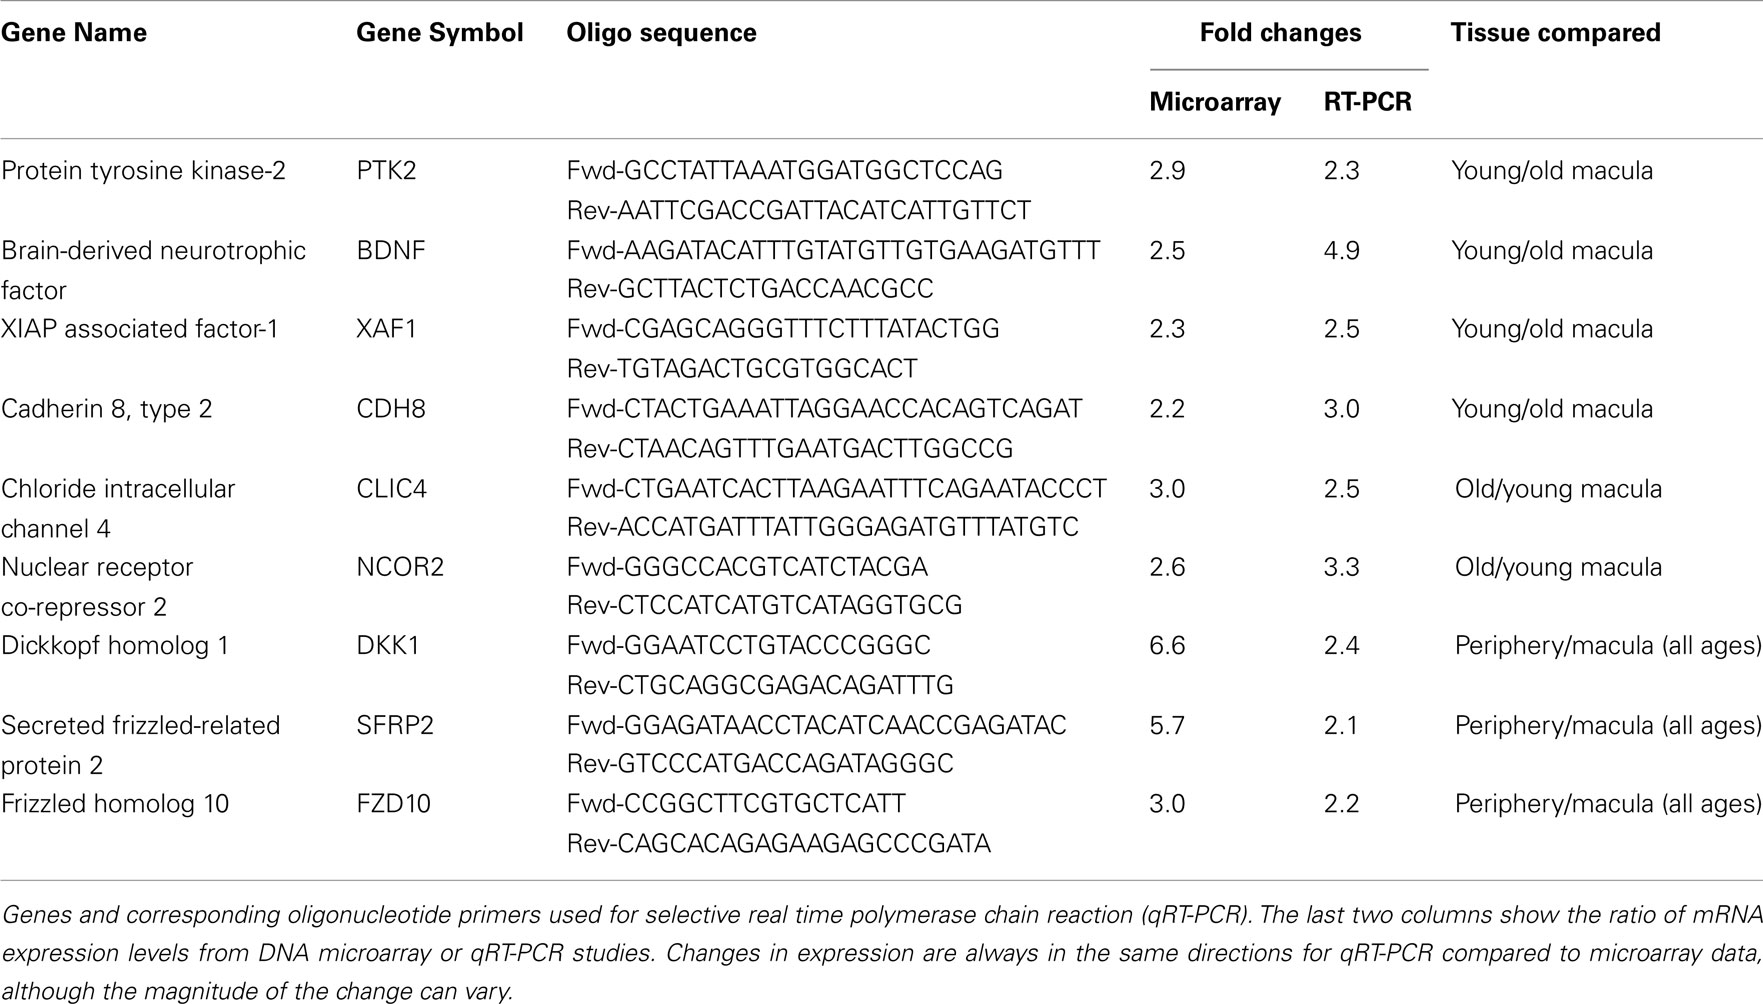
Table 2. Primers used and the result of semi-quantitative RT-PCR compared to DNA microarray.
Results
Sample Quality Control Assessment
To determine the quality of the RNA isolated from human eyes, we determined the ratio of the 28S and 18S bands in the isolated RNA. The intensity ratio of 28S/18S was approximately 2.0: 1 without any significant smearing of the leading edges of either band (Data not shown). In addition a quality control analysis was performed using the hybridization signals from 3′, middle, and 5′ fragment of mRNA of endogenous housekeeping genes and exogenous “spiking” genes coded in the Affymetrix DNA chips (Hubbell et al., 2002; Archer and Guennel, 2006). All 24 samples passed the pre-established quality control criteria, which was detection of signal from each of the control genes (Figure 1). To exclude any potential bias due to differences in handling of young vs. older tissue, we demonstrated that there was no correlation between donor age and death-to-enucleation time (Figure 2A) or death-to-RNA-extraction time (Figure 2B). In addition, there was no correlation between the 3′/5′ ratio for the housekeeping gene GADPH and the death-to-RNA-extraction time (Figure 3).
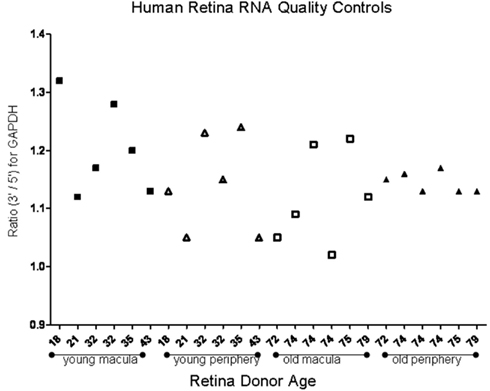
Figure 1. Ratio of the 3′ and 5′ signal obtained from human house keeping gene GAPDH using microarray. Study was performed to assess mRNA quality isolated from human donor eyes. Young samples and older samples are presented in order of donor age for both macular and peripheral samples. There is no correlation between donor age and signal ratio. The average of 3′/5′ signal ratio of all samples is 1.152 ± 0.07, which denotes good quality.
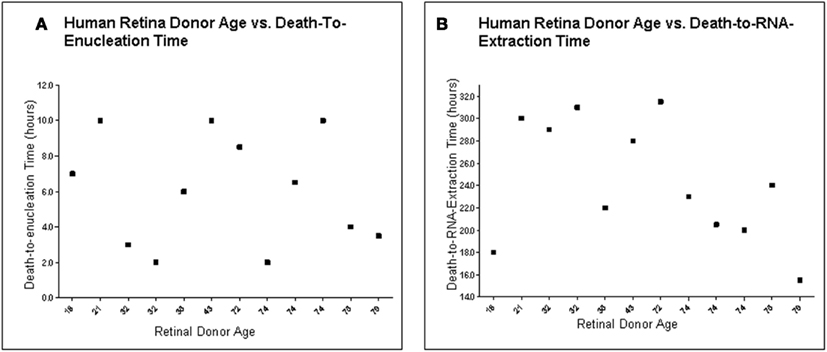
Figure 2. Human retina donor information. (A) Human Retina Donor Age vs. Death-To-Enucleation Time (B). Human Donor Age vs. Death-to-RNA-Extraction Time. Data showed that no bias was introduced by handling younger and older tissue differently, as there is no correlation between donor age and either death-to-enucleation or death-to-RNA isolation time.
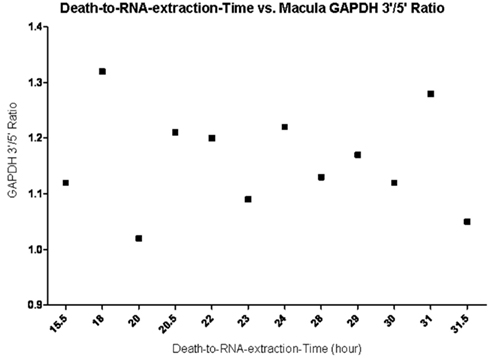
Figure 3. Death-to-RNA-Extraction time vs. GAPDH 3′/5′ ratio in macular tissue. Data shows no correlation between enucleation time and the quality of RNA (the closer the ratio is to 1, the better the RNA quality) within the 31.5 h death-to-RNA-extraction time.
Global and Hierarchical Clustering Analysis
We detected the expression of approximately 26,700 gene probes out of 54,600 gene probes present on the Affymetrix Human Genome U133 plus 2 chip. There was no statistically significant difference in the total number of genes expressed between human young macula (26686 ± 319), old macula (26956 ± 275), young peripheral retina (27122 ± 108), or old peripheral retina (26533 ± 490; data not shown). There was also no statistically significant difference in the standard deviations of the number of genes expressed among these four groups (F-test, p > 0.05). Hierarchical clustering analysis of 24 samples showed that the transcriptome of the older macula and peripheral retina cluster together and young macula and peripheral retina cluster together as well (Figure 4), suggesting that there is a significant effect of aging on the gene expression profile of the human neural retina.
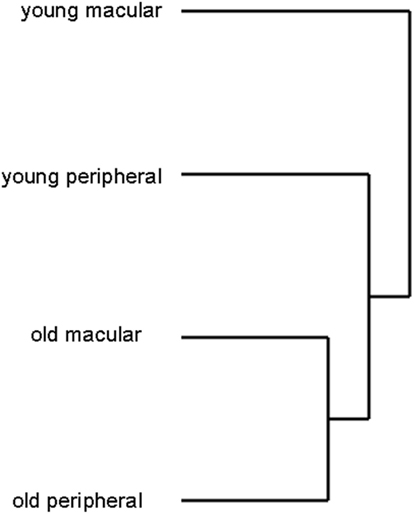
Figure 4. Hierarchical clustering analysis of retinal samples shows old and young retina (macular and peripheral) cluster separately, suggesting that aging changes the expression profile more than location (macula vs. periphery). Young macular and peripheral samples were from different individuals for this analysis. Likewise older macular and peripheral samples were from different individual donors.
Gene Expression Analysis
There are 81 genes among approximately 26,700 gene probes that are expressed at higher levels (Table 3) in macula compared to peripheral retinal samples (combining all age groups) using the definition described above. These genes have a wide array of functions, including lipid metabolism, ion transport, neuronal differentiation and regulation of transcription, cell adhesion and motility, and differentiation. There are 24 genes expressed at higher levels (Table 4) in the peripheral vs. macular retina (combining all age groups). These genes include those that are involved in the Wnt receptor signaling pathway, including DKK1 (Dickkopf homolog 1), FZD10 (frizzled homolog), and SFRP2 (secreted frizzled-related protein; Table 4; Robitaille et al., 2002; Kubo et al., 2003; Liu et al., 2007).
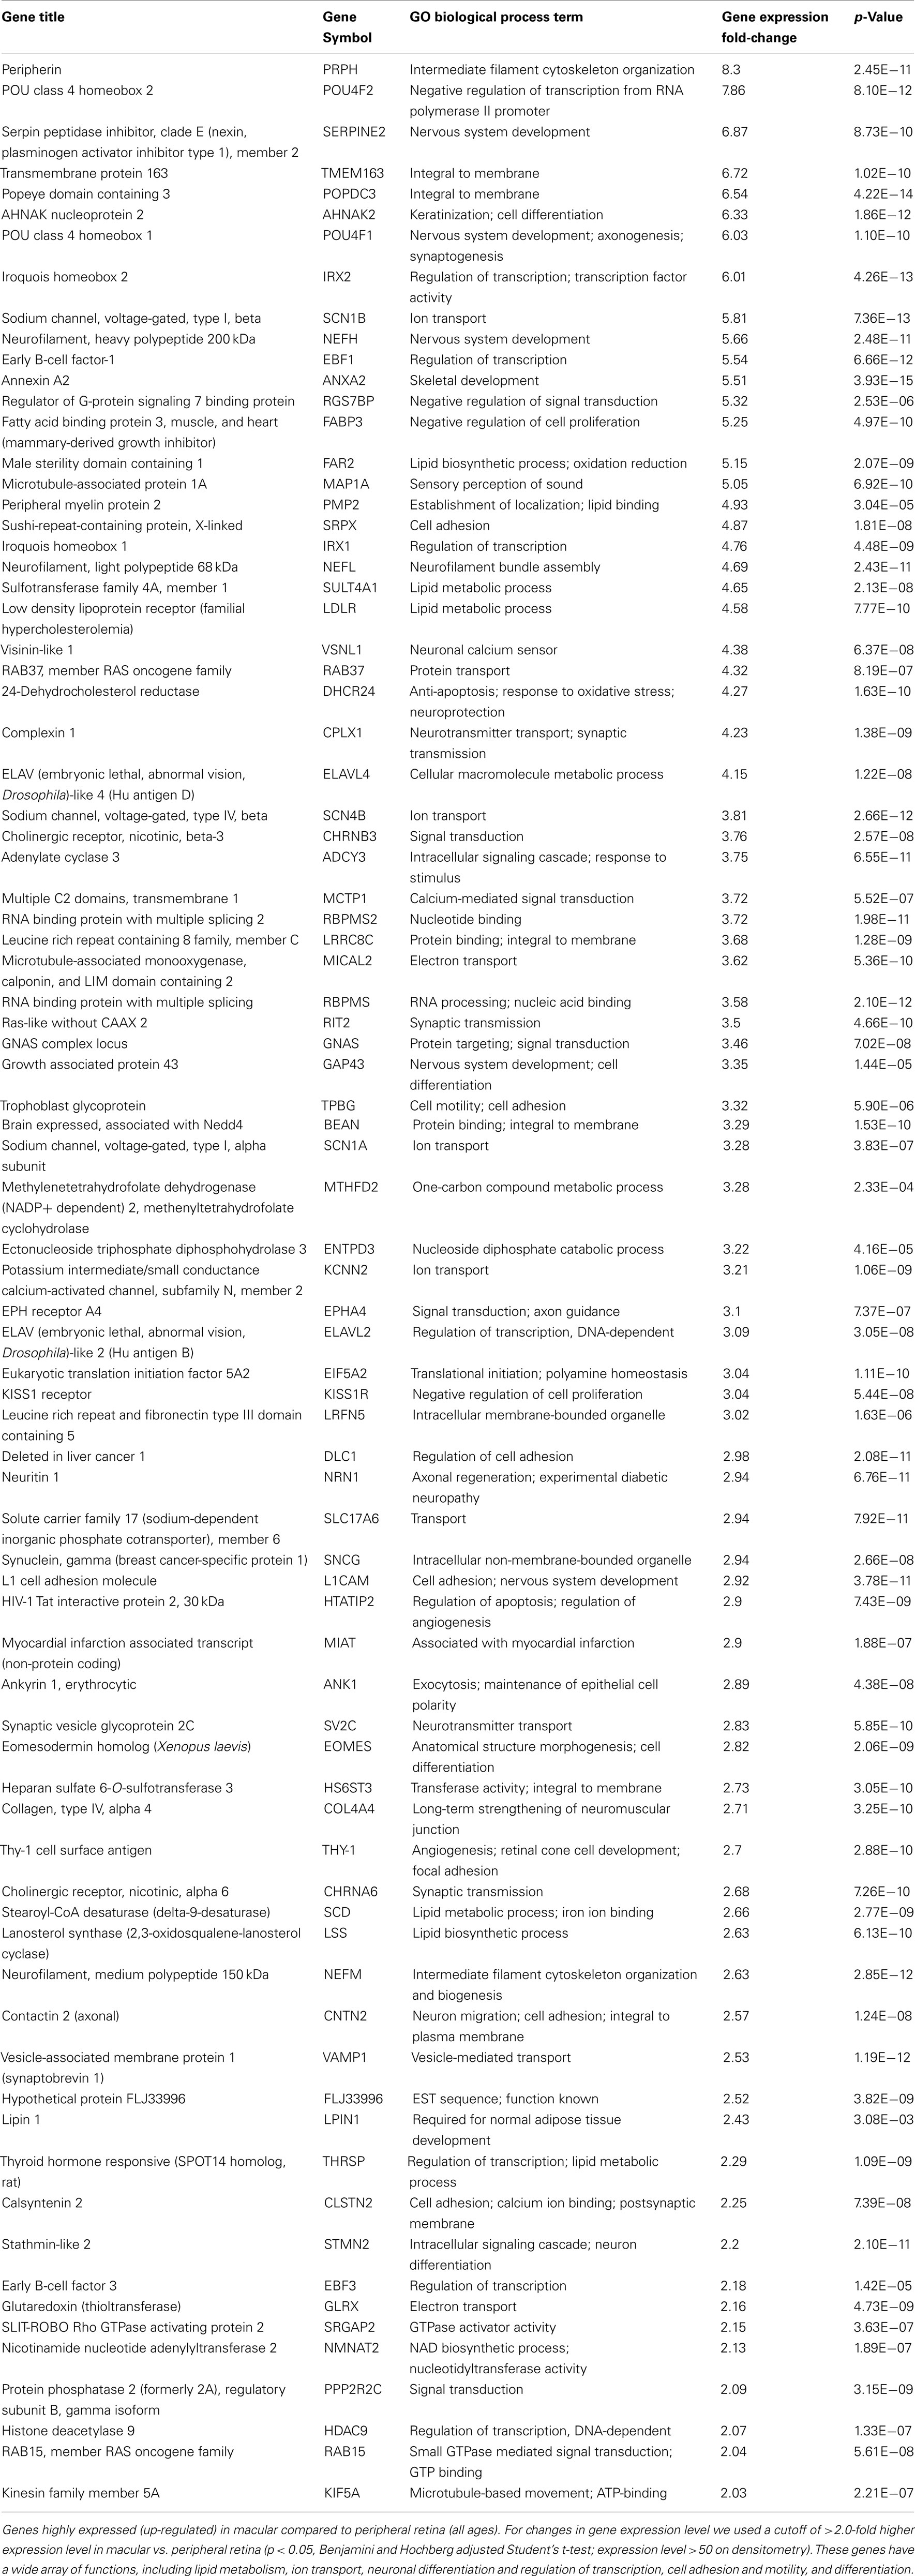
Table 3. Genes highly expressed (up-regulated) in macula compared to peripheral retina.
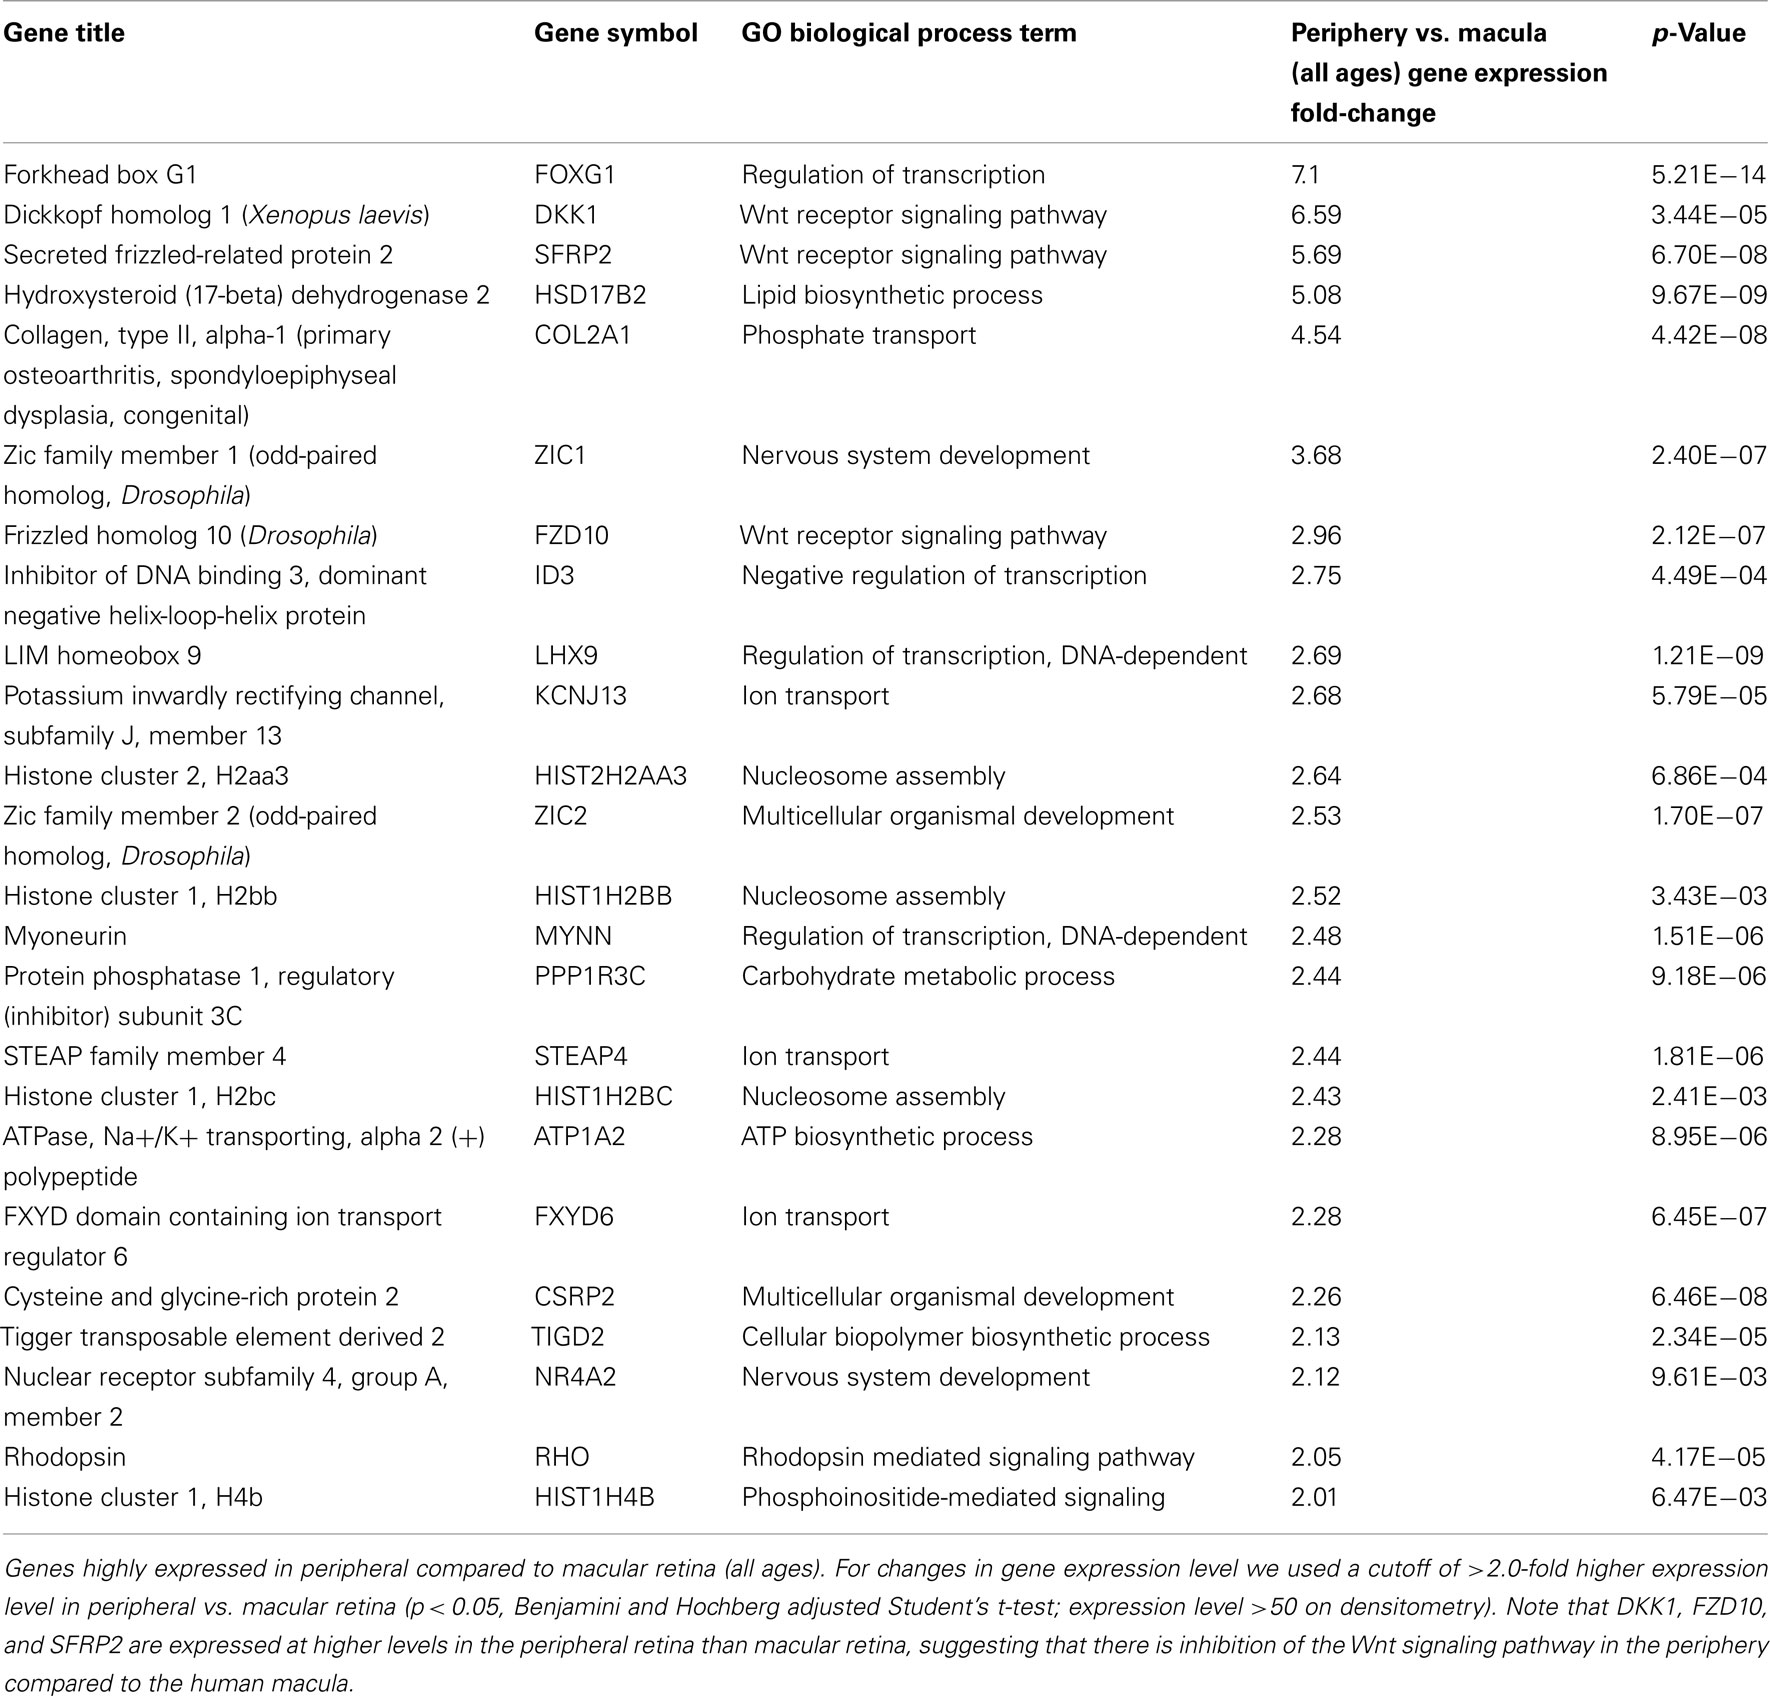
Table 4. Genes highly expressed in peripheral compared to macular retina.
Aging alters the expression profile of numerous genes within the human macula. There are 85 genes that were expressed at higher levels (Table 5) in young macula compared to older macula. This includes genes with a diverse range of functions, including cell metabolism, cell regulation, development, and other cellular processes (Figure 5A). There are 55 genes that were expressed at higher levels (Table 6) in older compared to younger human macula. This includes genes with a wide role in cell proliferation, survival, and differentiation (Figure 5B).
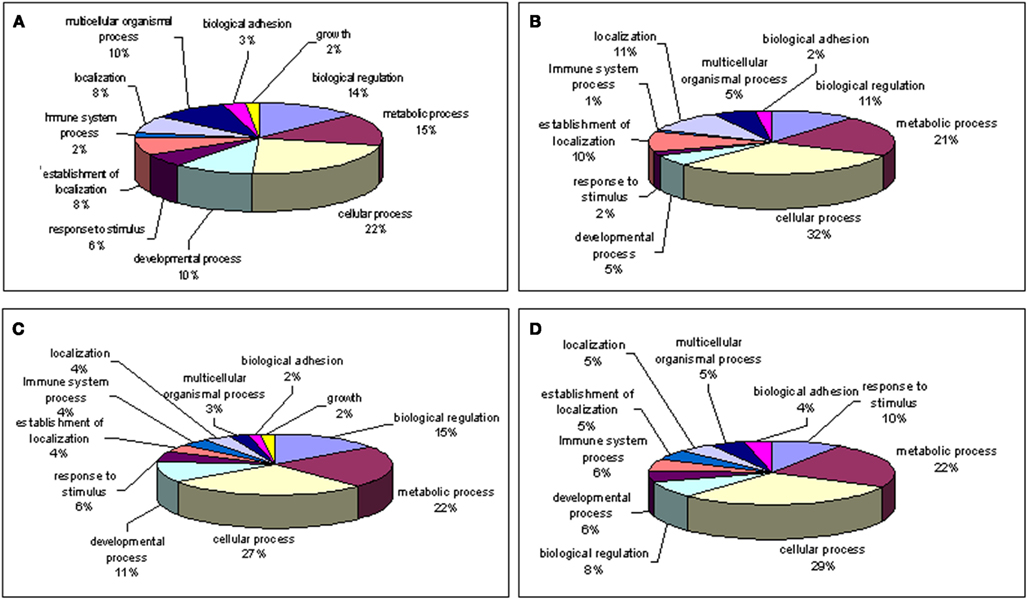
Figure 5. Gene ontology of biological processes (high z-score) involved with genes. (A) Up-regulated; (B) down-regulated in young macula compared with older macula; (C) up-regulated; (D) down-regulated in young compared with older peripheral retina. Note that genes involved with “growth” are only shown in young macula and peripheral retina but missing in older macula and periphery.
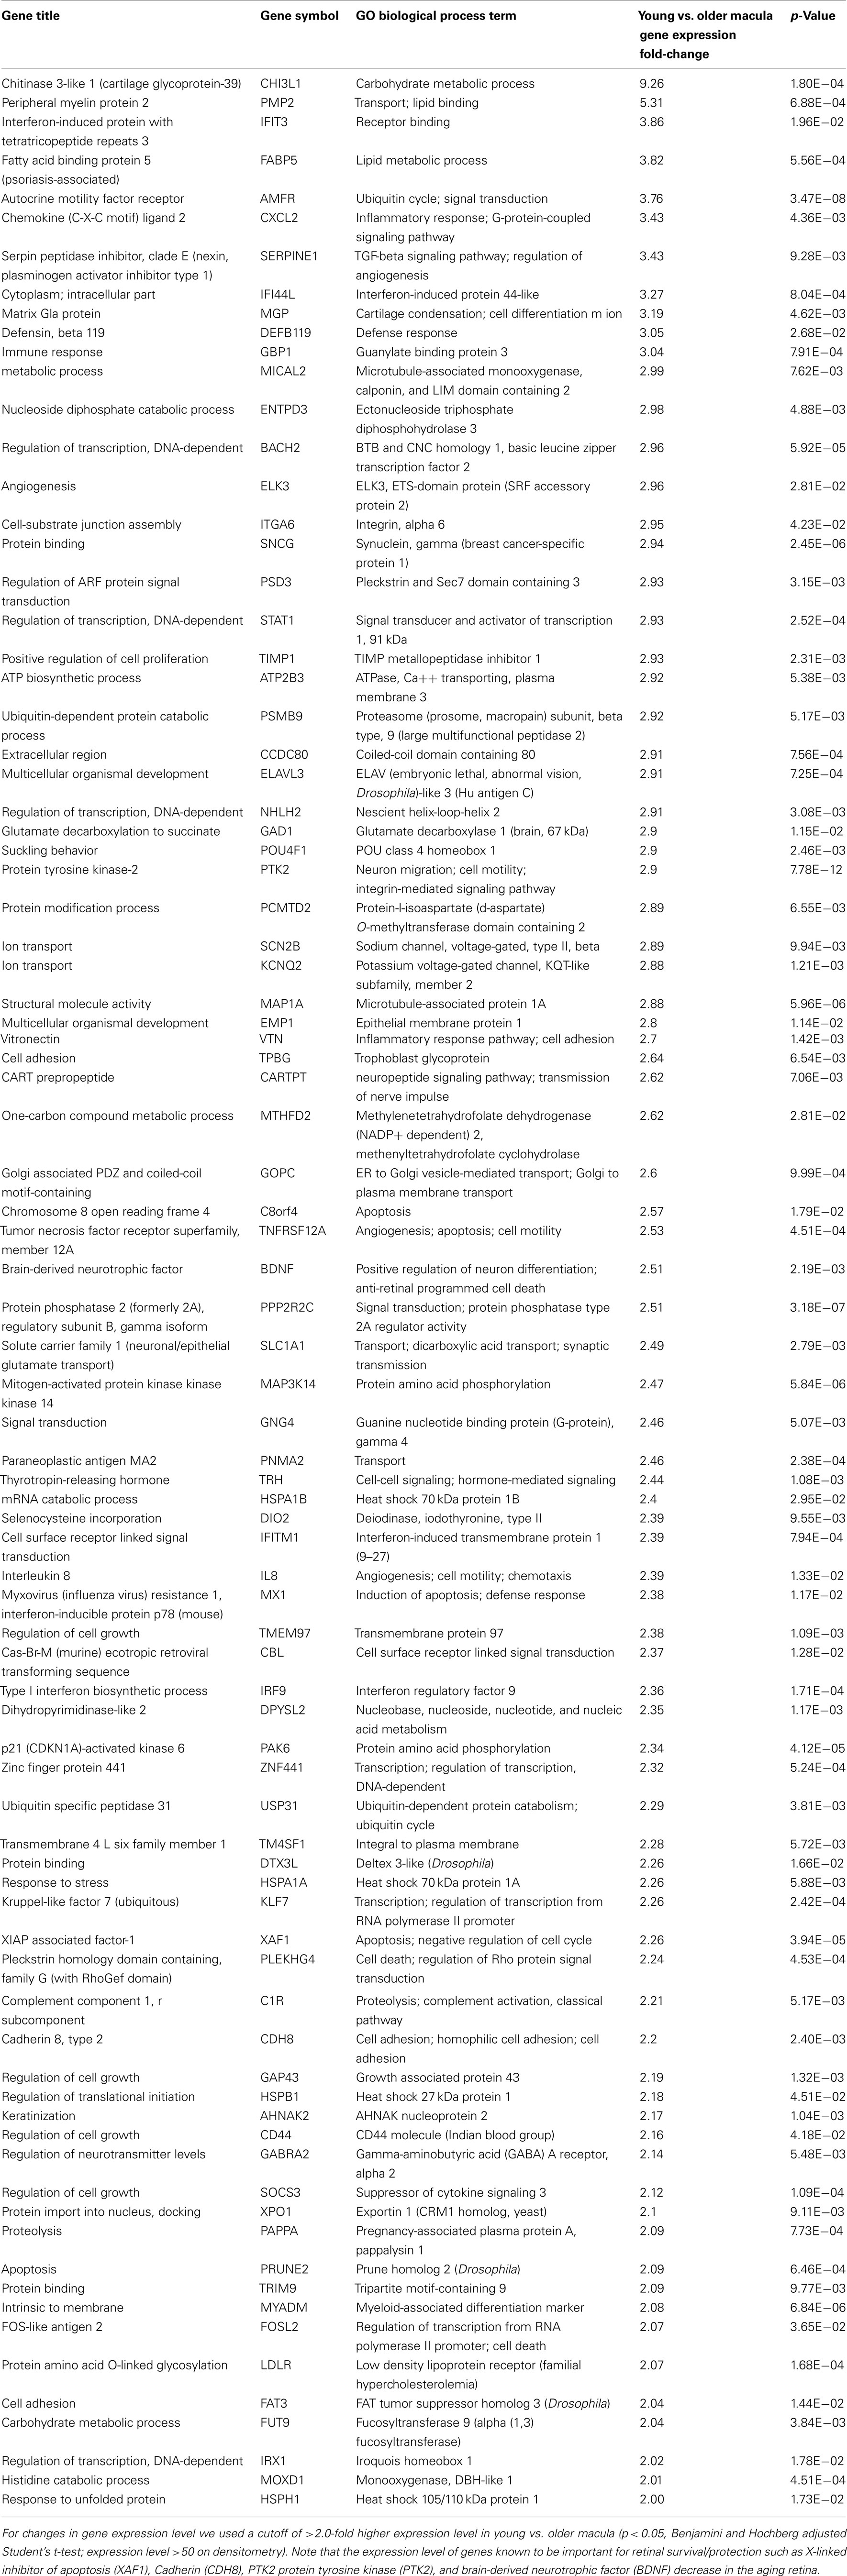
Table 5. Genes highly expressed in young compared to old macular retina.
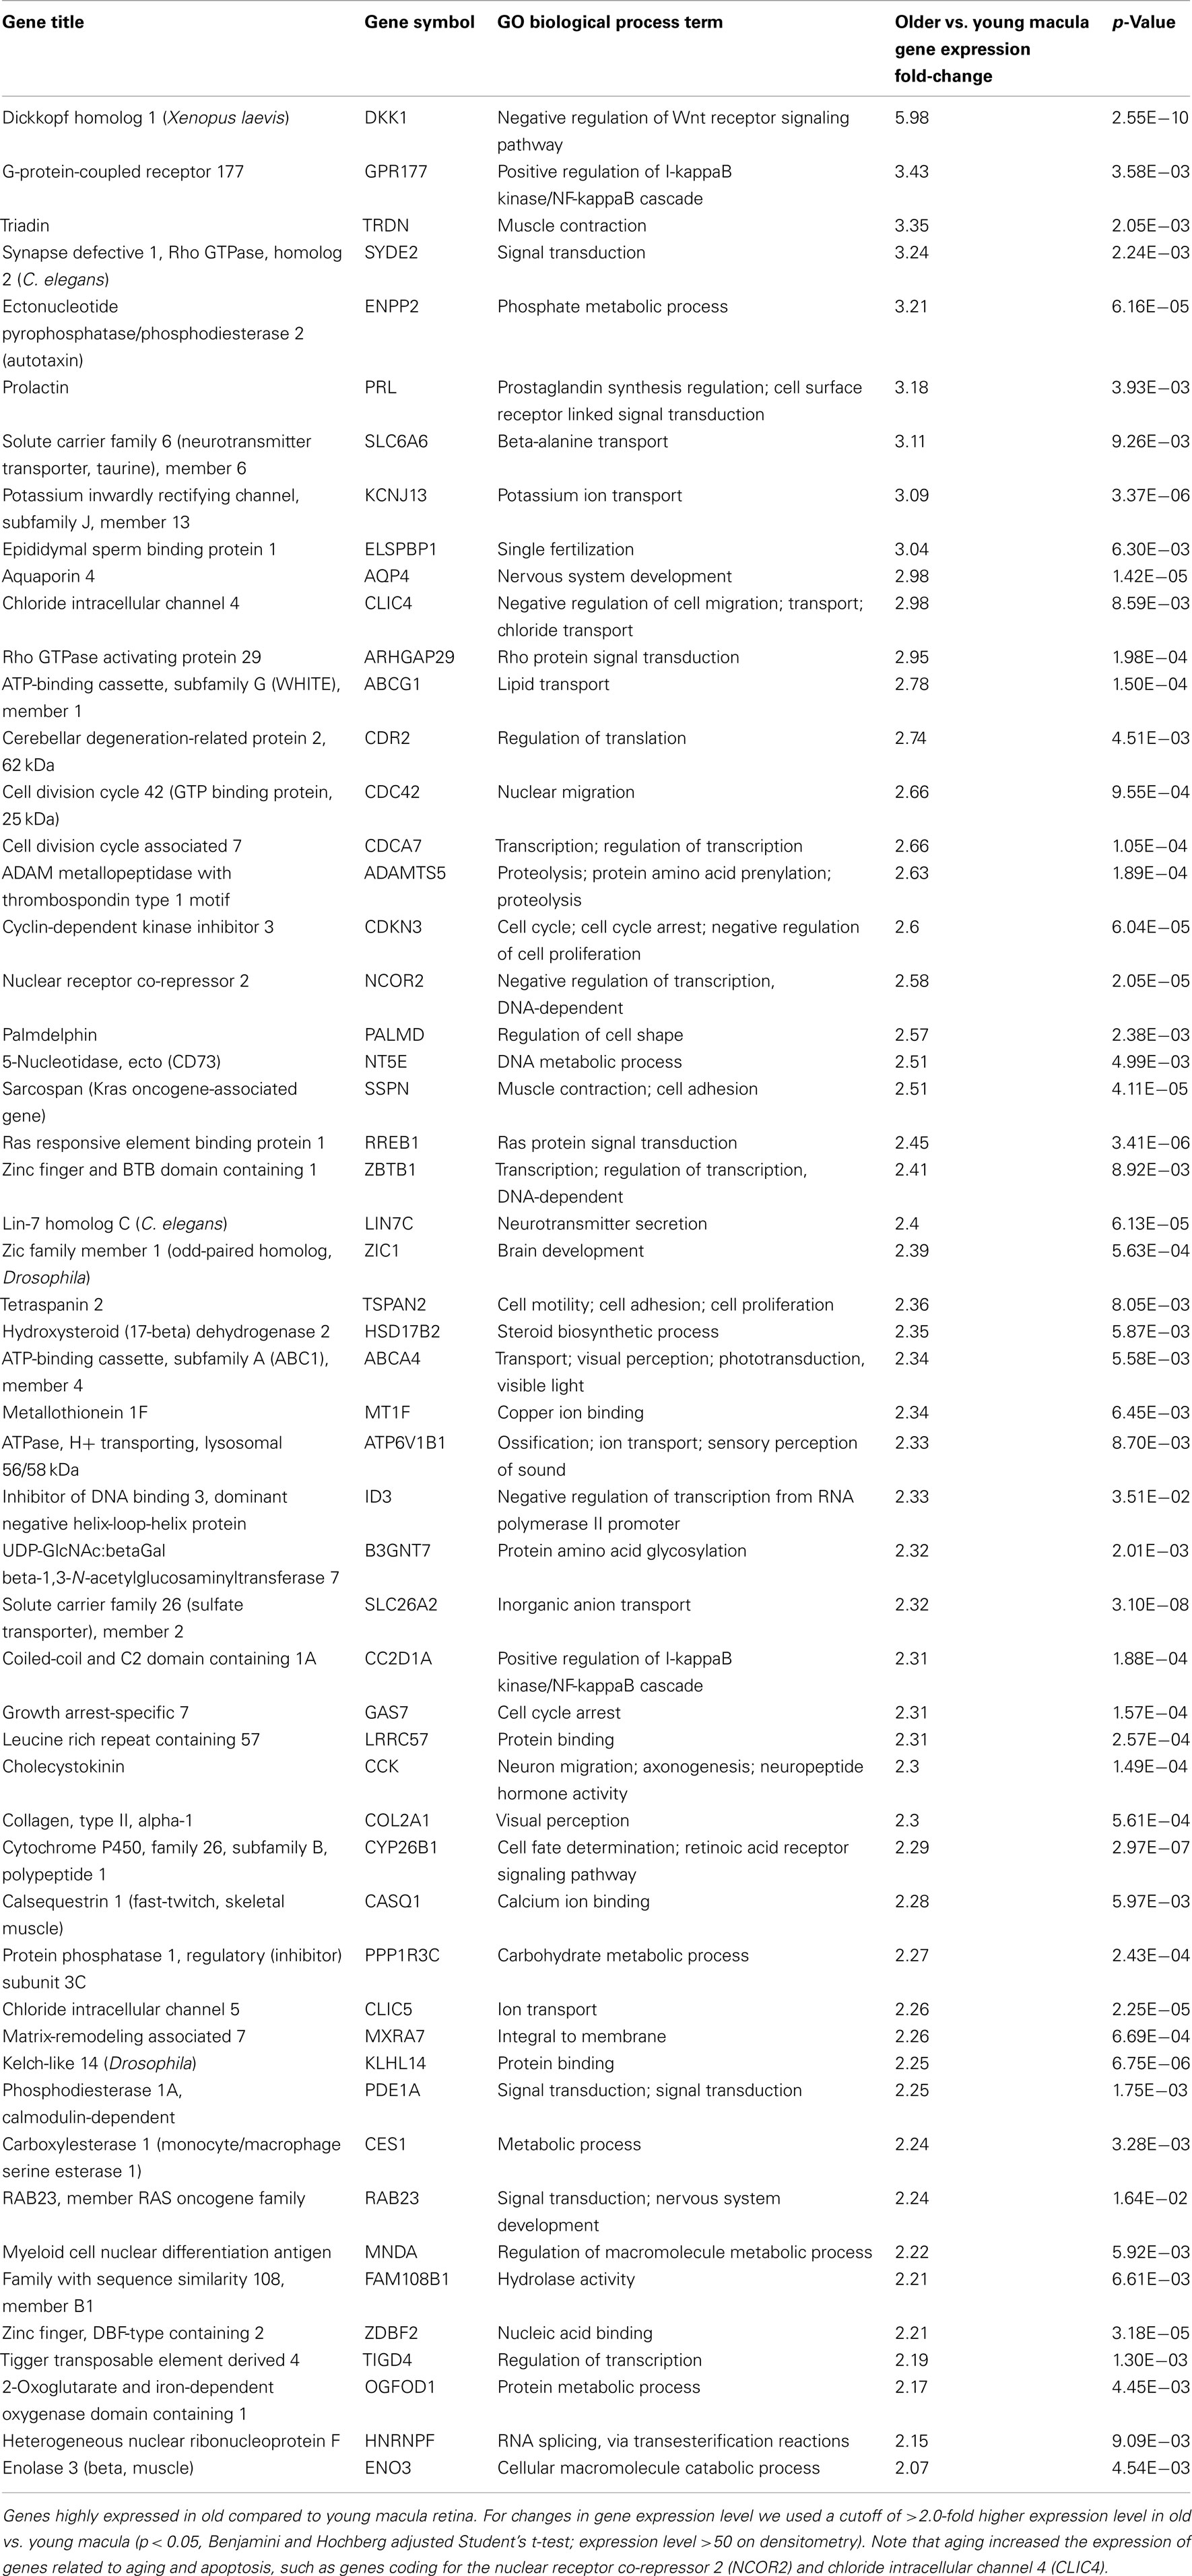
Table 6. Genes highly expressed in old compared to young macula.
There are 52 genes that were expressed at higher levels (Table 7) in younger peripheral vs. older peripheral retina. There are 34 genes that were expressed at higher levels (Table 8) in older vs. younger peripheral retina. The functions of these genes with high z-scores (Doniger et al., 2003) are grouped with ontology (Figures 5C,D).
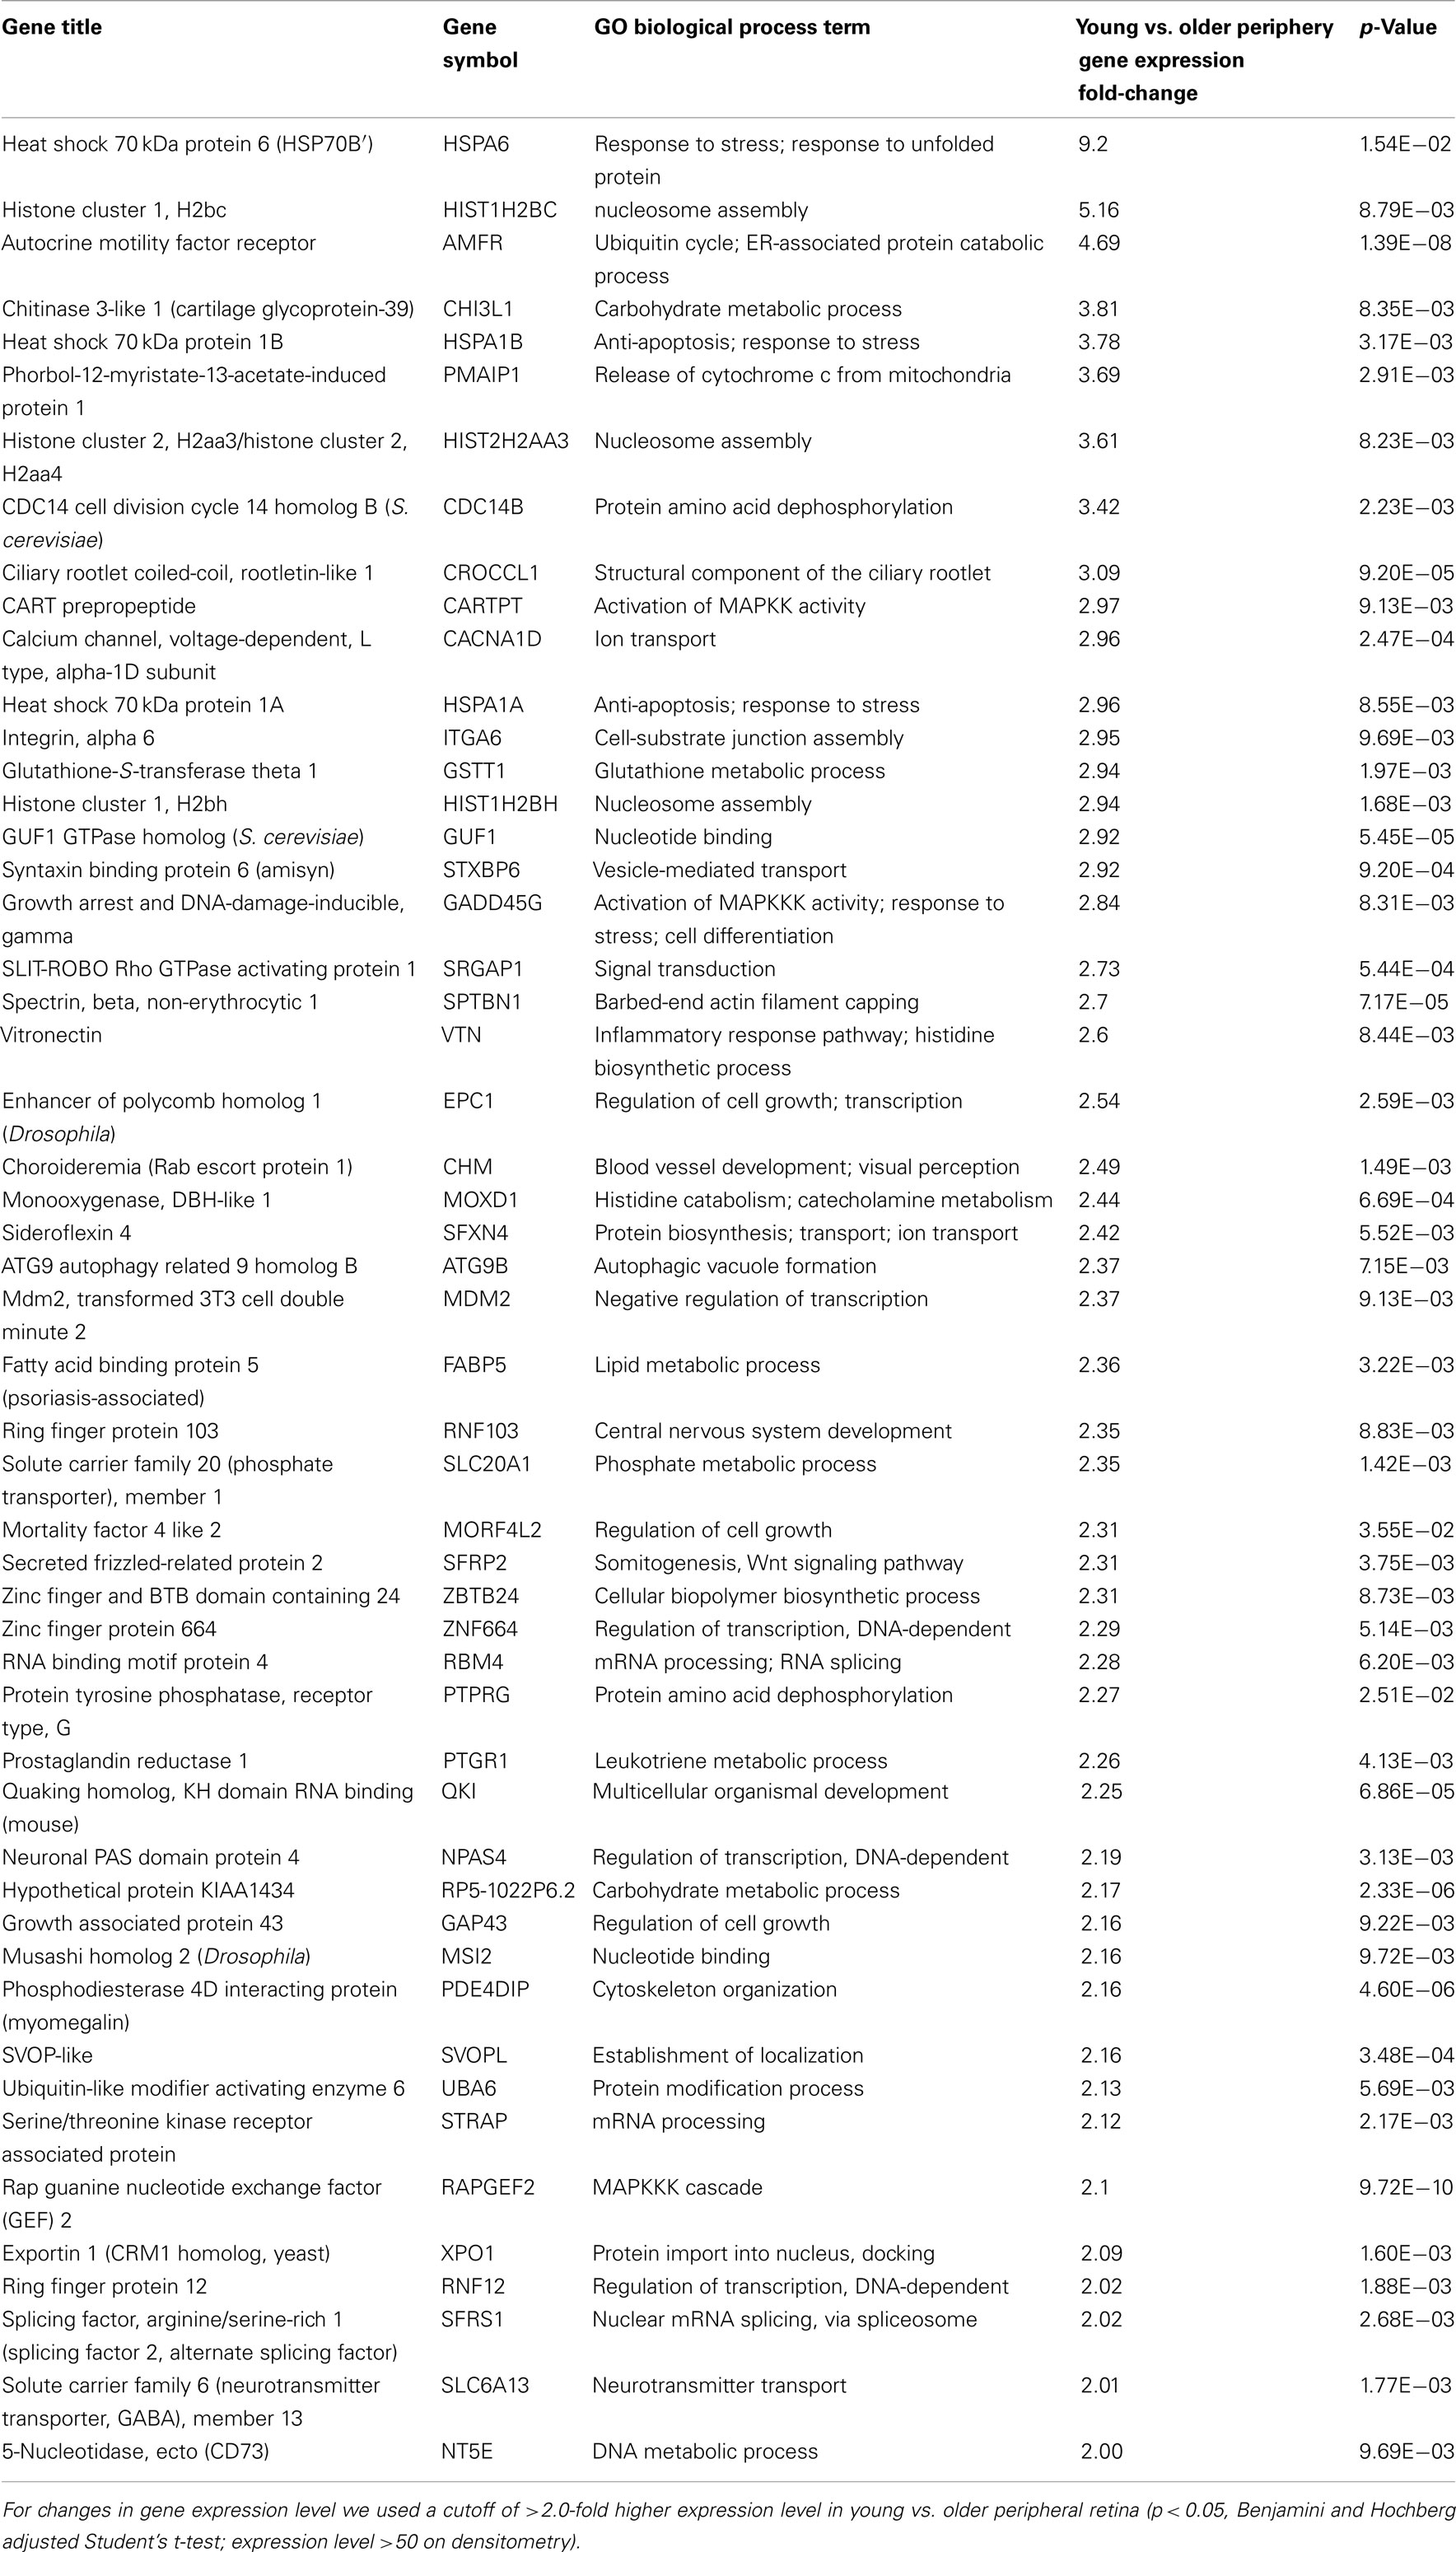
Table 7. Genes highly expressed in young compared to old peripheral retina.
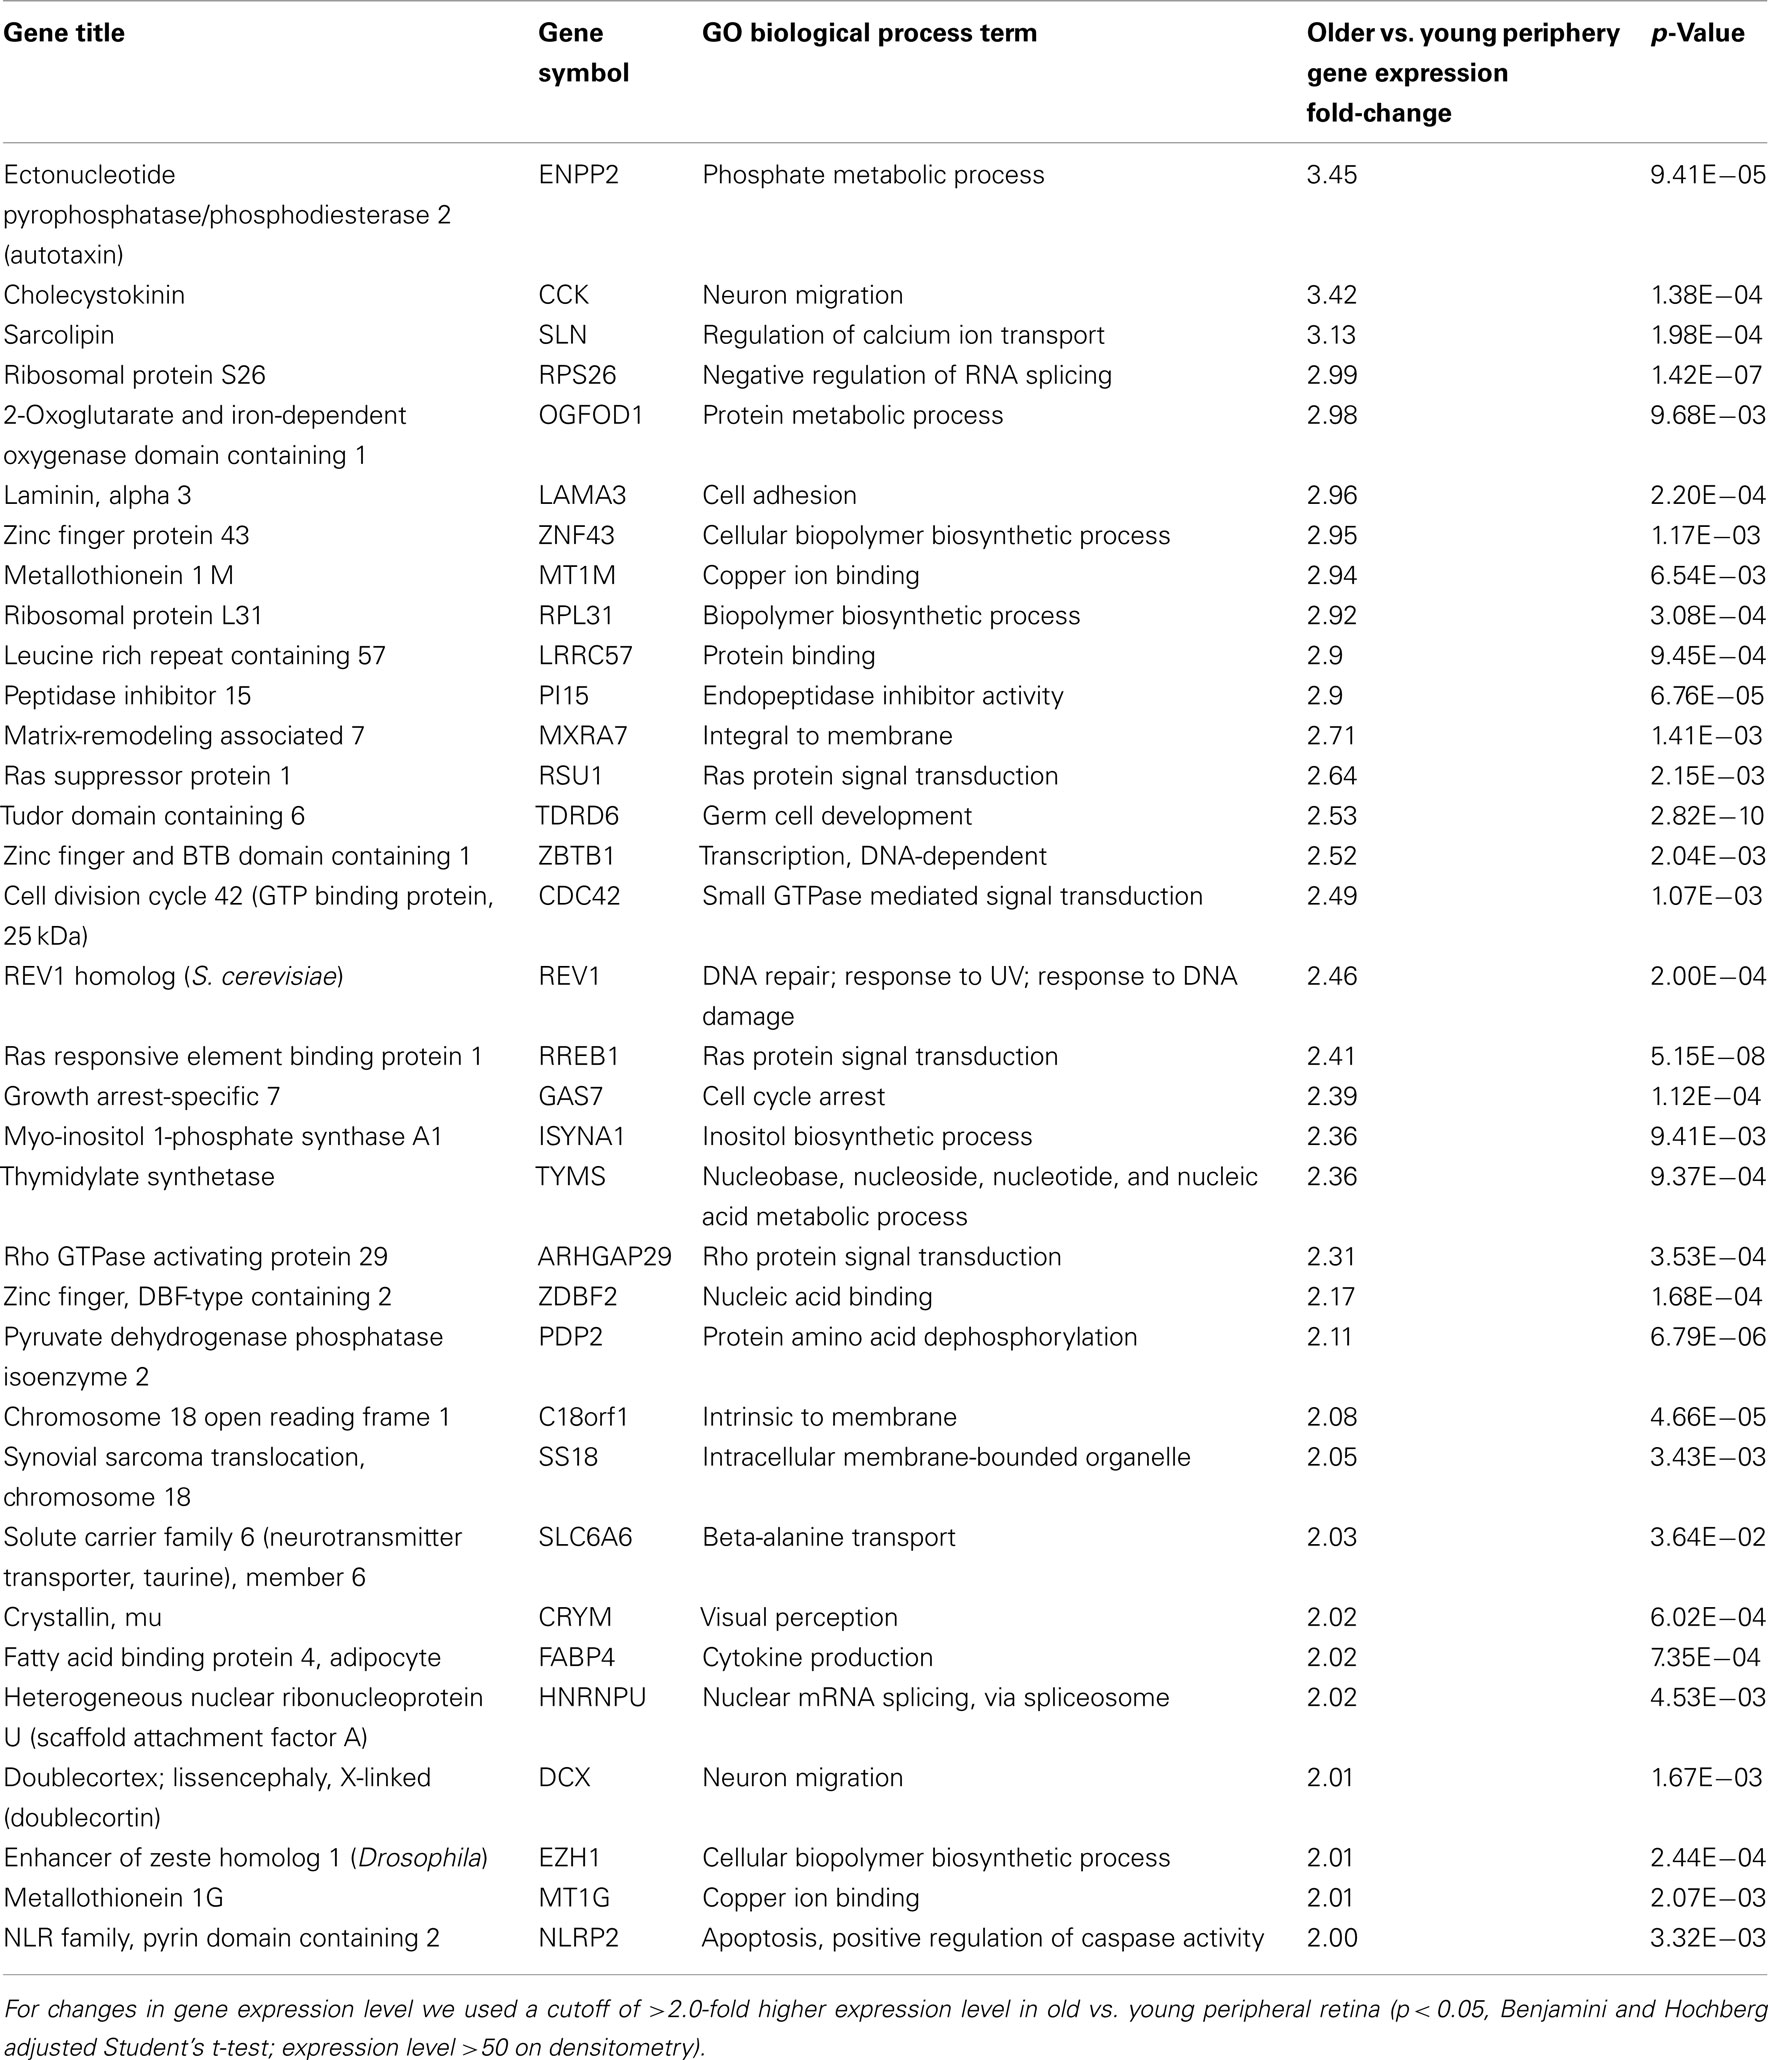
Table 8. Genes highly expressed in old compared to young peripheral retina.
Selective Quantitative RT-PCR
We then performed semi-quantitative RT-PCR on several selected genes that were altered in the microarray data that had played a role in retinal survival, cellular apoptosis, or were involved in the Wnt pathway. These genes code for the X-linked inhibitor of apoptosis (XAF1, Renwick et al., 2006), cadherin 8 (CDH8, Chen and Ma, 2007), protein tyrosine kinase-2 (PTK2, Finnemann, 2003), brain-derived neurotrophic factor (BDNF, Wilson et al., 2007), nuclear receptor co-repressor 2 (NCOR2, Tsai et al., 2004; Jepsen et al., 2007), chloride intracellular channel 4 (CLIC4, Chen et al., 2004), DKK1, FZD10, and SFRP2 (Robitaille et al., 2002; Kubo et al., 2003; Liu et al., 2007). In all cases, the changes in expression level detected with the microarray data are in the same direction (i.e., up or down) as the changes in expression level detected by qRT-PCR. There is reasonable agreement between the relative expression level of each of these genes when comparing younger vs. older samples as detected by microarray data and qRT-PCR (Table 2).
Discussion
We have used the Affymetrix DNA microarray chip U133 plus 2 to study the gene expression profile of the human retina as a function of age and topographic location (macula vs. peripheral retina). We were able to confirm the microarray findings with qRT-PCR of selected genes. There is some variation in the exact relative expression level between qRT-PCR and microarray data, but in every case, the relative expression levels using the microarray data and qRT-PCR were always in the same direction (Table 2).
We were able to detect the presence of approximately 26,700 out of 54,600 gene probes present on the Affymetrix Human Genome U133 plus 2 chip in all four groups; namely, young macula, young periphery, older macula, and older periphery. The number of gene probes that we detected in human retina is about 10,000 more than those reported in RNA extracted from human retinal ganglion cells (Kim et al., 2006). This was probably due to the fact that our samples contained multiple retinal cell types. A priori we reasoned that aging of the macula and/or periphery might increase either the number of genes expressed throughout the retina or the variation in the number of genes expressed in older peripheral vs. macular samples; however, there was no significant difference in the average number or standard deviation of the number of genes expressed in young vs. older macular or peripheral samples (data not shown).
Hierarchical clustering analysis is a statistical technique used to sort heterogeneous samples into several distinct groups that contain genes with similar expression patterns (Eisen et al., 1998; Krajewski and Bocianowski, 2002). Clustering analysis suggests that aging changes the expression profile more than the location of retina (macular vs. peripheral; Figure 4). To circumvent the possibility that the macula from a donor is simply clustering with the periphery from the same donor, this analysis was repeated with a smaller subset of eyes so that young macula and young peripheral samples were obtained from unrelated individuals, as were young and old peripheral samples. This did not alter the clustering pattern seen in Figure 4 (data not shown).
Previous authors have also sought to determine the retinal gene expression profile as a function of age in both macular and peripheral retina using smaller sample sizes (Yoshida et al., 2002; Hornan et al., 2007; Ben-Shlomo et al., 2008). Yoshida et al. developed gene expression profiles of young and elderly human retinas using microarray slides containing 2400 human genes that were primarily neuronal. More than 50% hybridized to the retinal cDNA targets. Northern blot analysis and qRT-PCR results confirmed the changes in expression in 8 of 10 genes examined, including an increase in IFN-responsive transcription factor subunit (ISGF3G), creatine kinase B (CKB), and pancreatic amylase (AMY2A), and a decrease in TGF-beta receptor interacting protein 1 (TRIP1), LPS-induced TNF-alpha factor (PIG7), alpha-1 (E)-catenin (CTNNA1), ubiquitin hydrolase (USP9X), GABA receptor beta-3 subunit (GABRB3), and alpha-1 Type VII collagen (COL7A1). Hornan et al. compared the expression profile of cone-rich macular vs. rod rich peripheral retina using 2–4 mm retinal punches from human retina, and demonstrated that macula transcripts were enriched for nuclear pore complex interacting protein (NPIP) and eukaryotic translation initiation factor 2 alpha kinase (GCN2), with these protein products being detected in cone outer segments. Ben-Shlomo et al. examined the gene expression profile over the first 20 weeks of life in rat retina dissected during the first 20 weeks of life at 2 different time points and identified 603 differentially expressed genes, which were grouped into six clusters based on changes in expression levels during the first 20 weeks of life. A bioinformatic analysis of these clusters revealed sets of genes encoding proteins with functions relevant to retinal maturation, such as potassium, sodium, calcium, and chloride channels, synaptic vesicle transport, and axonogenesis. Schippert et al. (2009) compared the expression profile of wild type and Egr-1 knockout mice, which have longer eyes and a more myopic refractive error compared to their wild-types. Changes in expression were confirmed in four genes by RT-PCR, including nuclear prelamin A recognition factor (Narf), oxoglutarate dehydrogenase (Ogdh), selenium binding protein 1 (Selenbp1), and Pcdhb9. Glenn et al. (2009) showed that glycation of the basement membrane causes a significant reduction in cathepsin-D activity in ARPE-19 (p < 0.05) and an increase in lipofuscin accumulation (p < 0.01). Chen et al. (2008) compared the transcriptional profiles of the RPE/choroid from young and old mice. There were 315 genes differentially expressed with age; most of these genes were related to immune responses and inflammatory activity. There was increased gene expression and protein levels of leukocyte attracting signal, chemokine ligand 2 (Ccl2) in aged RPE/choroid. These studies cover a wide range of conditions, including using different array chips, and comparing young vs. old, and macula vs. peripheral, in several species, including humans. Despite these differences, our data (Tables 3, 4, and 6) is consistent with prior published studies showing up-regulation of HNRPF (heterogeneous nuclear ribonucleoprotein F) and ENO3 (Muscle specific enolase) in older retina; (Yoshida et al., 2002) higher expression levels of RHO (rhodopsin) in periphery; and higher expression levels of HDAC9 (histone deacetylase 9) and SRGAP2 (Rho GTPase activating protein 2) in the macula (Hornan et al., 2007).
It is interesting to note that there are only 24 genes expressed at higher levels in the periphery vs. macular retina and 3 of these genes (namely, DKK1, FZD10, and SFRP2) encode for protein products that inhibit the Wnt receptor signaling pathway (Table 4). There are three major types of inhibitors of this pathway in Xenopus that have human homologs, including the secreted frizzled-related proteins (sFRPs; Melkonyan et al., 1997), Wnt-inhibitory factor-1 (WIF-1; Hsieh et al., 1999), and Dickkopf (DKK), which also includes four known human proteins DKK1–4 (Krupnik et al., 1999). Wnt ligands belong to a highly conserved family of oncogenes expressed in species ranging from the fruit fly to man (McMahon and Moon, 1989; Busse and Seguin, 1993; Magee, 1995). Wnt signaling controls many events during embryogenesis and exerts significant regulation of cell morphology, proliferation, motility, and cell fate (Parr and McMahon, 1994; Siegfried and Perrimon, 1994; Turnbull et al., 1995). Inappropriate activation of the Wnt signaling pathway has been observed in several human cancers (Spink et al., 2000). Inhibition of the Wnt pathway is correlated with preventing cells from moving into a regenerative state, and Wnt signaling is important in transdifferentiation of ciliary margin stem cells into neural retina at the ciliary marginal zone (Robitaille et al., 2002; Kubo et al., 2003; Liu et al., 2007). Addition of Wnt3a to cultures of ciliary margin cells increased the number of proliferating cells and allowed the cells to maintain their multilineage potential (Inoue et al., 2006; Liu et al., 2007). Wnt signaling may provide a therapeutic strategy for in vitro expansion or in vivo activation of adult retinal stem cells (Inoue et al., 2006; Liu et al., 2007). Our observation that DKK1, FZD10, and SFRP2 are expressed at higher levels in the peripheral retina than those in macular retina (Table 4) suggests that there is inhibition of the Wnt signaling pathway in the periphery compared to the macular human retina. A potential strategy for cell replacement in retinal disorders, including retinitis pigmentosa (Pruett, 1983; Smith et al., 2009), is to activate this pathway in the peripheral retina and ciliary marginal zone.
We were able to detect genes whose expression levels change with aging of the human neural retina, and many of these genes appear to be related to cell growth, proliferation, and survival. For instance, aging decreases the expression level of genes known to be important for retinal survival/protection such as X-linked inhibitor of apoptosis (XAF1), Cadherin (CDH8), PTK2 protein tyrosine kinase (PTK2), and BDNF. Aging increases the expression of genes related to aging and apoptosis, such as genes coding for the nuclear receptor co-repressor 2 (NCOR2) and chloride intracellular channel 4 (CLIC4; Tables 2, 5, and 6). These changes may explain the increasing susceptibility of the human retina to some diseases as patient age increases, such as AMD and glaucoma. Retinal aging is also associated with changes in expression of genes involved in the complement cascade; the relationship of altered expression of these genes to the development of age-related diseases such as AMD remains to be elucidated. Any individual change or combination of changes may be responsible for altering retinal gene expression (Cai et al., 2006; Han et al., 2007).
Our gene ontology analysis (Wu et al., 2006; Noel et al., 2007; Grigoryev et al., 2008) reveals genes whose expression levels change during retina aging are involved in cellular metabolism, regulation of the cell cycle, cell adhesion, and other biological pathways (Figure 5). Interestingly, up-regulated genes involved with cell growth were detected only within younger macula and peripheral retina (Figures 5A,C) but not in older macula and peripheral retina (Figures 5B,D).
We recognize that an intrinsic limitation of using human tissue is the potential RNA degradation that can occur between death and RNA isolation; in our view this limitation is counterbalanced by the fact that the value of data obtained from human retina cannot be replaced by other means. Several facts suggest that retinal RNA can be relatively stable between death and RNA isolation within the time frame we used. First, Malik et al. (2003) conducted an RNA stability study on neural retina and RPE and concluded that the RNA from neural retina was stable up to 48 h after death. In the current study we used a cutoff of 32 h for the death-to-RNA harvesting time, which is within the period of time that retinal RNA is stable. Although proteins and RNA degrade by different mechanisms, there is also tremendous stability of the retinal proteome after harvesting, as there was no significant time-dependent change in intensity for >95% of retinal proteins examined up to 48 h postmortem (Ethen et al., 2006). Second, we measured the relative intensity of the 28S and 18S RNA bands and demonstrated that there was no significant RNA degradation at the time of RNA isolation (data not shown). Third, we demonstrated that there is no significant degradation of the signal from housekeeping genes, as revealed by the stability of the hybridization signals from 3′, middle, and 5′ fragment of mRNA of housekeeping genes coded in the Affymetrix DNA chips (Figures 1 and 3). Fourth, we did not introduce any bias by handling younger and older tissue differently, as there is no correlation between donor age and either death-to-enucleation or death-to-RNA isolation time (Figure 2).
There are other potential limitations to our study. First, it is likely that there is significant patient-to-patient variation in gene expression profiling, particularly since our samples may include patients with normal eyes as well as patients with age-related disease or dysfunction. Second, we harvested full-thickness human retina for this analysis. Thus, mixed retinal cell types were present within our full-thickness retinal punches. Additional studies are necessary and planned to determine which cell(s) contribute to the changes in gene expression seen here. Third, there is incomplete correlation between the transcriptome and proteomics of many tissues (Hack, 2004; Baginsky et al., 2005; Cox et al., 2007; Fagan et al., 2007; Hesketh et al., 2007; Dihal et al., 2008). Additional studies are necessary to determine the effects of aging and topographic location on retinal proteomics. Fourth, our study does not consider the effects of aging and/or topographic location on post-translational protein modification; these effects have been shown to be significant in other ocular tissues, including lens (Takemoto and Gopalakrishnan, 1994). As with any other gene expression studies we cannot discern whether the gene expression changes that we observe are primary or secondary. Despite these limitations we have obtained important information on changes in the gene expression that occur in aging human retina. Additional studies are required to determine the role of specific alterations in the transcriptome in the pathogenesis of age-related ocular diseases such as AMD.
Conflict of Interest Statement
The authors declare that the research was conducted in the absence of any commercial or financial relationships that could be construed as a potential conflict of interest.
Acknowledgments
Supported by Research to Prevent Blindness, Robert L. Burch III Fund, Retina Society, and the Foundation Fighting Blindness.
References
Archer, K. J., and Guennel, T. (2006). An application for assessing quality of RNA hybridized to affymetrix GeneChips. Bioinformatics 22, 2699–2701.
Ashburner, M., Ball, C. A., Blake, J. A., Botstein, D., Butler, H., Cherry, J. M., Davis, A. P., Dolinski, K., Dwight, S. S., Eppig, J. T., Harris, M. A., Hill, D. P., Issel-Tarver, L., Kasarskis, A., Lewis, S., Matese, J. C., Richardson, J. E., Ringwald, M., Rubin, G. M., and Sherlock, G. (2000). Gene ontology: tool for the unification of biology. The Gene Ontology Consortium. Nat. Genet. 25, 25–29.
Baginsky, S., Kleffmann, T., Von Zychlinski, A., and Gruissem, W. (2005). Analysis of shotgun proteomics and RNA profiling data from Arabidopsis thaliana chloroplasts. J. Proteome Res. 4, 637–640.
Benjamini, Y., Drai, D., Elmer, G., Kafkafi, N., and Golani, I. (2001). Controlling the false discovery rate in behavior genetics research. Behav. Brain Res. 125, 279–284.
Ben-Shlomo, G., Ofri, R., Bandah, D., Rosner, M., and Sharon, D. (2008). Microarray-based gene expression analysis during retinal maturation of albino rats. Graefes Arch. Clin. Exp. Ophthalmol. 246, 693–702.
Busse, U., and Seguin, C. (1993). Molecular analysis of the Wnt-1 proto-oncogene in Ambystoma mexicanum (axolotl) embryos. Differentiation 53, 7–15.
Cai, H., and Del Priore, L. V. (2006). Bruch membrane aging alters the gene expression profile of human retinal pigment epithelium. Curr. Eye Res. 31, 181–189.
Cai, H., Shin, M. C., Tezel, T. H., Kaplan, H. J., and Del Priore, L. V. (2006). Use of iris pigment epithelium to replace retinal pigment epithelium in age-related macular degeneration: a gene expression analysis. Arch. Ophthalmol. 124, 1276–1285.
Chader, G. J. (2002). Animal models in research on retinal degenerations: past progress and future hope. Vision Res. 42, 393–399.
Chen, H., Liu, B., Lukas, T. J., and Neufeld, A. H. (2008). The aged retinal pigment epithelium/choroid: a potential substratum for the pathogenesis of age-related macular degeneration. PLoS ONE 3, e2339. doi:10.1371/journal.pone.0002339
Chen, H. J., and Ma, Z. Z. (2007). N-cadherin expression in a rat model of retinal detachment and reattachment. Invest. Ophthalmol. Vis. Sci. 48, 1832–1838.
Chen, L., Wu, W., Dentchev, T., Zeng, Y., Wang, J., Tsui, I., Tobias, J. W., Bennett, J., Baldwin, D., and Dunaief, J. L. (2004). Light damage induced changes in mouse retinal gene expression. Exp. Eye Res. 79, 239–247.
Chowers, I., Gunatilaka, T. L., Farkas, R. H., Qian, J., Hackam, A. S., Duh, E., Kageyama, M., Wang, C., Vora, A., Campochiaro, P. A., and Zack, D. J. (2003). Identification of novel genes preferentially expressed in the retina using a custom human retina cDNA microarray. Invest. Ophthalmol. Vis. Sci. 44, 3732–3741.
Cox, B., Kislinger, T., Wigle, D. A., Kannan, A., Brown, K., Okubo, T., Hogan, B., Jurisica, I., Frey, B., Rossant, J., and Emili, A. (2007). Integrated proteomic and transcriptomic profiling of mouse lung development and Nmyc target genes. Mol. Syst. Biol. 3, 109.
Del Priore, L. V., and Tezel, T. H. (1998). Reattachment rate of human retinal pigment epithelium to layers of human Bruch’s membrane. Arch. Ophthalmol. 116, 335–341.
Dihal, A. A., Van Der Woude, H., Hendriksen, P. J., Charif, H., Dekker, L. J., Ijsselstijn, L., De Boer, V. C., Alink, G. M., Burgers, P. C., Rietjens, I. M., Woutersen, R. A., and Stierum, R. H. (2008). Transcriptome and proteome profiling of colon mucosa from quercetin fed F344 rats point to tumor preventive mechanisms, increased mitochondrial fatty acid degradation and decreased glycolysis. Proteomics 8, 45–61.
Doniger, S. W., Salomonis, N., Dahlquist, K. D., Vranizan, K., Lawlor, S. C., and Conklin, B. R. (2003). MAPPFinder: using gene ontology and GenMAPP to create a global gene-expression profile from microarray data. Genome Biol. 4, R7.
Eisen, M. B., Spellman, P. T., Brown, P. O., and Botstein, D. (1998). Cluster analysis and display of genome-wide expression patterns. Proc. Natl. Acad. Sci. U.S.A. 95, 14863–14868.
Ethen, C. M., Reilly, C., Feng, X., Olsen, T. W., and Ferrington, D. A. (2006). The proteome of central and peripheral retina with progression of age-related macular degeneration. Invest. Ophthalmol. Vis. Sci. 47, 2280–2290.
Fagan, A., Culhane, A. C., and Higgins, D. G. (2007). A multivariate analysis approach to the integration of proteomic and gene expression data. Proteomics 7, 2162–2171.
Finnemann, S. C. (2003). Focal adhesion kinase signaling promotes phagocytosis of integrin-bound photoreceptors. EMBO J. 22, 4143–4154.
Glenn, J. V., Mahaffy, H., Wu, K., Smith, G., Nagai, R., Simpson, D. A., Boulton, M. E., and Stitt, A. W. (2009). Advanced glycation end product (AGE) accumulation on Bruch’s membrane: links to age-related RPE dysfunction. Invest. Ophthalmol. Vis. Sci. 50, 441–451.
Gong, J., Sagiv, O., Cai, H., Tsang, S. H., and Del Priore, L. V. (2008). Effects of extracellular matrix and neighboring cells on induction of human embryonic stem cells into retinal or retinal pigment epithelial progenitors. Exp. Eye Res. 86, 957–965.
Grigoryev, D. N., Mathai, S. C., Fisher, M. R., Girgis, R. E., Zaiman, A. L., Housten-Harris, T., Cheadle, C., Gao, L., Hummers, L. K., Champion, H. C., Garcia, J. G., Wigley, F. M., Tuder, R. M., Barnes, K. C., and Hassoun, P. M. (2008). Identification of candidate genes in scleroderma-related pulmonary arterial hypertension. Transl. Res. 151, 197–207.
Hack, C. J. (2004). Integrated transcriptome and proteome data: the challenges ahead. Brief. Funct. Genomic. Proteomic. 3, 212–219.
Han, M., Giese, G., Schmitz-Valckenberg, S., Bindewald-Wittich, A., Holz, F. G., Yu, J., Bille, J. F., and Niemz, M. H. (2007). Age-related structural abnormalities in the human retina-choroid complex revealed by two-photon excited autofluorescence imaging. J. Biomed. Opt. 12, 024012.
Hesketh, A., Bucca, G., Laing, E., Flett, F., Hotchkiss, G., Smith, C. P., and Chater, K. F. (2007). New pleiotropic effects of eliminating a rare tRNA from Streptomyces coelicolor, revealed by combined proteomic and transcriptomic analysis of liquid cultures. BMC Genomics 8, 261. doi:10.1186/1471-2164-8-261
Hollborn, M., Tenckhoff, S., Jahn, K., Iandiev, I., Biedermann, B., Schnurrbusch, U. E., Limb, G. A., Reichenbach, A., Wolf, S., Wiedemann, P., Kohen, L., and Bringmann, A. (2005). Changes in retinal gene expression in proliferative vitreoretinopathy: glial cell expression of HB-EGF. Mol. Vis. 11, 397–413.
Hornan, D. M., Peirson, S. N., Hardcastle, A. J., Molday, R. S., Cheetham, M. E., and Webster, A. R. (2007). Novel retinal and cone photoreceptor transcripts revealed by human macular expression profiling. Invest. Ophthalmol. Vis. Sci. 48, 5388–5396.
Hsieh, J. C., Kodjabachian, L., Rebbert, M. L., Rattner, A., Smallwood, P. M., Samos, C. H., Nusse, R., Dawid, I. B., and Nathans, J. (1999). A new secreted protein that binds to Wnt proteins and inhibits their activities. Nature 398, 431–436.
Hubbell, E., Liu, W. M., and Mei, R. (2002). Robust estimators for expression analysis. Bioinformatics 18, 1585–1592.
Inoue, T., Kagawa, T., Fukushima, M., Shimizu, T., Yoshinaga, Y., Takada, S., Tanihara, H., and Taga, T. (2006). Activation of canonical Wnt pathway promotes proliferation of retinal stem cells derived from adult mouse ciliary margin. Stem Cells 24, 95–104.
Jepsen, K., Solum, D., Zhou, T., Mcevilly, R. J., Kim, H. J., Glass, C. K., Hermanson, O., and Rosenfeld, M. G. (2007). SMRT-mediated repression of an H3K27 demethylase in progression from neural stem cell to neuron. Nature 450, 415–419.
Kim, C. Y., Kuehn, M. H., Clark, A. F., and Kwon, Y. H. (2006). Gene expression profile of the adult human retinal ganglion cell layer. Mol. Vis. 12, 1640–1648.
Krajewski, P., and Bocianowski, J. (2002). Statistical methods for microarray assays. J. Appl. Genet. 43, 269–278.
Krupnik, V. E., Sharp, J. D., Jiang, C., Robison, K., Chickering, T. W., Amaravadi, L., Brown, D. E., Guyot, D., Mays, G., Leiby, K., Chang, B., Duong, T., Goodearl, A. D., Gearing, D. P., Sokol, S. Y., and Mccarthy, S. A. (1999). Functional and structural diversity of the human Dickkopf gene family. Gene 238, 301–313.
Kubo, F., Takeichi, M., and Nakagawa, S. (2003). Wnt2b controls retinal cell differentiation at the ciliary marginal zone. Development 130, 587–598.
Kurji, K. H., Cui, J. Z., Lin, T., Harriman, D., Prasad, S. S., Kojic, L., and Matsubara, J. A. (2009). Microarray analysis identifies changes in inflammatory gene expression in response to amyloid-beta stimulation of cultured human retinal pigment epithelial cells. Invest. Ophthalmol. Vis. Sci. 51, 1151–1163.
Liu, H., Xu, S., Wang, Y., Mazerolle, C., Thurig, S., Coles, B. L., Ren, J. C., Taketo, M. M., Van Der Kooy, D., and Wallace, V. A. (2007). Ciliary margin transdifferentiation from neural retina is controlled by canonical Wnt signaling. Dev. Biol. 308, 54–67.
Magee, A. I. (1995). Cell adhesion molecules and intracellular signalling: from fly to man. Cell. Signal. 7, 165–170.
Malik, K. J., Chen, C. D., and Olsen, T. W. (2003). Stability of RNA from the retina and retinal pigment epithelium in a porcine model simulating human eye bank conditions. Invest. Ophthalmol. Vis. Sci. 44, 2730–2735.
McMahon, A. P., and Moon, R. T. (1989). int-1 – a proto-oncogene involved in cell signalling. Development 107 (Suppl.), 161–167.
Melkonyan, H. S., Chang, W. C., Shapiro, J. P., Mahadevappa, M., Fitzpatrick, P. A., Kiefer, M. C., Tomei, L. D., and Umansky, S. R. (1997). SARPs: a family of secreted apoptosis-related proteins. Proc. Natl. Acad. Sci. U.S.A. 94, 13636–13641.
Nag, T. C., Wadhwa, S., and Chaudhury, S. (2006). The occurrence of cone inclusions in the ageing human retina and their possible effect upon vision: an electron microscope study. Brain Res. Bull. 71, 224–232.
Noel, S., Sharma, S., Shanker, R., and Rath, S. K. (2007). Primaquine-induced differential gene expression analysis in mice liver using DNA microarrays. Toxicology 239, 96–107.
Parr, B. A., and McMahon, A. P. (1994). Wnt genes and vertebrate development. Curr. Opin. Genet. Dev. 4, 523–528.
Pruett, R. C. (1983). Retinitis pigmentosa: clinical observations and correlations. Trans. Am. Ophthalmol. Soc. 81, 693–735.
Radeke, M. J., Peterson, K. E., Johnson, L. V., and Anderson, D. H. (2007). Disease susceptibility of the human macula: differential gene transcription in the retinal pigmented epithelium/choroid. Exp. Eye Res. 85, 366–380.
Renwick, J., Narang, M. A., Coupland, S. G., Xuan, J. Y., Baker, A. N., Brousseau, J., Petrin, D., Munger, R., Leonard, B. C., Hauswirth, W. W., Korneluk, R. G., and Tsilfidis, C. (2006). XIAP-mediated neuroprotection in retinal ischemia. Gene Ther. 13, 339–347.
Robitaille, J., Macdonald, M. L., Kaykas, A., Sheldahl, L. C., Zeisler, J., Dube, M. P., Zhang, L. H., Singaraja, R. R., Guernsey, D. L., Zheng, B., Siebert, L. F., Hoskin-Mott, A., Trese, M. T., Pimstone, S. N., Shastry, B. S., Moon, R. T., Hayden, M. R., Goldberg, Y. P., and Samuels, M. E. (2002). Mutant frizzled-4 disrupts retinal angiogenesis in familial exudative vitreoretinopathy. Nat. Genet. 32, 326–330.
Schippert, R., Schaeffel, F., and Feldkaemper, M. P. (2009). Microarray analysis of retinal gene expression in Egr-1 knockout mice. Mol. Vis. 15, 2720–2739.
Siegfried, E., and Perrimon, N. (1994). Drosophila wingless: a paradigm for the function and mechanism of Wnt signaling. Bioessays 16, 395–404.
Smith, A. J., Bainbridge, J. W., and Ali, R. R. (2009). Prospects for retinal gene replacement therapy. Trends Genet. 25, 156–165.
Spink, K. E., Polakis, P., and Weis, W. I. (2000). Structural basis of the Axin-adenomatous polyposis coli interaction. EMBO J. 19, 2270–2279.
Spraul, C. W., Lang, G. E., Grossniklaus, H. E., and Lang, G. K. (1999). Histologic and morphometric analysis of the choroid, Bruch’s membrane, and retinal pigment epithelium in postmortem eyes with age-related macular degeneration and histologic examination of surgically excised choroidal neovascular membranes. Surv. Ophthalmol. 44 (Suppl. 1), S10–S32.
Stadler, Z. K., and Come, S. E. (2009). Review of gene-expression profiling and its clinical use in breast cancer. Crit. Rev. Oncol. Hematol. 69, 1–11.
Takemoto, L., and Gopalakrishnan, S. (1994). Alpha-A crystallin: quantitation of C-terminal modification during lens aging. Curr. Eye Res. 13, 879–883.
Tsai, C. C., Kao, H. Y., Mitzutani, A., Banayo, E., Rajan, H., Mckeown, M., and Evans, R. M. (2004). Ataxin 1, a SCA1 neurodegenerative disorder protein, is functionally linked to the silencing mediator of retinoid and thyroid hormone receptors. Proc. Natl. Acad. Sci. U.S.A. 101, 4047–4052.
Turnbull, D. H., Bloomfield, T. S., Baldwin, H. S., Foster, F. S., and Joyner, A. L. (1995). Ultrasound backscatter microscope analysis of early mouse embryonic brain development. Proc. Natl. Acad. Sci. U.S.A. 92, 2239–2243.
van Soest, S. S., De Wit, G. M., Essing, A. H., Ten Brink, J. B., Kamphuis, W., De Jong, P. T., and Bergen, A. A. (2007). Comparison of human retinal pigment epithelium gene expression in macula and periphery highlights potential topographic differences in Bruch’s membrane. Mol. Vis. 13, 1608–1617.
Wilson, R. B., Kunchithapautham, K., and Rohrer, B. (2007). Paradoxical role of BDNF: BDNF± retinas are protected against light damage-mediated stress. Invest. Ophthalmol. Vis. Sci. 48, 2877–2886.
Wistow, G., Bernstein, S. L., Wyatt, M. K., Ray, S., Behal, A., Touchman, J. W., Bouffard, G., Smith, D., and Peterson, K. (2002). Expressed sequence tag analysis of human retina for the NEIBank project: retbindin, an abundant, novel retinal cDNA and alternative splicing of other retina-preferred gene transcripts. Mol. Vis. 8, 196–204.
Wu, X., Zhu, L., Guo, J., Zhang, D. Y., and Lin, K. (2006). Prediction of yeast protein-protein interaction network: insights from the gene ontology and annotations. Nucleic Acids Res. 34, 2137–2150.
Ye, Y., Lukinova, N., and Fortini, M. E. (1999). Neurogenic phenotypes and altered notch processing in Drosophila presenilin mutants. Nature 398, 525–529.
Keywords: human retina, macula, peripheral, aging, DNA microarray, gene expression, Wnt signaling pathway
Citation: Cai H, Fields MA, Hoshino R and Priore LV (2012) Effects of aging and anatomic location on gene expression in human retina. Front. Ag. Neurosci 4:8. doi: 10.3389/fnagi.2012.00008
Received: 08 June 2011; Accepted: 10 May 2012;
Published online: 31 May 2012.
Edited by:
Dafin F. Muresanu, University of Medicine and Pharmacy “Iuliu Hatieganu,” RomaniaReviewed by:
Hari S. Sharma, Uppsala University, SwedenDaniel Ortuño-Sahagun, Centro Universitario de Ciencias Biológicas y Agropecuarias, Mexico
Federico Antonio, University of Siena, Italy
Copyright: © 2012 Cai, Fields, Hoshino and Priore. This is an open-access article distributed under the terms of the Creative Commons Attribution Non Commercial License, which permits non-commercial use, distribution, and reproduction in other forums, provided the original authors and source are credited.
*Correspondence: Lucian V. Del Priore, Department of Ophthalmology, Harkness Eye Institute, Columbia University, 635 West 165th Street, New York, NY, USA.