 Sandra E. Hasmann1,2*
 Daniela Berg1,2Markus A. Hobert1,2David Weiss1,2Ulrich Lindemann3
 Johannes Streffer4Inga Liepelt-Scarfone1,2†
 Walter Maetzler1,2*†
- 1Department of Neurodegenerative Diseases, Center for Neurology, Hertie Institute for Clinical Brain Research, University of Tübingen, Tübingen, Germany
- 2German Center for Neurodegenerative Diseases (DZNE), Tübingen, Germany
- 3Department of Clinical Gerontology and Rehabilitation, Robert-Bosch-Hospital, Stuttgart, Germany
- 4Janssen Research and Development, Janssen-Pharmaceutical Companies of Johnson and Johnson, Beerse, Belgium
The functional reach (FR) test as a complex measure of balance including limits of stability has been proven to differentiate between patients with Parkinson’s disease (PD) and controls (CO). Recently, it has been shown that the instrumentation of the FR (iFR) with a wearable sensor may increase this diagnostic accuracy. This cross-sectional study aimed at investigating whether the iFR has the potential to differentiate individuals with high risk for PD (HRPD) from CO, as the delineation of such individuals would allow for, e.g., early neuromodulation. Thirteen PD patients, 13 CO, and 31 HRPD were investigated. HRPD was defined by presence of an enlarged area of hyperechogenicity in the mesencephalon on transcranial sonography and either one motor sign or two risk and prodromal markers of PD. All participants were asked to reach with their right arm forward as far as possible and hold this position for 10 s. During this period, sway parameters were assessed with an accelerometer (Dynaport, McRoberts) worn at the lower back. Extracted parameters that differed significantly between PD patients and CO in our cohort [FR distance (shorter in PD), anterior–posterior and mediolateral acceleration (both lower in PD)] as well as JERK, which has been shown to differentiate HRPD from CO and PD in a previous study, were included in a model, which was then used to differentiate HRPD from CO. The model yielded an area under the curve of 0.77, with a specificity of 85%, and a sensitivity of 74%. These results suggest that the iFR can contribute to an assessment panel focusing on the definition of HRPD individuals.
Introduction
There is a great need for biomarkers in the prodromal phase of Parkinson’s disease (PD) because valid definitions of this phase, and its progression would open entirely new opportunities for treatment and even prevention of neurodegeneration (Postuma et al., 2012a; Berg and Bandmann, 2013; Wang et al., 2013; Lerche et al., 2014). Motor parameters seem to be particularly promising for this purpose as subtle motor changes in individuals at high risk for PD (HRPD) may occur several years before clinical diagnosis can be made. This has been shown for distal (Gaenslen et al., 2011; Postuma et al., 2012b) as well as for axial motor symptoms such as gait and balance (Mirelman et al., 2011; Maetzler and Hausdorff, 2012; Maetzler et al., 2012). Particularly, the latter studies (Mirelman et al., 2011; Maetzler et al., 2012) indicated that challenging test situations may be more effective in delineating subtle motor deficits in this prodromal phase, than do non-challenging test situations. More specifically, we could recently demonstrate that HRPD individuals show, under challenging static balance conditions, a higher variability of trunk acceleration and a lower smoothness of sway (indicated by higher JERKs) in both anterior–posterior (AP) and mediolateral (ML) direction, compared to both controls (CO) and PD.
The limit of stability is a dimension of the postural control system, which reflects the maximum displacement of the body’s center of mass over a fixed base of support of the feet without losing balance (Horak et al., 2005). The functional reach (FR) test enables to determine this limit of stability in the AP direction, by reaching forward during quiet standing (Duncan et al., 1990). A good and practical definition of the FR is the greatest distance in any direction a person can reach out from a midline verticale position without falling or stepping. Thus, the FR is an operationalization of “the self-perceived limits of stability” (Mancini et al., 2008). The FR has been shown to differentiate older fallers from non-fallers (Duncan et al., 1992; Huang et al., 1998; Almeida et al., 2012), and the FR distance is a useful outcome parameter for fall prevention programs and progressive strength training (Sousa and Sampaio, 2005; Lin et al., 2007). Importantly, the test has also been shown to discriminate between PD patients and CO. One study (Smithson et al., 1998) found that PD patients have a shorter FR distance (~4 cm) than CO, which has been confirmed by another study (Mancini et al., 2008). Recently, first data about an instrumented FR (iFR) using a wearable sensor during the task have been presented (Cattabriga et al., 2013). The data indicate that the approach is feasible, and may improve diagnostic accuracy of PD.
Comparing HRPD individuals with PD patients has its weaknesses, in particular, in experiments that test dysfunction and compensation mechanisms in parallel, and these mechanisms are difficult to disentangle. A particular strength of the analysis of an iFR can be the consideration of two components: distance (how far someone can reach) and behavior (how does someone “behave” at her/his self-perceived limit). The further a study participant reaches due to motivation issues (sensorimotor integration), the better is the distance value but the worse are the sway parameters, and vice versa. Moreover, we included the parameters shown previously to be different in HRPD and CO (Maetzler et al., 2012) in our model, especially because previous data suggests a U-shaped progress of some parameters from CO over HRPD, to PD. A U-shaped process can contain compensatory and/or adaptation mechanism, as well as hidden pathophysiological aspects.
To our knowledge, there is no study available yet on changes of stability limits in prodromal PD. As already stated, subtle motor changes can be detected with quantitative assessment tools before the clinical diagnosis can be made (Yang et al., 2008; Mirelman et al., 2011; Maetzler and Hausdorff, 2012; Maetzler et al., 2012). Limits of stability are reduced in PD (Rossi et al., 2009; Menant et al., 2011) and can be found even in early untreated disease stages (Mancini et al., 2012). Thus, we were interested whether we could detect differences between PD and CO in challenging limits of stability paradigm (Duncan et al., 1990; Kamata et al., 2007).
Moreover, based on these assumptions and our previous results we were interested in the potential of the iFR to differentiate between HRPD individuals and CO.
Materials and Methods
Ethics
The ethical committee of the Medical Faculty of Tuebingen approved the study protocol and written informed consent was sought from all participants (Liepelt-Scarfone et al., 2013).
Individuals
In this cross-sectional study, 13 PD patients, 13 CO, and 31 HRPD individuals were included. The study presented here is part of the observational PMMP study on HRPD individuals, for details we refer to Maetzler et al. (2012), Liepelt-Scarfone et al. (2013), Louter et al. (2014). In brief, PMMP stands for “progression markers in the premotor phase” of PD, which is a prospective longitudinal 2-year study. The aim of the study is to monitor the progression of the disease until the development of (subtle) motor changes in older adults with risk factors for PD. All HRPD had an enlarged area of hyperechogenicity of the substantia nigra on transcranial sonography (>0.19 cm2 on at least one side). The enlarged area of hyperechogenicity in the mesencephalon is one of the most relevant risk factors for future PD in individuals older than 50 years (Berg et al., 2011). Additionally, either one cardinal motor sign of PD (slight bradykinesia, rigidity, tremor, postural instability) assessed by the unified Parkinson disease rating scale motor part (UPDRS-III), or two of a set of well-established risk and prodromal markers: positive family history, one-sided reduced arm swing, history of depression, and hyposmia (<75% correct answers in the identification test of the Sniffin’ Sticks) have to be present. PD diagnosis was excluded for HRPD and CO by clinical investigation. We decided to include individuals with a combination of markers as the accumulation of risk/prodromal factors in an individual increases the risk of getting PD at least linearly (Liepelt et al., 2011; Ross et al., 2012; Siderowf et al., 2012). Demographics and clinical characteristics are illustrated for the three groups (Table 1).
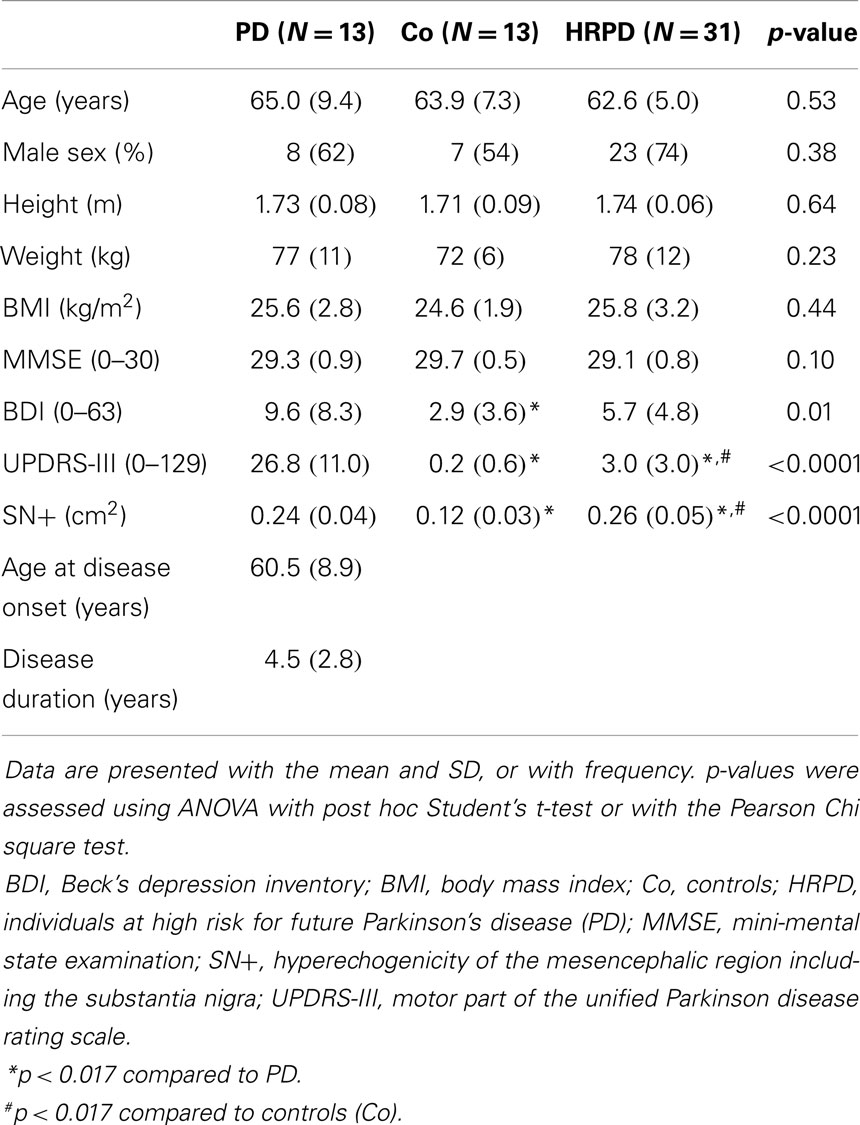
Table 1. Demographics and clinical parameters.
Functional Reach Test and Extraction of Quantitative Data
All participants stood upright in narrow stance, the right arm reaching out without bending forward. The start and end positions were assessed with a metal rod, which was movable and included a tapeline. The participants were instructed to touch a small plate at the end of the rod with their right fingertip, to push the plate forward as far as possible, and then to hold this position for 10 s without performing a compensation step (Figure 1). Then the participants moved back to the initial position. The FR distance was measured in centimeters. During the assessment, all study participants wore an accelerometer (Dynaport Hybrid®, McRoberts, The Hague, The Netherlands) at the lower back.
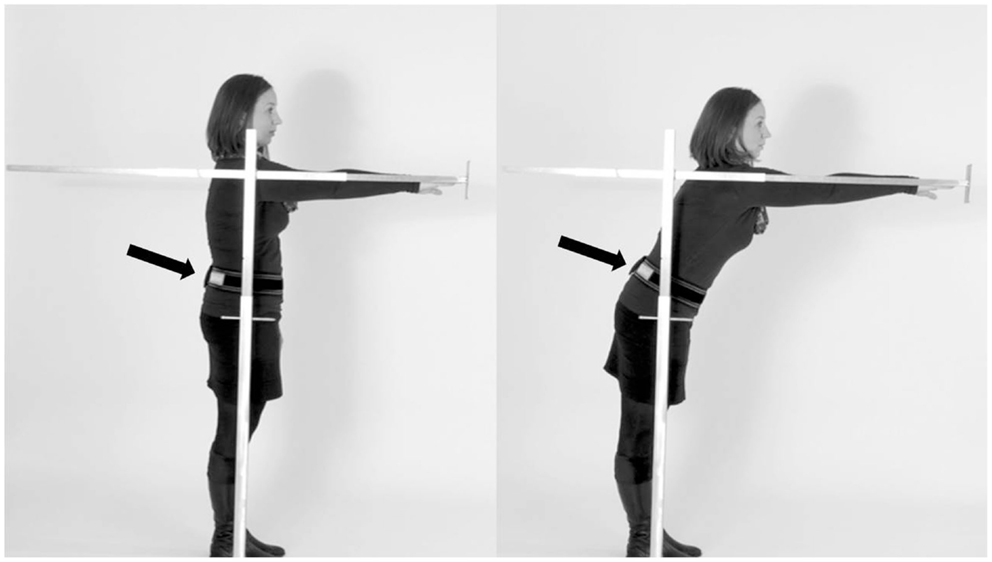
Figure 1. Performance of the instrumented functional reach test (SEH). Participants were asked to stand upright (A), reach forward as far as possible by pushing the rod, and then to hold the position for 10 s (B). The sensor was worn at the lower back (arrow).
Only sensor data from the maximal forward reach phase – in which individuals had to hold the determined position – were extracted and analyzed. We did not quantify the transition phase, which has previously also been shown to be associated with fall risk (Cattabriga et al., 2013).
Statistics
Statistical analyses were performed with JMP 10.0, SAS. Demographic and clinical data are presented with mean and SD, or with frequency. p-Values were calculated using Student’s t-test, ANOVA, or Pearson’s Chi square test (Table 1). Quantitative FR parameters were compared between PD patients and CO using Student’s t-test after testing for normal distribution. Non-normally distributed parameters (JERK AP and ML) were log-transformed before analysis. Parameters that reached a p-value below 0.05 were included in a logistic regression model. Sensitivity and specificity in differentiating HRPD to CO was calculated by ROC-analysis. The additional value of inclusion of parameters was confirmed by an increase of r2 (Table 3). Second, another regression model was calculated, which additionally included JERK in the AP and ML direction. These parameters have been shown to differentiate HRPD from CO and PD in a U-shaped manner (Maetzler et al., 2012), and may thus be overlooked by the above explorative model, which assumes linear changes of parameters in the disease course.
Results
Characteristics of the Cohorts
Differences in age, gender, weight, height, and MMSE score did not reach significance among the investigated cohorts (Table 1). PD patients had significantly higher UPDRS and BDI (p < 0.017) scores, indicating more severe motor problems and depressive symptoms, than both CO and HRPD. Probably due to the inclusion criteria (see above), CO had lower UPDRS values than HRPD individuals. Both PD and HRPD individuals had comparable echogenicity of the substantia nigra (SN+) values, which were both, as a mean, significantly larger than those of CO (p < 0.017, Table 1).
Quantitative FR Analysis between PD Patients and Controls
All individuals were able to perform the trial correctly within the first trial. PD patients differed from CO in the following parameters: FR distance (p = 0.03), AP acceleration (p = 0.04), and ML acceleration (p = 0.03, Figure 2). No significant differences could be detected for the following parameters: area of sway, velocity (AP and ML), JERK (AP and ML), and mean power frequency (p > 0.05, Table 2).
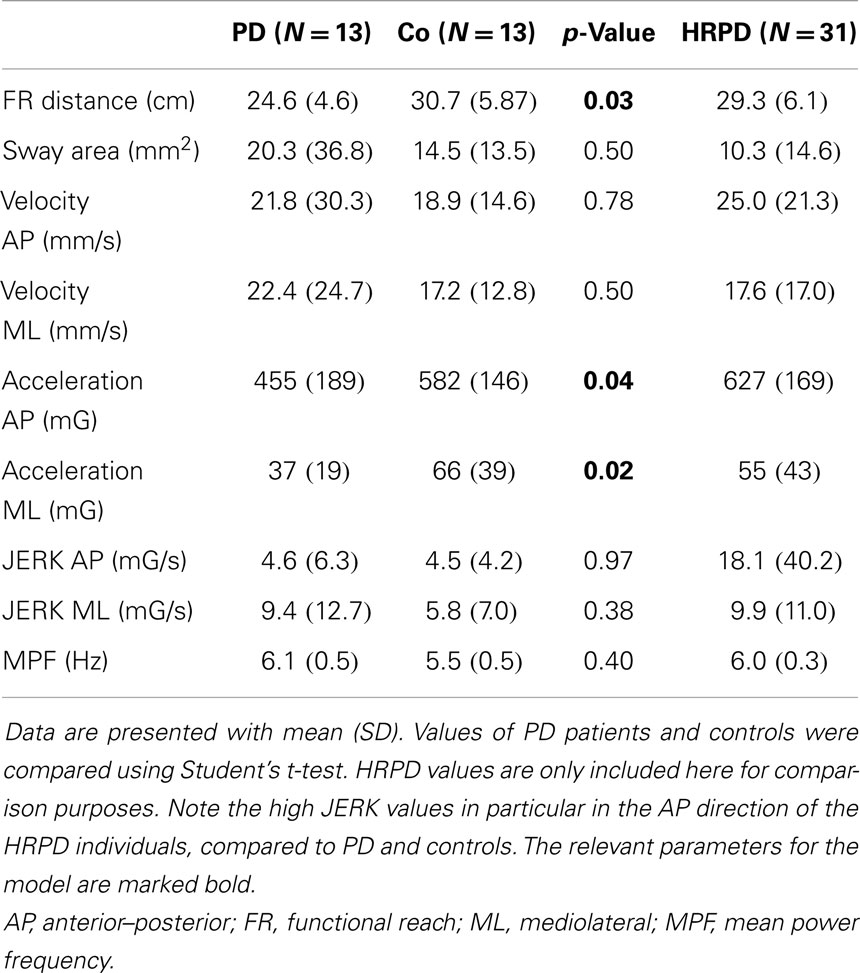
Table 2. Quantitative functional reach (FR) parameters of patients with Parkinson’s disease (PD), controls (Co), and individuals with high risk for PD (HRPD).
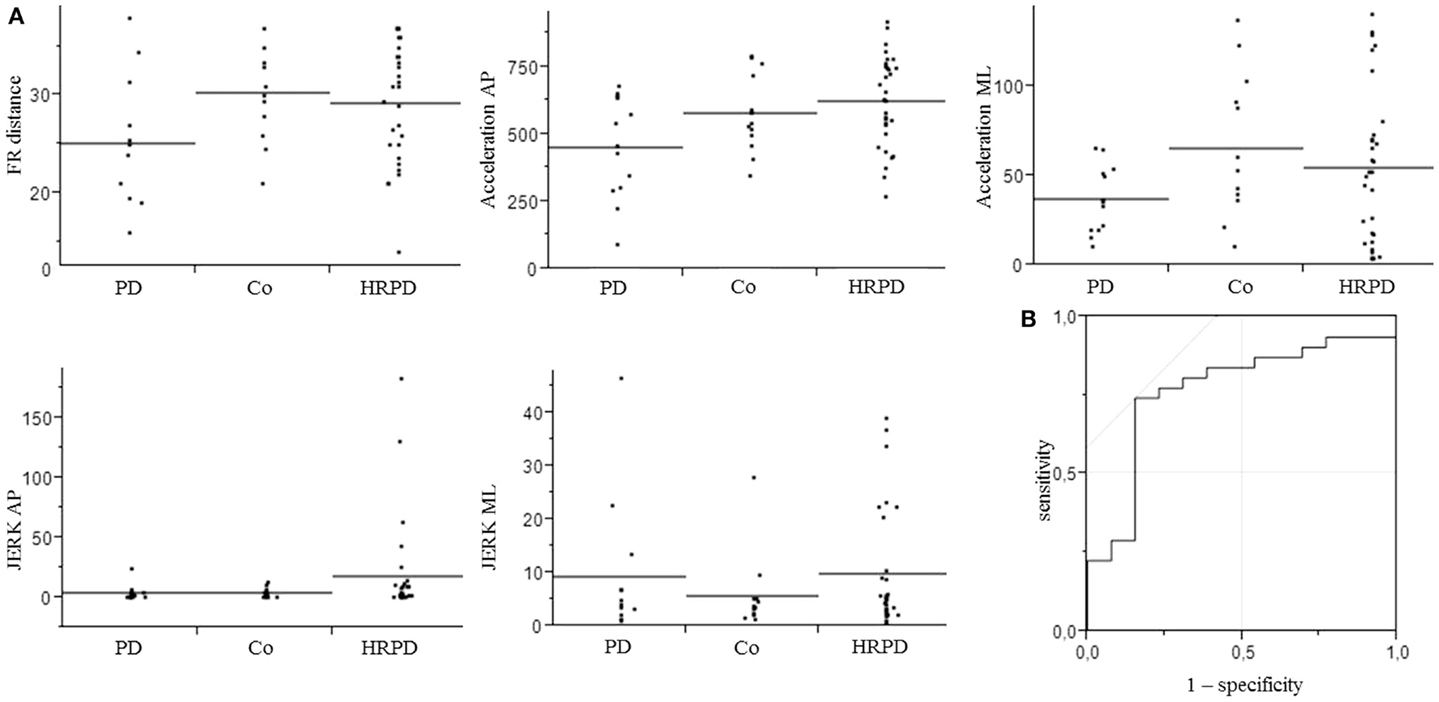
Figure 2. Parameters included in the model for the differentiation of controls from individuals with high risk for Parkinson’s disease (A), which yielded an area under the curve (AUC) of 0.77, with a specificity of 85%, and a sensitivity of 74% (B). AP, anterior–posterior.
Model-Based Approach to Differentiate HRPD from Controls
The three above-mentioned parameters that differed significantly between PD patients and CO were included in a model to test their utility to differentiate HRPD from CO. The inclusion of these parameters yielded an AUC of 0.70, with a specificity of 70%, and a sensitivity of 77%. The additional inclusion of the JERK parameters in the AP and ML direction improved the AUC to 0.77 and the specificity to 85%, without relevantly affecting sensitivity (74%). AUC as well as specificity and sensitivity values of different models were calculated (Table 3).
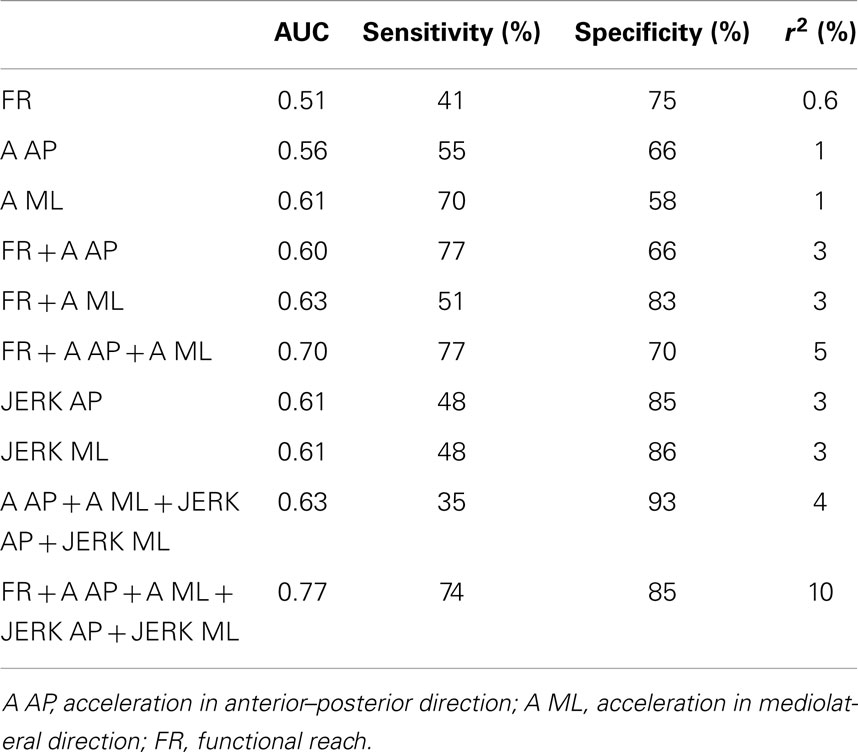
Table 3. Area under the curve (AUC), sensitivity, and specificity, as well as r2 of combinations of parameters, which have been found to be significantly different between patients with Parkinson’s disease (PD) and controls, and which have previously shown to be altered in individuals with high risk for future PD (HRPD) (Maetzler et al., 2012), for the discrimination of HRPD from controls.
Discussion
The main finding of this study is that a combination of markers extracted out of an iFR assessment differentiates HRPD from CO with fair accuracy, sensitivity, and specificity. Our observations basically confirm findings from previous studies investigating (subtle) motor deficits in HRPD individuals (Gaenslen et al., 2011; Mirelman et al., 2011; Maetzler and Hausdorff, 2012; Maetzler et al., 2012; Postuma et al., 2012a). The results support the idea that challenging motor tasks may have a particularly high potential to discover those individuals who eventually convert to PD.
The three parameters of the iFR, which separated PD from CO and also reached a satisfactory discrimination between HRPD and CO, fit well with the currently existing biomechanical picture(s) of PD. As discussed in the Section “Introduction” (Smithson et al., 1998; Mancini et al., 2008) and also shown in this study, PD patients yielded shorter FR distances than did age-matched CO. This is in agreement with the previously described reduced maximum balance range of PD patients detectable even in early PD stages (Horak et al., 2005; Menant et al., 2011). The reduced mean AP and ML accelerations observed during the FR in PD patients compared to CO may be best explained by the following symptoms/reasons. First, PD patients suffer from an increased muscle tone and hypokinesia, leading to reduced compensatory motor response. Second, reduced acceleration in the AP direction of the PD patients compared to CO may also be due to a difference of general sway strategy. Healthy older adults prefer an ankle strategy, which mainly influences parameters in the AP direction (Runge et al., 1999; Horak et al., 2005; Colnat-Coulbois et al., 2011), whereas PD patients rather prefer a hip strategy, which has lower influence on AP parameters (Horak et al., 2005). Moreover, the reduced AP acceleration observed in the PD patients may – at least partly – be explained by the known undershooting of reaching to targets typically associated with PD (Demirci et al., 1997).
We found that a panel of parameters of the iFR separated HRPD better from CO than any single parameter. This observation suggests that not a single parameter but rather a network including a number of associated parameters is affected in the HRPD individuals (Maetzler et al., 2013). From a “biomarker” point of view, the consideration of a panel of parameters rather than a single parameter within a network may increase the usefulness of a model to delineate individuals of interest. This has been suggested and investigated in studies differentiating PD from CO using biomechanical (van der Kooij et al., 2007; Zijlstra et al., 2012; Maetzler et al., 2013; Schoneburg et al., 2013) and biochemical approaches (Bogdanov et al., 2008; Morgan et al., 2010; Farooqui and Farooqui, 2011; Shi et al., 2011; Mielke et al., 2013; Reeve et al., 2013; Subramaniam and Chesselet, 2013; Mielke and Maetzler, 2014; Park et al., 2014). The most-often mentioned advantage of such model-based approaches is the consideration of compensation mechanisms, which certainly play an important role in chronic and progressive diseases such as PD (Maetzler et al., 2013). In our particular situation investigating HRPD individuals with a motivation-dependent task, the model-based approach has an additional advantage: this approach can account for different strategies to perform the task. For example, if a HRPD individual is highly motivated and choses to reach as far as possible, the FR distance may be control-like, however, correction mechanisms will be maximally challenged. This will be reflected by changes in the acceleration (and JERK) parameters included in the model. If the individual decides to take a low risk to fail, the FR distance will be PD-like, however, the acceleration parameters will not be specifically altered. In this particular study, a model considering the parameters relevant for such a scenario enabled us to approach a very good specificity.
A further important observation of this study is that consideration of U-shaped progress of certain balance parameters as previously suggested for a static balance paradigm (Maetzler et al., 2012) increases the accuracy to differentiate HRPD individuals from CO also when testing the limit of stability (i.e., JERK parameters, see Figure 2). Ultimately, by combining quantitative FR parameters, which show either a linear, or a non-linear U-shaped or inversed change from normal to PD, our model yielded a fair accuracy, specificity, and sensitivity to differentiate HRPD from CO.
The study faces some limitations. First, it used a cross-sectional design and did not (yet) validate its findings by inclusion of PD converters. A further limitation of the method is that, although AUC values are fair in differentiating HRPD from CO, the combination of parameters from the iFR explain only a minority of the difference between the groups (Table 3).
However, we follow the study participants longitudinally and will thus have the opportunity to test our results in the future. We feel that these cross-sectional data are still an important contribution to the field, because they may justify the inclusion of this relatively simple task in ongoing studies on prodromal PD. Second, as no perfect definition of HRPD individuals exist to date, it is probable that not all of our HRPD will eventually develop PD. However, our inclusion criteria considered the increasing risk with increasing numbers of risk and prodromal factors (Liepelt et al., 2011; Ross et al., 2012; Siderowf et al., 2012), which is most probably one of the best models for the definition of such a cohort currently available. Third, it is not fully investigated yet to which extent the reduced limits of stability in PD are rather a compensatory mechanism (Demirci et al., 1997; Maetzler et al., 2013) or have an underlying pathophysiology related to postural instability (van Wegen et al., 2001; Błaszczyk et al., 2007; Mancini et al., 2012; Schoneburg et al., 2013). It could be that the underlying mechanisms of degeneration and compensation are different in HRPD and PD. However, “clinical PD” must be considered as the best endpoint for investigations of prodromal PD phases currently available (Siderowf and Stern, 2008; Gaenslen et al., 2011; Berg and Bandmann, 2013; Berg et al., 2013). Moreover, as changes in the prodromal, or from the prodromal to the clinical phase may not always be linear (Siderowf and Stern, 2008; Maetzler and Hausdorff, 2012), we included parameters in our (second) model, which have been shown to be altered in HRPD (but not in PD, compared to CO) in a previous study investigating static sway under challenging conditions.
Fourth, the particular experimental setting has not been validated yet. However, Mancini et al. (2012) have shown in early PD patients and healthy older adults that trunk accelerometry parameters during quiet stance are strongly associated with balance platform parameters. Thus, experiments with accelerometry-based quantitative sensors are a useful approach for measuring parameters at (or nearby) the center of mass during quiet stance (e.g., Moe-Nilssen and Helbostad, 2002; Lamoth et al., 2009; Lindemann et al., 2012). As our approach is basically comparable to a quiet stance experiment, we argue that the quantitative data obtained in this experiment reflects a kind of sway behavior during quiet standing. However, a direct validation experiment has not been performed. Fifth, the FR test itself faces some limitations: it is not related to center of mass (CoM) or center of pressure (CoP) limits of stability. It is performed only in one direction and does not allow an identification of the type of balance problem (Mancini and Horak, 2010). Still it has been associated with center of pressure excursion (COPE), and is related to the margins of stability and a functional assessment of an essential everyday life task (Duncan et al., 1990).
Conclusion
The approach presented here does not definitely allow differentiating between degeneration and compensation aspects of balance at the limit of stability in PD and HRPD. Still, we believe that it can relevantly contribute to an assessment panel for definition of HRPD in future studies. In combination with tasks that assess other motor as well as non-motor domains of the PD spectrum, the iFR could serve as an important contribution to an assessment battery that yields an acceptable positive predictive value for future PD.
Author Contributions
Sandra E. Hasmann, Daniela Berg, Inga Liepelt-Scarfone, and Walter Maetzler made substantial contributions to the acquisition, analysis, and interpretation of data for the work. Markus A. Hobert, David Weiss, Ulrich Lindemann, and Johannes Streffer made substantial contributions to the acquisition of the data. Sandra E. Hasmann and Walter Maetzler drafted the paper, all remaining authors revised the draft critically for important intellectual content. All authors gave their final approval of the version to be published, and agree to be accountable for all aspects of the work in ensuring that questions related to the accuracy or integrity of any part of the work are appropriately investigated and resolved.
Conflict of Interest Statement
There are no conflicts to declare. Johannes Streffer is employed by Johnson and Johnson, which sponsored the PMPP study. The funding of the PMPP study is pre-competitive.
Acknowledgments
We thank all individuals who took part in the study. Sandra E. Hasmann was supported by a Research grant of the Faculty of Medicine (IZKF). Markus A. Hobert and Walter Maetzler are supported by the EU project SENSE-PARK, funded under the Seventh Framework Program, Cooperation – ICT, Grant Agreement no. 288557. We acknowledge support by Deutsche Forschungsgemeinschaft and Open Access Publishing Fund of Tuebingen University.
Supplementary Material
The Supplementary Material for this article can be found online at http://www.frontiersin.org/Journal/10.3389/fnagi.2014.00286/abstract
References
Almeida, S. T., De Soldera, C. L. C., Carli, G. A., De Gomes, I., and Resende, T. D. L. (2012). Analysis of extrinsic and intrinsic factors that predispose elderly individuals to fall. Rev. Assoc. Med. Bras. 58, 427–433. doi: 10.1016/S0104-4230(12)70224-5
Pubmed Abstract | Pubmed Full Text | CrossRef Full Text | Google Scholar
Berg, D., and Bandmann, O. (2013). Biomarkers for PD: how can we approach complexity? Neurology 80, 608–609. doi:10.1212/WNL.0b013e3182825184
Berg, D., Lang, A. E., Postuma, R. B., Maetzler, W., Deuschl, G., Gasser, T., et al. (2013). Changing the research criteria for the diagnosis of Parkinson’s disease: obstacles and opportunities. Lancet Neurol. 12, 514–524. doi:10.1016/S1474-4422(13)70047-4
Pubmed Abstract | Pubmed Full Text | CrossRef Full Text | Google Scholar
Berg, D., Seppi, K., Behnke, S., Liepelt, I., Schweitzer, K., Stockner, H., et al. (2011). Enlarged substantia nigra hyperechogenicity and risk for Parkinson disease: a 37-month 3-center study of 1847 older persons. Arch. Neurol. 68, 932–937. doi:10.1001/archneurol.2011.141
Pubmed Abstract | Pubmed Full Text | CrossRef Full Text | Google Scholar
Błaszczyk, J. W., Orawiec, R., Duda-Kłodowska, D., and Opala, G. (2007). Assessment of postural instability in patients with Parkinson’s disease. Exp. Brain Res. 183, 107–114. doi:10.1007/s00221-007-1024-y
Bogdanov, M., Matson, W. R., Wang, L., Matson, T., Saunders-Pullman, R., Bressman, S. S., et al. (2008). Metabolomic profiling to develop blood biomarkers for Parkinson’s disease. Brain 131(Pt 2), 389–396. doi:10.1093/brain/awm304
Pubmed Abstract | Pubmed Full Text | CrossRef Full Text | Google Scholar
Cattabriga, A., Mellone, S., Palmerini, L., Taconi, C., Mussi, C., and Chiari, L. (2013). “Instrumented functional reach for fall risk assessment,” in Paper presented at the Annual Meeting of the International Society for Gait and Posture Research. Akita.
Colnat-Coulbois, S., Gauchard, G. C., Maillard, L., Barroche, G., Vespignani, H., Auque, J., et al. (2011). Management of postural sensory conflict and dynamic balance control in late-stage Parkinson’s disease. Neuroscience 193, 363–369. doi:10.1016/j.neuroscience.2011.04.043
Pubmed Abstract | Pubmed Full Text | CrossRef Full Text | Google Scholar
Demirci, M., Grill, S., McShane, L., and Hallett, M. (1997). A mismatch between kinesthetic and visual perception in Parkinson’s disease. Ann. Neurol. 41, 781–788. doi:10.1002/ana.410410614
Pubmed Abstract | Pubmed Full Text | CrossRef Full Text | Google Scholar
Duncan, P. W., Studenski, S., Chandler, J., and Prescott, B. (1992). Functional reach: predictive validity in a sample of elderly male veterans. J. Gerontol. 47, M93–M98. doi:10.1093/geronj/47.3.M93
Pubmed Abstract | Pubmed Full Text | CrossRef Full Text | Google Scholar
Duncan, P. W., Weiner, D. K., Chandler, J., and Studenski, S. (1990). Functional reach: a new clinical measure of balance. J. Gerontol. 45, M192–M197. doi:10.1093/geronj/45.6.M192
Pubmed Abstract | Pubmed Full Text | CrossRef Full Text | Google Scholar
Farooqui, T., and Farooqui, A. A. (2011). Lipid-mediated oxidative stress and inflammation in the pathogenesis of Parkinson’s disease. Parkinsons Dis. 2011, 247467. doi:10.4061/2011/247467
Pubmed Abstract | Pubmed Full Text | CrossRef Full Text | Google Scholar
Gaenslen, A., Swid, I., Liepelt-Scarfone, I., Godau, J., and Berg, D. (2011). The patients’ perception of prodromal symptoms before the initial diagnosis of Parkinson’s disease. Mov. Disord. 26, 653–658. doi:10.1002/mds.23499
Pubmed Abstract | Pubmed Full Text | CrossRef Full Text | Google Scholar
Horak, F. B., Dimitrova, D., and Nutt, J. G. (2005). Direction-specific postural instability in subjects with Parkinson’s disease. Exp. Neurol. 193, 504–521. doi:10.1016/j.expneurol.2004.12.008
Pubmed Abstract | Pubmed Full Text | CrossRef Full Text | Google Scholar
Huang, H.-C., Gau, M.-L., Lin, W.-C., and George, K. (1998). Assessing risk of falling in older adults. Public Health Nurs. 20, 399–411. doi:10.1046/j.1525-1446.2003.20508.x
Pubmed Abstract | Pubmed Full Text | CrossRef Full Text | Google Scholar
Kamata, N., Matsuo, Y., Yoneda, T., Shinohara, H., Inoue, S., and Abe, K. (2007). Overestimation of stability limits leads to a high frequency of falls in patients with Parkinson’s disease. Clin Rehabil 21, 357–61. doi:10.1177/0269215507073346
Lamoth, C. J. C., van Lummel, R. C., and Beek, P. J. (2009). Athletic skill level is reflected in body sway: a test case for accelometry in combination with stochastic dynamics. Gait Posture 29, 546–551. doi:10.1016/j.gaitpost.2008.12.006
Pubmed Abstract | Pubmed Full Text | CrossRef Full Text | Google Scholar
Lerche, S., Seppi, K., Behnke, S., Liepelt-Scarfone, I., Godau, J., Mahlknecht, P., et al. (2014). Risk factors and prodromal markers and the development of Parkinson’s disease. J. Neurol. 261, 180–187. doi:10.1007/s00415-013-7171-0
Pubmed Abstract | Pubmed Full Text | CrossRef Full Text | Google Scholar
Liepelt, I., Behnke, S., Schweitzer, K., Wolf, B., Godau, J., Wollenweber, F., et al. (2011). Pre-motor signs of PD are related to SN hyperechogenicity assessed by TCS in an elderly population. Neurobiol. Aging 32, 1599–1606. doi:10.1016/j.neurobiolaging.2009.10.004
Pubmed Abstract | Pubmed Full Text | CrossRef Full Text | Google Scholar
Liepelt-Scarfone, I., Gauss, K., Maetzler, W., Müller, K., Bormann, C., Fruhmann Berger, M., et al. (2013). Evaluation of progression markers in the premotor phase of Parkinson’s disease: the progression markers in the premotor phase study. Neuroepidemiology 41, 174–182. doi:10.1159/000353560
Pubmed Abstract | Pubmed Full Text | CrossRef Full Text | Google Scholar
Lin, M.-R., Wolf, S. L., Hwang, H.-F., Gong, S.-Y., and Chen, C.-Y. (2007). A randomized, controlled trial of fall prevention programs and quality of life in older fallers. J. Am. Geriatr. Soc. 55, 499–506. doi:10.1111/j.1532-5415.2007.01146.x
Pubmed Abstract | Pubmed Full Text | CrossRef Full Text | Google Scholar
Lindemann, U., Moe-Nilssen, R., Nicolai, S. E., Becker, C., and Chiari, L. (2012). Assessment of balance in unsupported standing with elderly inpatients by force plate and accelerometers. Aging Clin. Exp. Res. 24, 37–41. doi:10.1007/BF03325352
Pubmed Abstract | Pubmed Full Text | CrossRef Full Text | Google Scholar
Louter, M., Maetzler, W., Prinzen, J., van Lummel, R. C., Hobert, M., Arends, J. B. A. M., et al. (2014). Accelerometer-based quantitative analysis of axial nocturnal movements differentiates patients with Parkinson’s disease, but not high-risk individuals, from controls. J. Neurol. Neurosurg. Psychiatr. doi:10.1136/jnnp-2013-306851
Pubmed Abstract | Pubmed Full Text | CrossRef Full Text | Google Scholar
Maetzler, W., and Hausdorff, J. M. (2012). Motor signs in the prodromal phase of Parkinson’s disease. Mov. Disord. 27, 627–633. doi:10.1002/mds.24973
Maetzler, W., Mancini, M., Liepelt-Scarfone, I., Müller, K., Becker, C., van Lummel, R. C., et al. (2012). Impaired trunk stability in individuals at high risk for Parkinson’s disease. PLoS ONE 7:e32240. doi:10.1371/journal.pone.0032240
Pubmed Abstract | Pubmed Full Text | CrossRef Full Text | Google Scholar
Maetzler, W., Nieuwhof, F., Hasmann, S. E., and Bloem, B. R. (2013). Emerging therapies for gait disability and balance impairment: promises and pitfalls. Mov. Disord. 28, 1576–1586. doi:10.1002/mds.25682
Pubmed Abstract | Pubmed Full Text | CrossRef Full Text | Google Scholar
Mancini, M., Carlson-Kuhta, P., Zampieri, C., Nutt, J. G., Chiari, L., and Horak, F. B. (2012). Postural sway as a marker of progression in Parkinson’s disease: a pilot longitudinal study. Gait Posture 36, 471–476. doi:10.1016/j.gaitpost.2012.04.010
Pubmed Abstract | Pubmed Full Text | CrossRef Full Text | Google Scholar
Mancini, M., and Horak, F. B. (2010). The relevance of clinical balance assessment tools to differentiate balance deficits. Eur. J. Phys. Rehabil. Med. 46, 239–248.
Mancini, M., Rocchi, L., Horak, F. B., and Chiari, L. (2008). Effects of Parkinson’s disease and levodopa on functional limits of stability. Clin. Biomech. (Bristol, Avon) 23, 450–458. doi:10.1016/j.clinbiomech.2007.11.007
Pubmed Abstract | Pubmed Full Text | CrossRef Full Text | Google Scholar
Menant, J. C., Latt, M. D., Menz, H. B., Fung, V. S., and Lord, S. R. (2011). Postural sway approaches center of mass stability limits in Parkinson’s disease. Mov. Disord. 26, 637–643. doi:10.1002/mds.23547
Pubmed Abstract | Pubmed Full Text | CrossRef Full Text | Google Scholar
Mielke, M. M., and Maetzler, W. (2014). A “bird’s eye” view on the current status and potential benefits of blood biomarkers for Parkinson’s disease. Biomark. Med. 8, 225–227. doi:10.2217/bmm.13.139
Mielke, M. M., Maetzler, W., Haughey, N. J., Bandaru, V. V. R., Savica, R., Deuschle, C., et al. (2013). Plasma ceramide and glucosylceramide metabolism is altered in sporadic Parkinson’s disease and associated with cognitive impairment: a pilot study. PLoS ONE 8:e73094. doi:10.1371/journal.pone.0073094
Pubmed Abstract | Pubmed Full Text | CrossRef Full Text | Google Scholar
Mirelman, A., Gurevich, T., Giladi, N., Bar-Shira, A., Orr-Urtreger, A., and Hausdorff, J. M. (2011). Gait alterations in healthy carriers of the LRRK2 G2019S mutation. Ann. Neurol. 69, 193–197. doi:10.1002/ana.22165
Pubmed Abstract | Pubmed Full Text | CrossRef Full Text | Google Scholar
Moe-Nilssen, R., and Helbostad, J. L. (2002). Trunk accelerometry as a measure of balance control during quiet standing. Gait Posture 16, 60–68. doi:10.1016/S0966-6362(01)00200-4
Pubmed Abstract | Pubmed Full Text | CrossRef Full Text | Google Scholar
Morgan, J. C., Mehta, S. H., and Sethi, K. D. (2010). Biomarkers in Parkinson’s disease. Curr. Neurol. Neurosci. Rep. 10, 423–430. doi:10.1007/s11910-010-0144-0
Park, J.-S., Koentjoro, B., Veivers, D., Mackay-Sim, A., and Sue, C. M. (2014). Parkinson’s disease-associated human ATP13A2 (PARK9) deficiency causes zinc dyshomeostasis and mitochondrial dysfunction. Hum. Mol. Genet. 23, 2802–2815. doi:10.1093/hmg/ddt623
Pubmed Abstract | Pubmed Full Text | CrossRef Full Text | Google Scholar
Postuma, R., Lang, A., Gagnon, J., Pelletier, A., and Montplaisir, J. (2012a). How does parkinsonism start? Prodromal parkinsonism motor changes in idiopathic REM sleep behaviour disorder. Brain 135(Pt 6), 1860–1870. doi:10.1093/brain/aws093
Pubmed Abstract | Pubmed Full Text | CrossRef Full Text | Google Scholar
Postuma, R. B., Aarsland, D., Barone, P., Burn, D. J., Hawkes, C. H., Oertel, W., et al. (2012b). Identifying prodromal Parkinson’s disease: pre-motor disorders in Parkinson’s disease. Mov. Disord. 27, 617–626. doi:10.1002/mds.24996
Pubmed Abstract | Pubmed Full Text | CrossRef Full Text | Google Scholar
Reeve, A., Meagher, M., Lax, N., Simcox, E., Hepplewhite, P., Jaros, E., et al. (2013). The impact of pathogenic mitochondrial DNA mutations on substantia nigra neurons. J. Neurosci. 33, 10790–10801. doi:10.1523/JNEUROSCI.3525-12.2013
Pubmed Abstract | Pubmed Full Text | CrossRef Full Text | Google Scholar
Ross, G. W., Abbott, R. D., Petrovitch, H., Tanner, C. M., and White, L. R. (2012). Pre-motor features of Parkinson’s disease: the Honolulu-Asia Aging Study experience. Parkinsonism Relat. Disord. 18(Suppl. 1), S199–S202. doi:10.1016/S1353-8020(11)70062-1
Pubmed Abstract | Pubmed Full Text | CrossRef Full Text | Google Scholar
Rossi, M., Soto, A., Santos, S., Sesar, A., and Labella, T. (2009). A prospective study of alterations in balance among patients with Parkinson’s disease. Protocol of the postural evaluation. Eur. Neurol. 61, 171–176. doi:10.1159/000189270
Pubmed Abstract | Pubmed Full Text | CrossRef Full Text | Google Scholar
Runge, C., Shupert, C., Horak, F., and Zajac, F. (1999). Ankle and hip postural strategies defined by joint torques. Gait Posture 10, 161–170. doi:10.1016/S0966-6362(99)00032-6
Pubmed Abstract | Pubmed Full Text | CrossRef Full Text | Google Scholar
Schoneburg, B., Mancini, M., Horak, F., and Nutt, J. G. (2013). Framework for understanding balance dysfunction in Parkinson’s disease. Mov. Disord. 28, 1474–1482. doi:10.1002/mds.25613
Pubmed Abstract | Pubmed Full Text | CrossRef Full Text | Google Scholar
Shi, M., Bradner, J., Hancock, A. M., Chung, K. A., Quinn, J. F., Peskind, E. R., et al. (2011). Cerebrospinal fluid biomarkers for Parkinson disease diagnosis and progression. Ann. Neurol. 69, 570–580. doi:10.1002/ana.22311
Pubmed Abstract | Pubmed Full Text | CrossRef Full Text | Google Scholar
Siderowf, A., Jennings, D., Eberly, S., Oakes, D., Hawkins, K. A., Ascherio, A., et al. (2012). Impaired olfaction and other prodromal features in the Parkinson at-risk syndrome study. Mov. Disord. 27, 406–412. doi:10.1002/mds.24892
Pubmed Abstract | Pubmed Full Text | CrossRef Full Text | Google Scholar
Siderowf, A., and Stern, M. B. (2008). Premotor Parkinson’s disease: clinical features, detection, and prospects for treatment. Ann. Neurol. 64(Suppl. 2), S139–S147. doi:10.1002/ana.21462
Pubmed Abstract | Pubmed Full Text | CrossRef Full Text | Google Scholar
Smithson, F., Morris, M. E., and Iansek, R. (1998). Performance on clinical tests of balance in Parkinson’s disease. Phys. Ther. 78, 577–592.
Sousa, N., and Sampaio, J. (2005). Effects of progressive strength training on the performance of the functional reach test and the timed get-up-and-go test in an elderly population from the rural north of Portugal. Am. J. Hum. Biol. 17, 746–751. doi:10.1002/ajhb.20446
Pubmed Abstract | Pubmed Full Text | CrossRef Full Text | Google Scholar
Subramaniam, S. R., and Chesselet, M.-F. (2013). Mitochondrial dysfunction and oxidative stress in Parkinson’s disease. Prog. Neurobiol. 106-107, 17–32. doi:10.1016/j.pneurobio.2013.04.004
Pubmed Abstract | Pubmed Full Text | CrossRef Full Text | Google Scholar
van der Kooij, H., van Asseldonk, E. H. F., Geelen, J., van Vugt, J. P. P., and Bloem, B. R. (2007). Detecting asymmetries in balance control with system identification: first experimental results from Parkinson patients. J. Neural Transm. 114, 1333–1337. doi:10.1007/s00702-007-0801-x
Pubmed Abstract | Pubmed Full Text | CrossRef Full Text | Google Scholar
van Wegen, E. E., van Emmerik, R. E., Wagenaar, R. C., and Ellis, T. (2001). Stability boundaries and lateral postural control in Parkinson’s disease. Motor Control 5, 254–269. doi:10.1186/1743-0003-2-9
Pubmed Abstract | Pubmed Full Text | CrossRef Full Text | Google Scholar
Wang, J., Hoekstra, J. G., Zuo, C., Cook, T. J., and Zhang, J. (2013). Biomarkers of Parkinson’s disease: current status and future perspectives. Drug Discov. Today 18, 155–162. doi:10.1016/j.drudis.2012.09.001
Yang, Y.-R., Lee, Y.-Y., Cheng, S.-J., Lin, P.-Y., and Wang, R.-Y. (2008). Relationships between gait and dynamic balance in early Parkinson’s disease. Gait Posture 27, 611–615. doi:10.1016/j.gaitpost.2007.08.003
Pubmed Abstract | Pubmed Full Text | CrossRef Full Text | Google Scholar
Zijlstra, A., Mancini, M., Lindemann, U., Chiari, L., and Zijlstra, W. (2012). Sit-stand and stand-sit transitions in older adults and patients with Parkinson’s disease: event detection based on motion sensors versus force plates. J. Neuroeng. Rehabil. 9, 75. doi:10.1186/1743-0003-9-75
Pubmed Abstract | Pubmed Full Text | CrossRef Full Text | Google Scholar
Keywords: balance, limit of stability, neurodegeneration, prodromal Parkinson’s disease, sway
Citation: Hasmann SE, Berg D, Hobert MA, Weiss D, Lindemann U, Streffer J, Liepelt-Scarfone I and Maetzler W (2014) Instrumented functional reach test differentiates individuals at high risk for Parkinson’s disease from controls. Front. Aging Neurosci. 6:286. doi: 10.3389/fnagi.2014.00286
Received: 06 March 2014; Accepted: 26 September 2014;
Published online: 24 October 2014.
Edited by:
Rodrigo Orlando Kuljiš, Zdrav Mozak Limitada, ChileReviewed by:
Christopher Randolph, Loyola University Medical Center, USAFay Horak, Oregon Health & Science University, USA
Copyright: © 2014 Hasmann, Berg, Hobert, Weiss, Lindemann, Streffer, Liepelt-Scarfone and Maetzler. This is an open-access article distributed under the terms of the Creative Commons Attribution License (CC BY). The use, distribution or reproduction in other forums is permitted, provided the original author(s) or licensor are credited and that the original publication in this journal is cited, in accordance with accepted academic practice. No use, distribution or reproduction is permitted which does not comply with these terms.
*Correspondence: Sandra E. Hasmann and Walter Maetzler, Center for Neurology, University of Tübingen, Hoppe-Seyler-Straße 3, Tübingen 72076, Germany e-mail:c2FuZHJhLmhhc21hbm5Ac3R1ZGVudC51bmktdHVlYmluZ2VuLmRl;d2FsdGVyLm1hZXR6bGVyQHVuaS10dWViaW5nZW4uZGU=
†Inga Liepelt-Scarfone and Walter Maetzler have contributed equally to this work.