 Eva Bauer
 Gebhard Sammer
 Max Toepper
- 1Cognitive Neuroscience at the Centre for Psychiatry, University of Giessen, Giessen, Germany
- 2Department of Psychology, University of Giessen, Giessen, Germany
- 3Bender Institute of Neuroimaging, University of Giessen, Giessen, Germany
- 4Research Division, Department of Psychiatry and Psychotherapy, Evangelisches Klinikum Bethel, Bielefeld, Germany
- 5Division of Geriatric Psychiatry, Department of Psychiatry and Psychotherapy, Evangelisches Klinikum Bethel, Bielefeld, Germany
There is evidence that the neural response to increasing working memory (WM) load is modulated by age and performance level. For a valid interpretation of these effects, however, it is important to understand, whether and how they are related to gray matter atrophy. In the current work, we therefore used functional magnetic resonance imaging (fMRI) and voxel-based morphometry (VBM) to examine the association between age, performance level, spatial WM load-related brain activation and gray matter volume in 18 younger high-performers (YHP), 17 younger low-performers (YLP), 17 older high-performers (OHP), and 18 older low-performers (OLP). In multiple sub regions of the prefrontal cortex (PFC), load-related activation followed a linear trend with increasing activation at increasing load in all experimental groups. Results did not reveal differences between the sub groups. Older adults additionally showed a pattern of increasing activation from low to medium load but stable or even decreasing activation from medium to high load in other sub regions of the PFC (quadratic trend). Quadratic trend related brain activation was higher in older than in younger adults and in OLP compared to OHP. In OLP, quadratic trend related brain activation was negatively correlated with both performance accuracy and prefrontal gray matter volume. The results suggest an efficient upregulation of multiple PFC areas as response to increasing WM load in younger and older adults. Older adults and particularly OLP additionally show dysfunctional response patterns (i.e., enhanced quadratic trend related brain activation compared to younger adults and OHP, respectively) in other PFC clusters being associated with gray matter atrophy.
Introduction
Changes in Cognition
Aging is associated with cognitive changes (Park et al., 2002; Hedden and Gabrieli, 2004; Stanziano et al., 2010). However, these changes do not affect all cognitive domains but particularly attentional, mnemonic and executive processes. By contrast, verbal and semantic knowledge are relatively preserved. This is redundant (Park et al., 2002; Singer et al., 2003; Hedden and Gabrieli, 2004). Attentional and executive dysfunctions may manifest in various sub domains as processing speed, cognitive flexibility, focused attention or divided attention (Fozard et al., 1994; Bosworth and Schaie, 1999; O’Sullivan et al., 2001; Park et al., 2002; Singer et al., 2003; Buckner, 2004; Hedden and Gabrieli, 2004; Zimmerman et al., 2006; Kennedy and Raz, 2009; Fjell and Walhovd, 2010; Bauer et al., 2015b). Age-related memory dysfunctions involve short-term memory, episodic long-term memory, and working memory (WM) in particular (Park et al., 2002; Schulze et al., 2011). Decreased WM performance may affect numerous higher-level cognitive operations in everyday-life. In the spatial domain, for example, an age-related WM dysfunction may lead to difficulties in orienting and navigating in unfamiliar environments (Moffat et al., 2006; Cushman et al., 2008).
Changes in Activation
Decreasing WM performance with advancing age is reflected by functional cerebral changes particularly involving prefrontal brain regions (Reuter-Lorenz et al., 2000; Cabeza, 2002; Davis et al., 2008; Nagel et al., 2009; Rottschy et al., 2012; Clague et al., 2014). The kind of these changes, however, varies across studies so that both quantitative and qualitative differences between older and younger adults were reported. Quantitative differences refer to either increased (‘hyperactivation’) or reduced (‘hypoactivation’) prefrontal cortex activation in older compared to younger adults, whereas qualitative activation differences involve the recruitment of additional brain regions or increased frontal bilaterality in older individuals. Besides differences between the different kinds of activation changes, their interpretation differs across studies. Frontal hypoactivation, for example, was assumed to reflect high neural efficiency or reduced neural resources, whereas frontal hyperactivation or increased bilaterality were interpreted as neural inefficiency, neural compensation or reduced regional specificity (Reuter-Lorenz et al., 2000; Cabeza, 2002; Rypma et al., 2002; Johnson et al., 2004; Park et al., 2004; Rajah and D’Esposito, 2005; Reuter-Lorenz and Lustig, 2005; Zarahn et al., 2007; Davis et al., 2008; Reuter-Lorenz and Cappell, 2008; Holtzer et al., 2009; Nagel et al., 2009, 2011; Bennett and Rypma, 2013).
Reasons for these apparently inconsistent interpretations may be found in differing study designs (different paradigms, methods etc.). Moreover, the meaning of activation differences between older and younger adults is highly dependent from other factors such as performance accuracy. In fact, prefrontal hyperactivation or increased bilaterality in older adults together with equal or higher performance accuracy compared to younger adults were consistently attributed to successful compensation (Cabeza, 2002; Reuter-Lorenz and Lustig, 2005). In this case, an older individual enables more neural resources to achieve the same performance as a younger individual. By contrast, hypoactivation and lower performance accuracy in older compared to younger adults suggests failed compensation due to limited neural resources. Contrary to such compensation theories, efficiency theories assume that age-related prefrontal hyperactivation or increased bilaterality together with lower performance accuracy are signs of neural inefficiency, whereas hypoactivation associated with high performance accuracy may indicate neural efficiency. Overall, there is a need for designs allowing the differentiation between attempted and successful compensation to specify the meaning of functional cerebral changes in the aging brain (Sun et al., 2014).
Another factor modulating age-related activation differences is WM load. In fact, pronounced age effects were found by paradigms in which task demands were experimentally manipulated (Nagel et al., 2009; Toepper et al., 2014; Bauer et al., 2015a). Higher task load requires an enhanced recruitment of neural resources being reflected by increased prefrontal brain activation also referred to as ‘neural upregulation.’ In older individuals, this upregulation is associated with altered prefrontal activation patterns as indicated by both imaging and neurophysiological data (McEvoy et al., 2001; Reuter-Lorenz and Cappell, 2008; Nagel et al., 2009; Cappell et al., 2010; Schneider-Garces et al., 2010; Bennett et al., 2013; Toepper et al., 2014; Bauer et al., 2015a).
Compensation-Related Utilization of Neural Circuits Hypothesis
The most popular aging model considering both performance accuracy and task load is the Compensation-Related Utilization of Neural Circuits Hypothesis (CRUNCH). The CRUNCH model was published by Reuter-Lorenz and Cappell (2008) and postulates that older adults show unimpaired WM performances at low task load but frontal hyperactivation or increased bilaterality reflecting a recruitment of additional neural resources to compensate for an age-related reduction of WM capacity. At high task demands, by contrast, older adults show poorer performances than younger adults associated with frontal hypoactivation suggesting restricted neural resources in older individuals. The CRUNCH predictions were replicated in numerous studies (Nagel et al., 2009; Cappell et al., 2010; Schneider-Garces et al., 2010; Bennett et al., 2013; Toepper et al., 2014). Toepper and colleagues, for example, used functional magnetic resonance imaging (fMRI) to examine spatial WM related brain activation in 45 healthy volunteers between 20 and 68 years of age (Toepper et al., 2014). WM load was manipulated by varying the length of target sequences. Results revealed increased prefrontal activation in older subjects at low compared to high task load, whereas younger subjects showed the opposite pattern. Compared to younger adults, older adults showed increased activity at low task load and decreased activity at high task load. The results furnish proof for a double dissociation between older and younger adults suggesting that the neural response to increasing task load is impaired in older adults. Since prefrontal activation intensity at low task load was positively correlated with the number of errors, the findings suggest that increased activity at low task load may reflect neural inefficiency rather than compensation.
Performance Level
Noteworthy, an alternative option to examine the association between WM performance and brain activation is the comparison between high- and low-performers. FMRI results of Bauer and colleagues, for example, indicated that younger and older high-performers showed similar patterns of increasing prefrontal activation with increasing WM load (Bauer et al., 2015a). This pattern was less differentiated in older than in younger high-performing adults (i.e., less sharp increase of activation intensity with increasing load), but still suggested an efficient ‘youth-like’ recruitment of neural resources as response to increasing task load. Younger low-performers also showed increased activation at medium task load, but no further increase at high task load, indicating that neural resources of younger low-performers may have been exhausted earlier compared to those of younger and older high-performers. The poorest performances were shown by older low-performers. Moreover, older low-performers showed no pattern of neural upregulation at higher task load (i.e., no increasing activation intensity with increasing load) suggesting that a resource ceiling may already have been reached at lower task load. Very similar effects were previously reported by Nagel et al. (2009), although a different paradigm, different methods and different load levels were utilized (e.g., parallel vs. serial target presentation, load levels 1-3-7 vs. 4-5-6). Together, both studies confirm the validity of the effects described above Toepper et al. (2016). In addition, however, the results of Nagel and colleagues revealed right dorsolateral prefrontal activation following a quadratic trend in older low-performers. These findings suggest that older low-performers show increased prefrontal brain activation at medium compared to low task load. After that, activation intensity reaches a plateau before it diminishes at high task load. Due to these differing results, one aim of the present work was to specify the patterns of load-related prefrontal activation in low-performing individuals, and older low-performers in particular.
Changes in Gray Matter
A second aim addressed the association between age, performance level and changes in gray matter. Gray matter alterations in older individuals were reported by several studies and can be reflected by cortical thinning, a decreased brain tissue surface or a reduction of brain volume after the second decade of life (Good et al., 2001; Fleischman et al., 2014; Storsve et al., 2014). Reasons for this decline are a shrinkage of neurons, a reduction of synaptic spines and a reduced number of synapses rather than neuronal loss (Fjell and Walhovd, 2010). Global gray matter volume reaches its maximum in early adulthood and then shows a relative constant reduction until the age of 70 (Good et al., 2001) with an annual atrophy rate of approximately 0.2% (Fox and Schott, 2004). Afterward, however, longitudinal data suggest an accelerated degeneration of 0.3–0.5% per year (Fox and Schott, 2004).
Gray matter volume loss does not affect all brain regions to the same extent. Whereas gray matter volume of parahippocampal, cingulate or occipital brain structures appears to be relatively preserved from age-related atrophy (Raz et al., 1997), gray matter reductions were consistently observed in superior parietal and inferior temporal cortices as well as in hippocampus, insula, striatum, and prefrontal cortex (Raz et al., 1997, 2003, 2005; Resnick et al., 2003; Fjell et al., 2009; Fjell and Walhovd, 2010; Di et al., 2014). Among these brain regions, prefrontal cortex seems to show a specific vulnerability to gray matter atrophy (Raz et al., 1997; Fjell et al., 2009). This atrophy is associated with impaired memory, attention and executive processes indicating the relevance of prefrontal cortex integrity for various cognitive domains (Tisserand et al., 2004; Zimmerman et al., 2006; Cardenas et al., 2011; Kaup et al., 2011; Bauer et al., 2015b). WM represents an interface between memory, attention and executive functioning. Consequently, numerous studies reported an association between prefrontal brain volume and WM performance as well (Goldstein et al., 2011; Kaup et al., 2011).
Rationale of the Study
Taken together, there is much evidence regarding age-related changes in cognition, brain structure and cerebral activation. However, there is sparse evidence for how these different factors are related to each other. Specifically, it remains unclear whether altered load-related prefrontal activation patterns in older adults are linked to age-related prefrontal gray matter atrophy or whether these changes are independent processes manifesting at higher ages.
In the current experiment, we therefore used fMRI and voxel-based morphometry (VBM) to examine the association between performance level, spatial WM load-related brain activation and prefrontal gray matter volume in different age cohorts.
Based on the previous theoretical considerations, younger age and higher performance level should be associated with an efficient upregulation of prefrontal cortex activation as neural response to increasing WM load. Particularly in younger individuals and older high-performers, we therefore expect an increase of prefrontal activation from the lowest to the highest load level (positive linear trend) as quantified by fMRI. Specifically, we expect increased linear trend related activation in younger compared to older adults and in older high-performers compared to older low-performers. In older low-performers, by contrast, we particularly expect increasing load-related activation from low to medium task load but stable or decreasing load-related activation from medium to high task load as indicated by quadratic trends. These quadratic trends probably reflect dysfunctional neural responses. Consequently, older low-performers should show increased quadratic trend related activation compared to older high-performers. Moreover, we expect increased quadratic trend related activation in older compared to younger adults.
Regarding structural differences, we expect lower gray matter volume in older compared to younger individuals and in older low-performers compared to older high-performers in dorsolateral and ventrolateral prefrontal brain regions as quantified by VBM.
Finally, the extent of quadratic trend related activation should be negatively correlated with prefrontal gray matter volume and performance accuracy in older low-performers, indicating a neural dysfunction being associated with structural atrophy.
Materials and Methods
Participants
The study included 70 healthy volunteers between 20 and 80 years of age. Participants were divided into two groups of 35 younger and 35 older individuals. To analyze the impact of performance level, both age groups were further subdivided into high-performers and low-performers by median split (errors in the experimental paradigm), eventually resulting in four experimental groups (Table 1): younger high-performers (YHP), younger low-performers (YLP), older high-performers (OHP), and older low-performers (OLP). Sample size was determined by an a priori power analysis using G∗Power 3.1 (N = 68; α = 0.05, effect size = 0.3, number of groups = 4, number of measurements = 4).
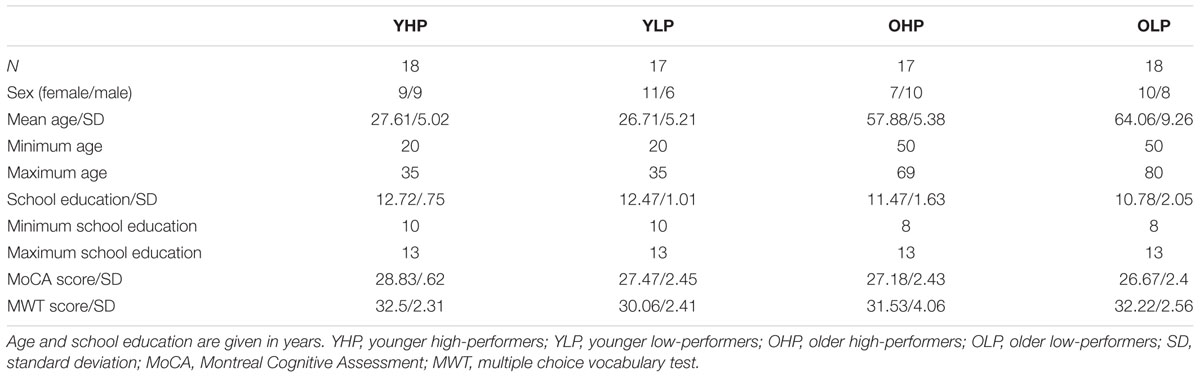
TABLE 1. Sample characteristics.
All participants had normal or corrected-to-normal vision. None of the participants had a documented diagnosis of neurological or psychiatric disease in the past. Global cognitive deficits were excluded by the Montreal Cognitive Assessment (MoCA) (Nasreddine et al., 2005). Participants were recruited by local advertising and provided a written declaration of consent prior to study start. All participants received an expense allowance of 8 € per hour. The study obtained ethical approval by the Institutional Review Board of the University of Giessen being in accordance with the Declaration of Helsinki. Parts of the sample participated in Bauer et al. (2015a).
Next to the MoCA score, we collected the years of school education and scores in the multiple choice vocabulary test (MWT) (Lehrl et al., 1995) to estimate the level of education. YHP and YLP did not differ with respect to age and school education, but with respect to the MoCA score [t(33) = 2.28; p = 0.029] and the MWT score [t(33) = 3.06; p = 0.004]. OHP and OLP did not differ with respect to school education, MoCA score and MWT score, but with respect to age [t(33) = -2.39; p = 0.023]. However, age distribution in both OHP and OLP was rather bimodal and variances were different (F = 3.4, p = 0.018). Accordingly, a median test was computed not indicating different medians (OHP = 56; OLP = 60; χ2= 1.45, p = 0.23).
Task and Experimental Procedure
To assess spatial WM, we used a modified version of the Corsi-Block-Tapping test (CBT) (Corsi, 1972; Toepper et al., 2014). The CBT is a multiple item WM task that requires the encoding, maintenance and retrieval of spatial target sequences. WM load can be manipulated by a variation of sequence length. The original (Toepper et al., 2010a,b) and the modified (Toepper et al., 2014) CBT versions reveal nearly identical activation patterns. Basically, four potential target locations are shown on a screen as indicated by four horizontally arranged blocks. Four (load 4), five (load 5) or six (load 6) locations were randomly presented one after another and had to be reproduced by the participant in the correct temporal order afterward. In the baseline condition (load c), all four target locations were presented from left to right (see Figure 1). Each participant performed four trials per CBT sequence length and eight baseline trials. The different experimental conditions were counterbalanced with the same sequence for all participants.
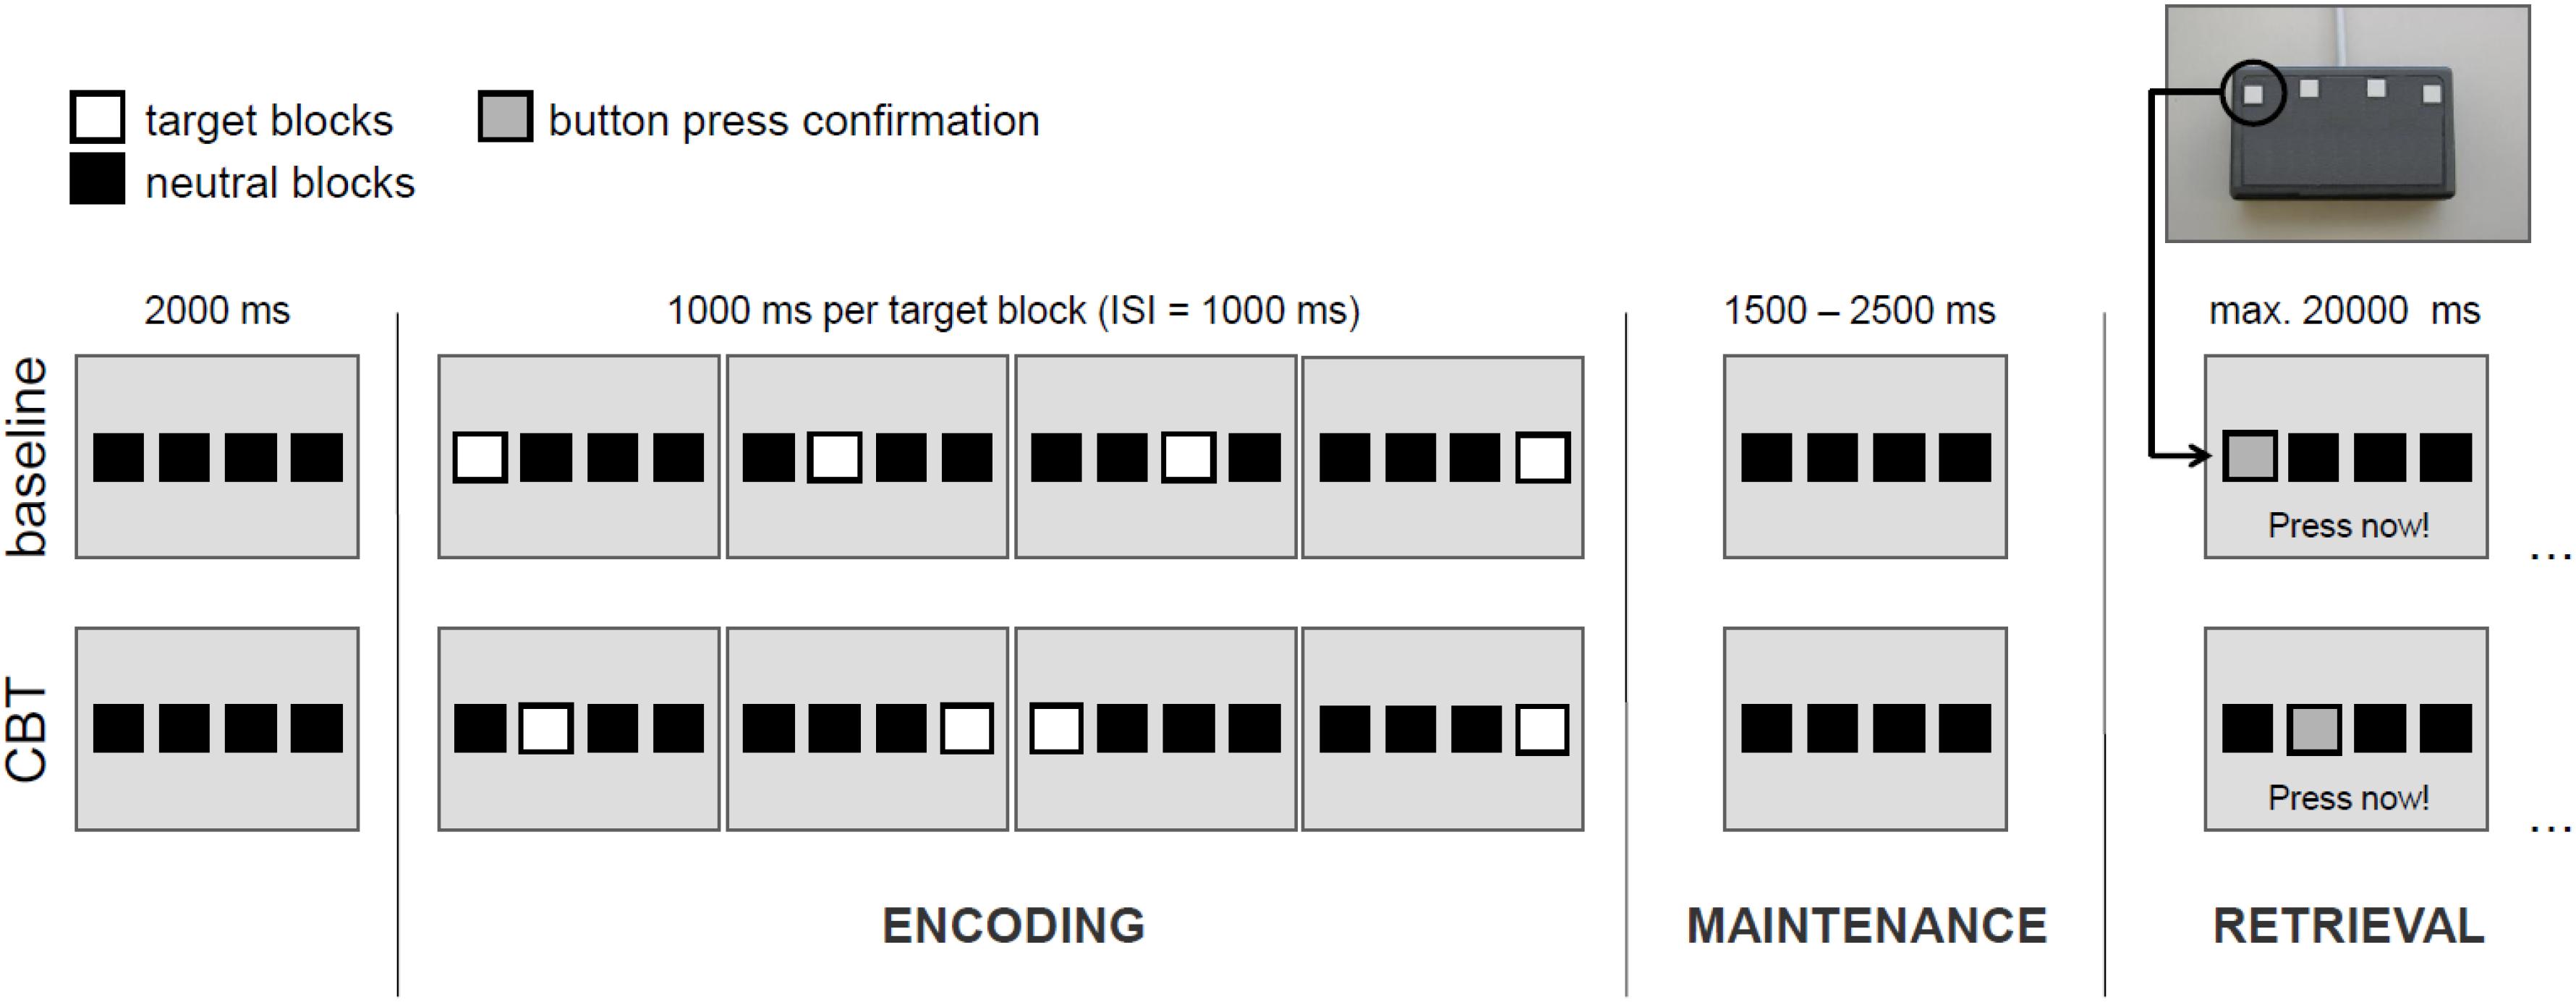
FIGURE 1. Exemplary illustration of the experimental design for load level 4. CBT, Corsi Block-Tapping test; ISI, inter-stimulus interval. Please note that in the experimental conditions (load levels 4, 5, and 6) one and the same target block may appear more than once within a sequence.
Each experimental trial consisted of an encoding phase (in which participants were instructed to learn the presented sequence), a maintenance phase (delay period), and a retrieval phase (during which participants were instructed to reproduce the presented sequence).
The encoding phase started with the onset of the first target block of every sequence and ended after the presentation of the last one. Duration of each target block and inter-stimulus intervals between the blocks were 1000 ms. Hence, in dependence of the respective load level, the encoding phase duration varied between 7000, 9000, and 11.000 ms.
After the encoding phase, the maintenance phase (delay period) started. Duration of the maintenance phase was set to 1500, 2000, or 2500 ms (equally distributed across conditions) in order to improve the event-related sampling quality and efficiency of the design. During the maintenance phase, only the four horizontal blocks were shown and participants were required to keep in mind the sequence presented before.
After the maintenance phase, the retrieval phase started with the instruction “Press now” at the bottom of the screen. During the retrieval phase, participants were required to reproduce the sequence of target blocks presented before in the correct temporal order by performing sequential button presses on a keypad with four horizontally arranged buttons. Each of these four buttons represented the corresponding block on the screen. A direct feedback was given confirming each button press by a change of the of the respective block’s color. The retrieval phase lasted until the last button press (but with a maximum length of 20.000 ms). Overall, each participant performed 20 trials with a duration of about 10 min.
Before the experiment, participants were instructed to memorize the correct locations and temporal order of the presented target blocks. For retrieval, participants were advised to reproduce the presented target sequences by successive button presses and to respond as fast and as accurate as possible. Additionally, participants performed a 2-min series of practice trials on a PC outside the scanner, including two load c and one load 5 trial.
Stimulus Material
The four horizontally arranged black blocks (RGB 0 0 0) were displayed on a gray background (RGB 163 163 163). Target blocks were displayed in red (RGB 255 0 0). Yellow color after button press indicated the given response (RGB 255 255 0).
Data Acquisition
A three Tesla Siemens Magnetom Verio Scanner was used for data acquisition. Functional images were recorded using a T2∗-weighted echo planar imaging (EPI) sequence (30 slices covering the whole brain; descending order parallel to the AC-PC line +25°; slice thickness = 4 mm; 1 mm gap; TR = 2100 ms; TE = 30 ms; flip angle = 90°; field of view = 192∗192 mm; matrix size = 64∗64; voxel size = 3∗3∗4 mm). Via a dual-mirror mounted to the head coil, participants saw the visual stimuli presented on a monitor near the end of the tube. Before the EPI sequence, field map sequences were applied to control for magnetic field inhomogeneities. T1-weighted structural images were assessed with 160 sagittal slices of 1 mm slice thickness using a magnetization prepared rapid gradient echo (MPRage) sequence (TR = 1900 ms; TE = 2.52 ms; flip angle = 9°; field of view = 250 mm; base resolution 256; 176 slices). Time of acquisition in the scanner was approximately 20 min per participant.
Data Analysis
Behavioral Data Analysis
To analyze the impact of load and group on the number of CBT errors, we computed a 4 (CBT load: load c, load 4, load 5, load 6) × 4 (group: YHP, YLP, OHP, and OLP) repeated measures ANOVA including Bonferroni-tests for post hoc comparisons. Demographic group differences of interest (age, education, and MoCA score) were analyzed using two-sample t-tests. SPSS Statistics 22 was used for behavioral data analyses. Significance level was set to α = 0.05, two-tailed.
Functional Brain Data Analysis
For the analysis of the MRI data, SPM12 (Statistical Parametric Mapping Software; Wellcome Institute of Neurology at University College, London, United Kingdom)1 was used running under MATLAB R2016a (The Mathworks, Natick, MA, United States). To account for the time needed for the magnetic field to become a steady state, the first three images of every EPI-recording session were discarded. Preprocessing of the EPI images included unwarping and realignment to the first volume (b-spline interpolation), slice time correction, normalization to the standard space of the Montreal Neurological Institute (MNI) brain, and smoothing with an isotropic three-dimensional Gaussian kernel with a full-width-at-half-maximum (FWHM) of 9 mm. Data were analyzed using a general linear model (GLM) with four regressors for the encoding phase (load c encoding, load 4 encoding, load 5 encoding, load 6 encoding), one regressor for the maintenance phase, and four regressors for the retrieval phase (load c retrieval, load 4 retrieval, load 5 retrieval, load 6 retrieval). All instead of only correct trials were included into the design to avoid type 1 error due to different trial numbers at the different load levels (Bauer et al., 2015a). Although past work has shown that results do not differ very much, this point is often heavily discussed. In fact, all aging studies are confronted with this problem since both options include advantages and disadvantages. Analyzing only correct trials leads to a different number of analyzed trials in the different experimental groups. Particularly in experimental designs modulating the load level (as in ours), analyzing only correct trials might lead to type 1 error. In the current work (as in many others) the number of correct trials decreased with increasing load but this load-related decrease differed between the different experimental groups. Consequently, a group × load interaction may be the statistical consequence of different trial numbers and not the consequence of activation differences. To avoid this, we decided to include all trials into brain data analyses. However, it must be stated that analyzing all trials might also lead to false positive findings as activation differences may be the result of specific neural activity elicited by incorrect trials. For example, there could be a brain region being more active when responses are incorrect and therefore responds more to increasing load in older than in younger adults. Beside all of these arguments, however, it remains clear that including or excluding incorrect trials refer to substantially different hypotheses.
Previous findings revealed that age-related changes within memory seem to particularly affect the acquisition and early retrieval of new information (Small et al., 1999), which was confirmed for spatial WM retrieval by our working group (Toepper et al., 2014; Bauer et al., 2015a). The current study also focused on WM retrieval. Consequently, only the contrasts related to retrieval were analyzed on the second level. The timing of the regressors followed the timing described in section 2.2. In addition, six movement regressors were modeled. All regressors were convolved with the hemodynamic response function of SPM12. The design matrix was high pass filtered with 128 s.
We built contrasts for positive linear (-3/-1/+1/+3) and quadratic (-1/+1/+1/-1) trends. Theoretically, positive linear trends reflect continuously increasing activation with every higher load level indicating an efficient upregulation of neural activity at increasing load. Quadratic trends, by contrast, reflect an increase of activation from load c to load 4/5 and a decrease from load 4/5 to load 6 suggesting a resource ceiling at load 4/5 (dysfunctional upregulation). Noteworthy, activation patterns that do not strictly follow the described patterns can also reach significance in trend analyses: A positive linear trend, for example, may be characterized by increasing activation from load c to load 4 with no further increase from load 4 to load 5 or 6. This pattern would rather indicate a neural resource ceiling at load level 4 than an efficient upregulation. Similar variations can be observed for quadratic trends and there may even be activation patterns that follow both linear and quadratic functions. Consequently, we plotted mean contrast estimates for the different load levels and experimental groups separately to be able to specify the linear and quadratic trends identified by our analyses.
Neural activation patterns associated with linear and quadratic trends were analyzed using one-sample t-tests for each group separately. Data were analyzed at whole-brain level and by a region of interest (ROI) approach, both on the voxel level with a significance threshold of p < 0.05 and a family-wise error (FWE) correction for multiple comparisons. Differences between older and younger adults and between OHP and OLP regarding linear and quadratic trend related neural activation were analyzed using two-sample t-tests. Again, data were analyzed at whole-brain level and by a ROI approach, both on the voxel level with a significance threshold of p < 0.05 and an FWE correction for multiple comparisons.
Based on the theoretical considerations regarding the functional vulnerability of the prefrontal cortex (PFC) in older adults (see Introduction), a priori defined ROIs included different dorsolateral and ventrolateral PFC sub regions, including Brodmann areas (BAs) 9 and 46 as well as 44, 45, and 47, respectively. For this, we used the corresponding ROI masks of the automated anatomical labeling atlas (AAL) (Tzourio-Mazoyer et al., 2002), implemented in the WFU PickAtlas (Maldjian et al., 2003).
To be able to draw conclusions about the meaning of quadratic trend patterns for behavioral performance (i.e., ineffectiveness, dysfunctionality), the association between the extent of quadratic trend related brain activation and performance accuracy in OHP and OLP was examined by calculating bivariate Pearson correlations between the contrast estimates in the respective significant peak voxels and the total number of CBT errors. Significance level was set to α = 0.05, two-tailed.
Structural Brain Data Analysis
Data processing
For VBM analyses, all MR structural image data were processed using the CAT12 toolbox2 in SPM123 running under MATLAB R2016a (The Mathworks, Natick, MA, United States). Before preprocessing, all structural images were inspected for artifacts and the origin of each image was set at the anterior commissure.
For preprocessing, T1 weighted images initially were spatially registered and segmented into gray matter (GM), white matter (WM) and cerebrospinal fluid (CSF) using the tissue probability maps (TPM) provided by SPM12. This procedure resulted in modulated normalized volumes reflecting the relative differences in regional GM volume. After preprocessing, a quality check was done by visual inspection of the resulting files and by positively checking the sample homogeneity using the implemented tool in CAT12. Finally, data were smoothed with a kernel of 8 mm in SPM12. Total GM volume as well as total intracranial volume (TIV) consisting of GM, WM, and CSF were estimated per subject for statistical analysis.
All GM volume analyses were assessed using the GLM as implemented in SPM12. Gaussian random field theory was applied to estimate the significance of each effect. TIV was used as globals, because it was not orthogonal to the regressors of interest. Sex and years of school education were included as covariates of no interest for all analyses. Absolute threshold for masking was set to 0.00333 (the absolute threshold of 0.1 was divided by 30, as global normalization was applied). GM volume differences between younger and older adults and between OHP and OLP were analyzed at whole-brain level and in different prefrontal ROIs using two-sample t-tests with a peak voxel significance threshold of p < 0.05 and an FWE correction for multiple comparisons (voxel level). Significant voxels of the whole-brain analysis were labeled using the Adult brain maximum probability map (“Hammersmith atlas”4; Hammers et al., 2003; Gousias et al., 2008). To account for age differences between OHP and OLP, age was included as covariate of no interest into the respective analysis. ROI analyses included the same ROIs as the fMRI analyses (see Functional Brain Data Analysis).
Relationship Between Functional and Structural Brain Data
In addition, we conducted multiple regression analyses including both functional and structural MRI data. Prefrontal GM volume was included as covariate of interest to analyze the relationship between the extent of the positive linear or quadratic patterns and prefrontal GM volume in the group of older individuals and the sub groups of OHP and OLP. To estimate GM volume in dorsolateral and ventrolateral PFC sub regions, the respective ROIs (BAs 9 and 46, as well as 44, 45 and 47) were coregistered on the preprocessed GM images (smoothed, modulated and warped). Following this, the averaged GM volume of this mask was readout for each subject and included in the statistical analysis described above. Functional ROIs were tested at a significance threshold of p < 0.05 at the voxel level with an FWE correction for multiple comparisons.
Results
Behavioral Data
The 4 (CBT load: load c, load 4, load 5, load 6) × 4 (group: YHP, YLP, OHP, and OLP) repeated measures ANOVA for the number of errors (see Figure 2) revealed significant main effects of group [F(3,66) = 61,88, p < 0.0001] and load [F(3,198) = 157,11, p < 0.001], as well as a significant group x load interaction effect [F(9,198) = 9.64, p < 0.001]. Post hoc Bonferroni-tests indicated significant differences for all groups and all load levels (p < 0.05). The results indicate a disproportionally increasing number of errors with increasing load in all groups. OLP made the most errors, followed by YLP, OHP, and YHP. Moreover, the load-related increase of error rates varied between the groups.
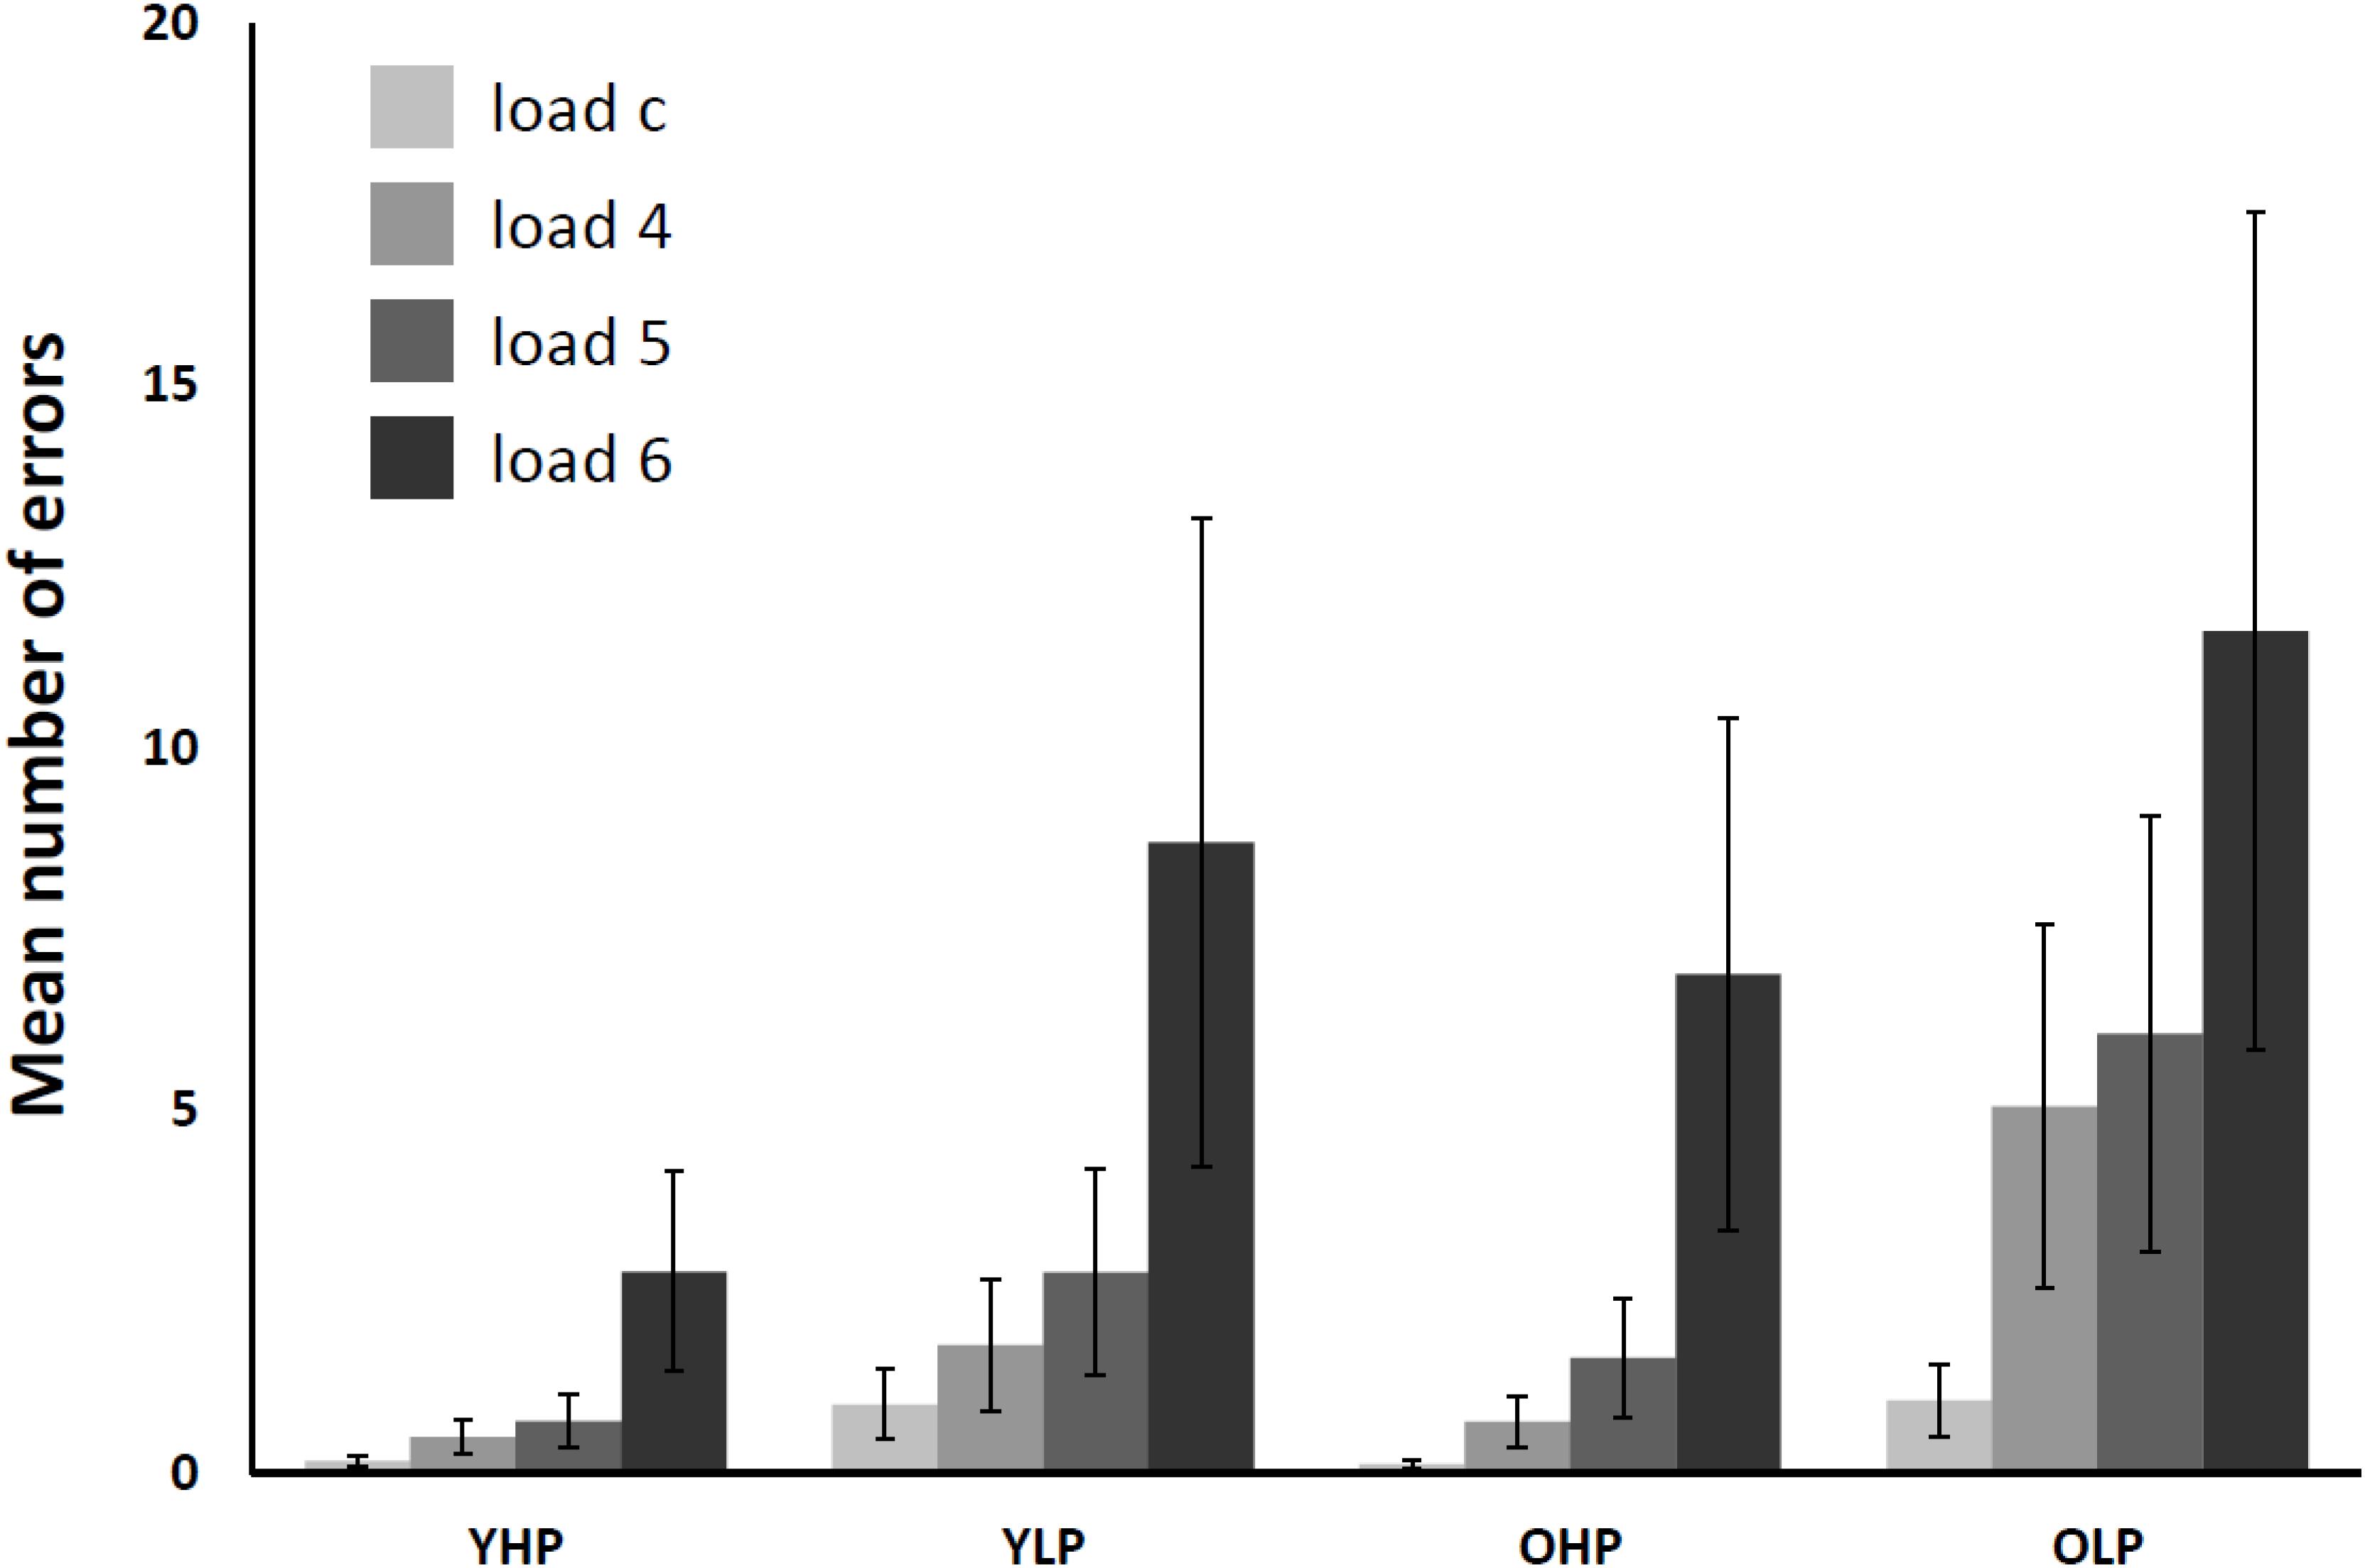
FIGURE 2. Mean number of total CBT errors in younger high-performers (YHP), younger low-performers (YLP), older high-performers (OHP) and older low-performers (OLP) for all load levels separately (displayed together with standard errors of the mean). Please note that there might be multiple errors in one single trial (i.e., one for each target block).
Functional Brain Data
Linear Trend
Results did not reveal significant positive trends at whole-brain level for OHP and OLP. For YHP, positive trend related activity was found within bilateral superior frontal gyrus and left inferior parietal lobule. For YLP, positive trend related activity was found within bilateral superior frontal gyrus (see Appendix, Table A1).
Region of interest analyses revealed significant positive trends for all four groups in different sub regions of the dorsolateral (BAs 9 and 46) and the ventrolateral (BAs 44, 45, 47) PFC. These trends indicate an efficient upregulation of neural activity with increasing task load (Table 2 and Figure 3).
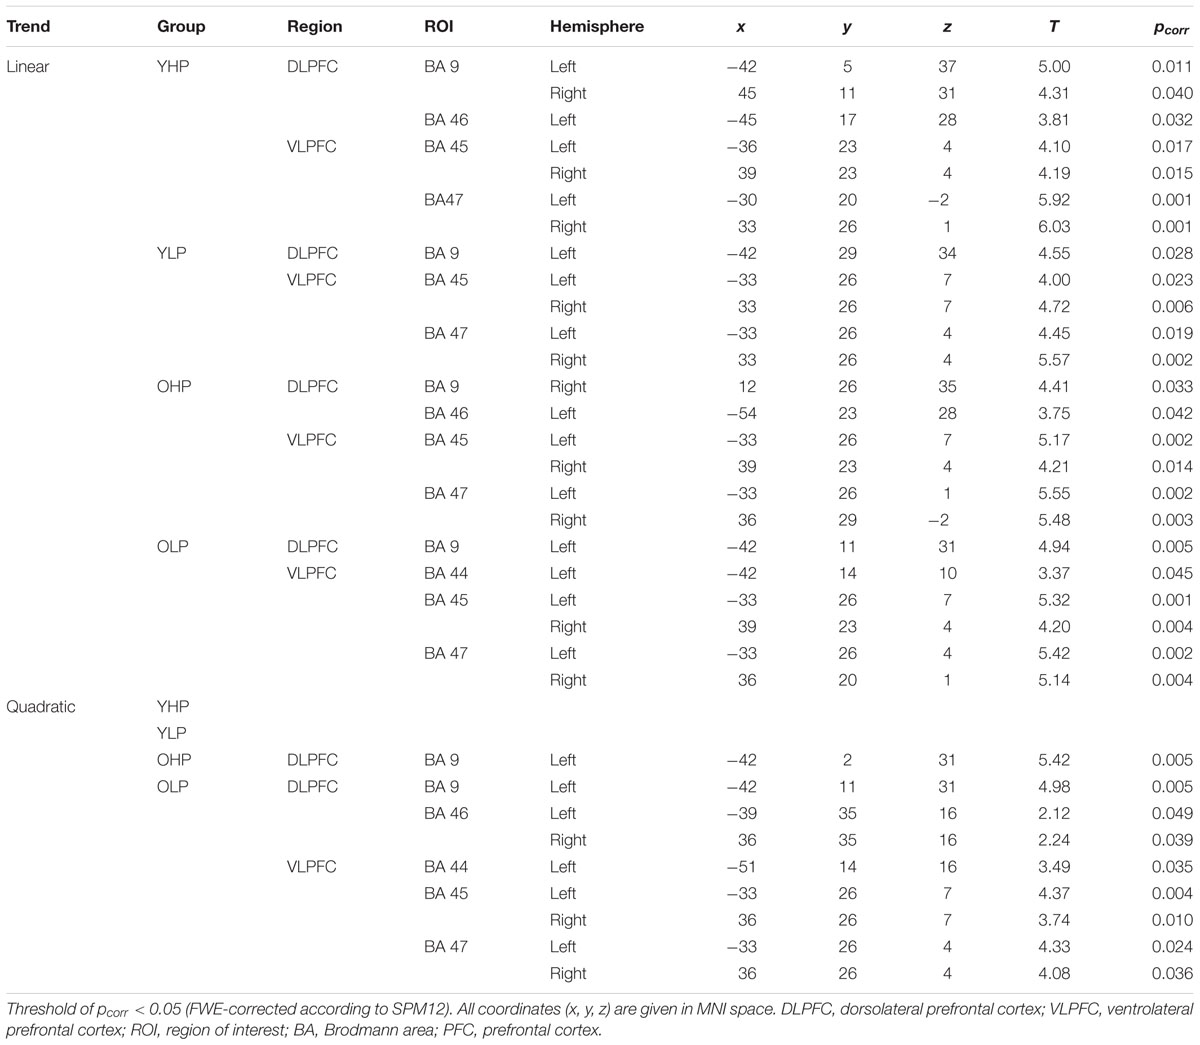
TABLE 2. Positive linear and quadratic trend associated brain activation across the four load levels in different dorsolateral and ventrolateral PFC sub regions (ROI analyses), separately for younger high-performers (YHP), younger low-performers (YLP), older high-performers (OHP), and older low-performers (OLP).
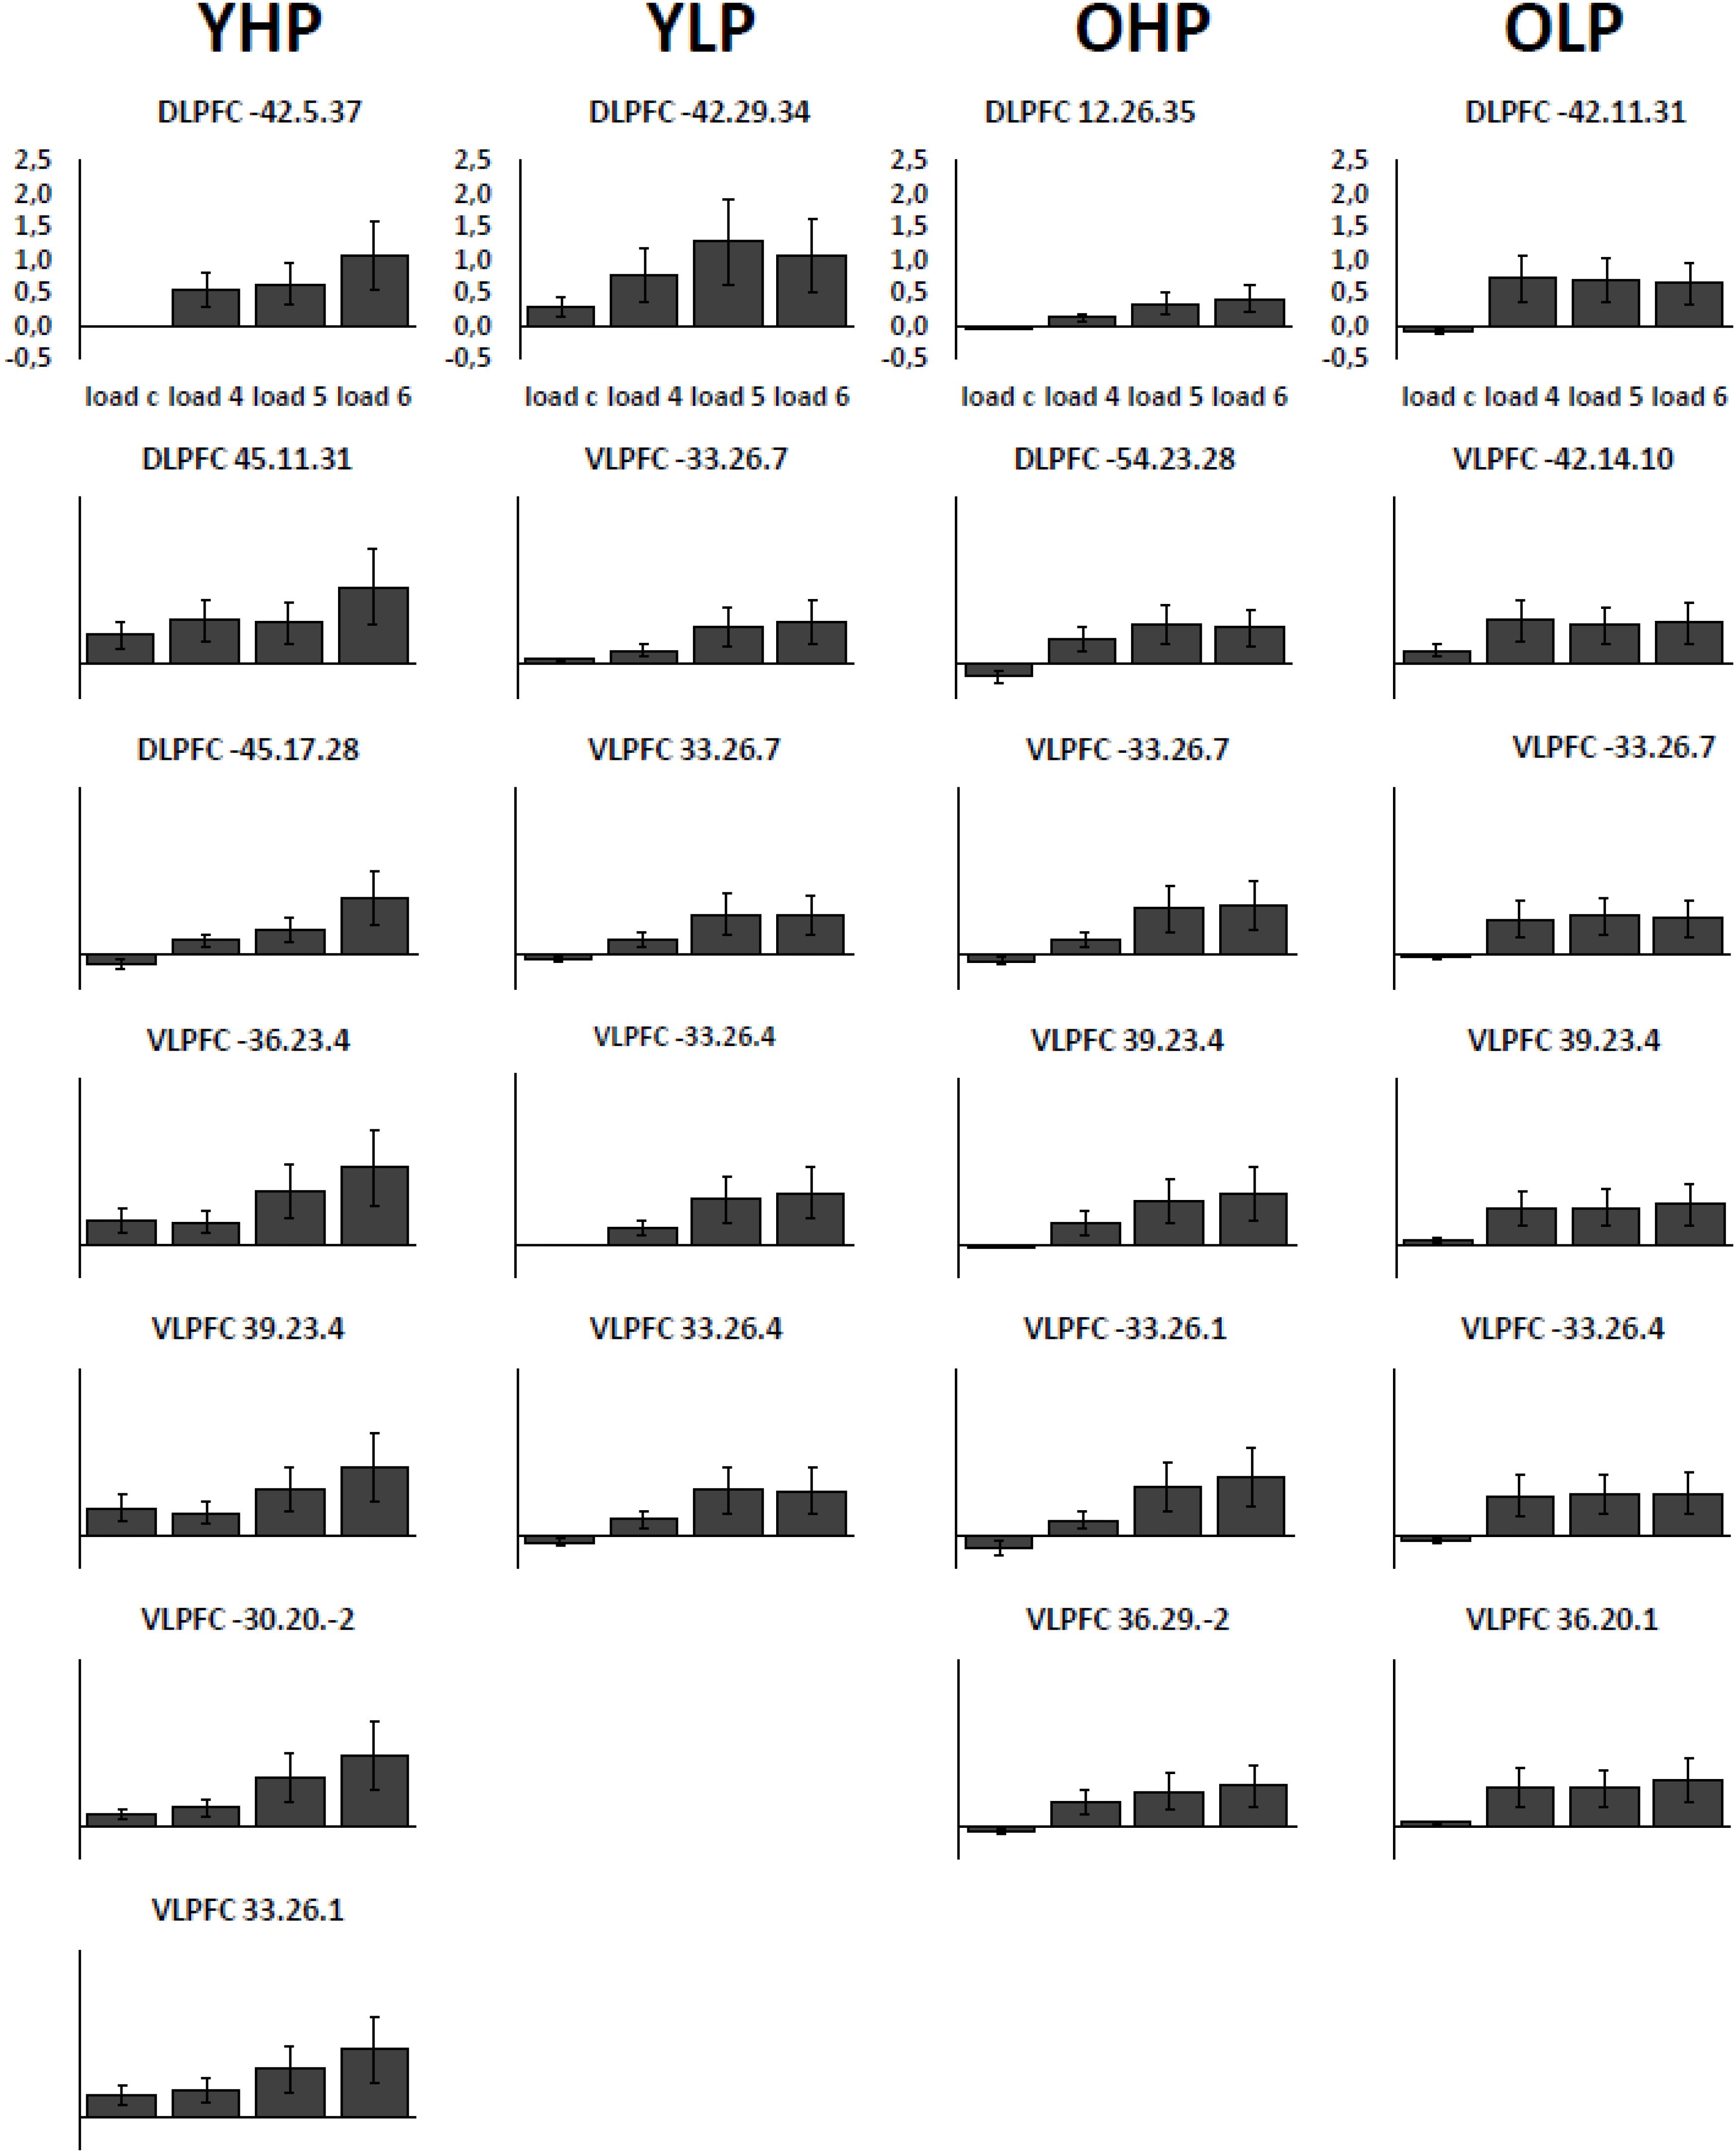
FIGURE 3. Contrast estimates with the respective standard errors of the mean for the identified regions associated with a positive linear trend. Contrast estimates are plotted for YHP, YLP, OHP and OLP for all load levels separately.
Direct statistical group comparisons indicated no linear trend related activation differences between OLP and OHP, neither at whole-brain level nor within the different ROIs. Increased linear trend related activation in younger compared to older adults was not found either, neither at whole-brain level nor within the different ROIs.
Quadratic Trend
For quadratic trend related neural activation, whole-brain analyses did not reveal significant effects in none of the experimental groups.
Region of interest analyses showed that only older adults showed quadratic trend related brain activation in different PFC sub regions at p < 0.05. These trends probably indicate a dysfunctional upregulation of neural activity with increasing task load. Whereas OHP showed a quadratic trend pattern in BA 9 of the left dorsolateral PFC (see Table 2 and Figure 4), OLP showed various quadratic patterns in multiple dorsolateral and ventrolateral PFC sub regions (left BA 9, bilateral BA 46, left BA 44, bilateral BAs 45 and 47). A comparison of the different trends in the four experimental groups is illustrated in Figure 5A.
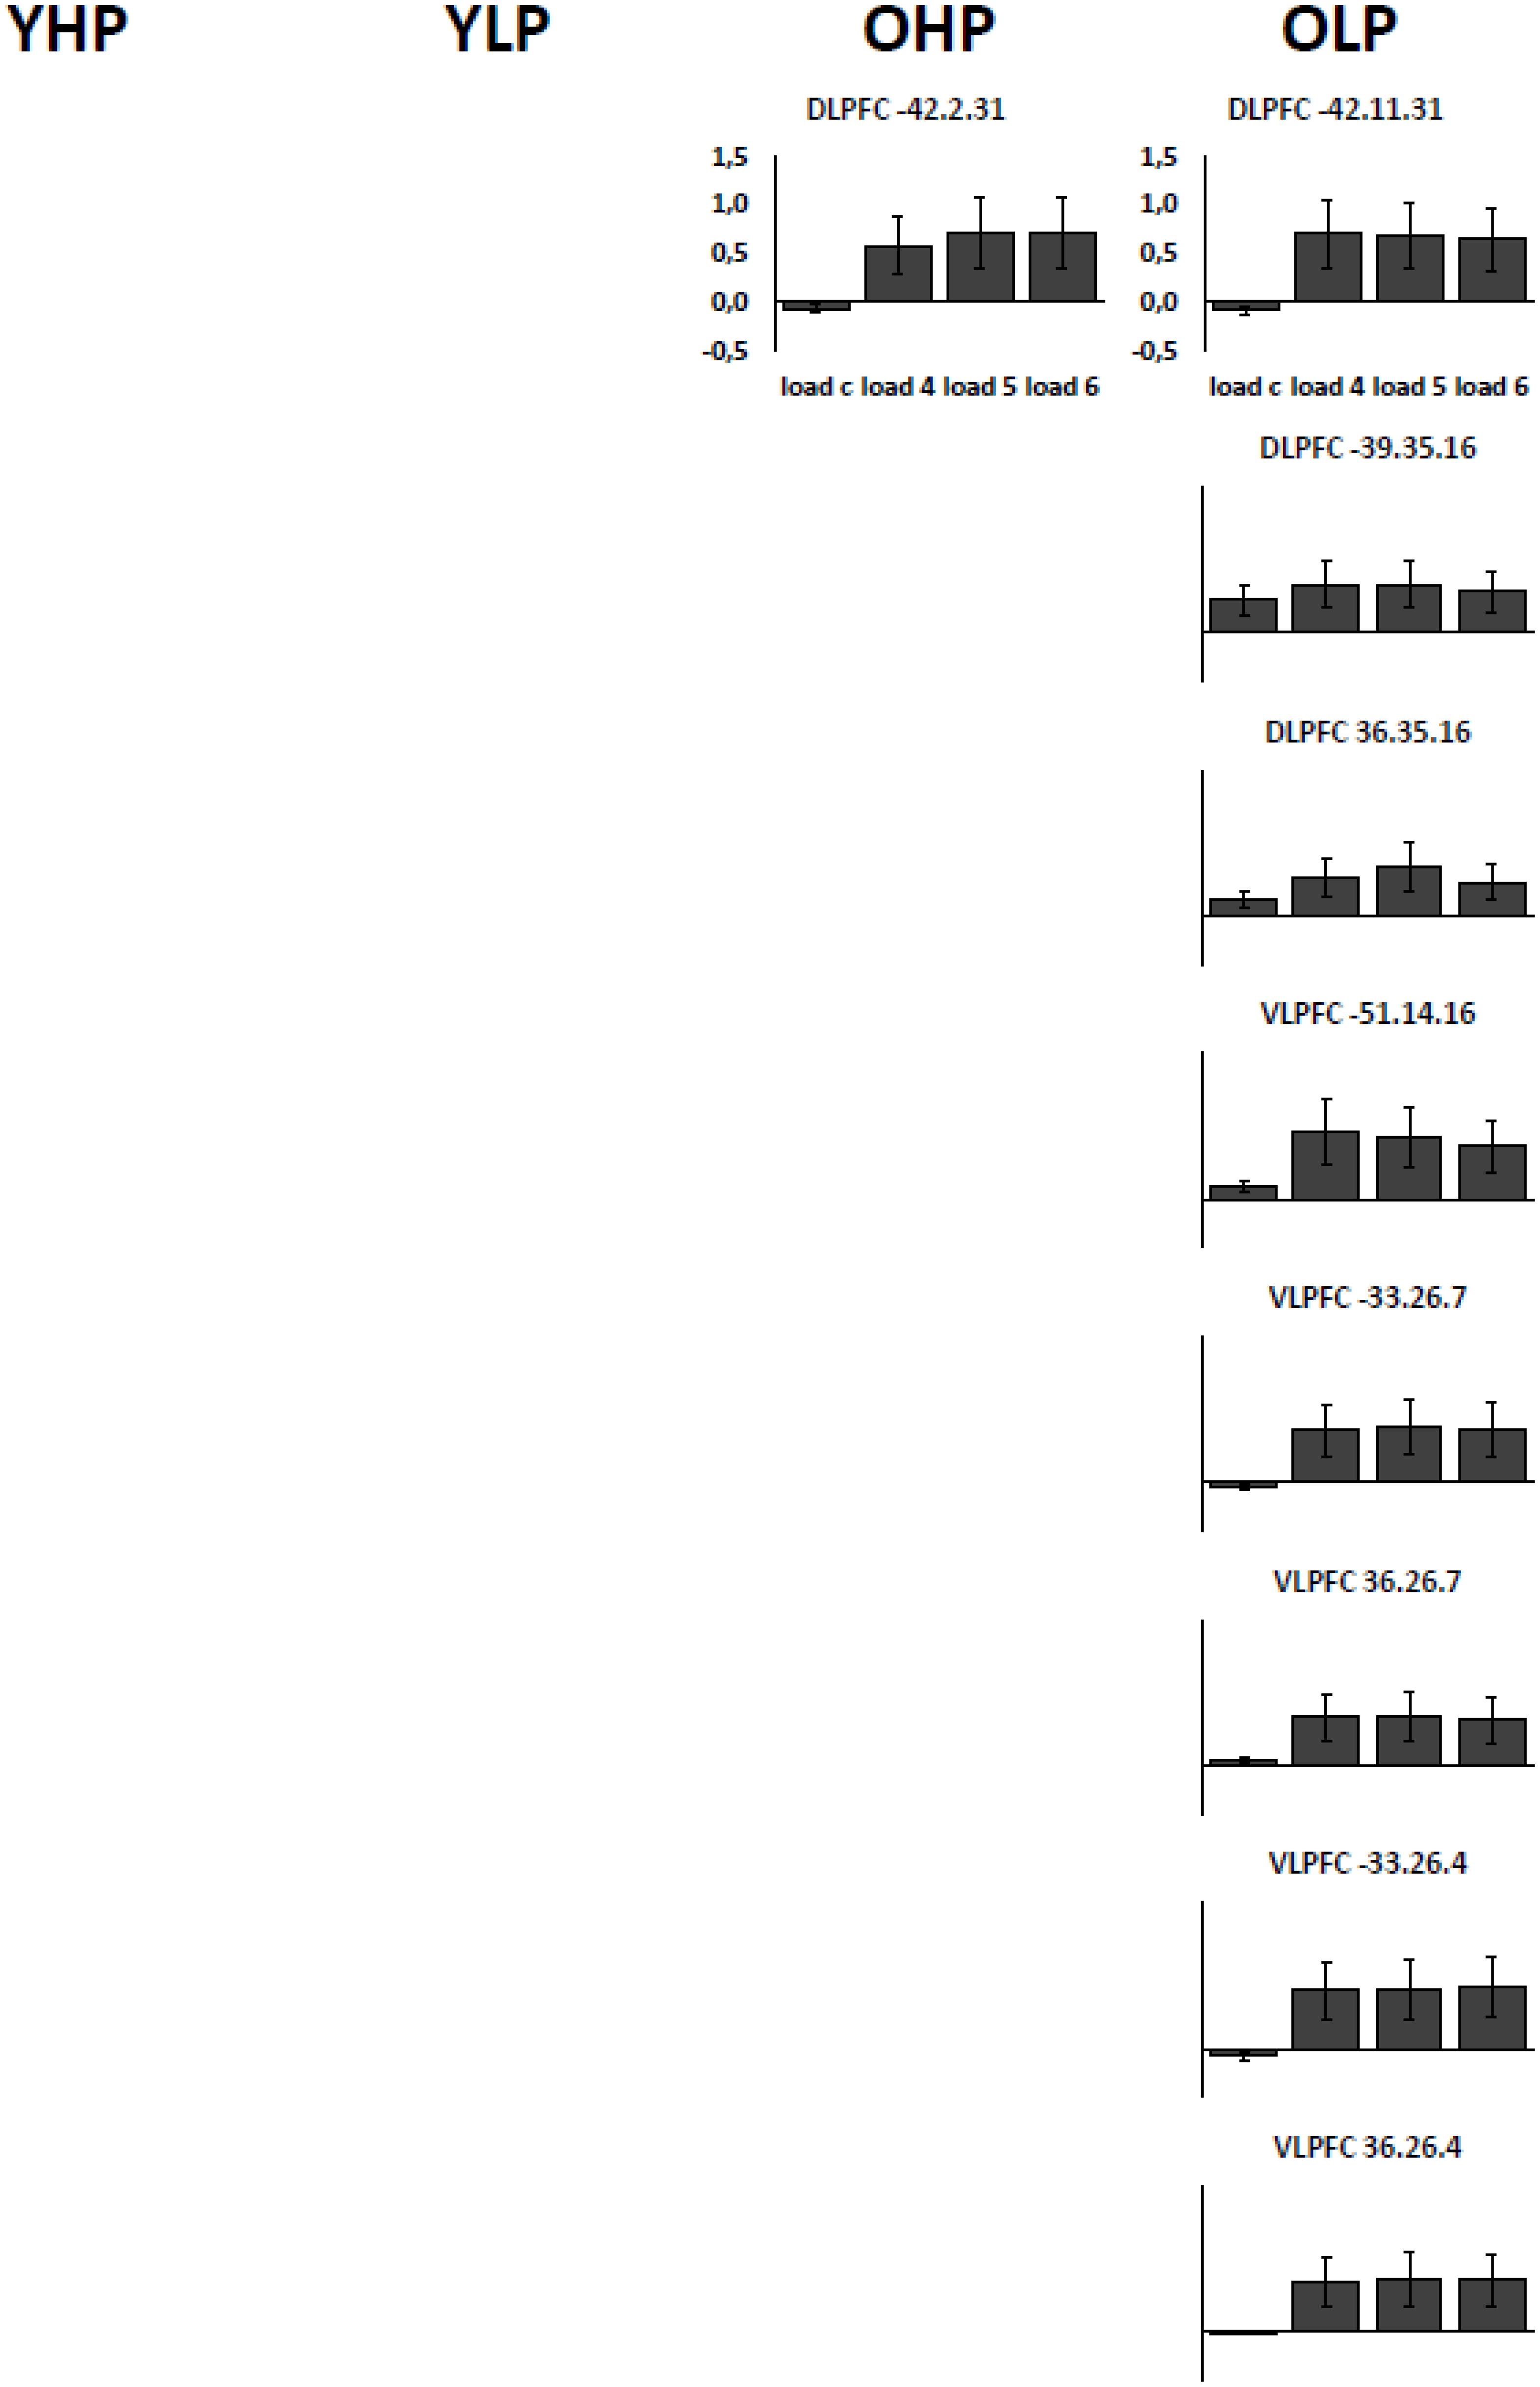
FIGURE 4. Contrast estimates with the respective standard errors of the mean for the identified regions associated with a quadratic trend. Contrast estimates are plotted for OHP and OLP for all load levels separately. YHP and YLP did not show load-related activation patterns following a quadratic trend.
At whole-brain level (see Appendix, Table A2), direct group comparisons between older and younger adults revealed that older adults showed stronger quadratic trend related activity than younger adults within different anterior and posterior brain regions (left middle frontal gyrus, left cingulum, right precuneus, and left middle occipital cortex). ROI analyses additionally showed increased quadratic trend related activation in older compared to younger adults (Table 3 and Figure 5B) within several dorsolateral and ventrolateral PFC sub regions (bilateral BA 9, left BA 46, left BA 44, bilateral BA 45 and left 47).
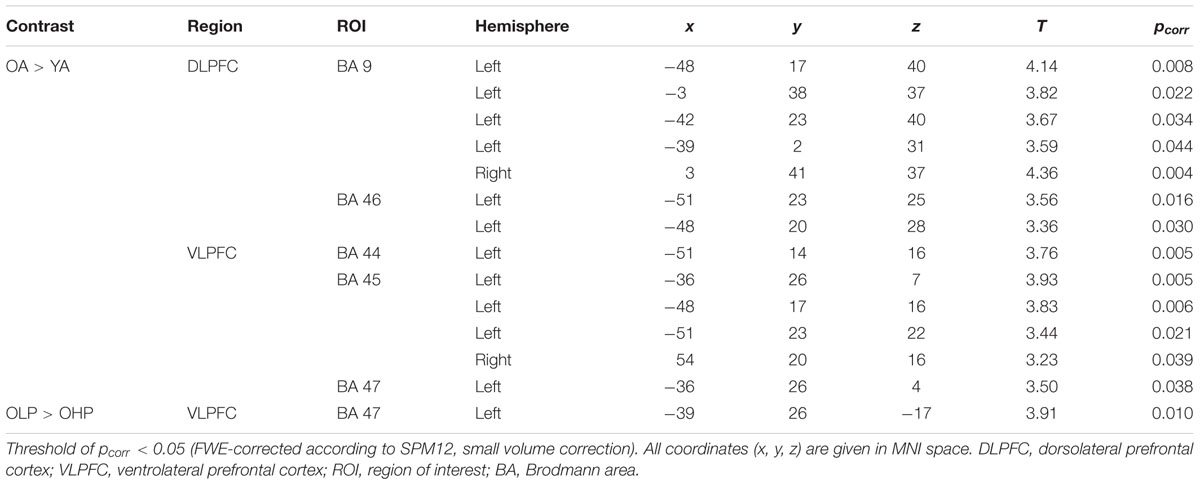
TABLE 3. Increased quadratic trend activation in older compared to younger adults and in older low performers (OLP) compared to older high performers (OHP) within different dorsolateral and ventrolateral PFC sub regions (ROI analyses).
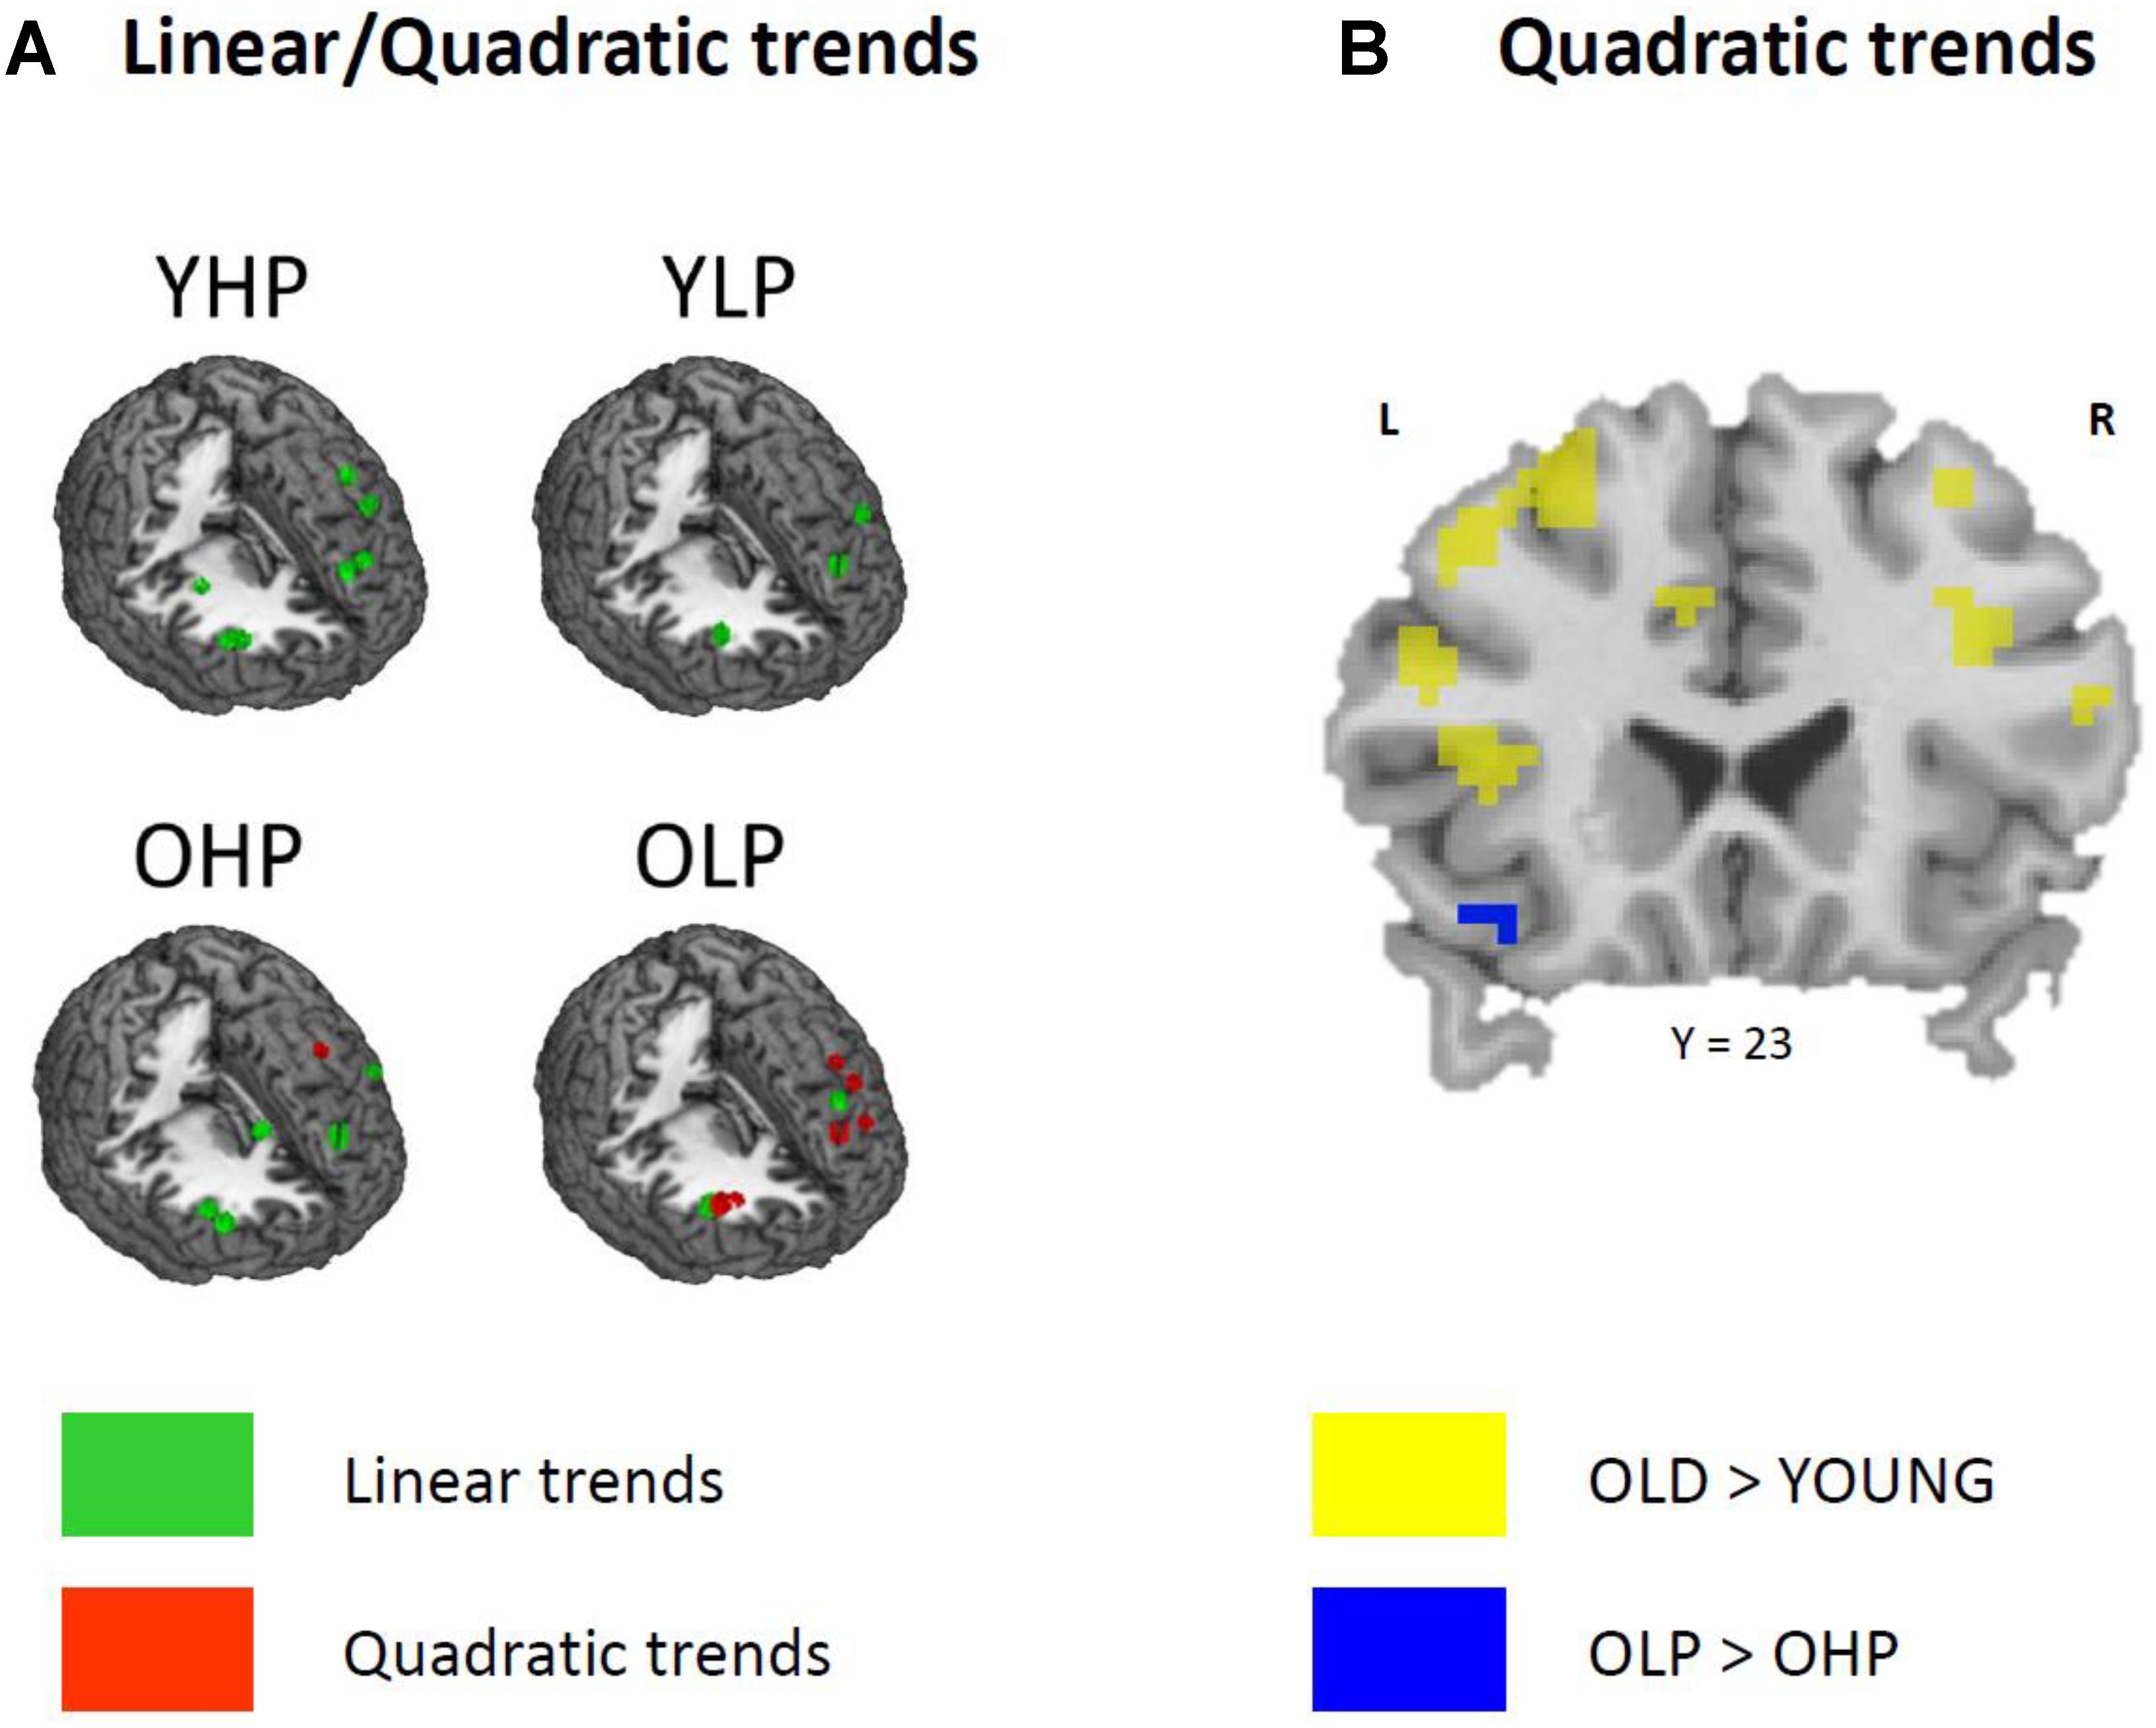
FIGURE 5. (A) Linear (green) and quadratic (red) trend related brain activation in different dorsolateral and ventrolateral prefrontal sub regions for YHP, YLP, OHP, and OLP. (B) Higher quadratic trend related activation in older compared to younger adults (yellow) and in OLP compared to OHP (blue).
Corresponding differences between OHP and OLP did not reach statistical significance at whole-brain level. ROI analyses, however, indicated stronger quadratic trend related activity in OLP compared to OHP within left BA47 of the ventrolateral PFC (Table 3 and Figure 5B).
Exploratory analyses for the opposite contrasts did not reveal significant effects in prefrontal brain regions.
Quadratic Trend × Performance Accuracy
Finally, the extent of the quadratic trend was associated with lower CBT performance accuracy in OLP, but not in OHP: Activation intensity in two of the respective peaks was positively correlated with the total number of CBT errors. Both of these peaks were located in the left dorsolateral PFC (Peak 1: MNI-coordinates -39 35 16, r = 0.540, p = 0.021; Peak 2: MNI-coordinates -42 11 31, r = 0.485, p = 0.041).
Structural Brain Data
Whole-brain analysis revealed less GM volume in older compared to younger adults in various brain regions including different parts of the PFC (see Appendix, Table A3).
Comparing OHP with OLP, whole-brain analyses yielded no significant differences. ROI analyses, however, indicated less GM volume in OLP than in OHP within left BA 46 of the dorsolateral PFC (MNI coordinates -48 39 27, T = 4.26, p = 0.011).
Relationship Between Functional and Structural Brain Data
Regression analyses did not reveal negative correlations between prefrontal GM volume and the extent of the positive linear trend for older adults. By contrast, we found negative correlations between GM volume of different dorsolateral and ventrolateral PFC sub regions and the extent of the quadratic trend for older adults, as well as for OLP and OHP separately (Table 4).
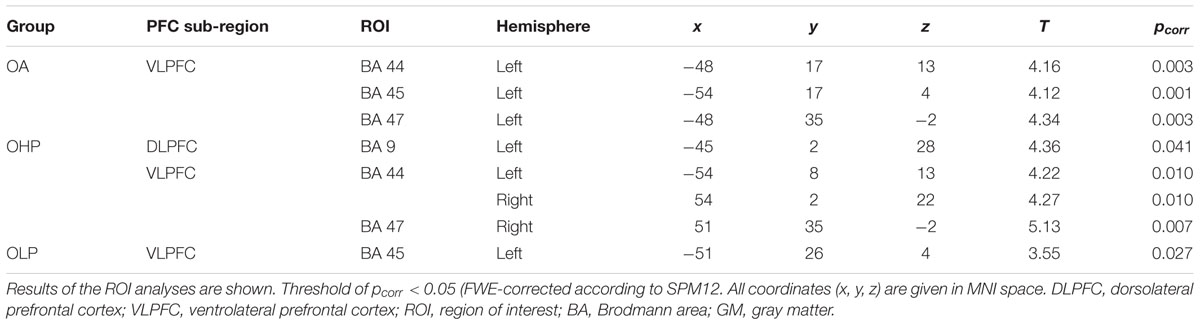
TABLE 4. Negative correlations between prefrontal GM volume and the extent of the quadratic trend in older adults (OA), older high-performers (OHP), and older low-performers (OLP).
Discussion
The results of the current study suggest that age and performance level modulate load-related neural activation in prefrontal parts of the spatial WM network. All experimental groups showed an upregulation of several dorsolateral and ventrolateral prefrontal sub regions with increasing task load (linear trends) indicating an efficient recruitment of neural resources as response to increasing WM demands, irrespective of age and performance level. Older individuals, however, additionally showed a pattern of increased activation at medium compared to low task load but stable or decreased activation at high compared to medium task load in other prefrontal sub regions as being indicated by quadratic trends. Older low-performing subjects showed this response pattern in multiple dorsolateral and ventrolateral prefrontal sub regions. The extent of this pattern was associated with reduced performance accuracy and lower prefrontal gray matter volume suggesting a regional limitation of neural resources being associated with structural deficits. The present results point toward age-related prefrontal cortex atrophy associated with possibly dysfunctional activation patterns. This reduction may first involve some dysfunctional clusters while others are unimpaired.
Behavioral Data
In line with previous findings (Nagel et al., 2009; Toepper et al., 2010b, 2014), behavioral data analysis revealed an increasing number of errors with increasing load across all participants. The different experimental groups showed accuracy differences across all load levels with younger high-performers showing the best and older low-performers showing the poorest WM performances. Moreover, analyses revealed a significant group × load interaction indicating that the increase of task load differentially affected the increase of errors in the different experimental groups. Interestingly, older high-performers showed lower error rates than younger low-performers, possibly indicating a successful compensation for higher age.
Neural Activation
Functional imaging data analyses revealed neural activation changes associated with increasing WM load in all experimental groups. Younger high-performers, younger low-performers, older high-performers and older low-performers all showed load effects in different prefrontal parts of the WM network. Indeed, all experimental groups showed an upregulation (positive linear trends) of several dorsolateral and ventrolateral prefrontal regions, indicating an efficient recruitment of neural resources as response to increasing task load. Contrary to our hypotheses, however, there were no group differences in the extent of neural upregulation, neither between younger and older adults nor between high- and low-performing seniors.
Importantly, only older individuals additionally showed quadratic trend patterns over the statistical threshold (i.e., increasing activation from low to medium task load but stable or decreasing activation from medium to high task load) which may reflect a recruitment of neural resources at lower task demands but exhausted neural resources at higher demand levels. In line with these findings, older individuals showed more quadratic trend related activation than younger individuals in multiple sub regions of the prefrontal cortex.
Whereas older high-performers showed this pattern in one cluster located in left dorsolateral prefrontal cortex, these patterns were more frequent in older low-performers (Nagel et al., 2009) affecting multiple prefrontal sub regions. As expected, the direct statistical comparison between high- and low-performing seniors revealed increased quadratic trend related prefrontal cortex activation in the latter group as well as an association between activation intensity and reduced performance accuracy.
Taken together, the results suggest specific prefrontal functional alterations with advanced age. Younger individuals show an efficient upregulation of prefrontal cortex activation to meet the requirements of increasing task load. Older individuals show similar patterns in several prefrontal sub regions but, in contrast to younger individuals, additional possibly dysfunctional patterns in other prefrontal cell clusters. Number and extent of these patterns appear to be lower in high-performing than in low-performing seniors, probably indicating a more preserved prefrontal functional integrity in the former group.
Gray Matter Volume
As expected, VBM analyses revealed reduced gray matter volume of multiple brain regions in older compared to younger individuals including pronounced differences in frontal areas. These findings are in line with previous research indicating age-related regional cortical atrophy and a specific structural vulnerability of the prefrontal cortex (Raz et al., 1997; Fjell et al., 2009). Moreover, older low-performers showed lower regional brain volume than older high-performers in the prefrontal cortex (left BA 46) confirming the relevance of this brain region for cognitive performance (Kaup et al., 2011).
Association Between Neural Activation and Gray Matter Volume
Most importantly, the results of the current work revealed a direct association between neural activation and structural integrity in older adults. As mentioned above, older adults – particularly older low-performers – showed possibly dysfunctional neural response patterns in some prefrontal sub regions as being indicated by quadratic trends. These response patterns were characterized by an increase of prefrontal activation from low to medium task load but no further increase or even a decrease of activation from medium to high task load. Our findings show that the extent of this pattern was inversely associated with regional dorsolateral and ventrolateral prefrontal gray matter volume among older individuals indicating that the dysfunctional recruitment of resources at increasing task load in older adults is related to reduced gray matter volume in the respective brain regions. Noteworthy, this structure-function relationship was found for both low- and high-performing individuals, indicating a general association between prefrontal cortical atrophy and neural prefrontal dysfunctions at higher ages. Older high-performers, however, showed the described dysfunctional neural response pattern in one cluster of the prefrontal cortex whereas this pattern was found in multiple prefrontal sub regions in older low-performers which may point toward a more preserved functional cerebral status in high-performing seniors. Confirming this assumption, quadratic trend associated activation was lower in older high-performers than in older low-performers and negatively correlated with performance accuracy only in the latter group.
Conclusion and Limitations
In conclusion, the current work provides important information about the association between age, performance level, WM load-related neural activation and gray matter integrity. Our results suggest an upregulation of prefrontal cortex activation in response to increasing WM demands in high- and low-performing younger and older individuals as reflected by increasing activation in multiple sub regions of the prefrontal cortex. Whereas results yielded no differences between the sub groups regarding this upregulation, older individuals additionally showed dysfunctional neural response patterns in other prefrontal regions, which may reflect a recruitment of neural resources at lower task demands but exhausted neural resources at higher demand levels (i.e., increasing activation from low to medium task load but stable or decreasing activation from medium to high task load). In older low-performers, these patterns were associated with both reduced performance accuracy and gray matter atrophy in different sub regions of the prefrontal cortex probably reflecting a regional limitation of neural resources associated with prefrontal structural atrophy. In older high-performers, number and extent of dysfunctional clusters was lower than in older low-performers indicating that the cognitive status of a person does not only seem to be determined by age but particularly by the functional status of the brain. In fact, the current findings support the idea of higher brain reserve in high- compared to low-performing seniors. Brain reserve is defined as an increased adaptive neuroplasticity (Freret et al., 2015) due to less impaired prefrontal hubs and enhanced prefrontal functional connectivity (Franzmeier et al., 2017a,b). Greater brain reserve may facilitate a dynamic adjustment of neural circuits to various stressors that are associated with accelerated aging (Freret et al., 2015). In this context, a stimulating lifestyle is discussed as being a neuroprotective key factor against age-related cognitive decline (Gelfo et al., 2018).
Noteworthy, older high- and low-performers differed with respect to mean age, although age was controlled in most analyses. However, even if age differences should have attenuated some of the described effects, this only confirms that higher age is associated with increased cognitive as well as functional and structural cerebral dysfunctions. Either way, the interpretation of results does not seem to be sophisticated. Future research endeavors should focus on a further connection between cognitive, functional and structural data. The association between the current results and white matter integrity, for example, might be of particular interest. In fact, some studies revealed that the structural integrity of frontal fiber tracts was related to prefrontal cortex activation and cognitive performance (Persson et al., 2006; Schulze et al., 2011). Only the methodical combination of MRI-, DTI- and behavioral measures may allow more specific conclusions regarding the mechanisms underlying age-related cognitive decline (Minati et al., 2007; Bennett and Rypma, 2013).
Author Contributions
All authors listed have made a substantial, direct and intellectual contribution to the work, and approved it for publication.
Conflict of Interest Statement
The authors declare that the research was conducted in the absence of any commercial or financial relationships that could be construed as a potential conflict of interest.
Supplementary Material
The Supplementary Material for this article can be found online at: https://www.frontiersin.org/articles/10.3389/fnagi.2018.00265/full#supplementary-material
Footnotes
- ^ http://www.fil.ion.ucl.ac.uk/spm/
- ^ http://www.neuro.uni-jena.de/vbm
- ^ http://www.fil.ion.ucl.ac.uk/spm/
- ^ www.brain-development.org
References
Bauer, E., Sammer, G., and Toepper, M. (2015a). Trying to put the puzzle together: age and performance level modulate the neural response to increasing task load within left rostral prefrontal cortex. Biomed. Res. Int. 2015:415458. doi: 10.1155/2015/415458
Bauer, E., Toepper, M., Gebhardt, H., Gallhofer, B., and Sammer, G. (2015b). The significance of caudate volume for age-related associative memory decline. Brain Res. 1622, 137–148. doi: 10.1016/j.brainres.2015.06.026
Bennett, I. J., Rivera, H. G., and Rypma, B. (2013). Isolating age-group differences in working memory load-related neural activity: assessing the contribution of working memory capacity using a partial-trial fMRI method. Neuroimage 72, 20–32. doi: 10.1016/j.neuroimage.2013.01.030
Bennett, I. J., and Rypma, B. (2013). Advances in functional neuroanatomy: a review of combined DTI and fMRI studies in healthy younger and older adults. Neurosci. Biobehav. Rev. 37, 1201–1210. doi: 10.1016/j.neubiorev.2013.04.008
Bosworth, H. B., and Schaie, K. W. (1999). Survival effects in cognitive function, cognitive style, and sociodemographic variables in the seattle longitudinal study. Exp. Aging Res. 25, 121–139. doi: 10.1080/036107399244057
Buckner, R. L. (2004). Memory and executive function in aging and AD: multiple factors that cause decline and reserve factors that compensate. Neuron 44, 195–208. doi: 10.1016/j.neuron.2004.09.006
Cabeza, R. (2002). Hemispheric asymmetry reduction in older adults: the HAROLD model. Psychol. Aging 17, 85–100. doi: 10.1037/0882-7974.17.1.85
Cappell, K. A., Gmeindl, L., and Reuter-Lorenz, P. A. (2010). Age differences in prefontal recruitment during verbal working memory maintenance depend on memory load. Cortex 46, 462–473. doi: 10.1016/j.cortex.2009.11.009
Cardenas, V. A., Chao, L. L., Studholme, C., Yaffe, K., Miller, B. L., Madison, C., et al. (2011). Brain atrophy associated with baseline and longitudinal measures of cognition. Neurobiol. Aging 32, 572–580. doi: 10.1016/j.neurobiolaging.2009.04.011
Clague, J., Reynolds, P., Henderson, K. D., Sullivan-Halley, J., Ma, H., Lacey, J. V., et al. (2014). Menopausal hormone therapy and lung cancer-specific mortality following diagnosis: the California teachers study. PLoS One 9:e103735. doi: 10.1371/journal.pone.0103735
Corsi, P. M. (1972). Human memory and the medial temporal region of the brain. Diss. Abstr. Int. 34:819.
Cushman, L. A., Stein, K., and Duffy, C. J. (2008). Detecting navigational deficits in cognitive aging and Alzheimer disease using virtual reality. Neurology 71, 888–895. doi: 10.1212/01.wnl.0000326262.67613.fe
Davis, S. W., Dennis, N. A., Daselaar, S. M., Fleck, M. S., and Cabeza, R. (2008). Que PASA? The posterior-anterior shift in aging. Cereb. Cortex 18, 1201–1209. doi: 10.1093/cercor/bhm155
Di, X., Rypma, B., and Biswal, B. B. (2014). Correspondence of executive function related functional and anatomical alterations in aging brain. Prog. Neuropsychopharmacol. Biol. Psychiatry 48, 41–50. doi: 10.1016/j.pnpbp.2013.09.001
Fjell, A. M., and Walhovd, K. B. (2010). Structural brain changes in aging: courses, causes and cognitive consequences. Rev. Neurosci. 21, 187–221. doi: 10.1515/REVNEURO.2010.21.3.187
Fjell, A. M., Westlye, L. T., Amlien, I., Espeseth, T., Reinvang, I., Raz, N., et al. (2009). High consistency of regional cortical thinning in aging across multiple samples. Cereb. Cortex 19, 2001–2012. doi: 10.1093/cercor/bhn232
Fleischman, D. A., Leurgans, S., Arfanakis, K., Arvanitakis, Z., Barnes, L. L., Boyle, P. A., et al. (2014). Gray-matter macrostructure in cognitively healthy older persons: associations with age and cognition. Brain Struct. Funct. 219, 2029–2049. doi: 10.1007/s00429-013-0622-7
Fox, N. C., and Schott, J. M. (2004). Imaging cerebral atrophy: normal ageing to Alzheimer’s disease. Lancet 363, 392–394. doi: 10.1016/S0140-6736(04)15441-X
Fozard, J. L., Vercryssen, M., Reynolds, S. L., Hancock, P. A., and Quilter, R. E. (1994). Age differences and changes in reaction time: the baltimore longitudinal study of aging. J. Gerontol. 49, 179–189. doi: 10.1093/geronj/49.4.P179
Franzmeier, N., Gottler, J., Grimmer, T., Drzezga, A., Araque-Caballero, M. A., Simon-Vermot, L., et al. (2017a). Resting-state connectivity of the left frontal cortex to the default mode and dorsal attention network supports reserve in mild cognitive impairment. Front. Aging Neurosci. 9:264. doi: 10.3389/fnagi.2017.00264
Franzmeier, N., Hartmann, J. C., Taylor, A. N. W., Araque Caballero, M. A., Simon-Vermot, L., Buerger, K., et al. (2017b). Left frontal hub connectivity during memory performance supports reserve in aging and mild cognitive impairment. J. Alzheimers. Dis. 59, 1381–1392. doi: 10.3233/JAD-170360
Freret, T., Gaudreau, P., Schumann-Bard, P., Billard, J. M., and Popa-Wagner, A. (2015). Mechanisms underlying the neuroprotective effect of brain reserve against late life depression. J. Neural Transm. 122(Suppl. 1), S55–S61. doi: 10.1007/s00702-013-1154-2
Gelfo, F., Mandolesi, L., Serra, L., Sorrentino, G., and Caltagirone, C. (2018). The neuroprotective effects of experience on cognitive functions: evidence from animal studies on the neurobiological bases of brain reserve. Neuroscience 370, 218–235. doi: 10.1016/j.neuroscience.2017.07.065
Goldstein, K. E., Hazlett, E. A., Savage, K. R., Berlin, H. A., Hamilton, H. K., Zelmanova, Y., et al. (2011). Dorso-and ventro-lateral prefrontal volume and spatial working memory in schizotypal personality disorder. Behav. Brain Res. 218, 335–340. doi: 10.1016/j.bbr.2010.11.042
Good, C. D., Johnsrude, I. S., Ashburner, J., Henson, R. N., Friston, K. J., and Frackowiak, R. S. (2001). A voxel-based morphometric study of ageing in 465 normal adult human brains. Neuroimage 14, 21–36. doi: 10.1006/nimg.2001.0786
Gousias, I. S., Rueckert, D., Heckemann, R. A., Dyet, L. E., Boardman, J. P., Edwards, A. D., et al. (2008). Automatic segmentation of brain MRIs of 2-year-olds into 83 regions of interest. Neuroimage 40, 672–684. doi: 10.1016/j.neuroimage.2007.11.034
Hammers, A., Allom, R., Koepp, M. J., Free, S. L., Myers, R., Lemieux, L., et al. (2003). Three-dimensional maximum probability atlas of the human brain, with particular reference to the temporal lobe. Hum. Brain Mapp. 19, 224–247. doi: 10.1002/hbm.10123
Hedden, T., and Gabrieli, J. D. (2004). Insights into the ageing mind: a view from cognitive neuroscience. Nat. Rev. Neurosci. 5, 87–96. doi: 10.1038/nrn1323
Holtzer, R., Rakitin, B. C., Steffener, J., Flynn, J., Kumar, A., and Stern, Y. (2009). Age effects on load-dependent brain activations in working memory for novel material. Brain Res. 1249, 148–161. doi: 10.1016/j.brainres.2008.10.009
Johnson, M. K., Mitchell, K. J., Raye, C. L., and Greene, E. J. (2004). An age-related deficit in prefrontal cortical function associated with refreshing information. Psychol. Sci. 15, 127–132. doi: 10.1111/j.0963-7214.2004.01502009.x
Kaup, A. R., Mirzakhanian, H., Jeste, D. V., and Eyler, L. T. (2011). A review of the brain structure correlates of successful cognitive aging. J. Neuropsychiatry Clin. Neurosci. 23, 6–15. doi: 10.1176/appi.neuropsych.23.1.6
Kennedy, K. M., and Raz, N. (2009). Aging white matter and cognition: differential effects of regional variations in diffusion properties on memory, executive functions, and speed. Neuropsychologia 47, 916–927. doi: 10.1016/j.neuropsychologia.2009.01.001
Lehrl, S., Triebig, G., and Fischer, B. (1995). Multiple choice vocabulary test MWT as a valid and short test to estimate premorbid intelligence. Acta Neurol. Scand. 91, 335–345. doi: 10.1111/j.1600-0404.1995.tb07018.x
Maldjian, J. A., Laurienti, P. J., Kraft, R. A., and Burdette, J. H. (2003). An automated method for neuroanatomic and cytoarchitectonic atlas-based interrogation of fMRI data sets. Neuroimage 19, 1233–1239. doi: 10.1016/S1053-8119(03)00169-1
McEvoy, L. K., Pellouchoud, E., Smith, M. E., and Gevins, A. (2001). Neurophysiological signals of working memory in normal aging. Brain Res. Cogn. Brain Res. 11, 363–376. doi: 10.1016/S0926-6410(01)00009-X
Minati, L., Grisoli, M., and Bruzzone, M. G. (2007). MR spectroscopy, functional MRI, and diffusion-tensor imaging in the aging brain: a conceptual review. J. Geriatr. Psychiatry Neurol. 20, 3–21. doi: 10.1177/0891988706297089
Moffat, S. D., Elkins, W., and Resnick, S. M. (2006). Age differences in the neural systems supporting human allocentric spatial navigation. Neurobiol. Aging 27, 965–972. doi: 10.1016/j.neurobiolaging.2005.05.011
Nagel, I. E., Preuschhof, C., Li, S. C., Nyberg, L., Backman, L., Lindenberger, U., et al. (2009). Performance level modulates adult age differences in brain activation during spatial working memory. Proc. Natl. Acad. Sci. U.S.A. 106, 22552–22557. doi: 10.1073/pnas.0908238106
Nagel, I. E., Preuschhof, C., Li, S. C., Nyberg, L., Backman, L., Lindenberger, U., et al. (2011). Load modulation of BOLD response and connectivity predicts working memory performance in younger and older adults. J. Cogn. Neurosci. 23, 2030–2045. doi: 10.1162/jocn.2010.21560
Nasreddine, Z. S., Phillips, N. A., Bedirian, V., Charbonneau, S., Whitehead, V., Collin, I., et al. (2005). The Montreal Cognitive Assessment, MoCA: a brief screening tool for mild cognitive impairment. J. Am. Geriatr. Soc. 53, 695–699. doi: 10.1111/j.1532-5415.2005.53221.x
O’Sullivan, M., Jones, D. K., Summers, P. E., Morris, R. G., Williams, S. C., and Markus, H. S. (2001). Evidence for cortical “disconnection” as a mechanism of age-related cognitive decline. Neurology 57, 632–638. doi: 10.1212/WNL.57.4.632
Park, D. C., Lautenschlager, G., Hedden, T., Davidson, N. S., Smith, A. D., and Smith, P. K. (2002). Models of visuospatial and verbal memory across the adult life span. Psychol Aging 17, 299–320. doi: 10.1037/0882-7974.17.2.299
Park, D. C., Polk, T. A., Park, R., Minear, M., Savage, A., and Smith, M. R. (2004). Aging reduces neural specialization in ventral visual cortex. Proc. Natl. Acad. Sci. U.S.A. 101, 13091–13095. doi: 10.1073/pnas.0405148101
Persson, J., Nyberg, L., Lind, J., Larsson, A., Nilsson, L.-G., Ingvar, M., et al. (2006). Structure–function correlates of cognitive decline in aging. Cereb. Cortex 16, 907–915. doi: 10.1093/cercor/bhj036
Rajah, M. N., and D’Esposito, M. (2005). Region-specific changes in prefrontal function with age: a review of PET and fMRI studies on working and episodic memory. Brain 128, 1964–1983. doi: 10.1093/brain/awh608
Raz, N., Gunning, F. M., Head, D., Dupuis, J. H., Mcquain, J., Briggs, S. D., et al. (1997). Selective aging of the human cerebral cortex observed in vivo: differential vulnerability of the prefrontal gray matter. Cereb. Cortex 7, 268–282. doi: 10.1093/cercor/7.3.268
Raz, N., Lindenberger, U., Rodrigue, K. M., Kennedy, K. M., Head, D., Williamson, A., et al. (2005). Regional brain changes in aging healthy adults: general trends, individual differences and modifiers. Cereb. Cortex 15, 1676–1689. doi: 10.1093/cercor/bhi044
Raz, N., Rodrigue, K. M., Kennedy, K. M., Head, D., Gunning-Dixon, F., and Acker, J. D. (2003). Differential aging of the human striatum: longitudinal evidence. AJNR Am. J. Neuroradiol. 24, 1849–1856.
Resnick, S. M., Pham, D. L., Kraut, M. A., Zonderman, A. B., and Davatzikos, C. (2003). Longitudinal magnetic resonance imaging studies of older adults: a shrinking brain. J. Neurosci. 23, 3295–3301. doi: 10.1523/JNEUROSCI.23-08-03295.2003
Reuter-Lorenz, P. A., and Cappell, K. A. (2008). Neurocognitive aging and the compensation hypothesis. Curr. Dir. Psychol. Sci. 17, 177–182. doi: 10.1111/j.1467-8721.2008.00570.x
Reuter-Lorenz, P. A., Jonides, J., Smith, E. E., Hartley, A., Miller, A., Marshuetz, C., et al. (2000). Age differences in the frontal lateralization of verbal and spatial working memory revealed by PET. J. Cogn. Neurosci. 12, 174–187. doi: 10.1162/089892900561814
Reuter-Lorenz, P. A., and Lustig, C. (2005). Brain aging: reorganizing discoveries about the aging mind. Curr. Opin. Neurobiol. 15, 245–251. doi: 10.1016/j.conb.2005.03.016
Rottschy, C., Langner, R., Dogan, I., Reetz, K., Laird, A. R., Schulz, J. B., et al. (2012). Modelling neural correlates of working memory: a coordinate-based meta-analysis. Neuroimage 60, 830–846. doi: 10.1016/j.neuroimage.2011.11.050
Rypma, B., Berger, J. S., and D’esposito, M. (2002). The influence of working-memory demand and subject performance on prefrontal cortical activity. J. Cogn. Neurosci. 14, 721–731. doi: 10.1162/08989290260138627
Schneider-Garces, N. J., Gordon, B. A., Brumback-Peltz, C. R., Shin, E., Lee, Y., Sutton, B. P., et al. (2010). Span, CRUNCH, and beyond: working memory capacity and the aging brain. J. Cogn. Neurosci. 22, 655–669. doi: 10.1162/jocn.2009.21230
Schulze, E. T., Geary, E. K., Susmaras, T. M., Paliga, J. T., Maki, P. M., and Little, D. M. (2011). Anatomical correlates of age-related working memory declines. J. Aging Res. 2011:606871. doi: 10.4061/2011/606871
Singer, T., Verhaeghen, P., Ghisletta, P., Lindenberger, U., and Baltes, P. B. (2003). The fate of cognition in very old age: six-year longitudinal findings in the Berlin Aging Study (BASE). Psychol. Aging 18, 318–331. doi: 10.1037/0882-7974.18.2.318
Small, S. A., Stern, Y., Tang, M., and Mayeux, R. (1999). Selective decline in memory function among healthy elderly. Neurology 52, 1392–1396. doi: 10.1212/WNL.52.7.1392
Stanziano, D. C., Whitehurst, M., Graham, P., and Roos, B. A. (2010). A review of selected longitudinal studies on aging: past findings and future directions. J. Am. Geriatr. Soc. 58(Suppl. 2), S292–S297. doi: 10.1111/j.1532-5415.2010.02936.x
Storsve, A. B., Fjell, A. M., Tamnes, C. K., Westlye, L. T., Overbye, K., Aasland, H. W., et al. (2014). Differential longitudinal changes in cortical thickness, surface area and volume across the adult life span: regions of accelerating and decelerating change. J. Neurosci. 34, 8488–8498. doi: 10.1523/JNEUROSCI.0391-14.2014
Sun, H., Ma, Y., Han, D., Pan, C. W., and Xu, Y. (2014). Prevalence and trends in obesity among China’s children and adolescents, 1985-2010. PLoS One 9:e105469. doi: 10.1371/journal.pone.0105469
Tisserand, D. J., Van Boxtel, M. P., Pruessner, J. C., Hofman, P., Evans, A. C., and Jolles, J. (2004). A voxel-based morphometric study to determine individual differences in gray matter density associated with age and cognitive change over time. Cereb. Cortex 14, 966–973. doi: 10.1093/cercor/bhh057
Toepper, M., Gebhardt, H., Bauer, E., Haberkamp, A., Beblo, T., Gallhofer, B., et al. (2014). The impact of age on load-related dorsolateral prefrontal cortex activation. Front. Aging Neurosci. 6:9. doi: 10.3389/fnagi.2014.00009
Toepper, M., Gebhardt, H., Beblo, T., Thomas, C., Driessen, M., Bischoff, M., et al. (2010a). Functional correlates of distractor suppression during spatial working memory encoding. Neuroscience 165, 1244–1253. doi: 10.1016/j.neuroscience.2009.11.019
Toepper, M., Markowitsch, H. J., Gebhardt, H., Beblo, T., Thomas, C., Gallhofer, B., et al. (2010b). Hippocampal involvement in working memory encoding of changing locations: an fMRI study. Brain Res. 1354, 91–99. doi: 10.1016/j.brainres.2010.07.065
Toepper, M., Sammer, G., and Bauer, E. (2016). Reproducibility of complex functional magnetic resonance imaging effects. J. Am. Geriatr. Soc. 64:e62. doi: 10.1111/jgs.14338
Tzourio-Mazoyer, N., Landeau, B., Papathanassiou, D., Crivello, F., Etard, O., Delcroix, N., et al. (2002). Automated anatomical labeling of activations in SPM using a macroscopic anatomical parcellation of the MNI MRI single-subject brain. Neuroimage 15, 273–289. doi: 10.1006/nimg.2001.0978
Zarahn, E., Rakitin, B., Abela, D., Flynn, J., and Stern, Y. (2007). Age-related changes in brain activation during a delayed item recognition task. Neurobiol. Aging 28, 784–798. doi: 10.1016/j.neurobiolaging.2006.03.002
Keywords: aging, working memory, load, gray matter, prefrontal cortex, resources, VBM, fMRI
Citation: Bauer E, Sammer G and Toepper M (2018) Performance Level and Cortical Atrophy Modulate the Neural Response to Increasing Working Memory Load in Younger and Older Adults. Front. Aging Neurosci. 10:265. doi: 10.3389/fnagi.2018.00265
Received: 13 October 2017; Accepted: 17 August 2018;
Published: 11 September 2018.
Edited by:
Aurel Popa-Wagner, Essen University Hospital, GermanyReviewed by:
Mercedes Atienza, Universidad Pablo de Olavide, SpainMichael Falkenstein, Leibniz-Institut für Arbeitsforschung an der TU Dortmund (IfADo), Germany
Copyright © 2018 Bauer, Sammer and Toepper. This is an open-access article distributed under the terms of the Creative Commons Attribution License (CC BY). The use, distribution or reproduction in other forums is permitted, provided the original author(s) and the copyright owner(s) are credited and that the original publication in this journal is cited, in accordance with accepted academic practice. No use, distribution or reproduction is permitted which does not comply with these terms.
*Correspondence: Gebhard Sammer, R2ViaGFyZC5TYW1tZXJAcHN5Y2hpYXQubWVkLnVuaS1naWVzc2VuLmRl Max Toepper, bWF4LnRvZXBwZXJAZXZrYi5kZQ==