 Shraddha Sapkota
 Tao Huan2
 Richard Camicioli
 Roger A. Dixon
- 1Neuroscience and Mental Health Institute, University of Alberta, Edmonton, AB, Canada
- 2Department of Chemistry, University of Alberta, Edmonton, AB, Canada
- 3Department of Medicine (Neurology), University of Alberta, Edmonton, AB, Canada
- 4Department of Psychology, University of Alberta, Edmonton, AB, Canada
Background: Among the neurodegenerative diseases of aging, sporadic Alzheimer’s disease (AD) is the most prevalent and perhaps the most feared. With virtually no success at finding pharmaceutical therapeutics for altering progressive AD after diagnosis, research attention is increasingly directed at discovering biological and other markers that detect AD risk in the long asymptomatic phase. Both early detection and precision preclinical intervention require systematic investigation of multiple modalities and combinations of AD-related biomarkers and risk factors. We extend recent unbiased metabolomics research that produced a set of metabolite biomarker panels tailored to the discrimination of cognitively normal (CN), cognitively impaired and AD patients. Specifically, we compare the prediction importance of these panels with five other sets of modifiable and non-modifiable AD risk factors (genetic, lifestyle, cognitive, functional health and bio-demographic) in three clinical groups.
Method: The three groups were: CN (n = 35), mild cognitive impairment (MCI; n = 25), and AD (n = 22). In a series of three pairwise comparisons, we used machine learning technology random forest analysis (RFA) to test relative predictive importance of up to 19 risk biomarkers from the six AD risk domains.
Results: The three RFA multimodal prediction analyses produced significant discriminating risk factors. First, discriminating AD from CN was the AD metabolite panel and two cognitive markers. Second, discriminating AD from MCI was the AD/MCI metabolite panel and two cognitive markers. Third, discriminating MCI from CN was the MCI metabolite panel and seven markers from four other risk modalities: genetic, lifestyle, cognition and functional health.
Conclusions: Salivary metabolomics biomarker panels, supplemented by other risk markers, were robust predictors of: (1) clinical differences in impairment and dementia and even; (2) subtle differences between CN and MCI. For the latter, the metabolite panel was supplemented by biomarkers that were both modifiable (e.g., functional) and non-modifiable (e.g., genetic). Comparing, integrating and identifying important multi-modal predictors may lead to novel combinations of complex risk profiles potentially indicative of neuropathological changes in asymptomatic or preclinical AD.
Introduction
Epidemiological projections point in the direction of increased worldwide prevalence and growing burden of neurodegenerative disease, especially Alzheimer’s disease (AD; Prince et al., 2015; Alzheimer’s Association, 2016; Wimo et al., 2017). Given the lack of success in developing therapeutics to reverse the course of neurodegeneration in aging after diagnosis (Cummings et al., 2014), research and clinical attention has shifted to multimodal risk detection in asymptomatic phases (Sperling et al., 2011) so as to promote early risk management or prevention (Anstey et al., 2015). Early detection of sporadic AD may require systematic attention to multiple modalities of biomarkers and risk factors, perhaps beyond (but including) the established neurobiological and clinical hallmarks of the disease (e.g., beta amyloid; Barnes and Yaffe, 2011). Accordingly, recent research has focused on testing panels, dosages, and interactions of multiple biomarkers, examining their synergistic, modifying, or complementary influences on phenotypes, pre-clinical trajectories or clinical status (Edwards et al., 2015; McFall et al., 2015a; Iturria-Medina et al., 2016; Sapkota et al., 2017; Sapkota and Dixon, 2018). Arguably, identifying perturbations in profiles of biomarkers in asymptomatic periods of impairment or AD may provide a promising opportunity for developing precision or programmatic interventions that could delay or prevent clinical diagnosis (Imtiaz et al., 2014; Hampel et al., 2017). However, translational progress may be optimized when one or more of three conditions are available: (1) a roster of established multi-modal modifiable risk biomarkers are included; (2) these risk biomarkers can be estimated with valid but relatively non-invasive technology; and (3) comparative prediction and discrimination data are available (Anstey et al., 2015; Olanrewaju et al., 2015; Casanova et al., 2016).
We adopt a multi-modal comparative approach to determining the relative importance of multiple established risk biomarkers of cognitive impairment and AD. The six AD risk biomarker clusters include: (1) novel metabolomics biomarker panels; (2) selected AD genetic risk polymorphisms (e.g., Apolipoprotein E (APOE)); (3) functional health (e.g., vascular); (4) lifestyle engagement (e.g., physical activity); (5) cognitive performance (e.g., memory); and (6) bio-demographic factors (e.g., sex). A total of 19 risk biomarkers are available for testing simultaneously in three pairwise competitive analyses conducted with machine learning technology random forest analyses (RFA). This approach identifies the predictors that contribute most significantly to the discrimination of the clinical groups. In the present study, these groups include the benchmark cognitively normal (CN) as well as mild cognitive impairment (MCI) and AD groups. The predictors vary in the extent to which they are likely to be modifiable, an important consideration for potential downstream intervention (Barnes and Yaffe, 2011; Anstey et al., 2013b, 2015; Norton et al., 2014; Livingston et al., 2017). We limited our predictors to those that are likely to require relatively non-invasive assessment techniques. Accordingly, in the present study, both metabolomics and genetic markers were developed from salivary samples. A central aim of this study was to examine the extent to which newly discovered metabolomics biomarker panels would emerge as important predictors of MCI and AD in the competitive context of a broad range of other established and relatively non-invasive AD risk factors.
Two of the present biomarker clusters are derived from salivary samples collected in the context of longitudinal study of aging. Saliva is of interest in research on biomarkers of neurodegenerative diseases and aging for several reasons. It is a premier non-invasive biofluid, easily collected and stored (Wong, 2006) and increasingly acknowledged for its potential as a source fluid for genomic, metabolomics and candidate biomarker studies (Wishart et al., 2013; Liang et al., 2015). Its viability for DNA extraction and genotyping is well established and effectively applied in genetics of aging and dementia (McFall et al., 2016; Sapkota et al., 2017). Recently, metabolomics technology has advanced such that salivary samples have provided source fluids for biomarker discovery in AD (Liang et al., 2015; Figueira et al., 2016). In our previous work, we have used salivary samples for genotyping, biomarker network and interaction analyses (McFall et al., 2016; Sapkota et al., 2017), and metabolomics-based discovery of biomarkers of impairment and AD (Zheng et al., 2012; Huan et al., 2018). Although not yet comprehensively compared across biofluid modalities, salivary biomarkers may enable better accessibility to a wider range of worldwide and diversity samples than as yet available via more traditional biofluids (blood, cerebral spinal fluid; Hu et al., 2010; Thambisetty and Lovestone, 2010; Mousavi et al., 2014; Trushina and Mielke, 2014; Liang et al., 2016; Simpson et al., 2016; Toledo et al., 2017).
The first set of biomarkers was developed in a previous salivary metabolomics analysis of CN, MCI and AD samples. Metabolomics is a global approach to detecting perturbations in metabolic pathways that can reflect early and subtle disease-related changes in the central nervous system (Kaddurah-Daouk and Krishnan, 2009). It evaluates the metabolic state of the organism. The metabolome represents the end and transitional products of interactions between genes, proteins, and the environment (Xia et al., 2013; Jové et al., 2014; González-Domínguez et al., 2015). The result of a metabolomics analysis is an empirically and quantitatively derived set of metabolites that discriminate between two clinical groups and provide targets for further analyses of mechanisms, associations and clinical applications (Mishur and Rea, 2012; Ibáñez et al., 2013; Enche Ady et al., 2017). In the present study, we assemble a set of discovered and verified discriminant metabolite panels (comprised of more than one biomarker) from a recent salivary AD metabolomics study (Huan et al., 2018). Specifically, we developed putatively identified metabolite panels discriminating CN, MCI and AD groups (Huan et al., 2018). Unique metabolite biomarker panels were developed for each pairwise comparison and all panels displayed very high sensitivity for the comparisons. The AD biomarker panel (discriminating AD from CN) was comprised of three metabolites (Methylguanosine, Histidinyl-Phenylalanine, Choline-cytidine) that were associated with the phenylalanine and histamine biosynthesis pathways (Huan et al., 2018). The AD/MCI panel was comprised of three metabolites (Amino-dihydroxybenzene, Glucosylgalactosyl hydroxylysine − H2O, Aminobutyric acid + H2) that were provisionally associated with lipid metabolism pathways1. The MCI/CN panel was comprised of two metabolites (Glucosylgalactosyl hydroxylysine − H2O, Glutamine-carnitine) and provisionally associated with carnitine synthesis, oxidation of branched chain fatty acid, lipid and fatty acid metabolism pathways2. Details of the metabolomics procedures used in the earlier study are available elsewhere (Zheng et al., 2012; Huan et al., 2018) and are summarized in the present “Materials and Methods” section.
The genetic biomarker modality was also derived from salivary samples. We selected AD genetic risk markers from an available pool with relatively known properties and application in multi-modal biomarker research (Williams et al., 2010; Karch et al., 2014; Karch and Goate, 2015; Huynh and Mohan, 2017). All four were detected in genome-wide association studies and frequently linked to AD and cognitive decline (Harold et al., 2009; Lambert et al., 2009; Chibnik et al., 2011). The four genetic markers are: APOE rs7412, (rs429358; Brainerd et al., 2011; Dixon et al., 2014; Runge et al., 2014; Mahoney-Sanchez et al., 2016), Complement receptor 1 (CR1; rs6656401; Crehan et al., 2012; Fonseca et al., 2016), Clusterin (CLU; rs11136000; Thambisetty et al., 2013; McFall et al., 2016) and Phosphatidylinositol-binding clathrin assembly protein (PICALM; rs3851179; Barral et al., 2012; Xiao et al., 2012; Ferencz et al., 2014; Morgen et al., 2014). APOE is the most established genetic risk factor for AD and is involved in lipid transport and metabolism (Liu et al., 2013). CR1 may be involved in rate of Aβ42 clearance in AD (Lambert et al., 2009). CLU has been associated with regulation of lipid transport, Aβ clearance, and brain atrophy (Karch and Goate, 2015). PICALM is involved in Aβ peptide production and connected to Aβ metabolism and plaque formation (Xiao et al., 2012).
The remaining sets of AD risk factors have been examined in observational research, reported in reviews, and linked to early AD detection and potential prevention (Livingston et al., 2017). The functional health predictor domain included three dementia-related biomarkers: pulse pressure (PP), body mass index (BMI) and gait timed walk; Qiu et al., 2003; Dahl et al., 2013; Mielke et al., 2013; Emmerzaal et al., 2015; McDade et al., 2016; McFall et al., 2016; MacDonald et al., 2017). PP, a reliable proxy of arterial stiffness has been considered a better predictor of poor vascular health compared to systolic blood pressure alone (Raz et al., 2011; Nation et al., 2013) and linked to (1) AD biomarkers in CN and AD risk (Nation et al., 2013; McFall et al., 2016); (2) MCI (Yaneva-Sirakova et al., 2012); (3) cerebral small vessel disease (Singer et al., 2014); and (4) cognitive decline (McFall et al., 2015b). Lower late-life BMI and higher mid-life BMI has consistently been linked to increased dementia risk (Emmerzaal et al., 2015). Potential mechanisms (Emmerzaal et al., 2015) include: (1) greater inflammation (Yaffe et al., 2004); (2) structural brain changes (Pannacciulli et al., 2006); and (3) higher cholesterol levels in mid-life and lower levels in late-life (Mielke et al., 2005). The lifestyle activity predictor domain included four markers of everyday engagement, with higher levels often associated with AD risk reduction and lower levels with risk elevation. A standard self-report instrument represented levels of everyday integrative cognitive, novel cognitive, physical and social activities (Deary et al., 2006; Bherer et al., 2013; Wang et al., 2013; Vemuri et al., 2014; Thibeau et al., 2017). Cognitively stimulating lifestyle activities (Vemuri et al., 2012) and physical activities (Chen et al., 2016; Falck et al., 2017) have been shown to delay AD onset. Specifically, physical activities may lead to improvements in neurogenesis as a result of increased cerebral blood flow in the dentate gyrus (Chen et al., 2016). The cognitive performance predictor domain included four measures: episodic memory (as early cognitive manifestation associated with hippocampal dysfunction), EF (Stroop, which tests the ability to inhibit cognitive interferences; Scarpina and Tagini, 2017), speed (simple reaction time, the level of which reflects slower or faster processing speed potential indicator of early normal or preclinical cognitive decline (McFall et al., 2015a), and global cognition (assessed with the Mini-Mental State Exam (MMSE)). The bio-demographic domain included age, sex and education (Li and Singh, 2014; Schneeweis et al., 2014; Jack et al., 2015; Cadar et al., 2016; Riedel et al., 2016; Sachdev et al., 2016). Age is the most important non-modifiable risk factor for developing AD with large number of sporadic AD cases occurring after 65 years (Guerreiro and Bras, 2015). Sex differences have been observed in AD with significantly higher prevalence in women than men (Mazure and Swendsen, 2016). Lifestyle experiences and choices (i.e., diet, exercise) vary by sex and may have an indirect influence on the brain over the lifespan (Mazure and Swendsen, 2016). Education has widely been used as a proxy for cognitive reserve (Tucker and Stern, 2011; Stern, 2012, 2017). Adults with higher cognitive reserve (higher education levels) may have greater tolerance to AD pathology than those with lower cognitive reserve (lower education levels; Stern, 2012).
For each of three comparative RFA prediction models we included up to 19 predictors. RFA is a machine-learning-based data exploration technique that combines large numbers of regression tree predictions from a random sample of participants and variables (Strobl et al., 2009; McDermott et al., 2017). It accommodates multiple predictors and smaller sample sizes, producing a solution that features a rank ordering of the top important predictors of the target clinical condition. The general objective was to examine and compare the extent to which new salivary metabolite biomarker panels fared in the competitive context of other AD biomarkers in predicting clinical status in pairwise comparisons across three groups: CN, MCI and AD.
Materials and Methods
Participants
Participants were community-dwelling older adult volunteers from the Victoria Longitudinal Study (VLS), an ongoing multi-cohort investigation of biomedical, genetic, metabolic, functional, neurocognitive and other aspects of aging, impairment and dementia. This study was carried out in accordance with the recommendations of the Human Research Ethics Guidelines, University of Alberta with written informed consent from all subjects. All subjects gave written informed consent in accordance with the Declaration of Helsinki. The protocol was approved by the Human Research Ethics Board. Detailed information on overall VLS recruitment, research design, and participant characteristics are available elsewhere (Dixon and de Frias, 2004; McFall et al., 2015a). For the present study, the CN and MCI participants were drawn from a subset of the main cohorts that participated in the VLS biofluid and genetics initiative (2009–2012). The AD patients were recruited from the Geriatric and Cognitive Clinic at the Glenrose Rehabilitation Hospital (Edmonton). All participants (N = 82) received a small honorarium for their contributions. The present research includes adults classified as CN (n = 35; age 64–75 years; 62.9% female), MCI (n = 25; age 64–75 years; 60% female), and diagnosed AD (n = 22; age 52–91; 72.7% female). Participant demographic characteristics are presented in Table 1.
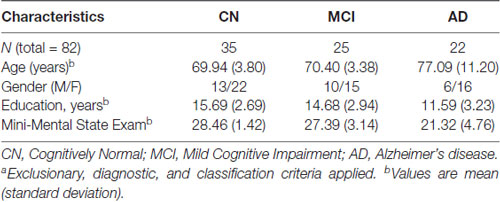
Table 1. Clinical characteristics of CN, MCI and AD groupsa.
Classification and Diagnosis
To select CN and MCI participants, we initially applied exclusionary criteria (no diagnosed dementia, cardiovascular disease, stroke history, or psychiatric illness, MMSE ≥ 24) and inclusionary criteria (two waves (4.5 years) of longitudinal data, complete data on a separate cognitive reference battery). We implemented an established and objective four-step cognitive classification procedure that requires strict adherence to specific assessment and selection rules (Dixon et al., 2007, 2014; de Frias et al., 2009; Dolcos et al., 2012; Huan et al., 2018). We conducted the full classification procedure at each of two waves (about 4.5 years apart). At both waves, eligible participants completed a five-domain cognitive battery, including measures of key domains: perceptual speed, inductive reasoning, episodic memory, verbal fluency and semantic memory. The procedure was as follows. Source participants were: (1) stratified into two age (64–73 and 74–95) and education (0–12 years and 13 + years) groups; (2) placed in appropriate age x education subgroups; (3) analyzed for mean cognitive scores on all tests; and (4) evaluated by score within respective age x education subgroups. We applied a moderate criterion to establish higher or lower (“impaired”) group based on one standard deviation below the subgroup mean for any cognitive test. For participants to be classified as CN or MCI they were required to be objectively stable in their classification at both waves (at least 4.5 years). The procedure resulted in n = 25 MCI participants, who we then matched (age, sex) with CN adults and supplemented with randomly selected additional participants (n = 35). Overall, this approach emphasizes objective and stable classification, reducing the risk of false assignments and enhancing homogeneity of the groups (Dolcos et al., 2012; Bondi et al., 2014; Dixon et al., 2014). AD patients were recruited from the Geriatric and Cognitive Neurology clinics at the Glenrose Hospital in Edmonton, Alberta. The clinical diagnosis of AD was based on the Diagnostic and Statistical Manual of Mental Disorders (4th Edition) criteria for Dementia of the Alzheimer Type. Clinical assessments were performed as part of routine clinical evaluation, which included caregiver report of cognitive decline and impaired functional status, mental status evaluation of the patient (including the MMSE and Montreal Cognitive Assessment) and a physical and neurological examination. All patients had routine laboratory assessment for causes of dementia, including blood work and brain imaging according to Canadian Consensus Guidelines (Gauthier et al., 2012). Imaging excluded significant vascular pathology; however, cerebrospinal or other amyloid biomarkers were not available. AD patients did not have vascular dementia based on a modified ischemic score >4. Medical comorbidity was recorded using the modified Cumulative Illness Rating Scale.
Salivary Samples
Salivary samples were collected and prepared according to the manufacturer’s protocol. Participants were instructed not to eat one hour before testing and light washing was permitted prior to saliva collection. One saliva sample was collected per participant. The time of day for saliva collection varied throughout across participants. At a regular point in the data collection for each participant, the saliva collection task was announced, instructions were delivered, and the device was displayed and described. As the overall procedure was not time-limited, there was sufficient time for full samples from all individuals. We used the Oragene® • DNA Self-Collection Kit OG-500 (DNA Genotek Inc., Ottawa, ON, Canada). Whole saliva was collected, placed inside the kit, and shaken. The kit contained an Oragene DNA-preserving solution. The ingredients of Oragene solution include ethyl alcohol (>24%) and Tris-HCl buffer (pH 8). As provided by established procedures, samples stored at room temperature were analyzed for DNA extraction, genotyping and the metabolomics analyses. Our previous pilot study included an analysis of five different saliva samples from CN adults collected at varying times of the day and stored at different temperatures to examine performance of the metabolomics profiling method. We observed that metabolites detected for each individual sample significantly discriminated the individuals despite small metabolite variations that may have been present for samples collected at different times of the day. In addition, there were relatively minor metabolite variations across a range of storage temperatures (room temperature, −20°C, −80°C; Zheng et al., 2012). All saliva samples were then preserved in −80°C for long-term storage and follow-up studies.
Alzheimer’s Predictors From Six Risk Domains
In this section, we describe the procedures for obtaining the risk and biomarker data. These included two AD biomarker clusters using salivary samples: (1) salivary metabolites; and (2) genetic polymorphisms. The remaining domains were: (3) functional health; (4) lifestyle activity; (5) cognition; and (6) bio-demographic. We recruited diagnosed AD patients with mild form of dementia and limited available time for the testing session than the other two groups. Thus, we reduced the cognitive and physical load of our testing sessions for them. The total number of predictors differed between the clinical status discrimination analyses because the AD group was not tested on PP, BMI and lifestyle activities.
Metabolomics Procedure and Metabolite Panel Development
The metabolomics analyses leading to the present biomarker panels were performed in a previous study (Huan et al., 2018). In the study establishing the present biomarker panels, we applied a salivary metabolomics workflow with a differential chemical isotope labeling based liquid chromatography-mass spectrometry (LC-MS) platform using dansylation derivatization for an in-depth profiling of the amine/phenol submetabolome (Huan et al., 2018). This was adapted and extended from earlier pilot work on saliva metabolome profiling (Zheng et al., 2012). Five microliters saliva sample was aliquoted out from each individual sample and labeled with 12C-DnsCl. A pooled sample was prepared by mixing small aliquots of individual samples and then labeled with 13C-DnsCl. The 12C-labeled individual sample was then mixed with 13C-labeled pooled sample in a 1:1 amount ratio after the total concentration of the labeled metabolites was determined by LC-ultraviolet. The 12C-/13C- ion pairs belonging to the labeled amine/phenol submetabolome were extracted from raw LC-MS data by a peak pair picking program, IsoMS (Zhou et al., 2014). Missing values in the ion pair list was retrieved using Zero-fill (Huan and Li, 2015a) by searching and filling in the missing values from the raw MS data. Accurate intensity ratios of the ion pairs were reconstructed by their chromatographic peak ratios using IsoMS-Quant (Huan and Li, 2015b). After the LC-MS data processing, multivariate statistical analysis of the LC-MS data was conducted using SIMCA-P + 12.0 (Umetrics, Umeå, Sweden).
The metabolite biomarker panels were determined as follows (Huan et al., 2018). Pairwise statistical comparisons used orthogonal partial least squares-discriminant analysis (OPLS-DA) and volcano plot analyses. The diagnostic power of the common metabolites that were highly ranked with both statistical tools was then evaluated by receiver operating characteristic (ROC) analysis and linear SVM model using MetaboAnalyst (Xia et al., 2012). For positive or definitive metabolite identification, the peak pairs were matched against a Dns-standards library (Huan et al., 2015) by retention time and accurate mass. In addition, putative metabolite identification was performed based on accurate mass match of the peak pairs found to the metabolites in the Human Metabolome Database (Wishart et al., 2013) and the Evidence-based Metabolome Library using MyCompoundID (Li et al., 2013), with a mass tolerance of 5 ppm.
As a final step in the discovery phase, a machine learning linear SVM tool in MetaboAnalyst (Xia et al., 2012) was used to develop a diagnostic model for each of the three pairwise comparisons with: (1) 63 metabolites discriminating AD vs. CN; (2) 47 metabolites discriminating AD vs. MCI; and (3) two metabolites discriminating MCI vs. CN. In a follow-up validation phase, the diagnostic performance was further evaluated in a small (n = 27) but independent data set drawn from the same population. Specifically, validation was tested with similarly classified or diagnosed CN (age 68–75 years, 50% female), MCI; age 67–75 years, 50% female), and AD; age 53–91 years, 71.4% female) groups (Huan et al., 2018). The final diagnostic model best discriminated: (a) AD from CN with the AD metabolite panel (Methylguanosine, Histidinyl-Phenylalanine, Choline-cytidine); (b) AD from MCI with the AD/MCI metabolite (Amino-dihydroxybenzene, Glucosylgalactosyl hydroxylysine − H2O, Aminobutyric acid + H2); and (c) MCI from CN with the MCI metabolite panel (Glucosylgalactosyl hydroxylysine − H2O, Glutamine-carinitine; Huan et al., 2018). The additive score is comprised of the sum of all the values for each metabolite in the three diagnostic models and was used as the final metabolite panel in the present clinical status prediction analyses. Higher score indicated higher metabolite concentration in the diseased group.
Genetic Markers
DNA was manually extracted from 0.8 ml of saliva sample mix using the manufacturer’s protocol with adjusted reagent volumes. Genotyping was carried out by using a PCR-RFLP strategy to analyze the allele status for APOE (rs7412, rs429358), CR1 (rs6656401), CLU (rs11136000) and PICALM (rs3851179). Genotyping was successful for the targeted SNPs for all present participants (McFall et al., 2015a). We included all three allelic combinations coded from 1 (lowest risk) to 3 (highest risk) for CR1 (G/G = 1, G/A = 2, A/A = 3), CLU (T/T = 1, T/C = 2, C/C = 3), and PICALM (C/C = 1, C/T = 2, T/T = 3). For APOE, the study sample did not include any ε2/ε4 carriers and, therefore, the remaining five allelic combinations were coded from 1 (lowest risk) to 5 (highest risk; ε2/ε2 = 1, ε2/ε3 = 2, ε3/ε3 = 3, ε3/ε4 = 4, ε4/ε4 = 5).
Functional Health
In this category we included PP, BMI and gait (timed walk) as predictors. PP was calculated with systolic minus diastolic blood pressure (McFall et al., 2016). BMI was obtained from measurements of weight in kilograms and height in centimeters. BMI was calculated by taking the weight in kilograms divided by the square of one’s height in meters (kg/m2; MacDonald et al., 2011; Besser et al., 2014). A timed walking test was used to measure gait speed for all participants. The CN and MCI groups began the walking task from a standing position, a standard procedure for individuals with no mobility or dementia concerns. Specifically, the CN and MCI groups were measured by asking participants to walk a distance of 3 m, turn around, and walk back (MacDonald et al., 2017). AD patients began the task from a sitting position in an arm chair (i.e., the Timed Up and Go Test, a standard task in dementia research). Participants were seated in an armchair, and asked to get up and walk 3 m, turn around, walk and sit back in the chair. The time taken to complete this task was measured with a stopwatch in seconds. PP, BMI and timed walk were included as continuous variables.
Lifestyle Activity
The commonly used VLS Activity Lifestyle Questionnaire has 67 items measuring seven types of lifestyle engagement (Hultsch et al., 1999; Dolcos et al., 2012; Small et al., 2012) From the full inventory, we extracted items (n = 50) associated with the key dementia-related lifestyle aspects (cognitive, physical, and social). We evaluated two types of cognitive activities: (1) integrative information processing measured (n = 12) such as playing a musical instrument or household repairs, and (2) novel information processing (n = 27) such as completing jigsaw puzzles or reading the newspaper (Runge et al., 2014; Sapkota et al., 2017). Physical activity (n = 4) included jogging or gardening (Thibeau et al., 2017). Social activity (n = 7) included volunteering or visiting friends (Brown et al., 2016). The frequency of participation is rated on a 9-point scale with never (0), less than once a year (1), about once a year (2), 2 or 3 times a year (3), about once a month (4), 2 or 3 times a month (5), about once a week (6), 2 or 3 times a week (7), and daily (8). All the items were summed for each domain with higher scores representing greater frequency of activity (e.g., Small et al., 2012; Runge et al., 2014; Sapkota et al., 2017; Thibeau et al., 2017).
Cognition
The cognitive performance domain was represented by four standardized tests covering key aspects of performance known to be associated with differential normal and impaired aging, as well as dementia. First, to represent memory we used the standard VLS Word Recall task (Dixon and de Frias, 2004). From a pool of six equivalent lists, two different but comparable lists of 30 English words (i.e., six taxonomic categories with five words each) were used. Participants were given 2 min to study the list and 5 min to write down their answers. The total numbers of words correctly recalled from each list was averaged and used as the final score (Josefsson et al., 2012). Second, to measure EF (inhibition) we used the Stroop test (Scarpina and Tagini, 2017). This test consists of the standard three parts (Parts A, B and C), with the measures based on latencies. The score is the standardized Stroop interference index ([Part C− Part A]/ Part A), with a lower index reflecting better performance (MacLeod, 1991; de Frias et al., 2009; Diamond, 2013). Third, to measure speed we used the SRT task (Dixon et al., 2007). In this computer-based nonverbal response time task participants press a key on the response console with the index finger of their dominant hand at every occurrence of the target stimulus as quickly as possible. Response latencies were recorded to a precision of ±1 ms as the final score (McFall et al., 2015a). Fourth, for global cognition, we used examined the MMSE (Folstein et al., 1975), which measures performance on a scale of 0–30.
Bio-Demographic
The VLS personal data inventory was used to determine type and level of demographic risk (Anstey et al., 2013a; Sachdev et al., 2016). We examined education (total number of school years; Amieva et al., 2014; Cadar et al., 2016), age (in years; Small et al., 2011; Papenberg et al., 2015), and sex (male vs. female; Altmann et al., 2014; Li and Singh, 2014; McDermott et al., 2017).
Statistical Analyses
RFA is a machine learning technology that applies a nonparametric approach to assess a large number of predictors in both complex and small data sets (Strobl et al., 2009; Kuhn and Johnson, 2013). These applications include biomarker predictions related to AD (Kaup et al., 2015; McDermott et al., 2017). We used RFA from the Party package (Hothorn et al., 2005) in RStudio version 1.0.136 (2017). The analysis combines regression trees based on a random selection of participants and variables. The regression trees are all combined and then used to rank variables according to their importance in predicting an outcome. The RFA party package accounts for any potential correlated predictor variables (Strobl et al., 2009). Any missing values were imputed using the missForest package (Stekhoven and Bühlmann, 2012). All the forests in our analyses examined 5,000 trees and a random sample of 10 predictors was tested at each potential split. The analyses ranked relative predictive importance based on standard statistical operations and procedural recommendations (Strobl et al., 2009). The metric for these rankings is termed “variable importance,” which specifies how important each factor is in discriminating two groups relative to all other factors in the model. Goodness of model fit for each RFA analyses was examined with area under the ROC curve (C-statistics). The C-statistic ranges from 0.50 to 1.00 can be interpreted as equivalent to the Area under the Curve in a ROC analysis where higher values are associated with better predictive models. Any variables with negative, zero, or small positive values are determined as not important predictors; these are represented to the left of the vertical dashed line. Variables right of the vertical dashed line with high positive values are considered to be important predictors (Strobl et al., 2009).
RFA was used to determine the most important predictors for discrimination in three pairwise groups (AD vs. MCI, AD vs. CN, MCI vs. CN). First, we tested which of the 13 risk factors were the most important predictors for discriminating clinical status for: (1) AD vs. CN and (2) AD vs. MCI. Second, we tested which of the 19 risk factors were the most important predictors for discriminating clinical status for (3) MCI vs. CN.
Results
Across the three multi-modal prediction analyses, we observed significant discrimination for the pairwise comparisons of the three clinical groups with predictors from the six AD biomarker risk domains (see Figure 1). First, for the AD vs. CN analysis, three important discriminative predictors were identified (C-statistic: 1.00). As shown in Figure 1A, the top predictors included two cognitive measures (speed and memory) and the AD metabolite panel. Specifically: (1) poorer memory performance; (2) slower speed performance; and (3) higher levels (greater risk) of the AD metabolite panel discriminated AD from CN group at a high level of importance. Second, for the AD vs. MCI analysis the same two cognitive predictors and the AD/MCI metabolite panel were identified as important predictors (C-statistic: 0.99). As can be seen in Figure 1B, A different order of importance was observed: (1) slower speed performance; (2) poorer memory performance; and (3) higher levels (greater risk) of the AD/MCI metabolite panel were the most important factors discriminating the AD and MCI groups. Third, as shown in Figure 1C, in the MCI vs. CN analysis, seven of the 19 predictors were identified as important in discriminating the groups (C-statistic = 0.94). Notably, the seven predictors represented five (of the six) risk domains (see Figure 1C). Specifically, the most important predictors for discriminating MCI from CN were: (1) higher PP; (2) higher levels of the MCI metabolite panel; (3) poorer memory performance; (4) lower frequency of novel cognitive activity; (5) elevated APOE risk; (6) decreased social activity; and (7) lower MMSE score.
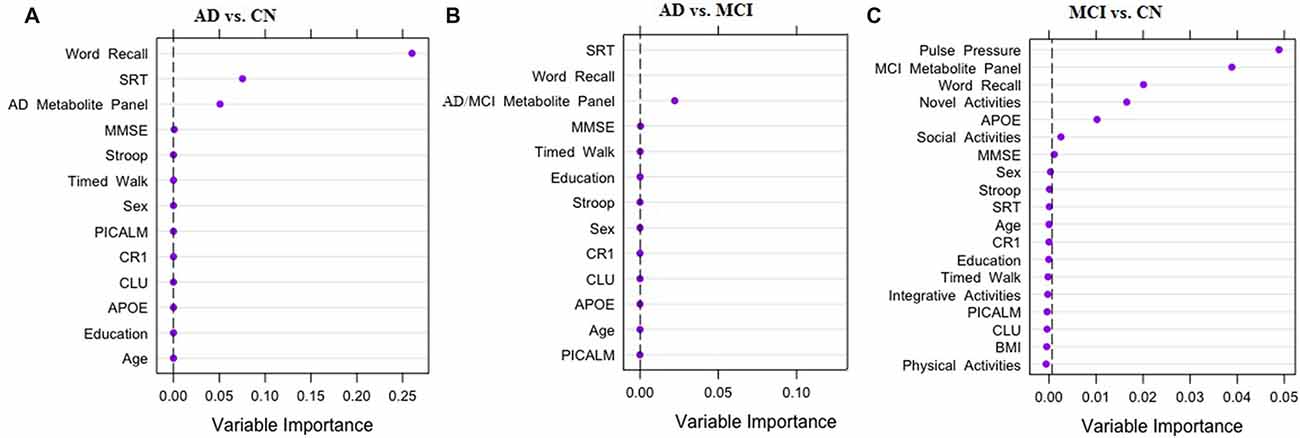
Figure 1. Results of random forest analyses (RFA) for three pairwise comparisons. The three panels of the figure display strongest predictors for discriminating clinical status: (A) Alzheimer’s disease (AD) vs. Cognitively Normal (CN); (B) AD vs. Mild Cognitive Impairment (MCI); (C) MCI vs. CN. Dashed black line is the cut off for variable importance in discriminating clinical status relative to other factors in the model. APOE, Apolipoprotein E (rs7412, rs429358); CR1, Complement receptor 1 (rs6656401); CLU, Clusterin (rs11136000); PICALM, Phosphatidylinositol-binding clathrin assembly protein (rs3851179); BMI, Body Mass Index; SRT, Simple Reaction Time; MMSE, Mini-Mental State Exam.
Discussion
We examined and compared neurodegenerative disease status predictions by selected modifiable and non-modifiable AD risk factors representing six prominent modalities. The relative prediction patterns were examined for the pairwise discrimination of the three groups (CN, MCI and AD). An important aim was to test the extent to which recently discovered salivary metabolomics biomarker panels (Huan et al., 2018) would perform in the competitive context of other biomarkers and risk factors of AD. Given the dynamic, insidious and multi-factorial nature of AD, it is likely that multiple modalities of risk biomarkers may contribute to the diagnosis of the disease. A corresponding emerging interest is in determining viable combinations of predictors for use in timely (early) detection and targeted (precise) intervention. Our results supported both the multi-modal predictor expectation and the potential valuable role that salivary-based biomarkers discovered through metabolomics analyses may play in identifying important components of AD biomarker batteries.
In our earlier metabolomics analyses, we detected salivary metabolite panels that were most accurate in discriminating the three groups (Huan et al., 2018). In this study, we examined how these panels performed in discriminating these groups in the competitive context of other known AD biomarkers or risk factors. In each of the three pairwise comparisons, the RFA results showed that the relevant metabolite panel was among the top important predictors. In fact, the AD and AD/MCI metabolite panels and the same two cognitive performance measures—i.e., speed and memory—in a different order discriminated AD from CN and AD from MCI. For the AD-CN comparison, the important predictors were memory, followed by speed and the AD metabolite panel. The AD metabolite panel represents pathways involved in AD protein regulation (Huan et al., 2018). For the AD-MCI comparison, speed and memory were among the most important predictors, and the associated AD/MCI metabolite panel also contributed at an important level. Dipeptides identified in both the AD metabolite panel and AD/MCI metabolite panel may reinforce the role of protein dysregulation in AD as a result of degraded proteins from amyloid or tau (Huan et al., 2018). Memory decline and impairment is a cardinal marker of preclinical dementia and is described as an oft-reported clinical symptom of aging and impairment (McKhann et al., 2011). Poorer memory performance in AD is consistent with key memory-related structural changes observed in the aging and impaired brain (Bartsch and Wulff, 2015). Specifically, hippocampal atrophy rates are comparatively greater in MCI than CN older adults and whole brain atrophy rates are greater in AD patients than MCI (Henneman et al., 2009). Slower speed performance has shown to be an early marker of lower and steeper cognitive decline (McFall et al., 2015a) and may be associated with poorer executive functioning and memory performance as well as increased dementia risk (Bäckman et al., 2005). Slower speed performance is also positively correlated with white matter tracts especially in the parietal and temporal cortices, and the left middle frontal gyrus (Turken et al., 2008).
Much attention in recent years has been on the detection of early signs—and their biomarker predictors—of transitions from CN to mildly impaired aging (Albert et al., 2011; Brainerd et al., 2013). Recently, this transition has also been investigated with unbiased metabolomics procedures (Zheng et al., 2012; Figueira et al., 2016; Liang et al., 2016; Huan et al., 2018). Two related challenges are that: (1) neither group is diagnosable with AD and (2) the exact probabilities of individual future conversion to AD are unknown. Moreover, both groups are likely to be in fluctuant, even overlapping, states of brain and cognitive aging—as indicated by the phenomenon of reversion (Manly et al., 2008; Koepsell and Monsell, 2012). Reviews of this challenge have led to the recommendation that multiple biomarkers and longitudinal data are advisable for differential classification. In the present study, these two groups were exactingly and objectively classified based on longitudinal data. Specifically, both groups were comprised of participants who were independently classified in status on two separate waves (about 4 years apart), underscoring the validity of the CN classification and the chronicity of the cognitively impaired classification. Our results reflect the challenge and relevance of considering multiple modalities of risk, and the apparent validity of carefully characterized groups. The RFA results showed that seven factors (representing five modalities) were found to be important predictors of impairment. The important predictors in order of significance were PP, MCI metabolite panel, memory, novel activities, APOE, social activities and MMSE. Elevated PP has been linked to cognitive impairment in MCI potentially in association with large artery stiffness (Yaneva-Sirakova et al., 2012; McFall et al., 2016). Our previously discovered MCI metabolite panel was the second important predictor of MCI status. This panel could be used in future targeted studies focusing on the differences and early markers of early memory impairment, as distinguished from normal memory decline. Notably, we employed a broad performance-based classification scheme that complements the standard clinical approach to MCI classification (Petersen et al., 2014). Two aspects of lifestyle activities—specifically, lower frequency of novel cognitive activities and decreased social engagement—predicted MCI group membership, in the context of the CN benchmark. The discriminative associations for these markers were in the expected direction, indicating that poorer lifestyle activities predicted probability of cognitive impairment (Verghese et al., 2006; Hughes et al., 2013). As previously reported in the literature (Brainerd et al., 2011; Dixon et al., 2014), AD genetic risk, as represented by APOE ε4+ genotypes predicted membership in the cognitive impairment group, in the context of the CN benchmark. Finally, poorer global cognition in the MCI group, an indication of future risk of dementia (O’Bryant et al., 2008), suggests that the MCI group maybe on an accelerated path to dementia onset compared to the CN group.
Overall, the results are consistent with the general perspective that risk markers from multiple modalities contribute to the prediction, classification or diagnosis of cognitive statuses such as MCI and AD. The results are also consistent with our expectation that new metabolite panels, derived from salivary metabolomics analyses, can be confirmed as among the better predictors of clinical status—but not the only predictor, especially for the crucial discrimination of CN and the impairment group. Along with notable strengths, we acknowledge several limitations. First, as a function of leveraging our earlier metabolomics study, our present sample sizes are relatively small. Although not perfect, this fact is statistically accommodated in the machine learning prediction analyses we used. Specifically, RFA are well suited to deal with small sample sizes because a large number of trees can be used in RFA models (Strobl et al., 2009). Larger number of trees allows for a large variety of predictor variable combinations to account for small sample sizes. Moreover, RFA outperforms other non-machine learning techniques (i.e., regression, and factor analysis) in that it accommodates: (1) small samples size in highly complex datasets (Maroco et al., 2011); (2) highly correlated datasets; and (3) large number of regression trees with specified set of predictors. The latter compensates for power issues as frequently observed in other statistical models with small sample sizes. We take the average of all 5,000 trees to employ a bagged variable importance measure—a procedure that leads to more stability and reduces the risk of over-fitting of the data. Nevertheless, some over-fitting of prediction models may occur, so further validation research is recommended. We specifically recommend follow-up validation studies, appropriate statistical evaluation, and larger sample sizes. Second, we deliberately incorporated a large number of predictors from multiple modalities—and all are established in a variety of independent research projects—but not all possible and potentially relevant predictors were included. For example, future research should include other standard AD biomarkers, such as cerebrospinal fluid β-amyloid (1–42), total tau, and phospho-tau-181 (Humpel, 2011), as well as other AD-specific neuroimaging biomarkers (e.g., hippocampal volume). Third, in order to more broadly generalize our results, we recommend studies recruit samples that are more demographically diverse, include alternative biospecimens or validate with autopsy confirmed AD cases. As noted, the metabolite panels used here were established in previous metabolomics research using the same groups. Future validation work would also benefit from targeting and testing these panels in different populations.
We tested a multi-modal array of risk biomarkers for their relative predictive power in discriminating three clinical status groups. This provides empirical evidence confirming the view that such multi-modal approaches can be valuable in research on neurodegenerative disease. In addition, the results also confirm that metabolomics procedures can produce biomarker panels that have relevance in the competitive context of other known risk factors for AD. Future work should examine such novel metabolite panels in the context of additional AD biomarkers. The results also show that modifiable risk factors can be important predictors of clinical status, even in the context of biomarkers from metabolomics and genomic approaches. At present, they appear to be especially relevant for the crucial discrimination of normal and impaired groups. The overall results lead to indications of potential use for validation and translation of non-invasive metabolite panels in pertinent combinations with established multi-modal biomarkers for early dementia risk detection and intervention programs. Early and precise risk detection can lead to personalized risk management and other intervention strategies for older adults at elevated risk for AD (Barnes and Yaffe, 2011; Anstey et al., 2014; Olanrewaju et al., 2015).
Data Availability
Datasets are available upon request from the corresponding authors.
Author Contributions
RD is the director of the VLS and was responsible for all data and sample collection. RD and SS designed and planned the present research and statistical analyses. SS and TH assembled and validated the data set. LL is the director of the metabolomics lab and led TH, TT and JZ in performing the metabolomics analyses that contributed the metabolite biomarker panels. SS performed the data assembly and the present statistical analyses, with contributions from RD and TH. SS wrote the drafts of the article, with assistance from RD, LL, RC and TH. RC performed the clinical diagnoses of AD and consulted on the MCI classifications.
Funding
This work was funded by grants from the National Institutes of Health (National Institute on Aging, R01 AG 008235; to RD); the Canadian Consortium on Neurodegeneration in Aging (CCNA; with funding from Canadian Institutes of Health Research (CIHR) and partners, including SANOFI-AVENTIS R&D to RD); the Canada Research Chairs program (to LL and RD); CIHR (to LL and RD); Natural Sciences and Engineering Research Council of Canada (to LL); Genome Canada and Alberta Innovates (to LL); and the J&N Janse Fund (to RD). SS is also supported by the CCNA/Alzheimer Society of Canada Postdoctoral Fellowship. The funding sources did not have a role in the study design, data collection, statistical analysis, results interpretation, report writing, or submission decisions.
Conflict of Interest Statement
The authors declare that the research was conducted in the absence of any commercial or financial relationships that could be construed as a potential conflict of interest.
The reviewer CJ and handling Editor declared their shared affiliation at the time of the review.
Acknowledgments
We thank the volunteer participants and the VLS staff for their many contributions. We thank Stuart MacDonald and the VLS lab for assistance in selecting the present groups. More information about the VLS may be found at: http://www.ualberta.ca/~vlslab/.
Footnotes
References
Albert, M. S., DeKosky, S. T., Dickson, D., Dubois, B., Feldman, H. H., Fox, N. C., et al. (2011). The diagnosis of mild cognitive impairment due to Alzheimer’s disease: Recommendations from the National Institute on Aging and Alzheimer’s Association workgroup. Alzheimers Dement. 7, 270–279. doi: 10.1016/j.jalz.2011.03.008
Altmann, A., Tian, L., Henderson, V. W., and Greicius, M. D. (2014). Sex modifies the APOE-related risk of developing Alzheimer disease. Ann. Neurol. 75, 563–573. doi: 10.1002/ana.24135
Alzheimer’s Association. (2016). 2016 Alzheimer’s disease facts and figures. Alzheimers Dement. 12, 459–509. doi: 10.1016/j.jalz.2016.03.001
Amieva, H., Mokri, H., Le Goff, M., Meillon, C., Jacqmin-Gadda, H., Foubert-Samier, A., et al. (2014). Compensatory mechanisms in higher-educated subjects with Alzheimer’s disease: a study of 20 years of cognitive decline. Brain 137, 1167–1175. doi: 10.1093/brain/awu035
Anstey, K. J., Bahar-Fuchs, A., Herath, P., Rebok, G. W., and Cherbuin, N. (2013a). A 12-week multidomain intervention versus active control to reduce risk of Alzheimer’s disease: study protocol for a randomized controlled trial. Trials 14:60. doi: 10.1186/1745-6215-14-60
Anstey, K. J., Cherbuin, N., and Herath, P. M. (2013b). Development of a new method for assessing global risk of Alzheimer’s disease for use in population health approaches to prevention. Prev. Sci. 14, 411–421. doi: 10.1007/s11121-012-0313-2
Anstey, K. J., Cherbuin, N., Herath, P. M., Qiu, C., Kuller, L. H., Lopez, O. L., et al. (2014). A self-report risk index to predict occurrence of dementia in three independent cohorts of older adults: the ANU-ADRI. PLoS One 9:e86141. doi: 10.1371/journal.pone.0086141
Anstey, K. J., Eramudugolla, R., Hosking, D. E., Lautenschlager, N. T., and Dixon, R. A. (2015). Bridging the translation gap: from dementia risk assessment to advice on risk reduction. J. Prev. Alzheimers Dis. 2, 189–198. doi: 10.14283/jpad.2015.75
Bäckman, L., Jones, S., Berger, A.-K., Laukka, E. J., and Small, B. J. (2005). Cognitive impairment in preclinical Alzheimer’s disease: a meta-analysis. Neuropsychology 19, 520–531. doi: 10.1037/0894-4105.19.4.520
Barnes, D. E., and Yaffe, K. (2011). The projected effect of risk factor reduction on Alzheimer’s disease prevalence. Lancet Neurol. 10, 819–828. doi: 10.1016/S1474-4422(11)70072-2
Barral, S., Bird, T., Goate, A., Farlow, M. R., Diaz-Arrastia, R., Bennett, D. A., et al. (2012). Genotype patterns at PICALM, CR1, BIN1, CLU and APOE genes are associated with episodic memory. Neurology 78, 1464–1471. doi: 10.1212/WNL.0b013e3182553c48
Bartsch, T., and Wulff, P. (2015). The hippocampus in aging and disease: from plasticity to vulnerability. Neuroscience 309, 1–16. doi: 10.1016/j.neuroscience.2015.07.084
Besser, L., Gill, D., Monsell, S., Brenowitz, W., Meranus, D., Kukull, W., et al. (2014). Body mass index, weight change and clinical progression in mild cognitive impairment and Alzheimer disease. Alzheimer Dis. Assoc. Disord. 28, 36–43. doi: 10.1097/WAD.0000000000000005
Bherer, L., Erickson, K. I., and Liu-Ambrose, T. (2013). A review of the effects of physical activity and exercise on cognitive and brain functions in older adults. J. Aging Res. 2013:657508. doi: 10.1155/2013/657508
Bondi, M. W., Edmonds, E. C., Jak, A. J., Clark, L. R., Delano-Wood, L., McDonald, C. R., et al. (2014). Neuropsychological criteria for mild cognitive impairment improves diagnostic precision, biomarker associations and progression rates. J. Alzheimers Dis. 42, 275–289. doi: 10.3233/JAD-140276
Brainerd, C. J., Reyna, V. F., Petersen, R. C., Smith, G. E., Kenney, A. E., Gross, C. J., et al. (2013). The apolipoprotein E genotype predicts longitudinal transitions to mild cognitive impairment but not to Alzheimer’s dementia: findings from a nationally representative study. Neuropsychology 27, 86–94. doi: 10.1037/a0030855
Brainerd, C. J., Reyna, V. F., Petersen, R. C., Smith, G. E., and Taub, E. S. (2011). Is the apolipoprotein e genotype a biomarker for mild cognitive impairment? Findings from a nationally representative study. Neuropsychology 25, 679–689. doi: 10.1037/a0024483
Brown, C. L., Robitaille, A., Zelinski, E. M., Dixon, R. A., Hofer, S. M., and Piccinin, A. M. (2016). Cognitive activity mediates the association between social activity and cognitive performance: a longitudinal study. Psychol. Aging 31, 831–846. doi: 10.1037/pag0000134
Cadar, D., Piccinin, A. M., Hofer, S. M., Johannson, B., and Muniz-Terrera, G. (2016). Education, Occupational Class and cognitive decline in Preclinical Dementia. GeroPsych 29, 5–15. doi: 10.1024/1662-9647/a000138
Casanova, R., Varma, S., Simpson, B., Kim, M., An, Y., Saldana, S., et al. (2016). Blood metabolite markers of preclinical Alzheimer’s disease in two longitudinally followed cohorts of older individuals. Alzheimers Dement. 12, 815–822. doi: 10.1016/j.jalz.2015.12.008
Chen, W.-W., Zhang, X., and Huang, W.-J. (2016). Role of physical exercise in Alzheimer’s disease. Biomed. Rep. 4, 403–407. doi: 10.3892/br.2016.607
Chibnik, L. B., Shulman, J. M., Leurgans, S. E., Schneider, J. A., Wilson, R. S., Tran, D., et al. (2011). CR1 is associated with amyloid plaque burden and age-related cognitive decline. Ann. Neurol. 69, 560–569. doi: 10.1002/ana.22277
Crehan, H., Holton, P., Wray, S., Pocock, J., Guerreiro, R., and Hardy, J. (2012). Complement receptor 1 (CR1) and Alzheimer’s disease. Immunobiology 217, 244–250. doi: 10.1016/j.imbio.2011.07.017
Cummings, J. L., Morstorf, T., and Zhong, K. (2014). Alzheimer’s disease drug-development pipeline: few candidates, frequent failures. Alzheimers Res. Ther. 6:37. doi: 10.1186/alzrt269
Dahl, A. K., Hassing, L. B., Fransson, E. I., Gatz, M., Reynolds, C. A., and Pedersen, N. L. (2013). Body mass index across midlife and cognitive change in late life. Int. J. Obes. 37, 296–302. doi: 10.1038/ijo.2012.37
Deary, I. J., Whalley, L. J., Batty, G. D., and Starr, J. M. (2006). Physical fitness and lifetime cognitive change. Neurology 67, 1195–1200. doi: 10.1212/01.wnl.0000238520.06958.6a
de Frias, C. M., Dixon, R. A., and Strauss, E. (2009). Characterizing executive functioning in older special populations: from cognitively elite to cognitively impaired. Neuropsychology 23, 778–791. doi: 10.1037/a0016743
Diamond, A. (2013). Executive functions. Annu. Rev. Psychol. 64, 135–168. doi: 10.1146/annurev-psych-113011-143750
Dixon, R. A., and de Frias, C. M. (2004). The victoria longitudinal study: from characterizing cognitive aging to illustrating changes in memory compensation. Agin. Neuropsychol. Cogn. 11, 346–376. doi: 10.1080/13825580490511161
Dixon, R. A., Garrett, D. D., Lentz, T. L., MacDonald, S. W. S., Strauss, E., and Hultsch, D. F. (2007). Neurocognitive markers of cognitive impairment: exploring the roles of speed and inconsistency. Neuropsychology 21, 381–399. doi: 10.1037/0894-4105.21.3.381
Dixon, R. A., DeCarlo, C. A., MacDonald, S. W. S., Vergote, D., Jhamandas, J., and Westaway, D. (2014). APOE and COMT polymorphisms are complementary biomarkers of status, stability and transitions in normal aging and early mild cognitive impairment. Front. Aging Neurosci. 6:236. doi: 10.3389/fnagi.2014.00236
Dolcos, S., MacDonald, S. W. S., Braslavsky, A., Camicioli, R., and Dixon, R. A. (2012). Mild cognitive impairment is associated with selected functional markers: integrating concurrent, longitudinal and stability effects. Neuropsychology 26, 209–223. doi: 10.1037/a0026760
Edwards, M., Balldin, V. H., Hall, J., and O’Bryant, S. (2015). Molecular markers of neuropsychological functioning and Alzheimer’s disease. Alzheimers Dement. 1, 61–66. doi: 10.1016/j.dadm.2014.11.001
Emmerzaal, T. L., Kiliaan, A. J., and Gustafson, D. R. (2015). 2003–2013: a decade of body mass index, Alzheimer’s disease and dementia. J. Alzheimers Dis. 43, 739–755. doi: 10.3233/JAD-141086
Enche Ady, C. N. A., Lim, S. M., Teh, L. K., Salleh, M. Z., Chin, A.-V., Tan, M. P., et al. (2017). Metabolomic-guided discovery of Alzheimer’s disease biomarkers from body fluid. J. Neurosci. Res. 95, 2005–2024. doi: 10.1002/jnr.24048
Falck, R. S., Landry, G. J., Best, J. R., Davis, J. C., Chiu, B. K., and Liu-Ambrose, T. (2017). Cross-sectional relationships of physical activity and sedentary behavior with cognitive function in older adults with probable mild cognitive impairment. Phys. Ther. 97, 975–984. doi: 10.1093/ptj/pzx074
Ferencz, B., Laukka, E. J., Welmer, A.-K., Kalpouzos, G., Angleman, S., Keller, L., et al. (2014). The benefits of staying active in old age: physical activity counteracts the negative influence of PICALM, BIN1 and CLU risk alleles on episodic memory functioning. Psychol. Aging 29, 440–449. doi: 10.1037/a0035465
Figueira, J., Jonsson, P., Nordin Adolfsson, A., Adolfsson, R., Nyberg, L., and Öhman, A. (2016). NMR analysis of the human saliva metabolome distinguishes dementia patients from matched controls. Mol. Biosyst. 12, 2562–2571. doi: 10.1039/c6mb00233a
Folstein, M. F., Folstein, S. E., and McHugh, P. R. (1975). “Mini-mental state”. A practical method for grading the cognitive state of patients for the clinician. J. Psychiatr. Res. 12, 189–198. doi: 10.1016/0022-3956(75)90026-6
Fonseca, M. I., Chu, S., Pierce, A. L., Brubaker, W. D., Hauhart, R. E., Mastroeni, D., et al. (2016). Analysis of the putative role of CR1 in Alzheimer’s disease: genetic association, expression and function. PLoS One 11:e0149792. doi: 10.1371/journal.pone.0149792
Gauthier, S., Patterson, C., Chertkow, H., Gordon, M., Herrmann, N., Rockwood, K., et al. (2012). Recommendations of the 4th canadian consensus conference on the diagnosis and treatment of dementia (CCCDTD4). Can. Geriatr. 15, 120–126. doi: 10.5770/cgj.15.49
González-Domínguez, R., García-Barrera, T., and Gómez-Ariza, J. L. (2015). Metabolite profiling for the identification of altered metabolic pathways in Alzheimer’s disease. J. Pharm. Biomed. Anal. 107, 75–81. doi: 10.1016/j.jpba.2014.10.010
Guerreiro, R., and Bras, J. (2015). The age factor in Alzheimer’s disease. Genome Med. 7:106. doi: 10.1186/s13073-015-0232-5
Hampel, H., O’Bryant, S. E., Durrleman, S., Younesi, E., Rojkova, K., Escott-Price, V., et al. (2017). A precision medicine initiative for Alzheimer’s disease: the road ahead to biomarker-guided integrative disease modeling. Climacteric 20, 107–118. doi: 10.1080/13697137.2017.1287866
Harold, D., Abraham, R., Hollingworth, P., Sims, R., Gerrish, A., Hamshere, M. L., et al. (2009). Genome-wide association study identifies variants at CLU and PICALM associated with Alzheimer’s disease. Nat. Genet. 41, 1088–1093. doi: 10.1038/ng.440
Henneman, W. J. P., Sluimer, J. D., Barnes, J., van der Flier, W. M., Sluimer, I. C., Fox, N. C., et al. (2009). Hippocampal atrophy rates in Alzheimer disease: added value over whole brain volume measures. Neurology 72, 999–1007. doi: 10.1212/01.wnl.0000344568.09360.31
Hothorn, T., Büehlmann, P., Dudoit, S., Molinaro, A., and van der Laan, D. (2005). Survival ensembles. Biostatistics 7, 355–373. doi: 10.1093/biostatistics/kxj011
Hu, W. T., Chen-Plotkin, A., Arnold, S. E., Grossman, M., Clark, C. M., Shaw, L. M., et al. (2010). Novel CSF biomarkers for Alzheimer’s disease and mild cognitive impairment. Acta Neuropathol. 119, 669–678. doi: 10.1007/s00401-010-0667-0
Huan, T., and Li, L. (2015a). Counting missing values in a metabolite-intensity data set for measuring the analytical performance of a metabolomics platform. Anal. Chem. 87, 1306–1313. doi: 10.1021/ac5039994
Huan, T., and Li, L. (2015b). Quantitative metabolome analysis based on chromatographic peak reconstruction in chemical isotope labeling liquid chromatography mass spectrometry. Anal. Chem. 87, 7011–7016. doi: 10.1021/acs.analchem.5b01434
Huan, T., Tran, T., Zheng, J., Sapkota, S., MacDonald, S. W. S., Camicioli, R., et al. (2018). Metabolomics analyses of saliva detect novel biomarkers that discriminate Alzheimer’s disease. J. Alzheimers Dis. doi: 10.3233/JAD-180711 [Epub ahead of print].
Huan, T., Wu, Y., Tang, C., Lin, G., and Li, L. (2015). DnsID in MyCompoundID for rapid identification of dansylated amine- and phenol-containing metabolites in LC-MS-based metabolomics. Anal. Chem. 87, 9838–9845. doi: 10.1021/acs.analchem.5b02282
Hughes, T. F., Flatt, J. D., Fu, B., Chang, C.-C. H., and Ganguli, M. (2013). Engagement in social activities and progression from mild to severe cognitive impairment: the MYHAT study. Int. Psychogeriatr. 25, 587–595. doi: 10.1017/s1041610212002086
Hultsch, D. F., Hertzog, C., Small, B. J., and Dixon, R. A. (1999). Use it or lose it: engaged lifestyle as a buffer of cognitive decline in aging? Psychol. Aging 14, 245–263. doi: 10.1037/0882-7974.14.2.245
Humpel, C. (2011). Identifying and validating biomarkers for Alzheimer’s disease. Trends Biotechnol. 29, 26–32. doi: 10.1016/j.tibtech.2010.09.007
Huynh, R. A., and Mohan, C. (2017). Alzheimer’s disease: biomarkers in the genome, blood and cerebrospinal fluid. Front. Neurol. 8:102. doi: 10.3389/fneur.2017.00102
Ibáñez, C., Simó, C., Barupal, D. K., Fiehn, O., Kivipelto, M., Cedazo-Mínguez, A., et al. (2013). A new metabolomic workflow for early detection of Alzheimer’s disease. J. Chromatogr. A 1302, 65–71. doi: 10.1016/j.chroma.2013.06.005
Imtiaz, B., Tolppanen, A.-M., Kivipelto, M., and Soininen, H. (2014). Future directions in Alzheimer’s disease from risk factors to prevention. Biochem. Pharmacol. 88, 661–760. doi: 10.1016/j.bcp.2014.01.003
Iturria-Medina, Y., Sotero, R. C., Toussaint, P. J., Mateos-Pérez, J. M., Evans, A. C., Weiner, M. W., et al. (2016). Early role of vascular dysregulation on late-onset Alzheimer’s disease based on multifactorial data-driven analysis. Nat. Commun. 7:11934. doi: 10.1038/ncomms11934
Jack, C. R., Wiste, H. J., Weigand, S. D., Knopman, D. S., Vemuri, P., Mielke, M. M., et al. (2015). Age, sex and APOE ε4 effects on memory, brain structure and β-amyloid across the adult life span. JAMA Neurol. 72, 511–519. doi: 10.1001/jamaneurol.2014.4821
Josefsson, M., de Luna, X., Pudas, S., Nilsson, L.-G., and Nyberg, L. (2012). Genetic and lifestyle predictors of 15-year longitudinal change in episodic memory. J. Am. Geriatr. Soc. 60, 2308–2312. doi: 10.1111/jgs.12000
Jové, M., Portero-Otín, M., Naudí, A., Ferrer, I., and Pamplona, R. (2014). Metabolomics of human brain aging and age-related neurodegenerative diseases. J. Neuropathol. Exp. Neurol. 73, 640–657. doi: 10.1097/NEN.0000000000000091
Kaddurah-Daouk, R., and Krishnan, K. R. R. (2009). Metabolomics: a global biochemical approach to the study of central nervous system diseases. Neuropsychopharmacology 34, 173–186. doi: 10.1038/npp.2008.174
Karch, C. M., Cruchaga, C., and Goate, A. M. (2014). Alzheimer’s disease genetics: from the bench to the clinic. Neuron 83, 11–26. doi: 10.1016/j.neuron.2014.05.041
Karch, C. M., and Goate, A. M. (2015). Alzheimer’s disease risk genes and mechanisms of disease pathogenesis. Biol. Psychiatry 77, 43–51. doi: 10.1016/j.biopsych.2014.05.006
Kaup, A. R., Nettiksimmons, J., Harris, T. B., Sink, K. M., Satterfield, S., Metti, A. L., et al. (2015). Cognitive resilience to apolipoprotein E e4: contributing factors in black and white older adults. JAMA Neurol. 72, 340–348. doi: 10.1001/jamaneurol.2014.3978
Koepsell, T. D., and Monsell, S. E. (2012). Reversion from mild cognitive impairment to normal or near-Normal cognition; risk factors and prognosis. J. Neurol. 79, 1591–1598. doi: 10.1212/WNL.0b013e31826e26b7
Lambert, J.-C., Heath, S., Even, G., Campion, D., Sleegers, K., Hiltunen, M., et al. (2009). Genome-wide association study identifies variants at CLU and CR1 associated with Alzheimer’s disease. Nat. Genet. 41, 1094–1099. doi: 10.1038/ng.439
Li, L., Li, R., Zhou, J., Zuniga, A., Stanislaus, A. E., Wu, Y., et al. (2013). MyCompoundID: using an evidence-based metabolome library for metabolite identification. Anal. Chem. 85, 3401–3408. doi: 10.1021/ac400099b
Li, R., and Singh, M. (2014). Sex differences in cognitive impairment and Alzheimer’s disease. Front. Neuroendocrinol. 35, 385–403. doi: 10.1016/j.yfrne.2014.01.002
Liang, Q., Liu, H., Zhang, T., Jiang, Y., Xing, H., and Zhang, A. (2015). Metabolomics-based screening of salivary biomarkers for early diagnosis of Alzheimer’s disease. RSC Adv. 5, 96074–96079. doi: 10.1039/c5ra19094k
Liang, Q., Liu, H., Zhang, T., Jiang, Y., Xing, H., and Zhang, A. (2016). Discovery of serum metabolites for diagnosis of progression of mild cognitive impairment to Alzheimer’s disease using an optimized metabolomics method. RSC Adv. 6, 3586–3591. doi: 10.1039/c5ra19349d
Liu, C.-C., Liu, C.-C., Kanekiyo, T., Xu, H., and Bu, G. (2013). Apolipoprotein E and Alzheimer disease: risk, mechanisms and therapy. Nat. Rev. Neurol. 9, 106–118. doi: 10.1038/nrneurol.2012.263
Livingston, G., Sommerlad, A., Orgeta, V., Costafreda, S. G., Huntley, J., Ames, D., et al. (2017). Dementia prevention, intervention and care. Lancet 390, 2673–2734. doi: 10.1016/S0140-6736(17)31363-6
MacDonald, S. W. S., DeCarlo, C. A., and Dixon, R. A. (2011). Linking biological and cognitive aging: toward improving characterizations of developmental time. J. Gerontol. B Psychol. Sci. Soc. Sci. 66, i59–i70. doi: 10.1093/geronb/gbr039
MacDonald, S. W. S., Hundza, S., Love, J. A., DeCarlo, C. A., Halliday, D. W. R., Brewster, P. W. H., et al. (2017). Concurrent indicators of gait velocity and variability are associated with 25-year cognitive change: a retrospective longitudinal investigation. Front. Aging Neurosci. 9:17. doi: 10.3389/fnagi.2017.00017
MacLeod, C. M. (1991). Half a century of research on the Stroop effect: an integrative review. Psychol. Bull. 109, 163–203. doi: 10.1037/0033-2909.109.2.163
Mahoney-Sanchez, L., Belaidi, A. A., Bush, A. I., and Ayton, S. (2016). The complex role of apolipoprotein E in Alzheimer’s disease: an overview and update. J. Mol. Neurosci. 60, 325–335. doi: 10.1007/s12031-016-0839-z
Manly, J. J., Tang, M. X., Schupf, N., Stern, Y., Vonsattel, J. P. G., and Mayeux, R. (2008). Frequency and course of mild cognitive impairment in a multiethnic community. Ann. Neurol. 63, 494–506. doi: 10.1002/ana.21326
Maroco, J., Silva, D., Rodrigues, A., Guerreiro, M., Santana, I., and de Mendonça, A. (2011). Data mining methods in the prediction of Dementia: a real-data comparison of the accuracy, sensitivity and specificity of linear discriminant analysis, logistic regression, neural networks, support vector machines, classification trees and random forests. BMC Res. Notes 4:299. doi: 10.1186/1756-0500-4-299
Mazure, C. M., and Swendsen, J. (2016). Sex differences in Alzheimer’s disease and other dementias. Lancet Neurol. 15, 451–452. doi: 10.1016/S1474-4422(16)00067-3
McDade, E., Sun, Z., Lee, C. W., Snitz, B., Hughes, T., Chang, C. C. H., et al. (2016). The association between pulse pressure change and cognition in late life: age and where you start matters. Alzheimers Dement. 4, 56–66. doi: 10.1016/j.dadm.2016.03.008
McDermott, K. L., McFall, G. P., Andrews, S. J., Anstey, K. J., and Dixon, R. A. (2017). Memory resilience to Alzheimer’s genetic risk: sex effects in predictor profiles. J. Gerontol. B Psychol. Sci. Soc. Sci. 72, 937–946. doi: 10.1093/geronb/gbw161
McFall, G. P., Sapkota, S., McDermott, K. L., and Dixon, R. A. (2016). Risk-reducing Apolipoprotein E and clusterin genotypes protect against the consequences of poor vascular health on executive function performance and change in nondemented older adults. Neurobiol. Aging 42, 91–100. doi: 10.1016/j.neurobiolaging.2016.02.032
McFall, G. P., Wiebe, S. A., Vergote, D., Anstey, K. J., and Dixon, R. A. (2015a). Alzheimer’s genetic risk intensifies neurocognitive slowing associated with diabetes in nondemented older adults. Alzheimers Dement. 1, 395–402. doi: 10.1016/j.dadm.2015.08.002
McFall, G. P., Wiebe, S. A., Vergote, D., Westaway, D., Jhamandas, J., Bäckman, L., et al. (2015b). ApoE and pulse pressure interactively influence level and change in the aging of episodic memory: Protective effects among ε2 carriers. Neuropsychology 29, 388–401. doi: 10.1037/neu0000150
McKhann, G., Knopman, D., and Chertkow, H. (2011). The diagnosis of dementia due to Alzheimer’s disease: recommendations from the national institute on aging-Alzheimer’s association workgroups on diagnostic. Alzheimer’s Dement. 7, 263–269. doi: 10.1016/j.jalz.2011.03.005
Mielke, M. M., Roberts, R. O., Savica, R., Cha, R., Drubach, D. I., Christianson, T., et al. (2013). Assessing the temporal relationship between cognition and gait: slow gait predicts cognitive decline in the Mayo Clinic Study of Aging. J. Gerontol. A Biol. Sci. Med. Sci. 68, 929–937. doi: 10.1093/gerona/gls256
Mielke, M. M., Zandi, P. P., Sjogren, M., Gustafson, D., Ostling, S., Steen, B., et al. (2005). High total cholesterol levels in late life associated with a reduced risk of dementia. Neurology 64, 1689–1695. doi: 10.1212/01.WNL.0000161870.78572.a5
Mishur, R. J., and Rea, S. L. (2012). Applications of mass spectrometry to metabolomics and metabonomics: detection of biomarkers of aging and of age-related diseases. Mass Spectrom. Rev. 31, 70–95. doi: 10.1002/mas.20338
Morgen, K., Ramirez, A., Frölich, L., Tost, H., Plichta, M. M., Kölsch, H., et al. (2014). Genetic interaction of PICALM and APOE is associated with brain atrophy and cognitive impairment in Alzheimer’s disease. Alzheimers Dement. 10, S269–S276. doi: 10.1016/j.jalz.2013.11.001
Mousavi, M., Jonsson, P., Antti, H., Adolfsson, R., Nordin, A., Bergdahl, J., et al. (2014). Serum metabolomic biomarkers of dementia. Dement. Geriatr. Cogn. Dis. Extra 4, 252–262. doi: 10.1159/000364816
Nation, D. A., Edland, S. D., Bondi, M. W., Salmon, D. P., Delano-Wood, L., Peskind, E. R., et al. (2013). Pulse pressure is associated with Alzheimer biomarkers in cognitively normal older adults. Neurology 81, 2024–2027. doi: 10.1212/01.wnl.0000436935.47657.78
Norton, S., Matthews, F. E., Barnes, D. E., Yaffe, K., and Brayne, C. (2014). Potential for primary prevention of Alzheimer’s disease: an analysis of population-based data. Lancet Neurol. 13, 788–794. doi: 10.1016/S1474-4422(14)70136-X
O’Bryant, S. E., Humphreys, J. D., Smith, G. E., Ivnik, R. J., Graff-Radford, N. R., Petersen, R. C., et al. (2008). Detecting dementia with the mini-mental state examination in highly educated individuals. Arch. Neurol. 65, 963–967. doi: 10.1001/archneur.65.7.963
Olanrewaju, O., Clare, L., Barnes, L., and Brayne, C. (2015). A multimodal approach to dementia prevention: a report from the Cambridge Institute of Public Health. Alzheimers Dement. Transl. Res. Clin. Interv. 1, 151–156. doi: 10.1016/j.trci.2015.08.003
Pannacciulli, N., Del Parigi, A., Chen, K., Le, D. S., Reiman, E. M., and Tataranni, P. A. (2006). Brain abnormalities in human obesity: a voxel-based morphometric study. Neuroimage 31, 1419–1425. doi: 10.1016/j.neuroimage.2006.01.047
Papenberg, G., Lindenberger, U., and Bäckman, L. (2015). Aging-related magnification of genetic effects on cognitive and brain integrity. Trends Cogn. Sci. 19, 506–514. doi: 10.1016/j.tics.2015.06.008
Petersen, R. C., Caracciolo, B., Brayne, C., Gauthier, S., Jelic, V., and Fratiglioni, L. (2014). Mild cognitive impairment: a concept in evolution. J. Intern. Med. 275, 214–228. doi: 10.1111/joim.12190
Prince, M. J., Wu, F., Guo, Y., Gutierrez Robledo, L. M., O’Donnell, M., Sullivan, R., et al. (2015). The burden of disease in older people and implications for health policy and practice. Lancet 385, 549–562. doi: 10.1016/S0140-6736(14)61347-7
Qiu, C., Winblad, B., Viitanen, M., and Fratiglioni, L. (2003). Pulse pressure and risk of Alzheimer disease in persons aged 75 years and older: a community-based, longitudinal study. Stroke 34, 594–599. doi: 10.1161/01.str.0000060127.96986.f4
Raz, N., Dahle, C. L., Rodrigue, K. M., Kennedy, K. M., and Land, S. (2011). Effects of age, genes and pulse pressure on executive functions in healthy adults. Neurobiol. Aging 32, 1124–1137. doi: 10.1016/j.neurobiolaging.2009.05.015
Riedel, B. C., Thompson, P. M., and Brinton, R. D. (2016). Age, APOE and sex: triad of risk of Alzheimer’s disease. J. Steroid Biochem. Mol. Biol. 160, 134–147. doi: 10.1016/j.jsbmb.2016.03.012
Runge, S. K., Small, B. J., McFall, G. P., and Dixon, R. A. (2014). APOE moderates the association between lifestyle activities and cognitive performance: evidence of genetic plasticity in aging. J. Int. Neuropsychol. Soc. 20, 478–486. doi: 10.1017/s1355617714000356
Sachdev, P. S., Lipnicki, D. M., Crawford, J. D., Thalamuthu, A., Kochan, N. A., Lima-Costa, M. F., et al. (2016). Cognitive decline and effects of sex, education and Apolipoprotein E genotype on cognitive performance in diverse ethno-cultural and geographical regions internationally: the Cosmic collaboration. Alzheimers Dement. 12, P1119–P1120. doi: 10.1016/j.jalz.2016.06.2327
Sapkota, S., Bäckman, L., and Dixon, R. A. (2017). Executive function performance and change in aging is predicted by apolipoprotein E, intensified by catechol-O-methyltransferase and brain-derived neurotrophic factor and moderated by age and lifestyle. Neurobiol. Aging 52, 81–89. doi: 10.1016/j.neurobiolaging.2016.12.022
Sapkota, S., and Dixon, R. A. (2018). A network of genetic effects on non-demented cognitive aging: Alzheimer’s genetic risk (CLU + CR1 + PICALM) intensifies cognitive aging genetic risk (COMT + BDNF) selectively for APOE ε4 carriers. J. Alzheimers Dis. 62, 887–900. doi: 10.3233/jad-170909
Scarpina, F., and Tagini, S. (2017). The stroop color and word test. Front. Psychol. 8:557. doi: 10.3389/fpsyg.2017.00557
Schneeweis, N., Skirbekk, V., and Winter-Ebmer, R. (2014). Does education improve cognitive performance four decades after school completion? Demography 51, 619–643. doi: 10.1007/s13524-014-0281-1
Simpson, B. N., Kim, M., Chuang, Y.-F., Beason-Held, L., Kitner-Triolo, M., Kraut, M., et al. (2016). Blood metabolite markers of cognitive performance and brain function in aging. J. Cereb. Blood Flow Metab. 36, 1212–1223. doi: 10.1177/0271678x15611678
Singer, J., Trollor, J. N., Baune, B. T., Sachdev, P. S., and Smith, E. (2014). Arterial stiffness, the brain and cognition: a systematic review. Ageing Res. Rev. 15, 16–27. doi: 10.1016/j.arr.2014.02.002
Small, B. J., Dixon, R. A., and McArdle, J. J. (2011). Tracking cognition-health changes from 55 to 95 years of age. J. Gerontol. B Psychol. Sci. Soc. Sci. 66, i153–i161. doi: 10.1093/geronb/gbq093
Small, B. J., Dixon, R. A., McArdle, J. J., and Grimm, K. J. (2012). Do changes in lifestyle engagement moderate cognitive decline in normal aging? Evidence from the Victoria longitudinal study. Neuropsychology 26, 144–155. doi: 10.1037/a0026579
Sperling, R. A., Aisen, P. S., Beckett, L. A., Bennett, D. A., Craft, S., Fagan, A. M., et al. (2011). Toward defining the preclinical stages of Alzheimer’s disease: recommendations from the national institute on aging-Alzheimer’s association workgroups on diagnostic guidelines for Alzheimer’s disease. Alzheimers Dement. 7, 280–292. doi: 10.1016/j.jalz.2011.03.003
Stekhoven, D. J., and Bühlmann, P. (2012). Missforest—non-parametric missing value imputation for mixed-type data. Bioinformatics 28, 112–118. doi: 10.1093/bioinformatics/btr597
Stern, Y. (2012). Cognitive reserve in ageing and Alzheimer’s disease. Lancet Neurol. 11, 1006–1012. doi: 10.1016/S1474-4422(12)70191-6
Stern, Y. (2017). An approach to studying the neural correlates of reserve. Brain Imaging Behav. 11, 410–416. doi: 10.1007/s11682-016-9566-x
Strobl, C., Malley, J., and Tutz, G. (2009). An introduction to recursive partitioning: rationale, application, and characteristics of classification and regression trees, bagging and random forests. Psychol. Methods 14, 323–348. doi: 10.1037/a0016973
Thambisetty, M., Beason-Held, L. L., An, Y., Kraut, M., Nalls, M., Hernandez, D. G., et al. (2013). Alzheimer risk variant CLU and brain function during aging. Biol. Psychiatry 73, 399–405. doi: 10.1016/j.biopsych.2012.05.026
Thambisetty, M., and Lovestone, S. (2010). Blood-based biomarkers of Alzheimer’s disease: challenging but feasible. Biomark. Med. 4, 65–79. doi: 10.2217/bmm.09.84
Thibeau, S., McFall, G. P., Camicioli, R., and Dixon, R. A. (2017). Alzheimer’s disease biomarkers interactively influence physical activity, mobility and cognition associations in a non-demented aging population. J. Alzheimers Dis. 60, 69–86. doi: 10.3233/JAD-170130
Toledo, J. B., Arnold, M., Kastenmüller, G., Chang, R., Baillie, R. A., Han, X., et al. (2017). Metabolic network failures in Alzheimer’s disease: a biochemical road map. Alzheimers Dement. 13, 965–984. doi: 10.1016/j.jalz.2017.01.020
Trushina, E., and Mielke, M. M. (2014). Recent advances in the application of metabolomics to Alzheimer’s disease. Biochim. Biophys. Acta 1842, 1232–1239. doi: 10.1016/j.bbadis.2013.06.014
Tucker, A. M., and Stern, Y. (2011). Cognitive reserve in aging. Curr. Alzheimer Res. 8, 354–360. doi: 10.2174/156720511795745320
Turken, U., Whitfield-Gabrieli, S., Bammer, R., Baldo, J. V., Dronkers, N. F., and Gabrieli, J. D. E. (2008). Cognitive processing speed and the structure of white matter pathways: convergent evidence from normal variation and lesion studies. Neuroimage 42, 1032–1044. doi: 10.1016/j.neuroimage.2008.03.057
Vemuri, P., Lesnick, T. G., Przybelski, S. A., Knopman, D. S., Roberts, R. O., Lowe, V. J., et al. (2012). Effect of lifestyle activities on alzheimer disease biomarkers and cognition. Ann. Neurol. 72, 730–738. doi: 10.1002/ana.23665
Vemuri, P., Lesnick, T. G., Przybelski, S. A., Machulda, M., Knopman, D. S., Mielke, M. M., et al. (2014). Association of lifetime intellectual enrichment with cognitive decline in the older population. JAMA Neurol. 71, 1017–1024. doi: 10.1001/jamaneurol.2014.963
Verghese, J., LeValley, A., Derby, C., Kuslansky, G., Katz, M., Hall, C., et al. (2006). Leisure activities and the risk of amnestic mild cognitive impairment in the elderly. Neurology 66, 821–827. doi: 10.1212/01.wnl.0000202520.68987.48
Wang, H.-X., Jin, Y., Hendrie, H. C., Liang, C., Yang, L., Cheng, Y., et al. (2013). Late life leisure activities and risk of cognitive decline. J. Gerontol. A Biol. Sci. Med. Sci. 68, 205–213. doi: 10.1093/gerona/gls153
Williams, J. W., Plassman, B. L., Burke, J., and Benjamin, S. (2010). Preventing Alzheimer’s disease and cognitive decline. Evid. Rep. Technol. Assess. 193, 1–727.
Wimo, A., Guerchet, M., Ali, G.-C., Wu, Y.-T., Prina, A. M., Winblad, B., et al. (2017). The worldwide costs of dementia 2015 and comparisons with 2010. Alzheimers Dement. 13, 1–7. doi: 10.1016/j.jalz.2016.07.150
Wishart, D. S., Jewison, T., Guo, A. C., Wilson, M., Knox, C., Liu, Y., et al. (2013). HMDB 3.0—the human metabolome database in 2013. Nucleic Acids Res. 41, D801–D807. doi: 10.1093/nar/gks1065
Wong, D. T. (2006). Salivary diagnostics powered by nanotechnologies, proteomics and genomics. J. Am. Dent. Assoc. 137, 313–321. doi: 10.14219/jada.archive.2006.0180
Xia, J., Broadhurst, D. I., Wilson, M., and Wishart, D. S. (2013). Translational biomarker discovery in clinical metabolomics: an introductory tutorial. Metabolomics 9, 280–299. doi: 10.1007/s11306-012-0482-9
Xia, J., Mandal, R., Sinelnikov, I. V., Broadhurst, D., and Wishart, D. S. (2012). MetaboAnalyst 2.0—a comprehensive server for metabolomic data analysis. Nucleic Acids Res. 40, W127–E133. doi: 10.1093/nar/gks374
Xiao, Q., Gil, S.-C., Yan, P., Wang, Y., Han, S., Gonzales, E., et al. (2012). Role of phosphatidylinositol clathrin assembly lymphoid-myeloid leukemia (PICALM) in intracellular amyloid precursor protein (APP) processing and amyloid plaque pathogenesis. J. Biol. Chem. 287, 21279–21289. doi: 10.1074/jbc.M111.338376
Yaffe, K., Kanaya, A., Lindquist, K., Simonsick, E. M., Harris, T., Shorr, R. I., et al. (2004). The metabolic syndrome, inflammation, and risk of cognitive decline. JAMA 292, 2237–2242. doi: 10.1001/jama.292.18.2237
Yaneva-Sirakova, T., Tarnovska-Kadreva, R., and Traykov, L. (2012). Pulse pressure and mild cognitive impairment. J. Cardiovasc. Med. 13, 735–740. doi: 10.2459/JCM.0b013e328357ba78
Zheng, J., Dixon, R. A., and Li, L. (2012). Development of isotope labeling LC-MS for human salivary metabolomics and application to profiling metabolome changes associated with mild cognitive impairment. Anal. Chem. 84, 10802–10811. doi: 10.1021/ac3028307
Keywords: Alzheimer’s disease, mild cognitive impairment, cognitively normal, salivary metabolomics, biomarkers, genetics, cognition, victoria longitudinal study
Citation: Sapkota S, Huan T, Tran T, Zheng J, Camicioli R, Li L and Dixon RA (2018) Alzheimer’s Biomarkers From Multiple Modalities Selectively Discriminate Clinical Status: Relative Importance of Salivary Metabolomics Panels, Genetic, Lifestyle, Cognitive, Functional Health and Demographic Risk Markers. Front. Aging Neurosci. 10:296. doi: 10.3389/fnagi.2018.00296
Received: 01 August 2018; Accepted: 10 September 2018;
Published: 02 October 2018.
Edited by:
Ines Moreno-Gonzalez, University of Texas Health Science Center at Houston, United StatesReviewed by:
Ramesh Kandimalla, Indian Institute of Chemical Technology (CSIR), IndiaCameron B. Jeter, University of Texas Health Science Center at Houston, United States
Copyright © 2018 Sapkota, Huan, Tran, Zheng, Camicioli, Li and Dixon. This is an open-access article distributed under the terms of the Creative Commons Attribution License (CC BY). The use, distribution or reproduction in other forums is permitted, provided the original author(s) and the copyright owner(s) are credited and that the original publication in this journal is cited, in accordance with accepted academic practice. No use, distribution or reproduction is permitted which does not comply with these terms.
*Correspondence: Liang Li, bGlhbmcubGlAdWFsYmVydGEuY2E=
Roger A. Dixon, cmRpeG9uQHVhbGJlcnRhLmNh
†Present address: Shraddha Sapkota, Hurvitz Brain Sciences Research Program, Sunnybrook Research Institute, Sunnybrook Health Sciences Centre, Toronto, ON, Canada