 Takamasa Yokoi1
 Hirohisa Watanabe1,2
 Hiroshi Yamaguchi2
 Epifanio Bagarinao2
 Michihito Masuda1Kazunori Imai1Aya Ogura1Reiko Ohdake2Kazuya Kawabata1Kazuhiro Hara1Yuichi Riku1
 Shinsuke Ishigaki1
 Masahisa Katsuno1Shinichi Miyao3Katsuhiko Kato4Shinji Naganawa5
 Ryuichi Harada6
 Nobuyuki Okamura7
 Kazuhiko Yanai6Mari Yoshida8
 Gen Sobue1,2*
- 1Department of Neurology, Nagoya University Graduate School of Medicine, Nagoya, Japan
- 2Brain and Mind Research Center, Nagoya University, Nagoya, Japan
- 3Department of Neurology, Meitetsu Hospital, Nagoya, Japan
- 4Department of Radiological and Medical Laboratory Sciences, Nagoya University Graduate School of Medicine, Nagoya, Japan
- 5Department of Radiology, Nagoya University Graduate School of Medicine, Nagoya, Japan
- 6Department of Pharmacology, Tohoku University School of Medicine, Sendai, Japan
- 7Division of Pharmacology, Faculty of Medicine, Tohoku Medical and Pharmaceutical University, Sendai, Japan
- 8Department of Neuropathology, Institute for Medical Science of Aging, Aichi Medical University, Nagakute, Japan
Background: Imaging studies in Alzheimer’s disease (AD) have yet to answer the underlying questions concerning the relationship among tau retention, neuroinflammation, network disruption and cognitive decline. We compared the spatial retention patterns of 18F-THK5351 and resting state network (RSN) disruption in patients with early AD and healthy controls.
Methods: We enrolled 23 11C-Pittsburgh compound B (PiB)-positive patients with early AD and 24 11C-PiB-negative participants as healthy controls. All participants underwent resting state functional MRI and 18F-THK5351 PET scans. We used scaled subprofile modeling/principal component analysis (SSM/PCA) to reduce the complexity of multivariate data and to identify patterns that exhibited the largest statistical effects (variances) in THK5351 concentration in AD and healthy controls.
Findings: SSM/PCA identified a significant spatial THK5351 pattern composed by mainly three clusters including precuneus/posterior cingulate cortex (PCC), right and left dorsolateral prefrontal cortex (DLPFC) which accounted for 23.6% of the total subject voxel variance of the data and had 82.6% sensitivity and 79.1% specificity in discriminating AD from healthy controls. There was a significant relationship between the intensity of the 18F-THK5351 covariation pattern and cognitive scores in AD. The spatial patterns of 18F-THK5351 uptake showed significant similarity with intrinsic functional connectivity, especially in the PCC network. Seed-based connectivity analysis from the PCC showed significant decrease in connectivity over widespread brain regions in AD patients. An evaluation of an autopsied AD patient with Braak V showed that 18F-THK5351 retention corresponded to tau deposition, monoamine oxidase-B (MAO-B) and astrogliosis in the precuneus/PCC.
Interpretation: We identified an AD-specific spatial pattern of 18F-THK5351 retention in the precuneus/PCC, an important connectivity hub region in the brain. Disruption of the functional connections of this important network hub may play an important role in developing dementia in AD.
Introduction
The pathological hallmarks of Alzheimer’s disease (AD) are the presence of extracellular senile plaques containing amyloid β (Aβ) peptide, and intracellular neurofibrillary tangles of the microtubule-associated protein tau (Montine et al., 2012; Canter et al., 2016). Astrogliosis associated with neurodegeneration is also a major hallmark of AD (Rodríguez-Arellano et al., 2016). However, the roles of Aβ, tau and astrogliosis/neurodegeneration in developing dementia have not been fully elucidated.
According to the Nun study, some advanced Braak’s stage subjects with a significant increase in tau and Aβ accumulation showed good cognition during their lives (Snowdon, 1997), suggesting that brain neuronal networks may play an important role in the maintenance of cognition or development of dementia. Consequently, combined use of Aβ/tau PET and functional MRI to investigate brain networks in humans is expected to identify a convincing relationship between these pathological changes and the cognitive declines in AD.
Previous studies combining amyloid PET and resting-state functional MRI (rsfMRI) have demonstrated several important findings regarding the relationship between Aβ retention and resting state network (RSN) changes in AD: (1) Aβ retention in the neocortex regions is associated with cognition and spreads to hub regions corresponding to nodes of the default mode network (DMN; Lustig et al., 2003; Greicius et al., 2004); (2) increased Aβ retention alters task-related fMRI signal response in the DMN (Sperling et al., 2009; Mormino et al., 2011; Lim et al., 2014); and (3) cortical Aβ retention is also associated with disrupted RSN of the perirhinal and precuneus cortex (Song et al., 2015) and decreased connectivity to various anatomical lesions (Sheline et al., 2010). However, in these studies, tau, astrogliosis and neuroinflammation were not taken into account.
Despite cognitive deterioration and progressive loss of intra/internetwork connectivity at the DMN and other RSNs in association with the progression of AD (Agosta et al., 2012; Binnewijzend et al., 2012; Brier et al., 2012; Damoiseaux et al., 2012), the Aβ retention levels remain almost stationary over the conversion period from the mild cognitive impairment (MCI) state to AD (Jack et al., 2009). In addition, Aβ retention cannot fully explain the clinical-anatomical heterogeneity in AD (Ranasinghe et al., 2014; Lehmann et al., 2015; Canter et al., 2016). Finally, most Aβ-based antibody treatments that eradicate Aβ retention failed to restore cognitive function (Sacks et al., 2017; Wang et al., 2017).
These observations raise the question regarding the critical role of Aβ deposition, tau deposition and astrogliosis/neurodegeneration, particularly in terms of their spatial distribution, temporal timing and relationship to brain network disruption, in the development of the dementia in AD.
The spatial spread and temporal pattern of THK5351 retention correspond to the known distribution of tau pathology associated with the clinical severity and symptomatology of cognitive decline (Harada et al., 2016). However, recent studies have demonstrated that THK5351 also binds to monoamine oxidase-B (MAO-B), which is mainly localized in the inner mitochondrial membrane of astrocytes and increases with astrogliosis (Levitt et al., 1982; Ekblom et al., 1993; Lemoine et al., 2017; Ng et al., 2017; Harada et al., 2018). Regional in vivo THK5351 retention was significantly correlated with the density of tau aggregates in the neocortex and MAO-B in the whole brain (Harada et al., 2018). Furthermore, a significant association was observed between the density of tau aggregates, MAO-B and glial fibrillary acidic protein (GFAP), suggesting that neocortical tau strongly influences the formation of reactive astrocytes (Harada et al., 2018). In AD, astrogliosis and microglial activations progress together with tau pathology and contribute to neurodegeneration throughout the course of the disease (Leyns and Holtzman, 2017). Thus, THK5351 retention in the AD neocortex is expected to evaluate the spatial distribution of tau pathology and astrogliosis/neurodegeneration in the human brain.
In this study, we analyzed the AD-related spatial THK5351 distribution pattern using scaled subprofile modeling/principal component analysis (SSM/PCA), an unbiased data-driven approach, and investigated the relationship between THK5351 retention and RSN involvement. In addition, we investigated the pathological findings, including tau, MAO-B and activated astrocytes, of AD-related regions. Based on these approaches, we demonstrated the significance of the obtained spatial pattern of THK5351 and its relevance to network involvement, which are critical to the development of AD.
Participants and Methods
Participants
We enrolled 63 participants (36 early AD patients, 27 healthy controls) in this study. All participants underwent MRI, Aβ PET imaging with 11C-Pittsburgh compound B (PiB), PET imaging with THK5351 and cognitive functional testing, which included the mini mental state examination (MMSE), the Addenbrooke’s Cognitive Examination Revised (ACE-R; Mioshi et al., 2006), AD Assessment Scale-Cognitive-Japanese (ADAS-cog-j), and Logical Memory II of the Wechsler Memory Scale Revised, Clinical Dementia Rating (CDR) and CDR Scale Sum of Boxes (CDR-SB).
All patients with early AD were recruited from the outpatient clinic of the Department of Neurology, Nagoya University Hospital, and Dementia Center of Meitetsu Hospital in Nagoya. There were no patients with atypical features suggestive of variant types of AD (posterior cortical atrophy, logopenic aphasia, or frontal-variant), significant medical illness, history of brain trauma, brain surgery, or evidence of other neurological disease. The criteria for diagnosis of early AD were as follows: (1) memory complaint; (2) 0.5 or 1.0 in CDR; (3) a score lower than one standard deviation (SD) minus the average of their ages in Logical Memory II; and (4) PiB positive as described later. All patients fulfilled the National Institute of Neurologic and Communicative Disorders and Stroke and the AD Related Disorders Association (NINCDS-ADRDA; McKhann et al., 2011) or Peterson’s MCI criteria (Petersen, 2004). Clinical diagnoses were made with the consensus of three neurologists (HW, SM and GS).
Cognitively normal controls were recruited from a healthy cohort aging study by the Brain and Mind Research Center of Nagoya University. The participants in the control group had no history of neurologic or psychiatric illness, no abnormalities on neurologic examination, no subjective memory complaints, a CDR score of 0, an MMSE score of 26 or higher, an ACE-R score of 89 or higher, and a score higher than minus one SD of the average of their ages in the Logical Memory II of the Wechsler Memory Scale Revised. No focal deep white matter (WM) abnormalities characterized by hyperintensities more severe than grade 2 of the Fazekas hyperintensity rating system were observed in T2-weighted MR images (Fazekas et al., 1991).
Based on these criteria, we excluded 13 of 36 early AD patients (nine were PiB negative, three had WM abnormalities or stroke regions, one had artifacts on MRI caused by dental restorations) and 3 of 27 healthy control (two were PiB positive, one had a low Logical Memory II score). Finally, 23 early AD patients and 24 healthy controls were included.
This study conformed to the Ethical Guidelines for Medical and Health Research Involving Human Subjects endorsed by the Japanese government and received approval from the Research Ethics Committee of Nagoya University School of Medicine. All participants provided both informed and written consent to participate in this study and were treated according to the Declaration of Helsinki.
MRI Study
All MRI scans were performed using a Siemens Magnetom Verio (Siemens, Erlangen, Germany) 3.0 T scanner with a 32-channel head coil at Nagoya University’s Brain and Mind Research Center. High-resolution T1-weighted images (Repetition Time (TR) = 2.5 s, Echo Time (TE) = 2.48 ms, 192 sagittal slices with 1-mm thickness, field of view (FOV) = 256 mm, 256 × 256 matrix size) were acquired for anatomical reference. rsfMRI scans (8 min, eyes closed) were also acquired (TR = 2.5 s, TE = 30 ms, 39 transverse slices with a 0.5-mm inter-slice interval and 3-mm thickness, FOV = 192 mm, 64 × 64 matrix dimension, flip angle = 80 degrees).
Voxel-Based Morphometry (VBM)
The T1-weighted images were preprocessed using statistical parametric mapping (SPM) 12 (Wellcome Trust Center for Neuroimaging, London, UK1) running on Matlab (R2016b, Math Work, Natick, MA, USA). The images were first segmented into component images that included gray matter (GM), WM and cerebrospinal fluid (CSF). The segmented images were then processed using DARTEL (Ashburner, 2007) to obtain a group template, normalized to the standard Montreal Neurological Institute (MNI) space, resampled to an isotropic 2 × 2 × 2 mm3 voxel resolution, and smoothed using an 8-mm full-width-at-half-maximum (FWHM) isotropic 3D Gaussian filter. A two-sample t-test was performed to compare the processed images from the patient group to that of the healthy control group. We included age, gender and the total intracranial volume computed as the sum of GM, WM and CSF volumes, as covariates of no interest. The resulting statistical maps were thresholded using p < 0.05 corrected for multiple comparison using family-wise error (FWE) correction.
Resting State fMRI Data Preprocessing
The resting state fMRI data were also preprocessed using SPM 12. For each participant’s data, the first five volumes were removed to account for the initial image inhomogeneity. The remaining images were then slice-time corrected, realigned relative to the mean functional image, co-registered to the participant’s anatomical image, normalized to the standard MNI space, resampled to a 2 × 2 × 2 mm3 voxel size, and finally, smoothed using an 8-mm FWHM 3D Gaussian filter. The six estimated motion parameters, mean signals from selected regions-of-interest (ROIs) within WM and CSF, and the corresponding forward (t + 1) and backward (t − 1) translations of these signals were also regressed to minimize the effects of head motion and other physiological noise. Finally, the processed images were bandpass filtered within the frequency range from 0.01 Hz to 0.1 Hz.
Canonical RSN Analysis
Changes in well-known RSN were investigated using group independent component analysis (ICA) and dual regression analysis (Filippini et al., 2009). We used the MELODIC software from FSL package2 for ICA (Jenkinson et al., 2002, 2012; Smith, 2002). Almost 30 independent components were extracted and independent components with greatest overlap to RSN templates (Shirer et al., 2012) were identified. Subject-specific RSNs were computed using dual regression analysis (Filippini et al., 2009). Statistical analysis of the different RSNs was performed using nonparametric permutation testing (Nichols and Holmes, 2002) with 5,000 permutations to identify regions showing statistically significant differences in connectivity between the patient group and the healthy control group. A threshold-free cluster enhancement (TFCE) technique (Smith and Nichols, 2009) was used, and all statistical maps were corrected for multiple comparisons using FWE correction with p < 0.05.
Seed Based Connectivity Analysis
To perform seed-based connectivity analysis, we generated several seed ROIs which showed the most significant differences in THK5351 retention between AD and healthy controls (see list below). Time series obtained by fMRI within each ROI were extracted, and the mean was computed. To obtain the connectivity between a given ROI and the whole brain, the correlation between the resulting mean time series and the time series from all voxels within the brain were estimated. The correlation values were then converted into z-scores using Fisher’s transform. Two-sample t-tests were performed to examine changes in connectivity between the patient group and the healthy control group. The resulting statistical maps were thresholded at p < 0.05 corrected for multiple comparison using FWE cluster level correction (FWEc) with cluster defining threshold set to p = 0.001. Seed-based connectivity analyses were performed using in-house Matlab scripts, while the two-sample t-tests were performed using SPM12.
PET Study
THK5351 and PiB were prepared at the Cyclotron and Radioisotope section, Nagoya University. Radiosynthesis of Quinoline Derivatives THK5351 was prepared from the tosylate precursor (S)-2-(2-methylaminopyrid-5-yl)-6-[[2-(tetrahydro-2H-pyran-2-yloxy)-3-tosyloxy] propoxy] quinoline (THK5352) according to the previously described method for synthesizing using MPS-200 (Sumitomo Heavy Industries, Japan; Harada et al., 2016). Injectable solutions of THK5351 were prepared with a radiochemical purity of >95% and a specific activity of 113 ± 50 GBq/μmol. Radiosynthesis of the benzothiazole derivative PiB was synthesized using the one-step 11C- methyl triflate approach from the [N-methyl-11C]-6-OH-BTA-1 precursor (6-OH-BTA-0; Verdurand et al., 2008). PET imaging was performed using a Biograph 16 (Siemens Healthcare, Erlangen, Germany). After injecting 185 MBq of THK-5351 or 555 MBq of PiB, THK5351 PET images from 50 min to 60 min post-injection, PiB PET images from 50 min to 70 min post-injection were used for the following analysis.
Regional Quantification of PiB PET Imaging
We used an automatic program, PMOD’s (version 3.7; PMOD Technologies Ltd., Zurich, Switzerland) PNEURO tool with brain volumes of interest (VOIs) by automatically leveraging the most likely localization of brain areas as encoded in the maximum probability atlas (N30R83) constructed by Hammers et al. (2003). The atlas was adjusted to the individual patient’s anatomy with a spatial normalization procedure, which was obtained from the T1-MR image. Standardized uptake values (SUV) images were acquired by normalizing tissue radioactivity concentration of PiB by injected dose and body weights. The regional SUV of all VOIs was divided by average of both side of cerebellar SUV to obtain the SUV ratio (SUVR) of each VOI. In PiB PET, if the average SUVRs of all neocortical areas, except for the medial temporal lobe, occipital lobe, pre- and post-central gyrus (global cortical SUVR), was larger than 1.5, we assessed the patients as “Aβ positive” (Jack et al., 2009; Bourgeat et al., 2010; Villemagne et al., 2011, 2013).
PET (THK5351, PiB) Data Preprocessing and the Spatial Distribution Pattern Analysis
PET (THK5351, PiB) datasets were preprocessed using SPM 12. First, individual images were co-registered to the participants’ anatomical images. Using the deformation fields obtained in the segmentation stage, co-registered images were then normalized to the MNI space. After normalization, the images were resampled to a 2 × 2 × 2 mm3 voxel size and smoothed using an 8-mm FWHM isotropic 3D Gaussian filter. The preprocessed images were used in the subsequent analyses.
We performed SSM/PCA (Moeller and Strother, 1991; Alexander and Moeller, 1994; Spetsieris et al., 2013) on the obtained PET images to identify patterns that exhibited significant variance in THK5351/PiB concentration. SSM/PCA is a multivariate PCA-based algorithm that identifies major sources of variation in both patients’ and control group’s brain image data to reduce the complexity of multivariate data. To do this, the preprocessed PET images from all participants were transformed into a two-dimensional matrix where rows represent subjects and columns represent voxels. After applying a logarithmic transform to all elements in the matrix, the mean of each row (subject mean) was computed and subtracted from each row element. After this, the mean value of each column was also removed. Finally, the resulting matrix was analyzed using PCA to generate eigenimages and the associated subject-specific eigenimage scores which represented the similarity of each individual’s preprocessed THK5351/PiB concentration to the SSM/PCA-identified pattern. To delineate a specific AD-related topography, we limited the analysis to the set of principal components (PCs) that in aggregate accounted for the top 50% of subject × voxel variability, and for which each individual PC contributed at least 10% to the total variance in the scan data. (Niethammer et al., 2014). In the following analysis, we computed the correlation between component subject scores and ACE-R scores.
Intrinsic Connectivity of Canonical Resting State Network and Distribution of THK5351 Retention
Using the preprocessed PET images, we also computed the similarity of the distribution between the THK5351 concentration and intrinsic connectivity within canonical RSNs (Myers et al., 2014). RSN masks were generated from the group RSNs obtained using group ICA (see “Canonical RSN Analysis,” section above). For each RSN and subject, the intrinsic connectivity values and THK5351 values were then extracted from all voxels within the RSN mask. Using these values, the similarity of the distribution between intrinsic connectivity and THK5351 was computed using Pearson’s correlation. Negative correlation indicates that voxels with high intrinsic connectivity have low THK5351 concentrations, while positive correlation means that voxels with high THK5351 concentrations have also high within network intrinsic connectivity. In other words, the more positive the correlation is, the more similar is the distribution. We tested for differences in the obtained similarity measure between the patient group and the healthy control group using a two-sample t-test.
Comparative Study of the THK5351, Tau, MAO-B and Astrogliosis Findings of the Precuneus/Posterior Cingulate Cortex and Parahippocampus in Autopsy Cases With Alzheimer’s Disease
Two of the enrolled individuals were subjected to postmortem studies; an 87-year-old male (Case 1); and an 81-year-old female (Control 1). Pathological assays revealed that Case 1 had phosphorylated tau aggregations of Braak’s stage V, senile plaque of Consortium to Establish a Registry for AD (CERAD) C, and Aβ deposition of Thal’s Phase 5 (Montine et al., 2012); and the Control 1 did those corresponding to Braak’s stage II, CERAD B and Thal’s Phase 2. We did not find Lewy body pathology or TDP-43 inclusions among them. The pathological findings were compared to the relationship among tau, MAO-B and astrogliosis in parahippocampus and precuneus/posterior cingulate cortex (PCC). Neuropathological diagnostic analysis was performed on sections from a fixed left hemisphere by MY. The frozen tissue blocks were kept at −80°C in a deep freezer and sampled from the ~2-cm-thick coronal tissue slab of the parahippocampus and precuneus/PCC in the right hemisphere. Frozen tissues were sectioned from these blocks using a cryostat for autoradiography and immunohistochemistry. In vitro autoradiography was performed in the same protocol as previously described except for frozen sections (Harada et al., 2016, 2018). Immunohistochemistry was carried out using primary antibodies as follows; anti-phosphorylated tau (AT8, anti-mouse monoclonal, 1:200, Innogenetics, Ghent, Belgium), anti-Aβ (6F/3D, anti-mouse monoclonal, 1:50, Dako, Glostrup, Denmark), anti-GFAP (6F2, anti-mouse polyclonal, 1:100, Dako, Glostrup, Denmark) and anti-MAO-B (anti-rabbit polyclonal, 1:200, Sigma-Aldrich, St. Louis, MO, USA). The specimens of immunofluorescence were observed using Nikon Eclipse microscope (Tokyo, Japan).
Statistical Analysis
Results of groups were expressed as mean ± SD. Clinical backgrounds were compared using a non-parametric test (Mann-Whitney test or chi-squared test). We examined Spearman’s rank correlation coefficient to reveal the correlation between the ACE-R scores and component subject scores of the spatial distributions of THK5351/PiB covariation pattern. All statistical tests were two-tailed. The statistical significance threshold was set at p < 0.05. Statistical analyses were performed using the Statistical Package for the Social Sciences (SPSS) version 24 (SPSS Inc., Chicago, IL, USA).
Results
Patients’ Characteristics
There were no significant differences in age at examination, male-to-female ratio, and education levels between early AD and healthy controls. In early AD, 15 had a CDR score of 0.5, and eight had a score of 1.0. Significantly different scores of MMSE, ADAS-cog-j, logical memory II and ACE-R scores were found between early AD and healthy controls (Table 1).
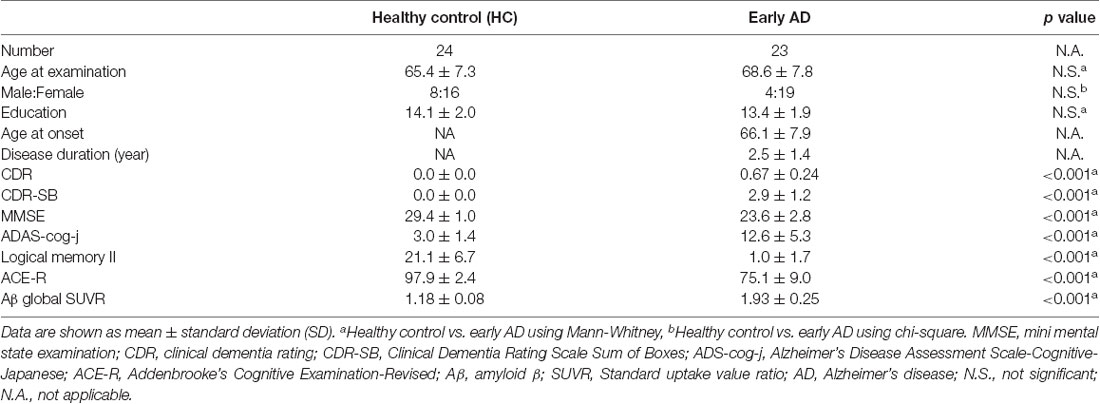
Table 1. Patients’ characteristics.
Voxel-Based Morphometry Findings
Patients with early AD showed significantly decreased GM volume in the bilateral lingual gyrus (Brodmann area (BA) 30) and parahippocampal gyrus (BA30) compared to healthy controls (FWE at p < 0.05, Figure 1).
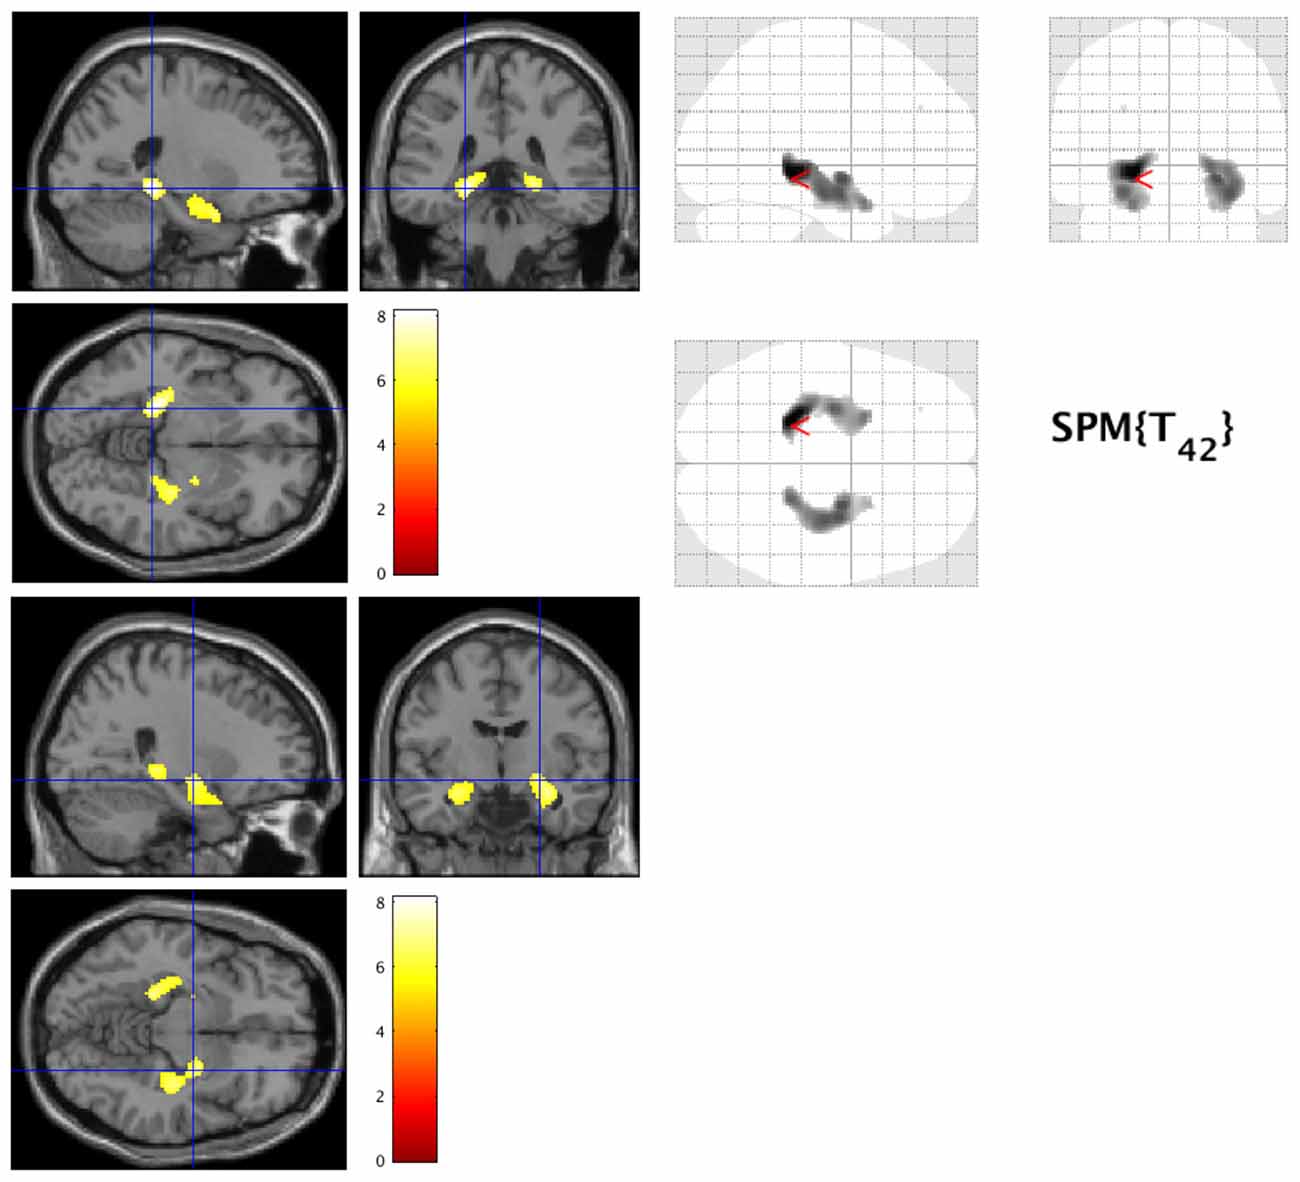
Figure 1. Decreased gray matter volume in early Alzheimer’s disease (AD). The hot spots indicate sites where gray matter’s volume significantly decreased in AD (family-wise error cluster level correction (FWEc) at p < 0.05).
Spatial Distributions of THK5351 Using Scaled Subprofile Modeling/Principal Component Analysis (SSM/PCA)
SSM/PCA of the THK5351PET imaging data identified a significant spatial THK5351 pattern corresponding to principal component 1 (PC1) (Figure 2A), which accounted for 23.6% of the total subject voxel variance of the data (Figure 3A) and had 82.6% sensitivity and 79.1% specificity in discriminating AD from healthy controls (Figure 3B). Thus, we called this distribution pattern (PC1) as AD-related THK5351 distribution pattern (ADRTP) and its PC score as ADRTP score. The ADRTP was composed of three major clusters (Table 2). Clusters 1 and 2 of ADRTP mainly included bilateral inferior, middle and superior frontal gyrus (BA 6, 8, 9, 10; cluster size >100). Cluster 3 of ADTRP included the inferior parietal lobule (BA 40), precuneus (BA7, 19), posterior cingulate cortex (BA31), inferior (BA20, 21), middle (BA39), and superior temporal gyrus (BA22), and fusiform gyrus (BA37; cluster size >100; Table 2). Among the ADRTP-related regions, the most prominent areas were the precuneus and PCC (Cluster 3), followed by the lateral middle and superior frontal gyri, which is well known as the dorsolateral prefrontal cortex (DLPFC; Figure 2A, Table 2) corresponding to Braak IV and V. The correlation between subject scores of ADRTP and ACE-R scores was significant in all participants (r = −0.68, p = 1.9 × 10⁻⁷; Figure 3C), in only early AD patients with a CDR score of 0.5 and 1.0 (r = −0.44, p = 0.037; Figure 3C), and in early AD with a CDR score of 1.0 (r = −0.72, p = 0.045; Figure 3D), but not in healthy controls (r = 0.10, p = 0.7).
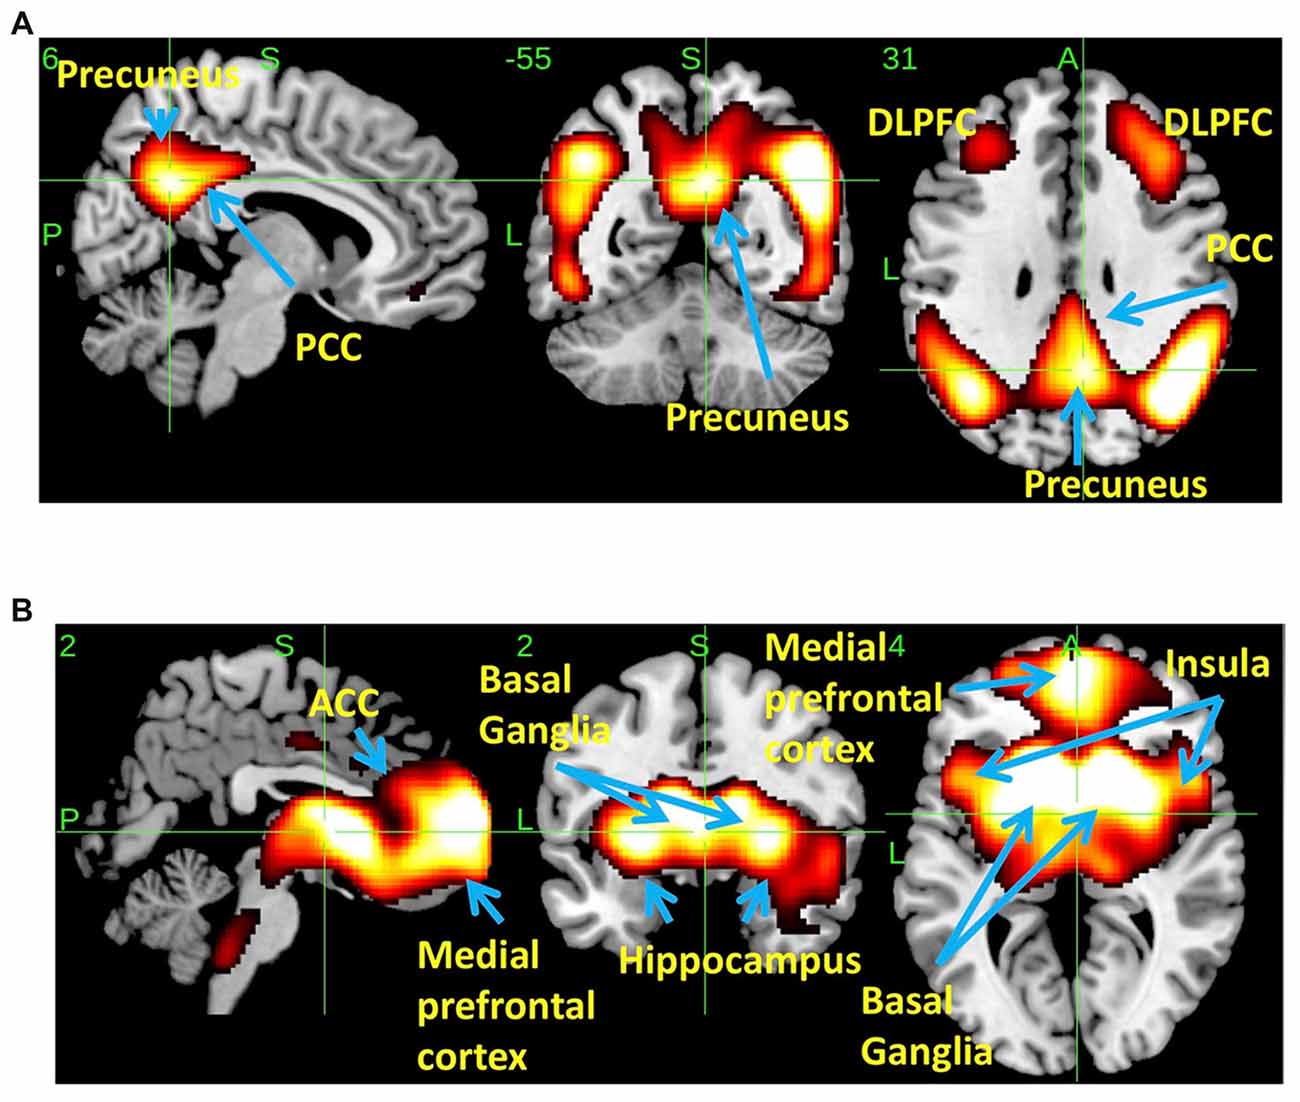
Figure 2. Spatial distributions of THK5351 covariation pattern using scaled subprofile modeling/principal component analysis (SSM/PCA). AD-related THK5351 distribution pattern (ADRTP; A): SSM/PCA identified a principal component 1 (PC1), which indicates AD-related THK5351 covariation pattern (ADRTP). The hot areas represent PC1. Common distribution pattern of THK5351 between healthy control (HC) and AD (B): SSM/PCA identified PC2, which indicates that the accumulation sites common to early AD patients and HC. The hot areas represent PC2.
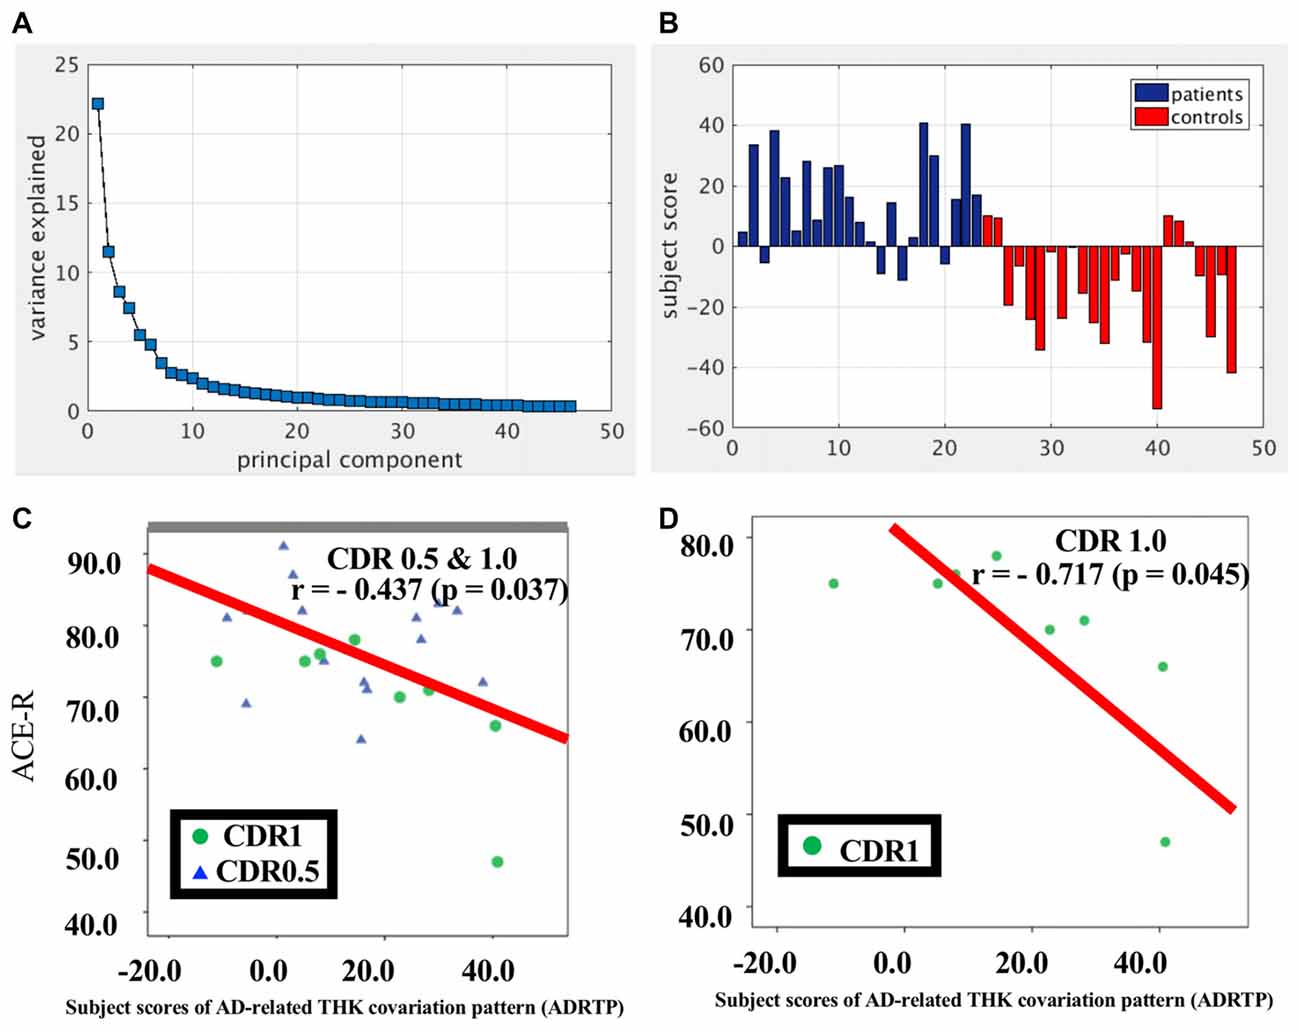
Figure 3. PC1 and subject score, ADRTP. Panel (A) shows ADRTP. This figure indicates the ratio of each PC with the total subject voxel variance of data. Panel (B) shows subject score relative to PC1 which showed 82.6% sensitivity and 79.1% specificity in discriminating AD from HC. Panel (C) shows the relationship between the Addenbrooke’s Cognitive Examination Revised (ACE-R) and the ADRTP subject scores of early AD patients, Clinical Dementia Rating 1.0 (CDR 1.0) and CDR 0.5. Blue triangles indicate CDR0.5, and green circles indicate CDR1.0. Panel (D) represents the relationship between ACE-R and the ADRTP subject scores of early AD patients, CDR1.0. Green circles indicate CDR1.0.
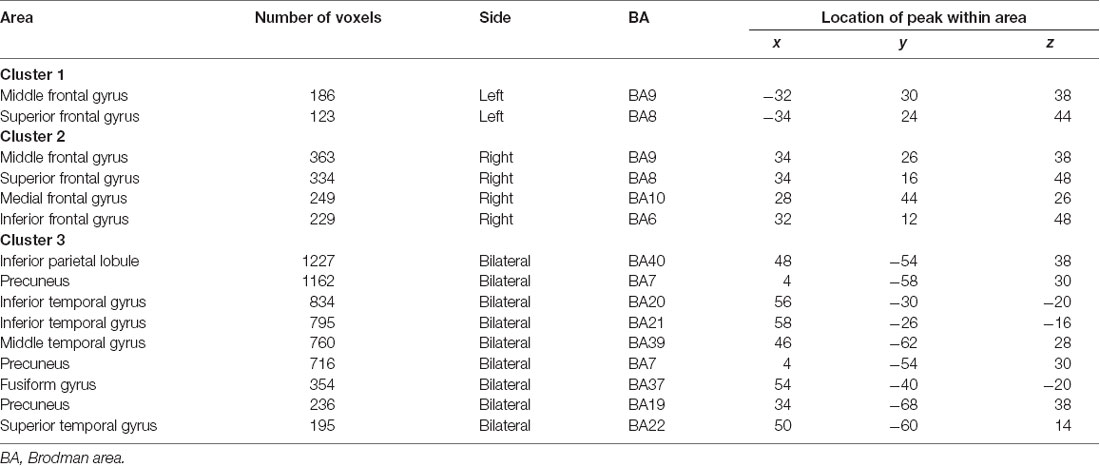
Table 2. Location of AD-related THK5351 distribution pattern (PC1).
PC2 (Figure 2B), the second most important PC accounting for 11.8% of the total subject voxel variance, included the bilateral basal ganglia, hippocampus, medial prefrontal cortex and anterior cingulate cortex—regions where tau distribution and increased MAO-B was commonly observed in healthy aged controls (Lemoine et al., 2017; Ng et al., 2017). Scores based on PC2 had 70.8% sensitivity and 52.2% specificity in discriminating healthy controls from AD. PC2 scores did not show any significant correlation with ACE-R and CDR.
Spatial Distributions of Amyloid β Pattern Using SSM/PCA
We also identified significant spatial Aβ covariation patterns (AD related Aβ distribution pattern, ADRAP; Supplementary Figure S1A) that showed an analogous distribution of ADRTP and accounted for greater than 50% of the data’s variance (Supplementary Figure S1B). However, ADRAP was more widespread in the medial frontal gyrus (BA6, 9, 10, 11), precuneus (BA7), supramarginal gyrus (BA40), middle temporal gyrus (BA21, 39, 46), superior temporal gyrus (BA13, 22, 42), anterior cingulate cortex (BA32), insula (BA47), and posterior cingulate cortex (BA23). ADRAP had 100% sensitivity and 100% specificity in discriminating AD from healthy controls. This result was quite reasonable because we included PiB positive AD patients and PiB negative healthy controls based on global SUVR higher than 1.5 or not (Supplementary Figure S1C). However, the correlations between subjects’ ADRAP scores and ACE-R scores were not significant in early AD patients (r = −0.04, p = 0.8) irrespective of CDR score (0.5 and 1.0, r = 0.04; 1.0, r = −0.03), or in healthy controls (r = 0.06, p = 0.8).
Relationship Between Spatial Distribution of THK5351 Retention and Canonical Resting State Networks
The estimated similarity values of the distribution between THK5351 concentration and intrinsic functional connectivity values within canonical RSNs computed as the correlation between the two variables were mostly negative in healthy controls (Figure 4). This indicates that, in healthy controls, voxels with higher intrinsic connectivity within the network is associated with lower THK5351 concentration. However, in the patient group, a shift towards a more positive association, i.e., higher connectivity, higher THK5351 concentration, was observed and was significant in some canonical RSNs. Two-sample t-test comparisons of the similarity between the spatial distribution patterns of THK5351 retention and within-network intrinsic functional connectivity showed significant difference in the precuneus/PCC network (p = 6.2 × 10⁻⁴) and right executive control network (p = 1.6 × 10⁻⁴), followed by ventral DMN (p = 0.0054), visuospatial network (p = 0.016) and language network (p = 0.029). The results of ICA and dual regression analyses also showed decreased connectivity within the right executive control network, ventral DMN, visuospatial network and language network (FWE at p < 0.05).
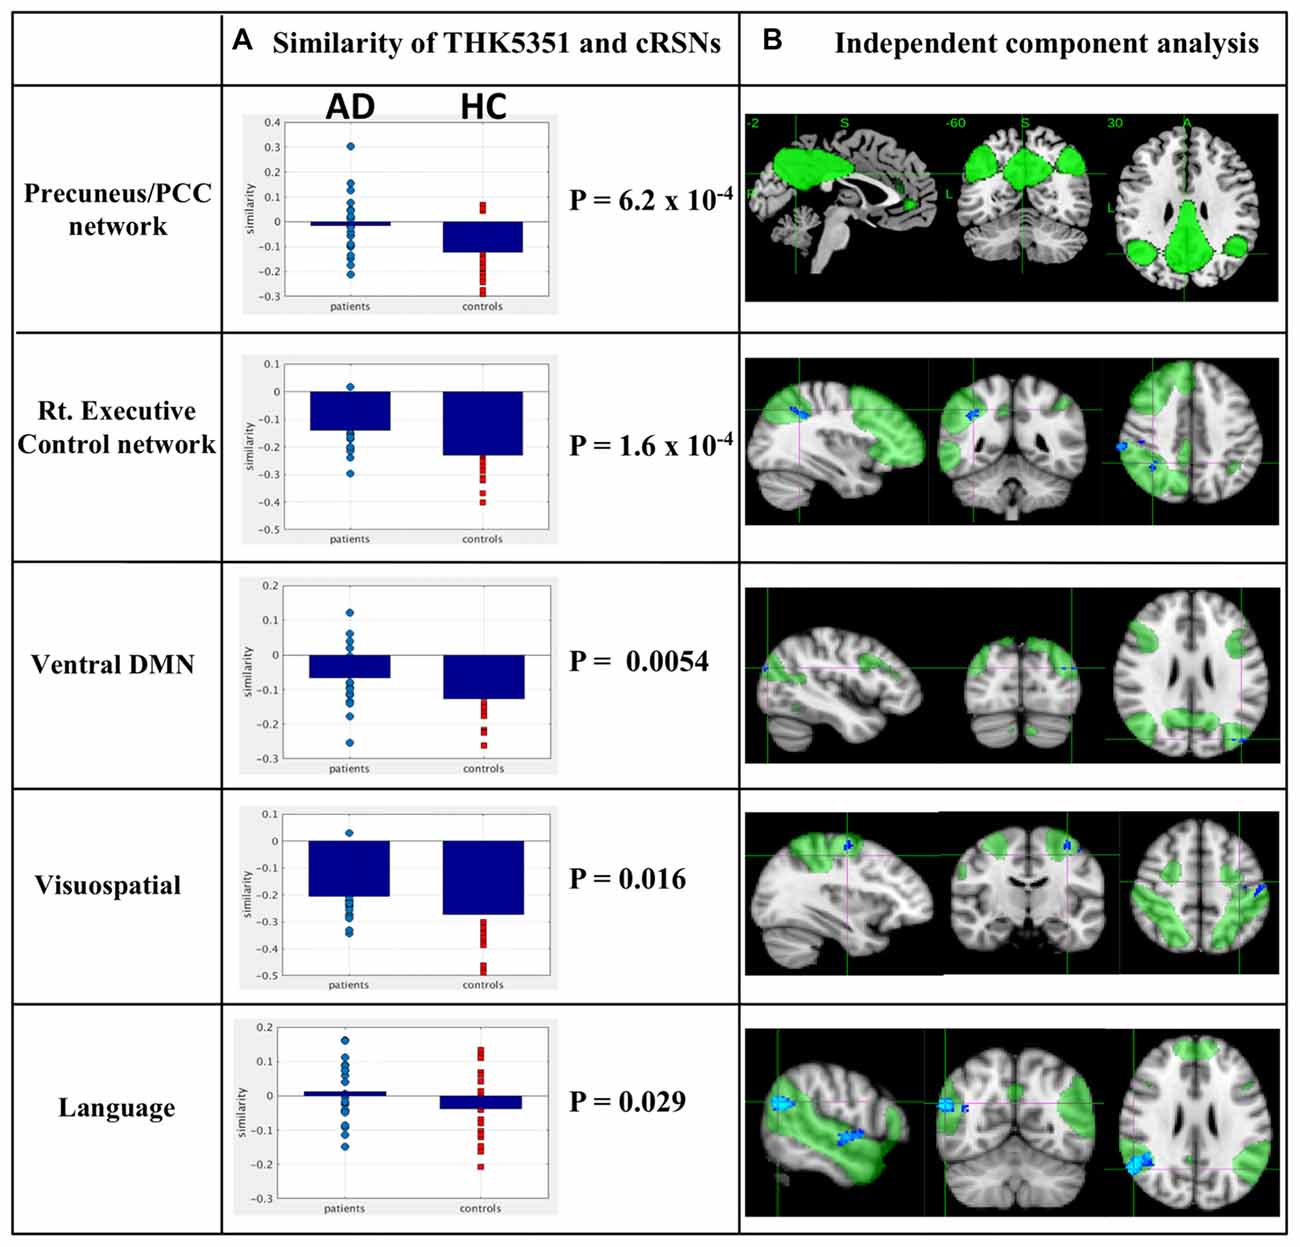
Figure 4. Relationship between THK5351 retention and canonical resting state networks (RSNs). Panel (A) shows the similarity of the THK5351 retention pattern and each canonical RSN. Panel (B) is the result of independent component analysis (ICA). The green areas indicate each canonical network, and the blue areas indicate decreased connectivity, as identified by ICA of resting-state functional MRI data (FWE at p < 0.05).
Seed-Based Analysis of Functional Connectivity of Highly THK5351-Retaining Regions
The most significant difference in THK5351 retention between early AD and healthy controls in the ADRTP was observed in the bilateral precuneus/PCC and the left DLPFC. Thus, we performed seed-based connectivity analysis using two ROIs as the seed regions. The mean connectivities of the precuneus/PCC and the DLPFC in healthy controls is shown in Figures 5A,D, while those in early AD is shown in Figures 5B,E. The intrinsic connectivity of precuneus/PCC significantly decreased in the left middle occipital gyrus, left superior temporal gyrus, left amygdala/hippocampus and right fusiform gyrus (FWEc p < 0.05, cluster defining threshold, p = 0.001, cluster size = 170; Table 3, Figure 5C). That of left DLPFC decreased to the left inferior parietal lobule (FWEc p < 0.05, cluster defining threshold, p = 0.001, cluster size = 220; Table 3, Figure 5F).
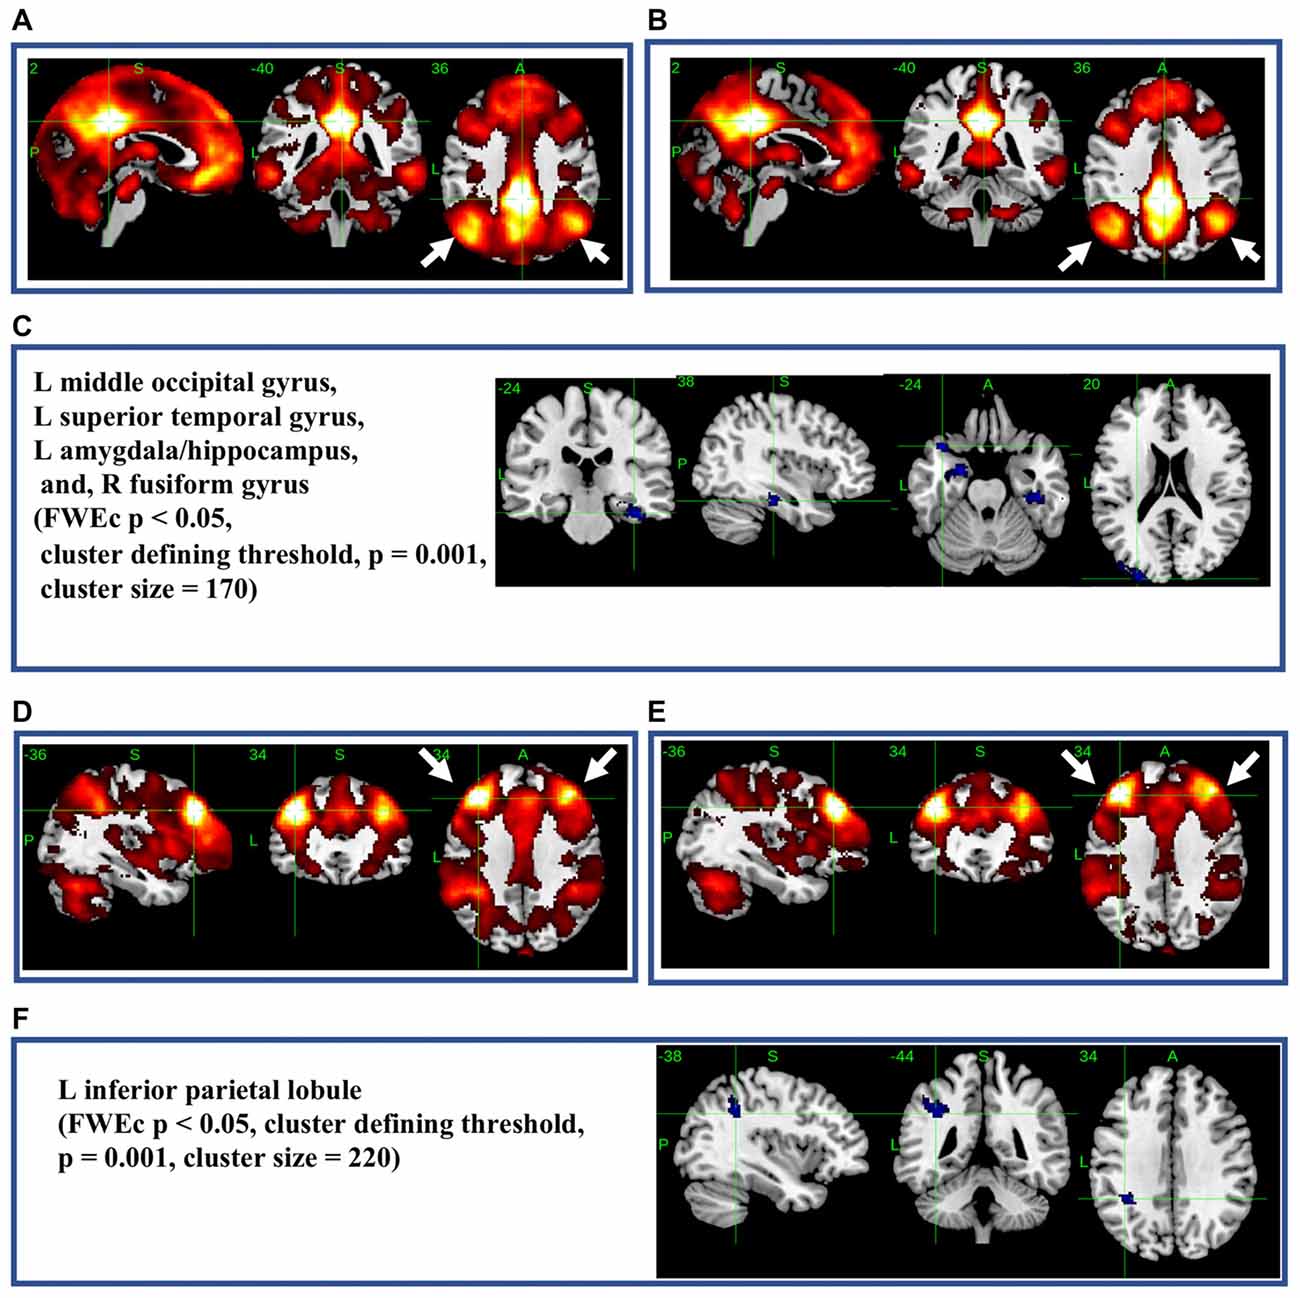
Figure 5. Seed-based connectivity of the precuneus/posterior cingulate cortex (PCC) and dorsolateral prefrontal cortex (DLPFC). This figure shows seed-based connectivity analysis from ROIs located in the precuneus/PCC (A–C), and DLPFC (D–F). (A,D) HC (B,E) early AD; (C) intrinsic connectivity of precuneus/PCC significantly decreased to the hot areas (FWEc p < 0.05, cluster defining threshold, p = 0.001, cluster size = 170). (F) Intrinsic connectivity of DLPFC significantly decreased to the hot areas (FWEc p < 0.05, cluster defining threshold, p = 0.001, cluster size = 220).
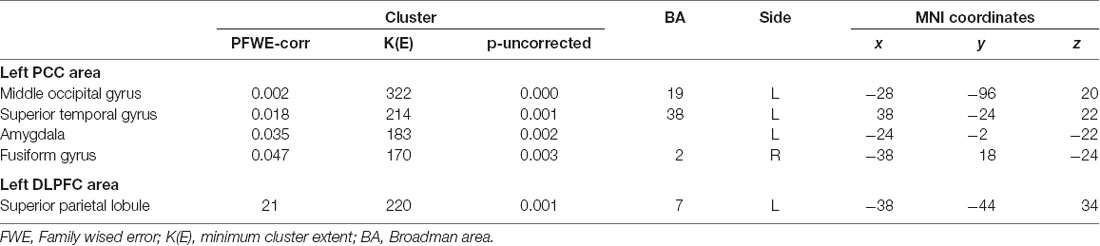
Table 3. Seed based connectivity analysis.
Comparative Study Among THK5351, Tau, MAO-B and Astrogliosis Findings of the Precuneus/PCC in Autopsy Cases With Alzheimer’s Disease
In autoradiograhy, 3H-THK5351 bindings in the parahippocampal gyrus and precuneus/PCC was more evident in a patient with Braak’s stage V (Case 1) than in a healthy control with stage II (Control 1, Figures 6A,B). After treatment with lazabemide as a MAO-B inhibitor, 3H-THK5351 bindings remained detectable in the parahippocampus and precuneus/PCC in Case 1 with Braak’s stage V, but was scarce in Control 1 with Braak’s stage II (Figure 6A). Immunostaining showed that tau, MAO-B, and GFAP accumulation were more severe in Case 1 with Braak’s stage V than in Control 1 with Braak’s stage II (Figure 6B). Double immunofluorescence revealed co-localization of GFAP and MAO-B within in the astrocyte (Figure 6C). Anti-GFAP immunohistochemistry diffusely labeled the cytoplasm and processes of astrocytes, which contained MAO-B immunopositive granules.
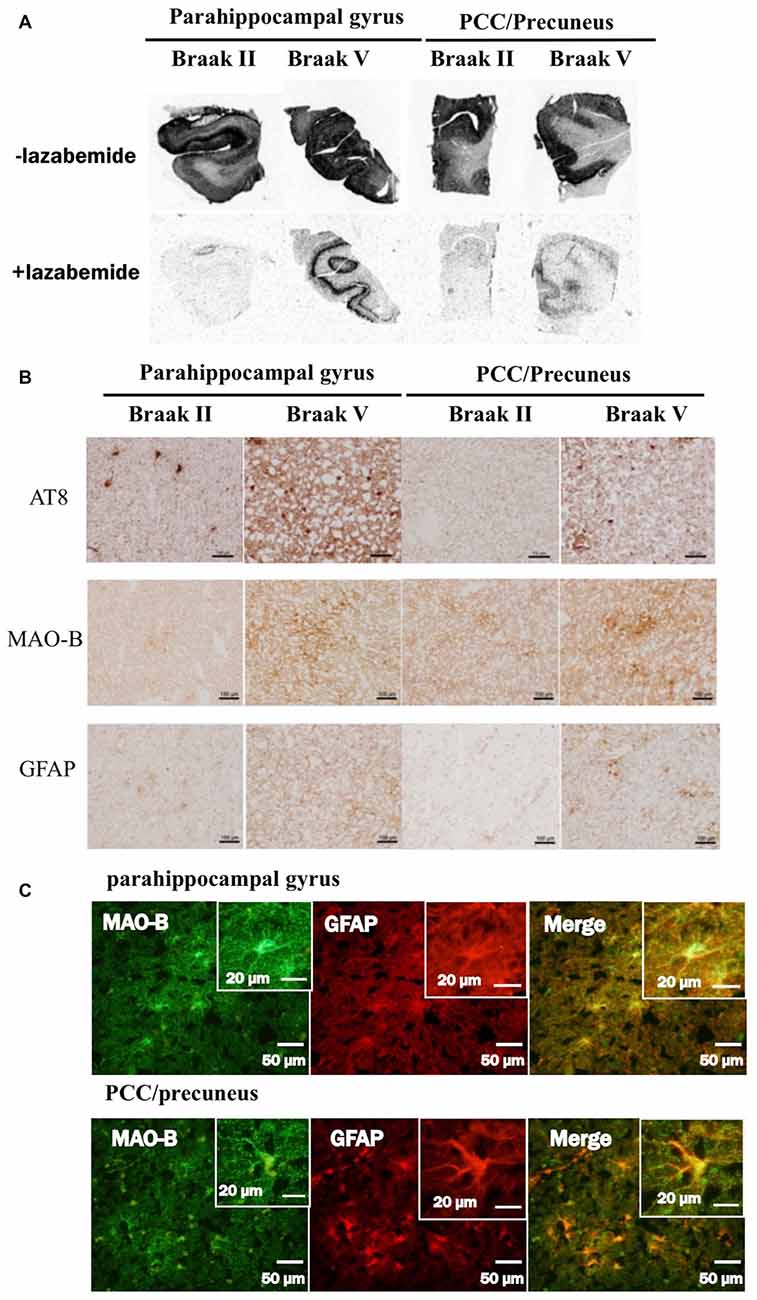
Figure 6. Comparative study among THK5351, tau, monoamine oxidase-B (MAO-B) and astrogliosis findings of the precuneus/posterior cingulate gyrus (PCC) and parahippocampal gyrus in autopsy cases with AD. Panel (A) shows the results of 3H-THK5351 autoradiography. In vitro autoradiogram of 3H-THK5351 in brain sections of the parahippocampal gyrus and precuneus/PCC from an 81-year-old control (Braak II) and an 87-year-old AD patient (Braak V) in the absence and presence of the MAO-B inhibitor lazabemide. 3H-THK5351 bindings in the parahippocampal gyrus and precuneus/PCC was more evident in a patient with Braak’s stage V (Case 1) than in a healthy control with Braak’s stage II (Control 1). After treatment with lazabemide (+lazabemide) as a MAO-B inhibitor, 3H-THK5351 bindings remained detectable in the parahippocampus and precuneus/PCC in Case 1 with Braak’s stage V but was scarce in Control 1 with Braak’s stage II. Panel (B) demonstrates the results of immunostaining of tau, MAO-B, and glial fibrillary acidic protein (GFAP). Anti-tau antibody (AT8), anti-MAO-B antibody and GFAP immunohistochemistry revealed marked immunostaining in an AD case, compared to a healthy control. Tau, MAO-B and GFAP accumulation were more evident in Braak’s stage V than in Braak’s stage II patients. Panel (C) is the result of double immunofluorescence for GFAP and MAO-B. Tissue sections double stained with anti-MAO-B antibody and anti-GFAP antibody in a Braak’s stage V parahippocampal gyrus, and the PCC/precuneus. GFAP and MAO-B were colocalized in the astrocyte. Anti-GFAP immunohistochemistry diffusely labeled the cytoplasm and processed of astrocytes, which contained MAO-B immunopositive granules.
Discussion
The Significance of Precuneus/PCC Involvement for the Development of Alzheimer’s Disease Symptoms
This is the first study to demonstrate ADRTP in early AD using SSM/PCA, a non-biased data-driven approach. The characteristics of AD features were as follows: (1) the most prominent AD-specific THK5351 retention areas in the ADRTP were the precuneus/PCC followed by the DLPFC; (2) the subject ADRTP scores were significantly correlated with the cognitive scores; (3) the significant correlation of distribution pattern of THK5351 retention to the intrinsic connectivity within canonical RSNs was observed in the precuneus/PCC networks; (4) seed-based connectivity analysis of the precuneus/PCC showed significantly decreased connectivity to widespread regions associated with cognitive function; and (5) pathologically, THK5351 retention was associated with tau deposition, astrogliosis and MAO-B and was more evident in the precuneus/PCC with Braak’s stage V (Alzheimer type dementia) than the precuneus/PCC with Braak’s stage II (healthy control). These findings support the view that tau retention and astrogliosis/neurodegeneration in the precuneus/PCC will play an important role in determining the dementia state in early AD.
The ADRTP (PC1) discriminated the AD-specific THK5351 deposition pattern and indicated the potential involvement of canonical brain networks in AD. In addition, the subject score indicating the similarity to the ADRTP (PC1), showed a significant association with cognitive function in early AD patients, particularly patients with CDR equal to 1.0. Thus, ADRTP could provide an important measure for the diagnosis of early AD. Indeed, the ADRTP subject score showed good sensitivity and specificity in differentiating early AD patients from healthy controls.
The precuneus network is part of the classical DMN along with the dorsal DMN and ventral DMN. In addition, both the precuneus and PCC show high levels of metabolism, are vascular boundaries, have widespread connections to other brain regions serving as brain network hubs, and key nodes in the classical DMN (Cavanna and Trimble, 2006; Zhang and Li, 2012; Leech and Sharp, 2014; Utevsky et al., 2014). Pathologically, the precuneus/PCC is involved in Braak’s stage IV, leading to the appearance of initial clinical symptoms, and Braak’s stage V, which is associated with full development of AD. As one of the most important brain network hub regions, tau retention and astrogliosis/neurodegeneration extending to the precuneus/PCC could therefore lead to widespread disruption of brain networks responsible for the maintenance of normal cognitive function, which in turn could result in the manifestation of dementia in AD. Indeed, in our study, functional connections from the precuneus/PCC were significantly altered over widespread regions in the brain. More recently, Hoenig et al. (2018) also demonstrated the significant overlap between distribution of AV1451PET (tau PET probe) and canonical networks especially, ventral and dorsal DMN assessed by ICA.
Aside from the precuneus/PCC, ADRTP also showed the DLPFC which is brain network hub regions (Bullmore and Sporns, 2012) as the second most prominent region involved in early AD. These prefrontal cortices can also show the differences between AD and healthy controls (Stam, 2014). These results further indicate that THK5351 retention in the brain hub regions would be closely associated with the development of dementia in AD. Dynamic network changes would occur in the DLPFC and precuneus/PCC during disease progression from healthy aging to MCI or AD (Binnewijzend et al., 2012; Brier et al., 2012; Adriaanse et al., 2014), which would also play an important compensatory role (Bozzali et al., 2015; Wang et al., 2015; Elman et al., 2016; Serra et al., 2016).
PiB Retention (Amyloid β Deposition) and Resting State Networks
In this study, we also identified ADRAP using SSM/PCA. The ADRAP subject score did not show any significant correlation with ACE-R in AD (r = −0.04, p = 0.8) in contrast to ADRTP (Figure 4D), confirming previous reports (Fripp et al., 2008) and supporting the view that PiB deposition is not independently correlated to the development of dementia (Rowe et al., 2007; Jack et al., 2009; Canter et al., 2016). Aβ retention topography exhibits a high degree of overlap with the DMN (Buckner et al., 2008; Canter et al., 2016) and other intrinsic network disruptions in AD (Sheline et al., 2010; Lim et al., 2014; Busche et al., 2015). While it is widely accepted that there is a significant discrepancy between the Aβ pathological severity of AD and its clinical phenotype (Jack et al., 2009; Canter et al., 2016). Thus, our results on the lack of relationship between PiB retention and the decline of cognitive function are also consistent with previous reports (Jack et al., 2009; Villemagne et al., 2011) and may support the view that tau deposition and astrogliosis/neurodegeneration, rather than Aβ pathology, have a close relationship with cognitive decline, predominantly memory impairment, in AD.
Relationship Among MAO-B, Astrogliosis and Tau
Recently, regional in vivo THK5351 retention was reported to be significantly correlated with the density of tau aggregates in the neocortex and MAO-B in whole brain (Ng et al., 2017; Harada et al., 2018) as compared to AV-1451 (Jang et al., 2018). Furthermore, a significant association was observed between the density of tau aggregates, MAO-B and GFAP, suggesting that neocortical tau is strongly correlated with the formation of reactive astrocytes. In this study, we confirmed that increased MAO-B and astrogliosis co-localized according to double immunostaining in the involved regions. Astrogliosis is linked to neurodegeneration/neuronal loss in many neurodegenerative disorders, although it is still debatable whether astrogliosis or neurodegeneration is the earlier event. The fact that THK5351 binds to the MAO-B related to astrogliosis (Ng et al., 2017; Harada et al., 2018) supports the view that THK5351 imaging has potential for visualizing tau pathology, astrogliosis and neurodegeneration. Significant negative correlation between THK5351 retention and glucose hypometabolism in AD were also reported (Kang et al., 2017). In addition, SSM/PCA clearly demonstrated the discrimination ADRTP (PC1) and non-specific THK5351 retention (PC2) in this study. Thus, the spatial THK5351 retention pattern demonstrated by ADRTP could reflect the AD pathology rather than the restricted tau pathology. However, further clinical, radiological, and pathological studies with a larger number of patients will be needed to clarify this issue.
Tau aggregation and astrogliosis are two quite distinct biological mechanisms, both of which are the critical features of pathogenic mechanisms for AD development, and also both are closely linked in AD pathologic legions. Unfortunately, THK5351 as state of the art cannot distinguish between tau accumulation and astrogliosis. However, we speculated that THK5351 could detect both pathologic processes simultaneously and can be a marker for these process in AD. Future development of PET tracers which have improved binding selectivity and pharmacokinetics to tau and MAO-B/astrogliosis will help not only for better understanding the underlying mechanism of AD but also for clinical trials targeting astrogliosis (Okamura et al., 2018).
Relationship Between Hubs of the Brain Networks and AD Pathology
Within large-scale brain networks, hubs have a remarkably high number of connections through which they integrate the functions of distant networks. More energy probably will be needed to maintain hub function as compared to other regions (Achard and Bullmore, 2007; He et al., 2009). The sustained metabolic activation of the brain’s DMN is thought to render the system vulnerable to AD. Recent studies demonstrated that enhanced neuronal activity could increase the release and transfer of tau and Aβ in vitro and exacerbate tau Aβ pathology in vivo (Wu et al., 2016), suggesting that increasing hub activities may be associated with acceleration of Aβ and tau accumulations. Thus, one hypothesis could be derived based on the balance between intrinsic vulnerabilities with increasing activities of neuronal subpopulations to stressors, and specific disease-related misfolding proteins may determine the neuronal and network involvements (Saxena and Caroni, 2011). Although recent developments of network science have demonstrated the overload and failure of hubs as a conceivable final common pathway in neurodegenerative disorders (Stam, 2014), further study will be needed to ascertain the role of hubs in both compensating cognitive function and accelerating abnormal Aβ and tau accumulations.
Author Contributions
The data of this study were acquired by TY, HW, HY, MM, KI, AO, RO, KazuyaK, KH, SM, KatsuhikoK, RH and MY. TY, HW, EB and GS analyzed the data, interpreted the results and drafted this manuscript. YR, SI, SM, MK, SN, RH, NO, KY and MY revised this manuscript critically for important intellectual content. All authors approved the final version of this manuscript.
Funding
This work was supported by Grants-in-Aid from the Research Committee of Central Nervous System Degenerative Diseases by the Ministry of Health, Labour and Welfare, and from Integrated Research on Neuropsychiatric Disorders, project carried out under the Strategic Research for Brain Sciences by the Ministry of Education, Culture, Sports, Science and Technology of Japan. This work was also supported by a Grant-in-Aid for Scientific Research from the Ministry of Education, Culture, Sports, Science and Technology (MEXT) of Japan (grant number 80569781), and a Grant-in-Aid for Scientific Research on Innovative Areas (Brain Protein Aging and Dementia Control; 26117002) from MEXT.
Conflict of Interest Statement
The authors declare that the research was conducted in the absence of any commercial or financial relationships that could be construed as a potential conflict of interest.
Abbreviations
ACE-R, the Addenbrooke’s Cognitive Examination Revised; ADAS-cog-J, the Alzheimer’s Disease Assessment Scale-Cognitive-Japanese; ADRAP, Alzheimer’s disease related amyloid βdistribution pattern; ADRTP, Alzheimer’s disease-related THK5351 distribution pattern; BA, brodmann area; CDR, Clinical Dementia Rating; CERAD, Consortium to Establish a Registry for Alzheimer’s Disease; CSF, cerebrospinal fluid; DLPFC, dorsolateral prefrontal cortex; DMN, default mode network; FOV, field of view; FWE, family-wise error; FWEc, FWE cluster level correction; FWHM, full-width-at-half-maximum; GFAP, glial fibrillary acidic protein; GM, gray matter; ICA, independent component analysis; MAO-B, monoamine oxidase-B; MCI, minimal cognitive impairment; MMSE, the mini mental state examination; MNI, Montreal Neurological Institute; PCA, principal component analysis; PCC, posterior cingulate cortex; PiB, 11C-Pittsburgh compound B; rsfMRI, resting state functional MRI; RSN, resting state network; SPM, statistical parametric mapping; SSM/PCA, scaled subprofile modeling/principal component analysis; SUV, standardized uptake values; SUVR, SUV ratio; TE, echo time; THK5351, 18F-THK5351; TR, repetition time; WM, white matter.
Footnotes
Supplementary Material
The Supplementary Material for this article can be found online at: https://www.frontiersin.org/articles/10.3389/fnagi.2018.00304/full#supplementary-material
FIGURE S1 | Spatial distributions of the amyloid β (PiB) covariation pattern using SSM/PCA. Panel (A) shows the Alzheimer’s disease-related Aβ distribution pattern (ADRAP). SSM/PCA identified an Alzheimer’s disease-related Aβ covariation pattern (ADRAP). The hot areas represent principal component 1 of ADRAP. Panel (B) is the Alzheimer’s disease-related PiB distribution pattern. This figure indicates the ratio of each principal component with the total subject voxel variance of data. Panel (C) is Subject score relative to principal component 1 of Alzheimer’s disease-related amyloid β (PiB) covariation pattern.
References
Achard, S., and Bullmore, E. (2007). Efficiency and cost of economical brain functional networks. PLoS Comput. Biol. 3:e17. doi: 10.1371/journal.pcbi.0030017
Adriaanse, S. M., Binnewijzend, M. A., Ossenkoppele, R., Tijms, B. M., van der Flier, W. M., Koene, T., et al. (2014). Widespread disruption of functional brain organization in early-onset alzheimer’s disease. PLoS One 9:e102995. doi: 10.1371/journal.pone.0102995
Agosta, F., Pievani, M., Geroldi, C., Copetti, M., Frisoni, G. B., and Filippi, M. (2012). Resting state fMRI in Alzheimer’s disease: beyond the default mode network. Neurobiol. Aging 33, 1564–1578. doi: 10.1016/j.neurobiolaging.2011.06.007
Alexander, G. E., and Moeller, J. R. (1994). Application of the scaled subprofile model to functional imaging in neuropsychiatric disorders: a principal component approach to modeling brain function in disease. Hum. Brain Mapp. 2, 79–94. doi: 10.1002/hbm.460020108
Ashburner, J. (2007). A fast diffeomorphic image registration algorithm. Neuroimage 38, 95–113. doi: 10.1016/j.neuroimage.2007.07.007
Binnewijzend, M. A., Schoonheim, M. M., Sanz-Arigita, E., Wink, A. M., van der Flier, W. M., Tolboom, N., et al. (2012). Resting-state fMRI changes in Alzheimer’s disease and mild cognitive impairment. Neurobiol. Aging 33, 2018–2028. doi: 10.1016/j.neurobiolaging.2011.07.003
Bourgeat, P., Chételat, G., Villemagne, V. L., Fripp, J., Raniga, P., Pike, K., et al. (2010). β-Amyloid burden in the temporal neocortex is related to hippocampal atrophy in elderly subjects without dementia. Neurology 74, 121–127. doi: 10.1212/WNL.0b013e3181c918b5
Bozzali, M., Dowling, C., Serra, L., Spanò, B., Torso, M., Marra, C., et al. (2015). The impact of cognitive reserve on brain functional connectivity in Alzheimer’s disease. J. Alzheimers Dis. 44, 243–250. doi: 10.3233/JAD-141824
Brier, M. R., Thomas, J. B., Snyder, A. Z., Benzinger, T. L., Zhang, D., Raichle, M. E., et al. (2012). Loss of intranetwork and internetwork resting state functional connections with Alzheimer’s disease progression. J. Neurosci. 32, 8890–8899. doi: 10.1523/JNEUROSCI.5698-11.2012
Buckner, R. L., Andrews-Hanna, J. R., and Schacter, D. L. (2008). The brain’s default network: anatomy, function and relevance to disease. Ann. N Y Acad. Sci. 1124, 1–38. doi: 10.1196/annals.1440.011
Bullmore, E., and Sporns, O. (2012). The economy of brain network organization (2012). Nat. Rev. Neurosci. 13, 336–349. doi: 10.1038/nrn3214
Busche, M. A., Kekuš, M., Adelsberger, H., Noda, T., Forstl, H., Nelken, I., et al. (2015). Rescue of long-range circuit dysfunction in Alzheimer’s disease models. Nat. Neurosci. 18, 1623–1630. doi: 10.1038/nn.4137
Canter, R. G., Penney, J., and Tsai, L. H. (2016). The road to restoring neural circuits for the treatment of Alzheimer’s disease. Nature 539, 187–196. doi: 10.1038/nature20412
Cavanna, A. E., and Trimble, M. R. (2006). The precuneus: a review of its functional anatomy and behavioural correlates. Brain 129, 564–583. doi: 10.1093/brain/awl004
Damoiseaux, J. S., Prater, K. E., Miller, B. L., and Greicius, M. D. (2012). Functional connectivity tracks clinical deterioration in Alzheimer’s disease. Neurobiol. Aging 33, 828.e19–828.e30. doi: 10.1016/j.neurobiolaging.2011.06.024
Ekblom, J., Jossan, S. S., Bergström, M., Oreland, L., Walum, E., and Aquilonius, S. M. (1993). Monoamine oxidase-B in astrocytes. Glia 8, 122–132. doi: 10.1002/glia.440080208
Elman, J. A., Madison, C. M., Baker, S. L., Vogel, J. W., Marks, S. M., Crowley, S., et al. (2016). Effects of β-amyloid on resting state functional connectivity within and between networks reflect known patterns of regional vulnerability. Cereb. Cortex 26, 695–707. doi: 10.1093/cercor/bhu259
Fazekas, F., Kleinert, R., Offenbacher, H., Fazekas, F., Payer, F., Schmidt, R., et al. (1991). The morphologic correlate of incidental punctate white matter hyperintensities on MR images. Am. J. Neuroradiol. 12, 915–921.
Filippini, N., MacIntosh, B. J., Hough, M. G., Goodwin, G. M., Frisoni, G. B., Smith, S. M., et al. (2009). Distinct patterns of brain activity in young carriers of the APOE-ε4 allele. Proc. Natl. Acad. Sci. U S A 106, 7209–7214. doi: 10.1073/pnas.0811879106
Fripp, J., Bourgeat, P., Acosta, O., Raniga, P., Modat, M., Pike, K. E., et al. (2008). Appearance modeling of 11C PiB PET images: characterizing amyloid deposition in Alzheimer’s disease, mild cognitive impairment and healthy aging. Neuroimage 43, 430–439. doi: 10.1016/j.neuroimage.2008.07.053
Greicius, M. D., Srivastava, G., Reiss, A. L., and Menon, V. (2004). Default-mode network activity distinguishes Alzheimer’s disease from healthy aging: evidence from functional MRI. Proc. Natl. Acad. Sci. U S A 101, 4637–4642. doi: 10.1073/pnas.0308627101
Hammers, A., Allom, R., Koepp, M. J., Free, S. L., Myers, R., Lemieux, L., et al. (2003). Three-dimensional maximum probability atlas of the human brain, with particular reference to the temporal lobe. Hum. Brain Mapp. 19, 224–247. doi: 10.1002/hbm.10123
Harada, R., Ishiki, A., Kai, H., Sato, N., Furukawa, K., Furumoto, S., et al. (2018). Correlations of 18F-THK5351 PET with postmortem burden of Tau and astrogliosis in Alzheimer disease. J. Nucl. Med. 59, 671–674. doi: 10.2967/jnumed.117.197426
Harada, R., Okamura, N., Furumoto, S., Furukawa, K., Ishiki, A., Tomita, N., et al. (2016). 18F-THK5351: a novel PET radiotracer for imaging neurofibrillary pathology in Alzheimer disease. J. Nucl. Med. 57, 208–214. doi: 10.2967/jnumed.115.164848
He, Y., Wang, J., Wang, L., Chen, Z. J., Yan, C., Yang, H., et al. (2009). Uncovering intrinsic modular organization of spontaneous brain activity in humans. PLoS One 4:e5226. doi: 10.1371/journal.pone.0005226
Hoenig, M. C., Bischof, G. N., Seemiller, J., Hammes, J., Kukolja, J., Onur, O. A., et al. (2018). Networks of tau distribution in Alzheimer’s disease. Brain 141, 568–581. doi: 10.1093/brain/awx353
Jack, C. R. Jr., Lowe, V. J., Weigand, S. D., Wiste, H. J., Senjem, M. L., Knopman, D. S., et al. (2009). Serial PIB and MRI in normal, mild cognitive impairment and Alzheimer’s disease: implications for sequence of pathological events in Alzheimer’s disease. Brain 132, 1355–1365. doi: 10.1093/brain/awp062
Jang, Y. K., Lyoo, C. H., Park, S., Oh, S. J., Cho, H., Oh, M., et al. (2018). Head to head comparison of [18F] AV-1451 and [18F] THK5351 for tau imaging in Alzheimer’s disease and frontotemporal dementia. Eur. J. Nucl. Med. Mol. Imaging 45, 432–442. doi: 10.1007/s00259-017-3876-0
Jenkinson, M., Bannister, P., Brady, M., and Smith, S. (2002). Improved optimization for the robust and accurate linear registration and motion correction of brain images. Neuroimage 17, 825–841. doi: 10.1016/s1053-8119(02)91132-8
Jenkinson, M., Beckmann, C. F., Behrens, T. E., Woolrich, M. W., and Smith, S. M. (2012). FSL. Neuroimage 62, 782–790. doi: 10.1016/j.neuroimage.2011.09.015
Kang, J. M., Lee, S. Y., Seo, S., Jeong, H. J., Woo, S. H., Lee, H., et al. (2017). Tau positron emission tomography using [18F]THK5351 and cerebral glucose hypometabolism in Alzheimer’s disease. Neurobiol. Aging 59, 210–219. doi: 10.1016/j.neurobiolaging.2017.08.008
Leech, R., and Sharp, D. J. (2014). The role of the posterior cingulate cortex in cognition and disease. Brain 137, 12–32. doi: 10.1093/brain/awt162
Lehmann, M., Madison, C., Ghosh, P. M., Miller, Z. A., Greicius, M. D., Kramer, J. H., et al. (2015). Loss of functional connectivity is greater outside the default mode network in nonfamilial early-onset alzheimer’s disease variants. Neurobiol. Aging 36, 2678–2686. doi: 10.1016/j.neurobiolaging.2015.06.029
Lemoine, L., Gillberg, P. G., Svedberg, M., Stepanov, V., Jia, Z., Huang, J., et al. (2017). Comparative binding properties of the tau PET tracers THK5117, THK5351, PBB3 and T807 in postmortem Alzheimer brains. Alzheimers Res. Ther. 9:96. doi: 10.1186/s13195-017-0325-z
Levitt, P., Pintar, J. E., and Breakfield, X. O. (1982). Immunocytochemical demonstration of monoamine oxidase B in brain astrocytes and serotonergic neurons. Proc. Natl. Acad. Sci. U S A 79, 6385–6389. doi: 10.1073/pnas.79.20.6385
Leyns, C. E. G., and Holtzman, D. M. (2017). Glial contributions to neurodegeneration in tauopathies. Mol. Neurodegener. 12:50. doi: 10.1186/s13024-017-0192-x
Lim, H. K., Nebes, R., Snitz, B., Cohen, A., Mathis, C., Price, J., et al. (2014). Regional amyloid burden and intrinsic connectivity networks in cognitively normal elderly subjects. Brain 137, 3327–3338. doi: 10.1093/brain/awu271
Lustig, C., Snyder, A. Z., Bhakta, M., O’Brien, K. C., McAvoy, M., Raichle, M. E., et al. (2003). Functional deactivations: change with age and dementia of the Alzheimer type. Proc. Natl. Acad. Sci. U S A 100, 14504–14509. doi: 10.1073/pnas.2235925100
McKhann, G. M., Knopman, D. S., Chertkow, H., Hyman, B. T., Jack, C. R. Jr., Kawas, C. H., et al. (2011). The diagnosis of dementia due to Alzheimer’s disease: recommendations from the National Institute on Aging-Alzheimer’s Association workgroups on diagnostic guidelines for Alzheimer’s disease. Alzheimers Dement. 7, 263–269. doi: 10.1016/j.jalz.2011.03.005
Mioshi, E., Dawson, K., Mitchell, J., Arnold, R., and Hodges, J. R. (2006). The Addenbrooke’s cognitive examination revised (ACE-R): a brief cognitive test battery for dementia screening. Int. J. Geriatr. Psychiatry 21, 1078–1085. doi: 10.1002/gps.1610
Moeller, J. R., and Strother, S. C. (1991). A regional covariance approach to the analysis of functional patterns in positron emission tomographic data. J. Cereb. Blood Flow Metab. 11, A121–A135. doi: 10.1038/jcbfm.1991.47
Montine, T. J., Phelps, C. H., Beach, T. G., Bigio, E. H., Cairns, N. J., Dickson, D. W., et al. (2012). National Institute on Aging-Alzheimer’s Association guidelines for the neuropathologic assessment of Alzheimer’s disease: a practical approach. Acta Neuropathol. 123, 1–11. doi: 10.1007/s00401-011-0910-3
Mormino, E. C., Smiljic, A., Hayenga, A. O., Onami, S. H., Greicius, M. D., Rabinovici, G. D., et al. (2011). Relationships between β-amyloid and functional connectivity in different components of the default mode network in aging. Cereb. Cortex 21, 2399–2407. doi: 10.1093/cercor/bhr025
Myers, N., Pasquini, L., Göttler, J., Grimmer, T., Koch, K., Ortner, M., et al. (2014). Within-patient correspondence of amyloid-β and intrinsic network connectivity in Alzheimer’s disease. Brain 137, 2052–2064. doi: 10.1093/brain/awu103
Ng, K. P., Pascoal, T. A., Mathotaarachchi, S., Therriault, J., Kang, M. S., Shin, M., et al. (2017). Monoamine oxidase B inhibitor, selegiline, reduces 18F-THK5351 uptake in the human brain. Alzheimers Res. Ther. 9:25. doi: 10.1186/s13195-017-0253-y
Nichols, T. E., and Holmes, A. P. (2002). Nonparametric permutation tests for functional neuroimaging: a primer with examples. Hum. Brain Mapp. 15, 1–25. doi: 10.1002/hbm.1058
Niethammer, M., Tang, C. C., Feigin, A., Allen, P. J., Heinen, L., Hellwig, S., et al. (2014). A disease-specific metabolic brain network associated with corticobasal degeneration. Brain 137, 3036–3046. doi: 10.1093/brain/awu256
Okamura, N., Harada, R., Ishiki, A., Kikuchi, A., Nakamura, T., and Kudo, Y. (2018). The development and validation of tau PET tracers: current status and future directions. Clin. Transl. Imaging 6, 305–316. doi: 10.1007/s40336-018-0290-y
Petersen, R. C. (2004). Mild cognitive impairment as a diagnostic entity. J. Intern. Med. 256, 183–194. doi: 10.1111/j.1365-2796.2004.01388.x
Ranasinghe, K. G., Hinkley, L. B., Beagle, A. J., Mizuiri, D., Dowling, A. F., Honma, S. M., et al. (2014). Regional functional connectivity predicts distinct cognitive impairments in Alzheimer’s disease spectrum. Neuroimage Clin. 5, 385–395. doi: 10.1016/j.nicl.2014.07.006
Rodríguez-Arellano, J. J., Parpura, V., Zorec, R., and Verkhratsky, A. (2016). Astrocytes in physiological aging and Alzheimer’s disease. Neuroscience 323, 170–182. doi: 10.1016/j.neuroscience.2015.01.007
Rowe, C. C., Ng, S., Ackermann, U., Gong, S. J., Pike, K., Savage, G., et al. (2007). Imaging β-amyloid burden in aging and dementia. Neurology 68, 1718–1725. doi: 10.1212/01.wnl.0000261919.22630.ea
Sacks, C. A., Avorn, J., and Kesselheim, A. S. (2017). The failure of solanezumab-how the FDA saved taxpayers billions. N. Engl. J. Med. 376, 1706–1708. doi: 10.1056/NEJMp1701047
Saxena, S., and Caroni, P. (2011). Selective neuronal vulnerability in neurodegenerative diseases: from stressor thresholds to degeneration. Neuron 71, 35–48. doi: 10.1016/j.neuron.2011.06.031
Serra, L., Cercignani, M., Mastropasqua, C., Torso, M., Spano, B., Makovac, E., et al. (2016). Longitudinal changes in functional brain connectivity predicts conversion to Alzheimer’s disease. J. Alzheimers Dis. 51, 377–389. doi: 10.3233/JAD-150961
Sheline, Y. I., Raichle, M. E., Snyder, A. Z., Morris, J. C., Head, D., Wang, S., et al. (2010). Amyloid plaques disrupt resting state default mode network connectivity in cognitively normal elderly. Biol. Psychiatry 67, 584–587. doi: 10.1016/j.biopsych.2009.08.024
Shirer, W. R., Ryali, S., Rykhlevskaia, E., Menon, V., and Greicius, M. D. (2012). Decoding subject-driven cognitive states with whole-brain connectivity patterns. Cereb. Cortex 22, 158–165. doi: 10.1093/cercor/bhr099
Smith, S. M. (2002). Fast robust automated brain extraction. Hum. Brain Mapp. 17, 143–155. doi: 10.1002/hbm.10062
Smith, S. M., and Nichols, T. E. (2009). Threshold-free cluster enhancement: addressing problems of smoothing, threshold dependence and localization in cluster inference. Neuroimage 44, 83–98. doi: 10.1016/j.neuroimage.2008.03.061
Snowdon, D. A. (1997). Aging and Alzheimer’s disease: lessons from the Nun study. Gerontologist 37, 150–156. doi: 10.1093/geront/37.2.150
Song, Z., Insel, P. S., Buckley, S., Yohannes, S., Mezher, A., Simonson, A., et al. (2015). Brain amyloid-β burden is associated with disruption of intrinsic functional connectivity within the medial temporal lobe in cognitively normal elderly. J. Neurosci. 35, 3240–3247. doi: 10.1523/JNEUROSCI.2092-14.2015
Sperling, R. A., Laviolette, P. S., O’Keefe, K., O’Brien, J., Rentz, D. M., Pihlajamaki, M., et al. (2009). Amyloid deposition is associated with impaired default network function in older persons without dementia. Neuron 63, 178–188. doi: 10.1016/j.neuron.2009.07.003
Spetsieris, P., Ma, Y., Peng, S., Ko, J. H., Dhawan, V., Tang, C. C., et al. (2013). Identification of disease-related spatial covariance patterns using neuroimaging data. J. Vis. Exp. 76:e50319. doi: 10.3791/50319
Stam, C. J. (2014). Modern network science of neurological disorders. Nat. Rev. Neurosci. 15, 683–695. doi: 10.1038/nrn3801
Utevsky, A. V., Smith, D. V., and Huettel, S. A. (2014). Precuneus is a functional core of the default-mode network. J. Neurosci. 34, 932–940. doi: 10.1523/jneurosci.4227-13.2014
Verdurand, M., Bort, G., Tadino, V., Bonnefoi, F., Le Bars, D., and Zimmer, L. (2008). Automated radiosynthesis of the Pittsburg compound-B using a commercial synthesizer. Nucl. Med. Commun. 29, 920–926. doi: 10.1097/MNM.0b013e328304e0e1
Villemagne, V. L., Burnham, S., Bourgeat, P., Brown, B., Ellis, K. A., Salvado, O., et al. (2013). Amyloid β deposition, neurodegeneration and cognitive decline in sporadic Alzheimer’s disease: a prospective cohort study. Lancet Neurol. 12, 357–367. doi: 10.1016/S1474-4422(13)70044-9
Villemagne, V. L., Pike, K. E., Chételat, G., Ellis, K. A., Mulligan, R. S., Bourgeat, P., et al. (2011). Longitudinal assessment of Aβ and cognition in aging and Alzheimer disease. Ann. Neurol. 69, 181–192. doi: 10.1002/ana.22248
Wang, Y., Yan, T., Lu, H., Yin, W., Lin, B., Fan, W., et al. (2017). Lessons from anti-amyloid-β immunotherapies in Alzheimer disease: aiming at a moving target. Neurodegener. Dis. 17, 242–250. doi: 10.1159/000478741
Wang, P., Zhou, B., Yao, H., Zhan, Y., Zhang, Z., Cui, Y., et al. (2015). Aberrant intra- and inter-network connectivity architectures in Alzheimer’s disease and mild cognitive impairment. Sci. Rep. 5:14824. doi: 10.1038/srep14824
Wu, J. W., Hussaini, S. A., Bastille, I. M., Rodriguez, G. A., Mrejeru, A., Rilett, K., et al. (2016). Neuronal activity enhances tau propagation and tau pathology in vivo. Nat. Neurosci. 19, 1085–1092. doi: 10.1038/nn.4328
Keywords: 18F-THK5351, 11C-PiB, positron emission tomography (PET), resting state network, MRI, MAO-B, astrocyte
Citation: Yokoi T, Watanabe H, Yamaguchi H, Bagarinao E, Masuda M, Imai K, Ogura A, Ohdake R, Kawabata K, Hara K, Riku Y, Ishigaki S, Katsuno M, Miyao S, Kato K, Naganawa S, Harada R, Okamura N, Yanai K, Yoshida M and Sobue G (2018) Involvement of the Precuneus/Posterior Cingulate Cortex Is Significant for the Development of Alzheimer’s Disease: A PET (THK5351, PiB) and Resting fMRI Study. Front. Aging Neurosci. 10:304. doi: 10.3389/fnagi.2018.00304
Received: 10 July 2018; Accepted: 13 September 2018;
Published: 05 October 2018.
Edited by:
Atsushi Takeda, Sendai Nishitaga National Hospital, JapanReviewed by:
Tatsuo Ido, Gachon University, South KoreaEric Tatt Wei Ho, Universiti Teknologi Petronas, Malaysia
Copyright © 2018 Yokoi, Watanabe, Yamaguchi, Bagarinao, Masuda, Imai, Ogura, Ohdake, Kawabata, Hara, Riku, Ishigaki, Katsuno, Miyao, Kato, Naganawa, Harada, Okamura, Yanai, Yoshida and Sobue. This is an open-access article distributed under the terms of the Creative Commons Attribution License (CC BY). The use, distribution or reproduction in other forums is permitted, provided the original author(s) and the copyright owner(s) are credited and that the original publication in this journal is cited, in accordance with accepted academic practice. No use, distribution or reproduction is permitted which does not comply with these terms.
*Correspondence: Gen Sobue, c29idWVnQG1lZC5uYWdveWEtdS5hYy5qcA==