 Haidar Alzaid1*
 Thomas Ethofer1,2
 Markus A. Hobert3Bernd Kardatzki1
 Michael Erb1
 Walter Maetzler3
 Daniela Berg3
- 1Department of Biomedical Magnetic Resonance, University of Tübingen, Tübingen, Germany
- 2Department of Psychiatry and Psychotherapy, University of Tübingen, Tübingen, Germany
- 3Department of Neurology, Christian-Albrecht University of Kiel, Kiel, Germany
Background and Objective: Executive dysfunction is the most common cognitive impairment in Parkinson’s disease (PD), occurring even in its early stages. In our study, we applied diffusion tensor imaging (DTI) to investigate white matter integrity and its association with a specific executive function such as cognitive flexibility in individuals with risk factors for PD.
Methods: We examined 50 individuals with risk factors for developing PD and 24 healthy controls from the TREND (Tübinger Evaluation of Risk Factors for Early Detection of Neurodegeneration) study including neuropsychological evaluation and DTI. Cognitive flexibility was assessed using the trail making test (TMT). Tract based spatial statistics (TBSS) were employed to assess white matter abnormalities and their correlation with cognitive flexibility.
Results: TMT performance correlated with mean and axial diffusivity in several white matter regions, predominantly in the frontoparietal white matter. These effects were stronger in PD risk persons (PD-RP) than in controls as evidenced by a significant group interaction. White matter integrity and TMT performance did not significantly differ across groups.
Conclusion: Based on our results, PD-RP do no exhibit white matter changes or impaired cognitive flexibility. However, specific executive functions in PD-RP are more related to white matter alterations than in healthy older adults.
Introduction
Parkinson’s disease (PD) is a slowly progressive neurodegenerative disease characterized by an abnormal accumulation of misfolded α-synuclein protein in the brain. Clinically, it is diagnosed by the cardinal motor symptoms bradykinesia, resting tremor, and rigidity (Tolosa et al., 2006). It is well documented, that the motor symptoms of PD are caused by cell death in the substantia nigra. However, studies have shown that the onset of motor manifestations of PD, which is required for the clinical diagnosis, starts only after at least 50% of the neurons in substantia nigra have died (Fearnley and Lees, 1991), and thus it has been suggested that neurodegeneration starts several years before the development of the cardinal motor symptoms (Miller and O’Callaghan, 2015). This time period preceding the clinical diagnosis is called the prodromal phase. During this phase, individuals at risk of developing PD can exhibit non-motor symptoms including hyposmia, rapid eye movement (REM)-sleep behavior disorder (RBD), depression, autonomic dysfunction, and mild cognitive impairment (Berg et al., 2015).
Mild cognitive impairment, in particular executive dysfunction, is commonly reported throughout all stages of PD (Litvan et al., 2011). Furthermore, a recent study revealed that executive function is the most affected cognitive domain in the prodromal phase of PD, and might be a useful non-motor biomarker for this phase (Fengler et al., 2017). There is cumulative evidence for the involvement of the frontoparietal network in executive functions (Collette et al., 2006) and it has been suggested that cortical “disconnection” through a disturbance of intra- and interhemispheric white matter connections, especially in the anterior white matter, represents a possible mechanism underlying age-related executive dysfunction (O’Sullivan et al., 2001) as well as disease-related alterations in PD (Bledsoe et al., 2018).
Although the death of dopaminergic neurons in the substantia nigra is considered a main pathomechanism of PD (Lees et al., 2009), several neuropathological studies revealed that axonal dysfunction and degeneration in diverse brain (Cheng et al., 2010), and even peripheral (Knudsen et al., 2018) regions are an additional important hallmark in the pathophysiology of PD. In fact, axonal degeneration may be the earliest sign of the disease, occurring long before the death of neuron cell bodies (Cheng et al., 2010). Consequently, diffusion tensor imaging (DTI; Basser et al., 1994) was successfully applied to detect alterations of structural fiber connectivity in PD (Atkinson-Clement et al., 2017; Koirala et al., 2018, 2019) including early stages (Zhang et al., 2015) and also identified candidate white matter structures for cognitive impairment in PD (Melzer et al., 2013; Zheng et al., 2014). Fractional anisotropy (FA) and mean diffusivity (MD) are the DTI-derived parameters that are primarily used to detect white matter microstructural alterations. FA is a measure of orientational coherence along the fibers, while MD is a measure of averaged diffusivity, representing the amount of diffusion in all directions (Pierpaoli and Basser, 1996). Typically, white matter pathology is associated with decreased FA and increased MD. In addition, axial diffusivity (AD) and radial diffusivity (RD) have been proven useful in detecting axonal damage and myelin loss, respectively (Song et al., 2002; Sun et al., 2006). AD reflects diffusion along the main axis (λ1), whereas RD reflects perpendicular diffusion to the main axis (λ2, λ3).
In the current study, we investigated whether alterations of fiber connectivity as revealed by DTI are already detectable in individuals with risk factors for developing PD. Specifically, we utilized tract-based spatial statistics (TBSS) to investigate the following hypotheses:
1. White matter pathology is an early sign of PD and can already be detected in the prodromal phase.
2. Impairment of specific executive functions as assessed by the trail making test (TMT) are related to white matter pathology in individuals with risk factors for PD.
Materials and Methods
Participants
This cross-sectional study investigated participants from the TREND study (Tübinger Evaluation of Risk Factors for Early Detection of Neurodegeneration), a prospective biannual follow-up study that aims at identifying risk factors for the development of PD. Sociodemographic and clinical data are presented in Table 1. Fifty individuals with well-known risk factors for developing PD (PD risk persons, PD-RP, 19 males, 31 females, and average age 66.1 ± 6.4 years), and 24 controls (controls, 14 males, 10 females, and average age 68.3 ± 6.5 years) from the TREND cohort were included in the current study. Study details and recruitment criteria have been previously published (Gaenslen et al., 2014). All participants were older than 50 years, were able to walk without aid, had no diagnosis of any neurodegenerative disease, no history of stroke, inflammatory diseases of the central nervous system, or polyneuropathy, were free of antipsychotic or other antidopaminergic drugs, and exhibited no significant impairment of vision or hearing. PD-RP had at least one of the following diagnoses:
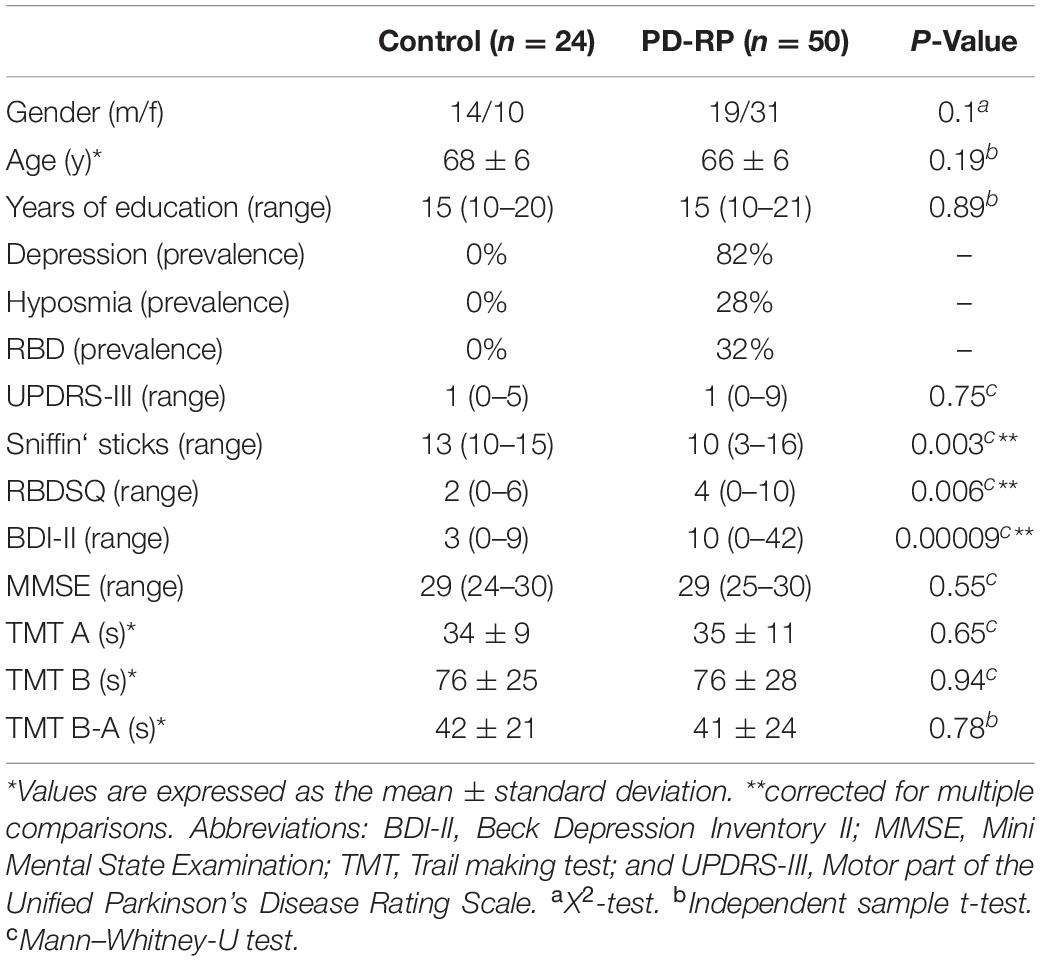
Table 1. Demographics and clinical parameters of the cohorts.
– Hyposmia, assessed using Sniffin’ sticks (Burghardt Medizintechnik, Wedel, Germany) with a set consisting of 16 different odors, identifying < 10 of odors is indicative of impaired sense of smell (Hummel et al., 2007).
– REM sleep RBD, assessed using the RBD Screening questionnaire (RBDSQ), a value of 5 out of 10 possible items was considered was a positive test result, which can indicate the presence of RBD with a sensitivity of 96% and a specificity of 56% (Stiasny-Kolster et al., 2007).
– Depression, defined as current depression or the occurrence of at least one major depressive episode during their lifetime according to ICD-10 and DSM-IV criteria.
Individuals in the control group received the same screening and were explicitly chosen to not have any risk factors for PD.
Additionally, the motor part of the Unified Parkinson’s Disease Rating Scale (UPDRS-III) and Beck Depression Inventory II (BDI-II; Beck et al., 1996) were administered to evaluate motor and depressive symptoms, respectively, though not considered in the selection of PD-RP.
Neuropsychology
All participants underwent testing of cognitive flexibility based on the TMT (Reitan and Skills, 1958) consisting of part A and B. In part A, subjects have to connect numbers from 1 to 25. It is used to test visual search ability and motor speed. In part B, subjects have to connect numbers and letters in an alternating way (1-A-2-B-3-C….). In addition to the components from part A, part B also tests cognitive flexibility and working memory. We chose the derived score B-A as our parameter of interest, as (Sanchez-Cubillo et al., 2009) have recommended using B-A to minimize the influence of motor speed, visuospatial perception, and working memory demands to provide a more reliable indicator of cognitive flexibility. Additionally, the Mini-Mental State Examination (MMSE) was carried out in all participants (Folstein et al., 1975).
Image Acquisition
Structural T1-weighted images (TR = 2300 ms, TE = 4.18 ms, TI = 900 ms, and voxel size: 1 mm × 1 mm × 1 mm) were acquired with a 3 T scanner (Siemens PRISMA, Erlangen, Germany). Diffusion-weighted images were acquired using a “Stejskal-Tanner” sequence (TR = 6.0 s, TE = 69 ms, flip angle = 90°, 50 axial slices, and 2 acquisitions) with a voxel size of 1.7 × 1.7 × 2.5 mm3 along 30 independent directions using a b-value of 1000 s/mm2. Additionally, 12 images with a b-value of 0 s/mm2 were acquired throughout the sequence.
DTI Data Analysis
Data preprocessing and DTI analysis were carried out using FSL 5.0.9 (FMRIB Software Library, http://fsl.fmrib.ox.ac.uk/fsl/). Preprocessing included correction of eddy current distortions and motion artifacts (Andersson and Sotiropoulos, 2016). Head motion was compared between groups across 6 direction (translation x/y/z and rotation x/y/z). The DTIFIT tool was used to fit a diffusion tensor model at each voxel and generate FA, MD maps, and the eigenvalues (λ1, λ2, λ3). Axial (AD = λ1) and radial [RD = (λ2 + λ3)/2] diffusivity maps were calculated from these eigenvalues. Voxel-wise statistical analysis of the FA data was carried out using TBSS included in FSL (Smith et al., 2004, 2006). FA data from each subject was aligned into a common space using the non-linear registration tool FNIRT (Andersson et al., 2007), which uses a b-spline representation of the registration warp field (Rueckert et al., 1999), and finally averaged to create a mean FA image. The mean FA image was then thinned to create a mean FA skeleton which represents the centers of all tracts common to the group; an FA threshold of 0.2 was used for the skeleton. Each subject’s aligned FA data was then projected onto this skeleton. The same FA transformation was applied to MD, RD, and AD maps, and projected onto the same skeleton. Statistical models were set up to enable comparison across groups as well as correlation with TMT B-A and included age and gender as covariates of no interest. Additionally, we ran correlation analyses with the risk measures BDI-II, RBDSQ, and Sniffin’ sticks across both groups and within each group to determine their influence on white matter integrity. Using the “Randomize” tool incorporated in FSL we ran non-parametric permutation-based statistical tests on the DTI maps with 10000 permutations and threshold-free cluster enhancement (Smith and Nichols, 2009) to correct for multiple comparisons across the whole brain at a significance threshold of P < 0.05 using family-wise error correction.
Analysis of White Matter Integrity and Cognitive Flexibility
The relationship between white matter integrity and cognitive flexibility was explored using the abovementioned tbss method. A correlation analysis between DTI parameters and TMT B-A was carried out to investigate overall correlation across both groups and within each group. Additionally, the group interaction effect was examined using the FSL GLM model “Two Groups with continuous covariate interaction” (see Figure 1). Age and gender were added as covariates of no interest in every correlation model. The same tbss settings as described above were applied in the correlation analyses. Clusters demonstrating a significant group interaction were defined based on Johns Hopkins University’s Mori white matter atlas (Mori et al., 2008). DTI parameters in each significant cluster were than extracted from the skeletonized tbss image of each participant and plotted against their TMT B-A score. As a safeguard we ran all our analyses by leaving out the most extreme data point. While this obviously resulted in different statistical values it had no impact on statistical inference (i.e., whether results were statistical significant or not).
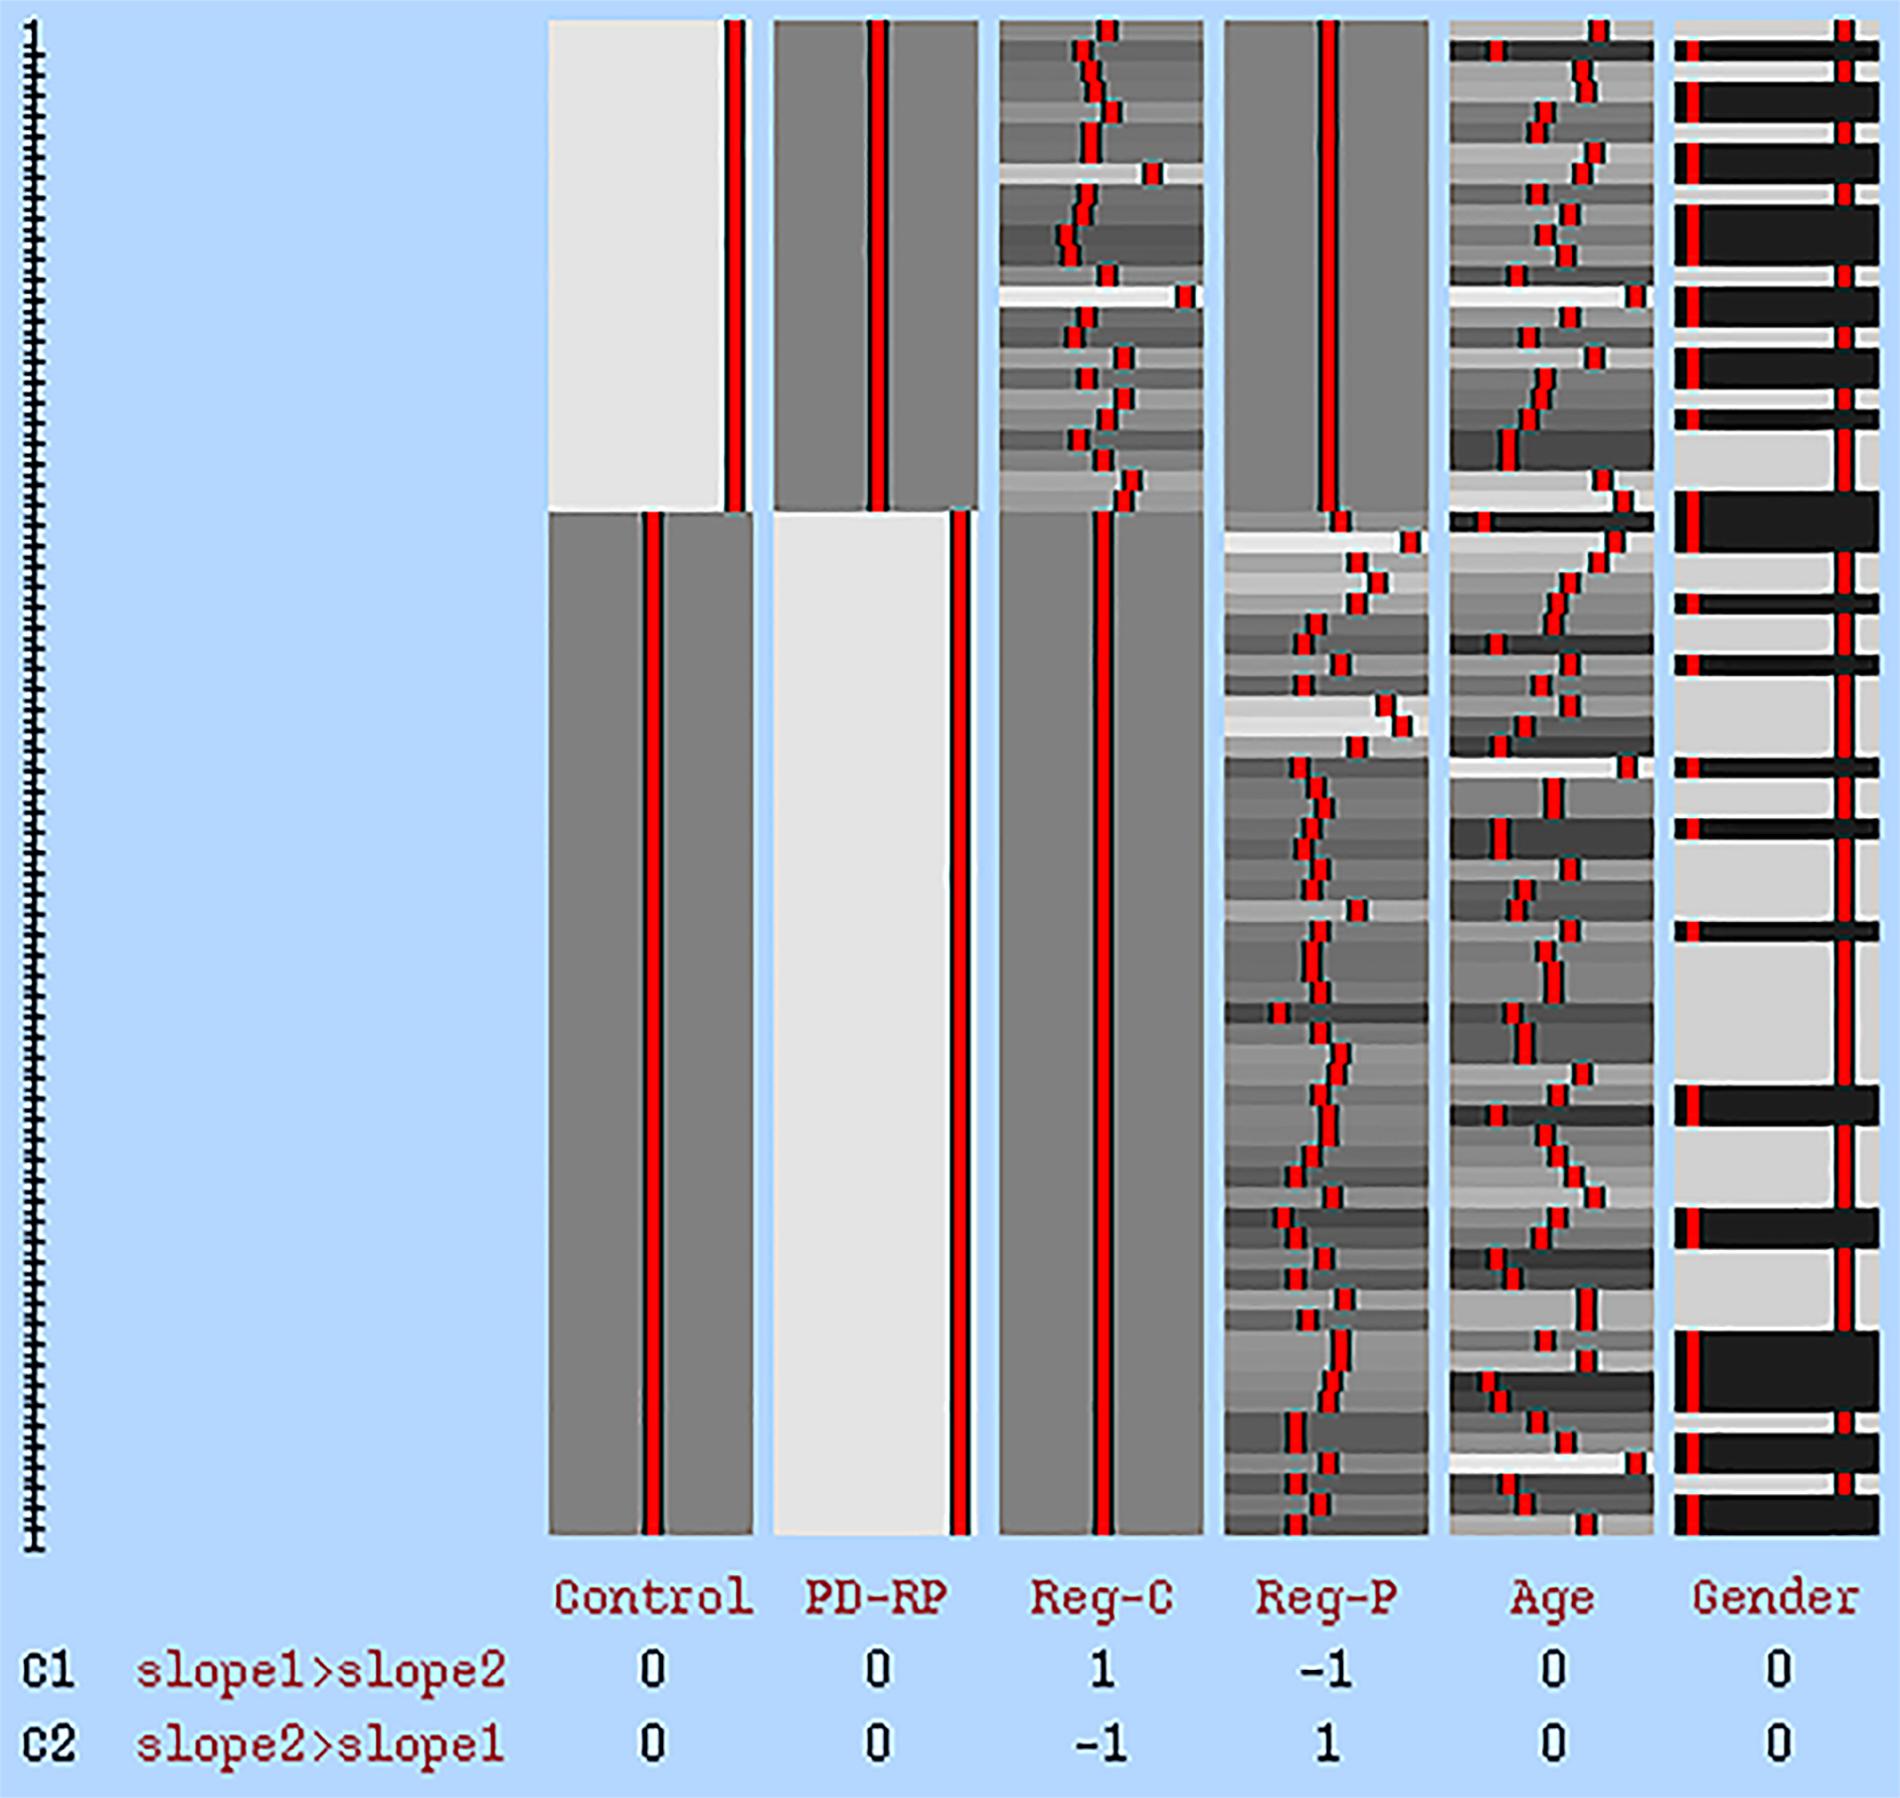
Figure 1. GLM statistical model for group interaction effect. The first two columns represent tbss data of each group. Reg-C and Reg-P represent the regressor for the control group and PD-RP, respectively. Age and gender were added as covariates of no interest. C1: higher effect in control, C2: higher effect in PD-RP.
Statistical Analysis
Statistical analysis of the clinical and neuropsychological measures was carried out using SPSS version 25 software (SPSS Inc, Chicago, IL, United States). Independent sample t-tests as well as Mann–Whitney-U tests were used to compare mean/median scores between the groups for normally and non-normally distributed parameters, respectively. The X2 test was used to assess potential differences in gender distribution. Partial Correlation analysis between TMT B-A, BDI-II, RBDSQ, and Sniffin’ sticks scores controlling for age and gender was used to evaluate, whether TMT B-A performance was driven by one of the risk factors depression, RBD or hyposmia. A non-corrected P-value < 0.05 was considered significant. There was no significant difference in head motion between groups across all 6 directions (see Supplementary Material).
Results
Demographics and Clinical Features
Age, gender and education as well as UPDRS-III and MMSE scores were not significantly different between PD-RP and controls. As expected, BDI-II, RBDSQ, and Sniffin’ sticks scores were significantly higher in PD-RP than in controls. The TMT B-A score was not significantly different between the groups and did not significantly correlate with BDI-II, RBDSQ or Sniffin’ sticks scores.
TBSS Analysis
Voxel-wise TBSS whole brain analysis did not reveal any significant difference between both groups controlling for multiple comparisons across the whole brain. The correlation analysis between TMT B-A performance and diffusion parameters within the PD-RP group, however, revealed significant effects for MD and AD in several brain areas including, commissural tracts, e.g., corpus callosum, association tracts, e.g., superior longitudinal fasciculus and projection tracts, e.g., corona radiata (for full results see Figures 2, 3 and Tables 2, 3). These effects were stronger in PD-RP than in controls as evidenced by a significant group interaction (P < 0.05 FWE-corrected, see Figures 2, 3). The three risk measures BDI-II, RBDSQ and Sniffin’ sticks scores did not significantly correlate with diffusion parameters in each group.
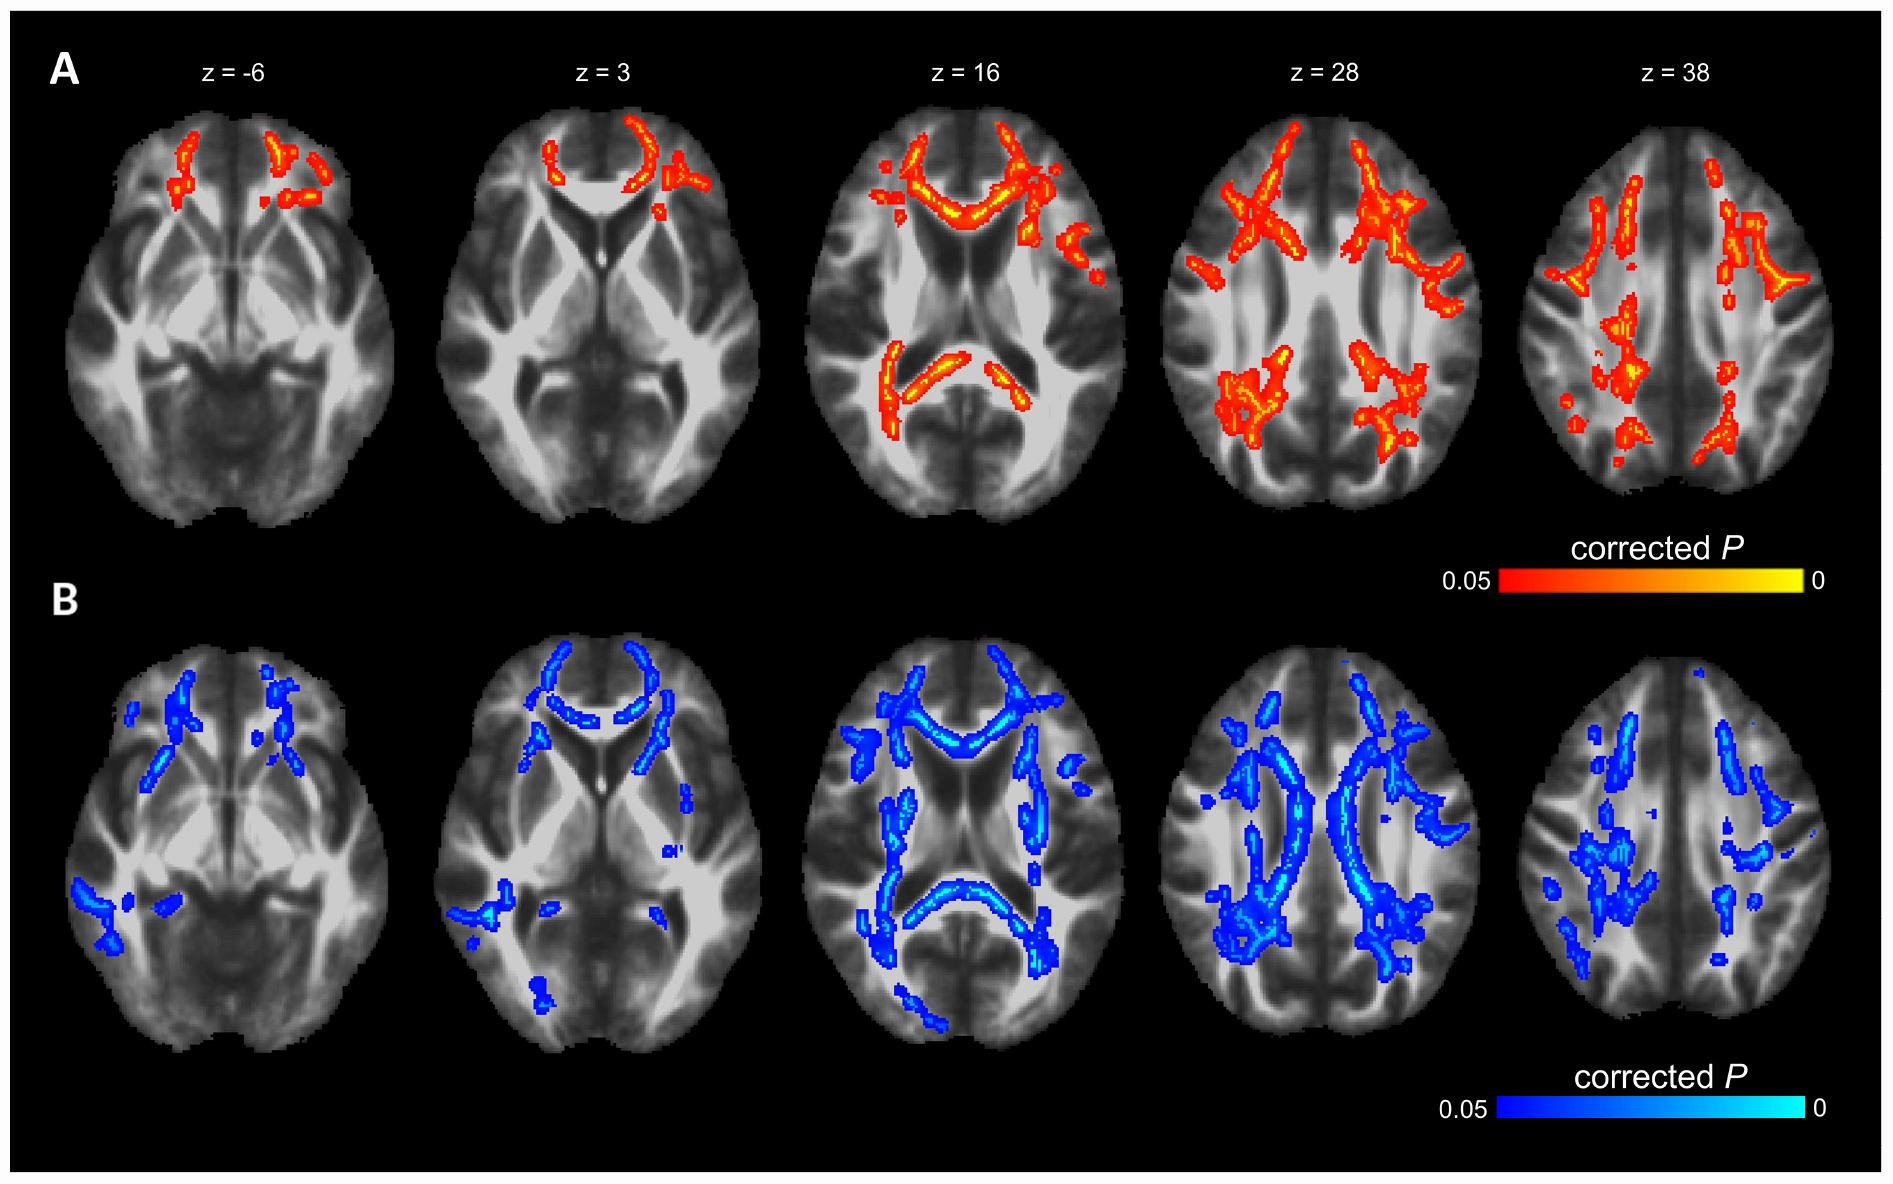
Figure 2. The results of TBSS whole-brain regression analysis overlaid on mean FA (1 mm) template and presented in radiological convention. (A) Significant group interaction (PD-RP > controls) determined in the regression analysis between cognitive flexibility (TMT B-A) and mean diffusivity (MD). (B) Significant group interaction (PD-RP > controls) determined in the regression analysis between cognitive flexibility (TMT B-A) and axial diffusivity (AD).
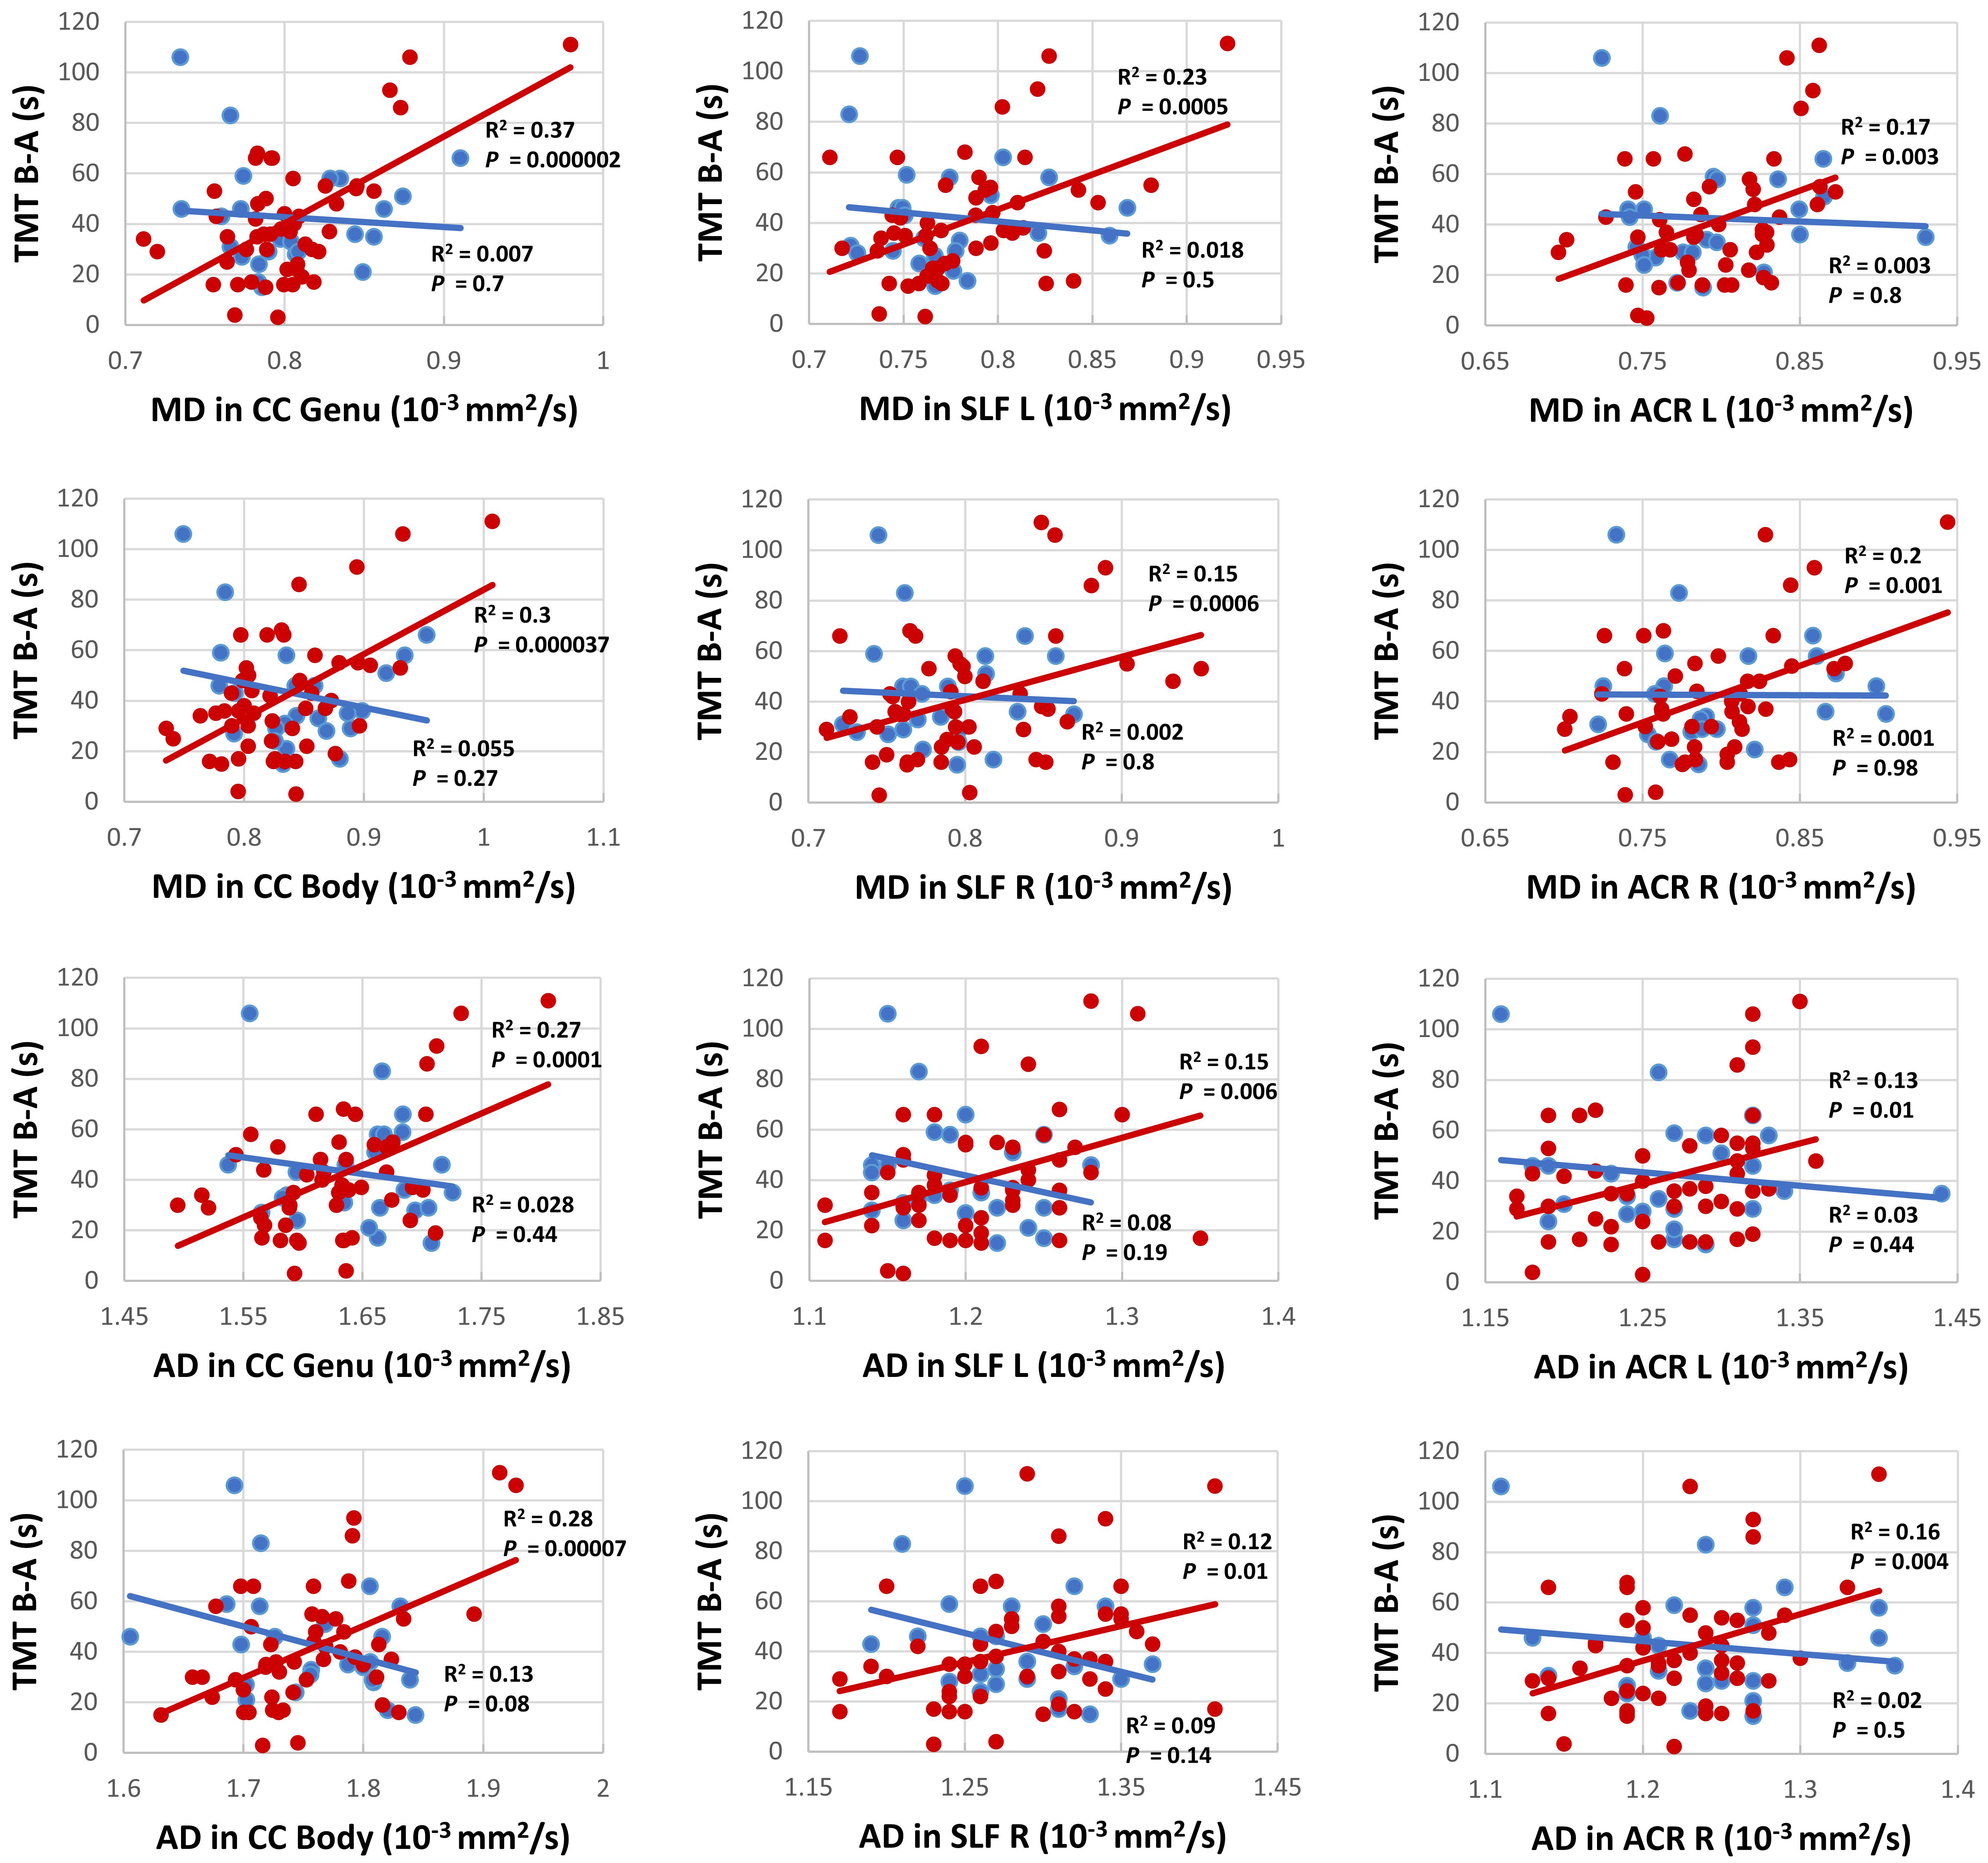
Figure 3. Correlation analysis between TMT B-A and MD (upper six panels) as well as TMT B-A and AD (lower six panels) for persons with (red) and without (blue) risk factors for PD for the clusters with the highest correlation in commissural tracts: genu and body of the corpus callosum (CC), projection tracts: left and right anterior corona radiata (ACL), and association tracts: left and right superior longitudinal fasciculus (SLF).
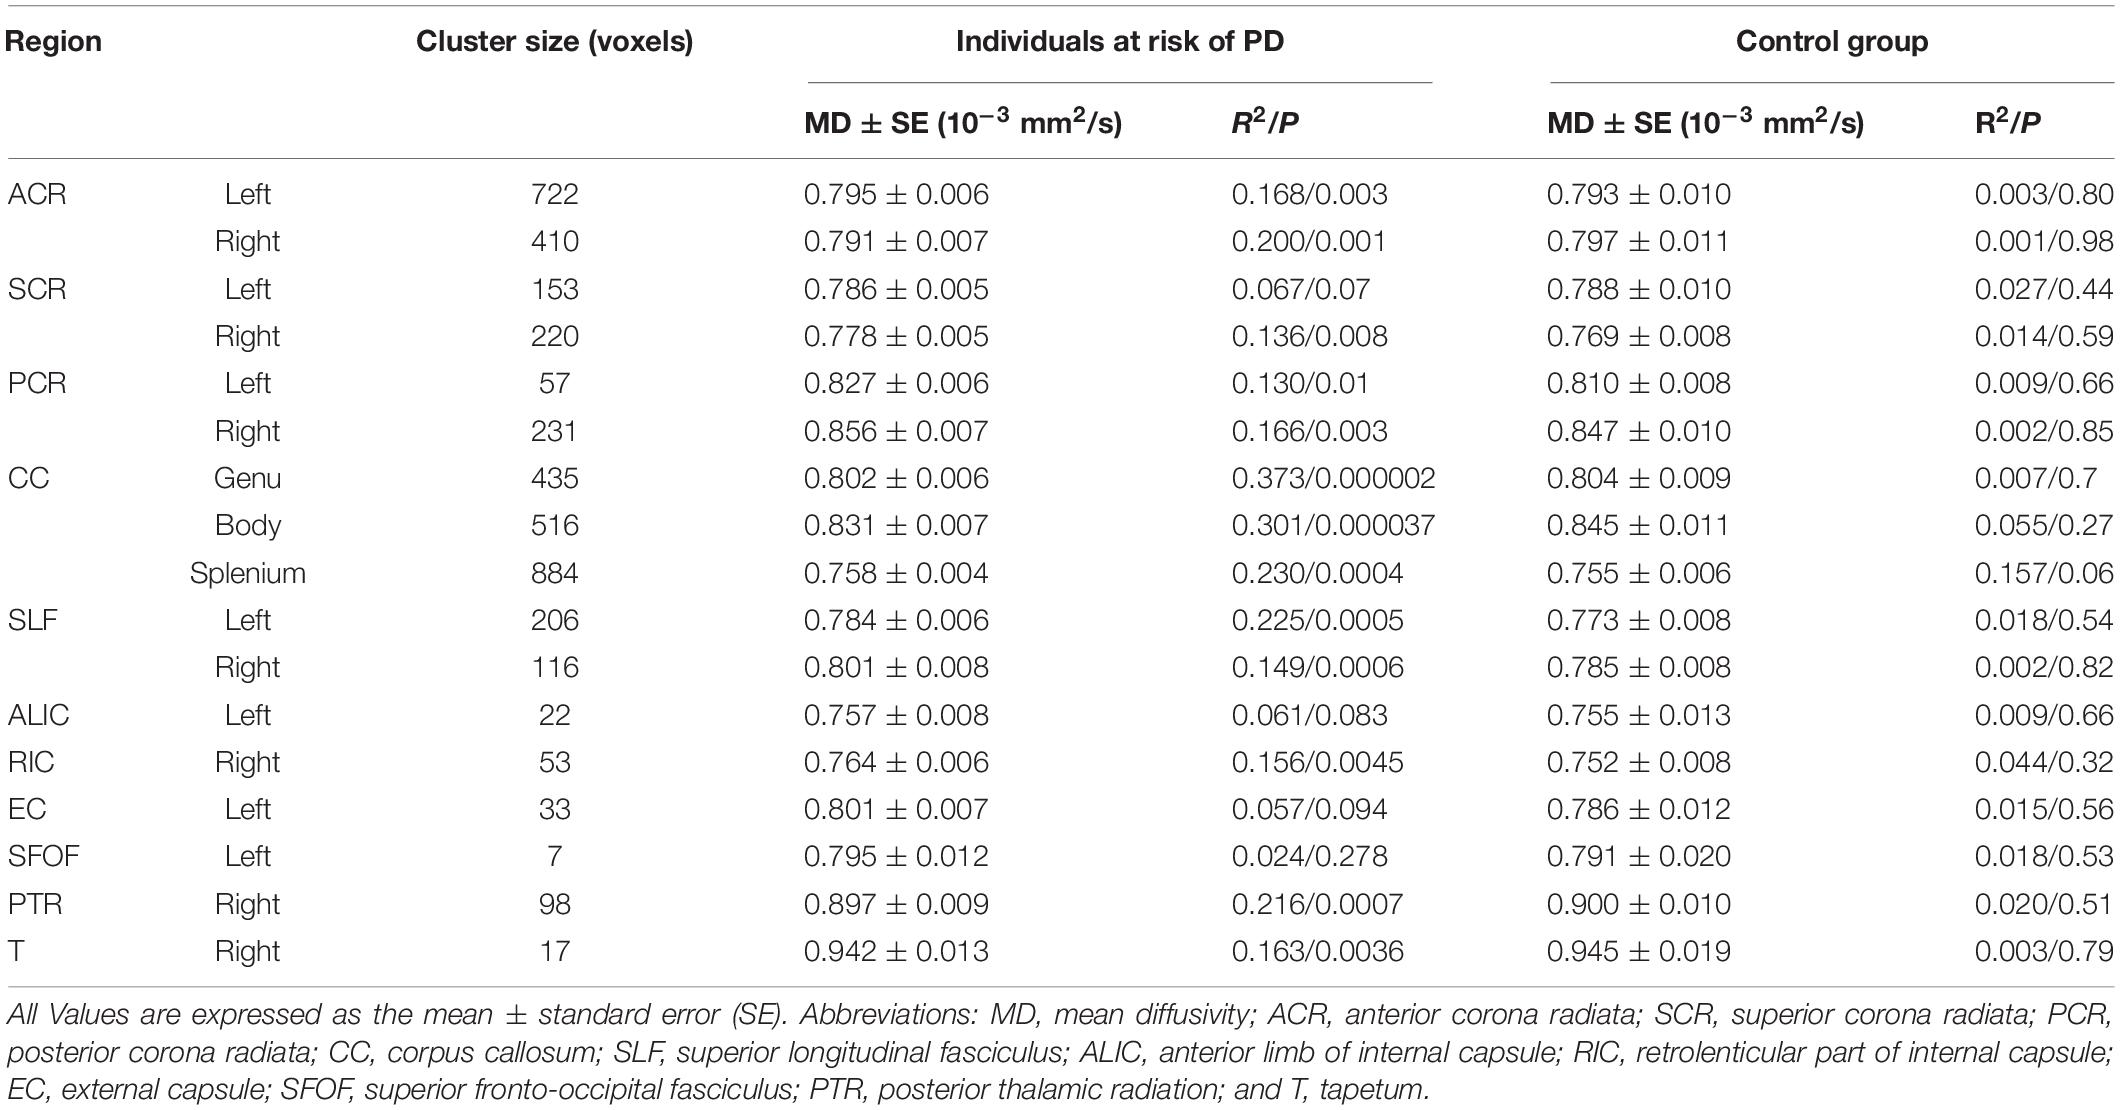
Table 2. MD clusters with a significant group interaction.
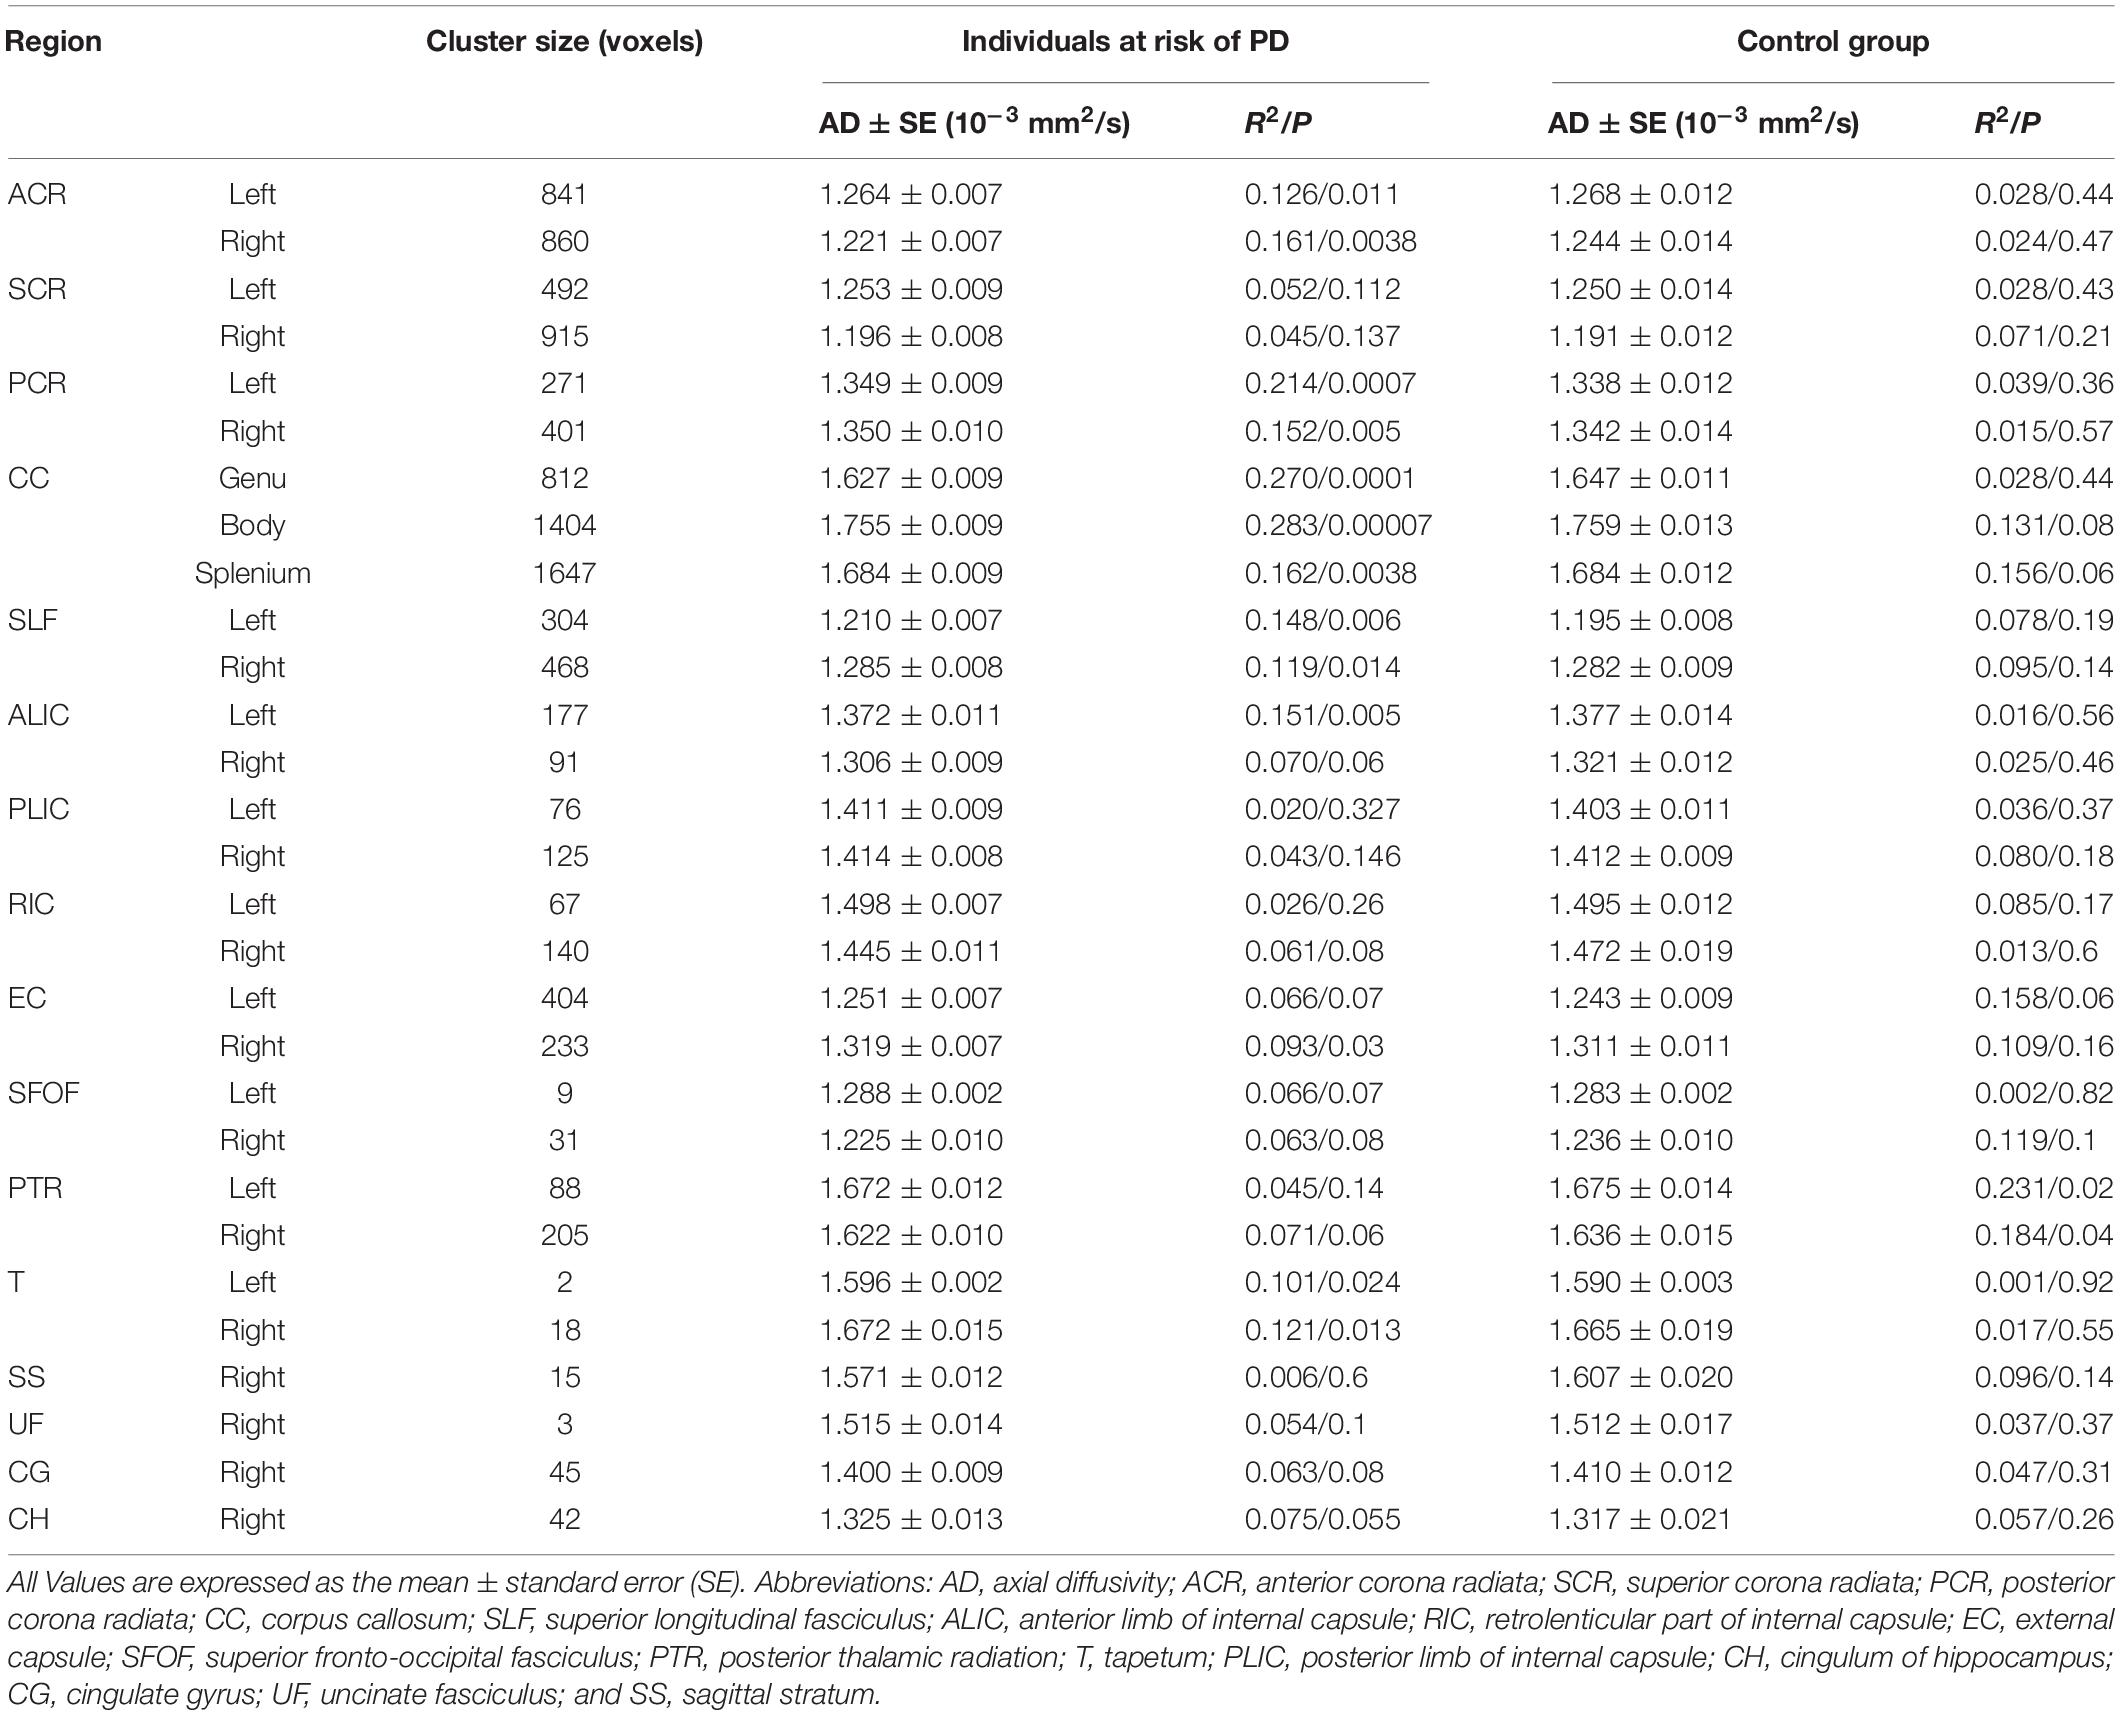
Table 3. AD clusters with a significant group interaction.
Discussion
In recent years, enormous efforts have been devoted to better understand the time before motor symptoms allow clinical diagnosis of PD, i.e., the prodromal phase (Berg et al., 2015). Nevertheless, the number of neuroimaging studies on white matter alterations in this phase is still very limited with most studies focusing on idiopathic RBD as a predictor of α-synucleinopathies (Unger et al., 2010; Scherfler et al., 2011; Rahayel et al., 2015), and not the broad definition of prodromal PD (Berg et al., 2015). This study is, to our best knowledge, the first to reveal a correlation between white matter architecture and a cognitive function, such as cognitive flexibility, in PD-RP.
We found no significant differences between the two groups regarding the diffusion parameters arguing against a general application of the examined diffusion parameters as early marker for the development of PD. In contrast, a study on a PD-RP cohort with substantia nigra hyperechogenicity and/or hyposmia, revealed increased MD in the posterior thalamus, inferior longitudinal fasciculus, fornix and the corticospinal tract in the PD-RP group, but failed to demonstrate a significant difference between PD patients and controls (Heldmann et al., 2018). The authors suggested that PD-RP/PD patients with hyposmia could have a more severe disease course with a different pattern of neurodegeneration in comparison to those without hyposmia. This may explain the negative results in our study, since only 28% of our PD-RP cohort presented with hyposmia. On the other hand, a study on G2019S LRRK2 mutation carriers, an asymptomatic cohort generally considered at higher risk of PD, did not reveal any significant structural brain changes using DTI and VBM (voxel-based morphometry). However, a tendency for higher FA and lower MD in the mutation carriers was observed, which may hint at the involvement of a compensatory mechanism. Similarly, a recent study using graph-theory revealed greater local connectivity in regions relating to motor, olfactory, and sleep functions in PD-RP, suggesting neural compensation in the prodromal phase (Wen et al., 2017). This discrepancy between studies on PD-RP could be due to the application of different recruitment criteria, as it should be noted that our definition of the PD-RP group implicates that only part of this group will develop PD, so a true effect may be driven by a large proportion of non-converters. Based on this assumption it is even more interesting that our analysis revealed a significant correlation between TMT results and MD in the superior longitudinal fasciculus connecting the frontal and parietal cortex (Schmahmann et al., 2008), as well as the corpus callosum and multiple projection tracts, such as the corona radiata, while no such effects were observed for FA.
This observation is in line with MRI studies on early PD demonstrating that alterations of MD precede FA reduction (Melzer et al., 2013) as well as gray matter (Duncan et al., 2016). Also in line with our result, MD was found to be associated with executive function in PD, while no significant association was found for FA (Melzer et al., 2013). This is in contrast to studies on aging that demonstrated a positive correlation between FA and executive function (Perry et al., 2009; Halliday et al., 2019) and suggests that distinct white matter pathologies are responsible for cognitive impairments related to healthy aging and PD. A similar finding was also reported in individuals with traumatic brain injury (Kinnunen et al., 2011).
Our analyses also revealed a significant correlation between TMT performance and AD in several frontoparietal white matter regions. Although the mechanism causing increases of AD is not fully understood, it has been implicated as an early state-specific marker with a high sensitivity for early neurodegeneration and cognitive impairment (Acosta-Cabronero et al., 2012; Molinuevo et al., 2014). It has also been suggested that increased AD may represent an upstream event preceding axonal degeneration, e.g., inflammation (Acosta-Cabronero et al., 2012). In addition, the involvement of the frontoparietal network as an essential neurobiological correlate of executive functions concurs with previous DTI (Halliday et al., 2019) and functional magnetic resonance imaging (fMRI; Niendam et al., 2012) studies in healthy individuals as well as fMRI (Lewis et al., 2003) and DTI (Melzer et al., 2013) studies on neural substrates underlying impairments of executive functions in PD. Similarly, microstructural alterations in the corpus callosum and their association with mild cognitive impairment in PD including executive function impairments have been reported (Bledsoe et al., 2018), adding to the growing body of evidence suggesting both intra- and interhemispheric “disconnection” as a possible mechanism of executive dysfunction in PD (Melzer et al., 2013; Zheng et al., 2014).
It should be noted that the correlation between TMT performance and MD as well as AD was only found in the group of PD-RP, but not in the control group. An analogous finding has been reported in a DTI study on executive dysfunctions in individuals with traumatic brain injury with a significant correlation between TMT B-A performance and RD in frontoparietal areas which was restricted to the patient group, but not found in healthy individuals (Kinnunen et al., 2011). This distinct relationship may indicate that deficits in specific executive functions in PD-RP are more related to white matter pathology than in healthy older adults.
It is worth mentioning that PD-RP did not differ from the control group in regards to their TMT performance. While other imaging studies also failed to demonstrate cognitive deficits in PD-RP (Wen et al., 2017; Heldmann et al., 2018), a recent review reported the existence of executive function impairments in prodromal PD (Fengler et al., 2017). Hence, prospective longitudinal studies are still needed to determine the role of cognitive changes as a reliable biomarker for prodromal PD.
Interestingly, two fMRI-studies have reported a higher task-related activity in several cerebral regions in G2019S LRRK2 mutation carriers while maintaining an adequate executive function performance, suggesting a neural compensatory mechanism that enables intact cognitive performance (Thaler et al., 2013; Bregman et al., 2017).
Our study revealed no correlation between DTI measure and risk scores, such as sniffin’ sticks and RBDSQ. This is in contrast to previous studies on PD-RP revealing structural correlates of olfactory tests (Wen et al., 2017; Heldmann et al., 2018) as well as RBDSQ (Wen et al., 2017). This is may be due to the lower prevalence of these risk factors in our PD-RP cohort.
This study faces some limitations. For example, this is a cross-sectional study and we do not have MRIs from the entire TREND cohort (which has already observed 16 PD converters within its lifetime). Thus, our results are built on a PD-RP cohort and it is not clear how many participants will eventually convert to PD. This limitation is shared with many other studies in the field. Due to this limitation we can also not exclude that the effect observed in this study is a constitutional factor, rather than a dynamic process indicating prodromal PD (Mirelman et al., 2011). This aspect has to be further investigated in longitudinal prospective cohorts. Another limitation is the relatively low specificity of our selected prodromal markers. Individuals with a positive score on RBDSQ and hyposmia may have prodromal PD with a likelihood of 2.8 and 6.4, respectively. While our most frequent risk factor, depression, has an estimated likelihood of only 1.6 (Heinzel et al., 2019). Thus, a prodromal risk score based on multiple prodromal markers would be a more appropriate approach to categorize PD-RP and yield a higher probability for prodromal PD.
To avoid a loss of sensitivity due to multiple testing we focussed on a single measure of executive functioning, namely the cognitive flexibility, which may be a plausible explanation for absence of a group difference in TMT. Therefore, future imaging studies on PD-RP should apply a more comprehensive executive function screening in addition to other cognitive domains to get a better understanding of the structural correlates of the cognitive deficits in prodromal PD.
The severity of depressive symptoms, as measured by BDI-II, did not correlate with TMT performance or white matter integrity in our analysis. Given that most of our PD-RP group have had at least one depressive episode during their lifetime, we cannot exclude the possibility that our result is a lingering effect of depression, which can be only partially accounted for by the severity of current depressive symptoms (Rock et al., 2014).
In summary, DTI and cognitive flexibility as assessed by TMT were not able to reliably differentiate PD-RP from healthy controls and thus may lack the needed sensitivity as biomarkers for the prodromal phase of PD. Nevertheless, DTI revealed frontoparietal white matter alterations related to a specific executive function only in PD-RP, which may indicate that deficits in specific executive functions PD-RP are more related to white matter alterations than in healthy older adults.
Data Availability Statement
The datasets generated for this study are available on request to the corresponding author.
Ethics Statement
The studies involving human participants were reviewed and approved by the Ethical Committee of the Medical Faculty at the University of Tübingen (Nr. 90/2009BO2). The participants provided their written informed consent to participate in this study.
Author Contributions
DB and WM contributed conception and design of the study. DB, MH, TE, and WM organized the study. HA performed data analysis. BK and ME provided analysis tools. HA wrote the first draft. DB, TE, and WM wrote sections of the manuscript. All authors contributed to manuscript revision, read and approved the submitted version.
Funding
We acknowledge support by Open Access Publishing Fund of University of Tübingen. The TREND-Study was supported by UCB, Teva, Janssen, Werner Reichardt Centre for Neuroscience, Deutsches Zentrum für Neurodegenerative Erkrankungen (DZNE), Internationale Parkinson Fonds Deutschland, Hertie-Institut für klinische Hirnforschung, and the University of Tübingen.
Conflict of Interest
The authors declare that the research was conducted in the absence of any commercial or financial relationships that could be construed as a potential conflict of interest.
Supplementary Material
The Supplementary Material for this article can be found online at: https://www.frontiersin.org/articles/10.3389/fnagi.2020.00250/full#supplementary-material
References
Acosta-Cabronero, J., Alley, S., Williams, G. B., Pengas, G., and Nestor, P. J. (2012). Diffusion tensor metrics as biomarkers in Alzheimer’s disease. PLoS One 7:e49072. doi: 10.1371/journal.pone.0049072
Andersson, J. L., Jenkinson, M., and Smith, S. (2007). Non-Linear Registration aka Spatial Normalisation FMRIB Technial Report TR07JA2. Headington: Jesper Andersson FMRIB Centre JR Hospital.
Andersson, J. L. R., and Sotiropoulos, S. N. (2016). An integrated approach to correction for off-resonance effects and subject movement in diffusion MR imaging. Neuroimage 125, 1063–1078. doi: 10.1016/j.neuroimage.2015.10.019
Atkinson-Clement, C., Pinto, S., Eusebio, A., and Coulon, O. (2017). Diffusion tensor imaging in Parkinson’s disease: review and meta-analysis. Neuroimage Clin. 16, 98–110. doi: 10.1016/j.nicl.2017.07.011
Basser, P. J., Mattiello, J., and Lebihan, D. (1994). MR diffusion tensor spectroscopy and imaging. Biophys. J. 66, 259–267. doi: 10.1016/s0006-3495(94)80775-1
Beck, A. T., Steer, R. A., and Brown, G. K. (1996). Beck Depression Inventory-II, 2nd Edn. San Antonio, TX: Psychological Corporation.
Berg, D., Postuma, R. B., Adler, C. H., Bloem, B. R., Chan, P., Dubois, B., et al. (2015). MDS research criteria for prodromal Parkinson’s disease. Mov. Disord. 30, 1600–1611. doi: 10.1002/mds.26431
Bledsoe, I. O., Stebbins, G. T., Merkitch, D., and Goldman, J. G. (2018). White matter abnormalities in the corpus callosum with cognitive impairment in Parkinson disease. Neurology 91, e2244–e2255. doi: 10.1212/wnl.0000000000006646
Bregman, N., Thaler, A., Mirelman, A., Helmich, R. C., Gurevich, T., Orr-Urtreger, A., et al. (2017). A cognitive fMRI study in non-manifesting LRRK2 and GBA carriers. Brain Struct. Funct. 222, 1207–1218. doi: 10.1007/s00429-016-1271-4
Cheng, H. C., Ulane, C. M., and Burke, R. E. (2010). Clinical progression in Parkinson disease and the neurobiology of axons. Ann. Neurol. 67, 715–725. doi: 10.1002/ana.21995
Collette, F., Hogge, M., Salmon, E., and Van Der Linden, M. (2006). Exploration of the neural substrates of executive functioning by functional neuroimaging. Neuroscience 139, 209–221. doi: 10.1016/j.neuroscience.2005.05.035
Duncan, G. W., Firbank, M. J., Yarnall, A. J., Khoo, T. K., Brooks, D. J., Barker, R. A., et al. (2016). Gray and white matter imaging: a biomarker for cognitive impairment in early Parkinson’s disease? Mov. Disord. 31, 103–110. doi: 10.1002/mds.26312
Fearnley, J. M., and Lees, A. J. (1991). Ageing and Parkinson’s disease: substantia nigra regional selectivity. Brain 114(Pt 5), 2283–2301. doi: 10.1093/brain/114.5.2283
Fengler, S., Liepelt-Scarfone, I., Brockmann, K., Schaffer, E., Berg, D., and Kalbe, E. (2017). Cognitive changes in prodromal Parkinson’s disease: a review. Mov. Disord. 32, 1655–1666. doi: 10.1002/mds.27135
Folstein, M. F., Folstein, S. E., and Mchugh, P. R. (1975). Mini-mental state”. A practical method for grading the cognitive state of patients for the clinician. J. Psychiatr. Res. 12, 189–198.
Gaenslen, A., Wurster, I., Brockmann, K., Huber, H., Godau, J., Faust, B., et al. (2014). Prodromal features for Parkinson’s disease–baseline data from the TREND study. Eur. J. Neurol. 21, 766–772. doi: 10.1111/ene.12382
Halliday, D. W. R., Gawryluk, J. R., Garcia-Barrera, M. A., and Macdonald, S. W. S. (2019). White matter integrity is associated with intraindividual variability in neuropsychological test performance in healthy older adults. Front. Hum. Neurosci. 13:352. doi: 10.3389/fnhum.2019.00352
Heinzel, S., Berg, D., Gasser, T., Chen, H., Yao, C., Postuma, R. B., et al. (2019). Update of the MDS research criteria for prodromal Parkinson’s disease. Mov. Disord. 34, 1464–1470. doi: 10.1002/mds.27802
Heldmann, M., Heeren, J., Klein, C., Rauch, L., Hagenah, J., Munte, T. F., et al. (2018). Neuroimaging abnormalities in individuals exhibiting Parkinson’s disease risk markers. Mov. Disord. 33, 1412–1422. doi: 10.1002/mds.27313
Hummel, T., Kobal, G., Gudziol, H., and Mackay-Sim, A. (2007). Normative data for the “Sniffin’ Sticks” including tests of odor identification, odor discrimination, and olfactory thresholds: an upgrade based on a group of more than 3,000 subjects. Eur. Arch. Otorhinolaryngol. 264, 237–243. doi: 10.1007/s00405-006-0173-0
Kinnunen, K. M., Greenwood, R., Powell, J. H., Leech, R., Hawkins, P. C., Bonnelle, V., et al. (2011). White matter damage and cognitive impairment after traumatic brain injury. Brain 134, 449–463. doi: 10.1093/brain/awq347
Knudsen, K., Fedorova, T. D., Hansen, A. K., Sommerauer, M., Otto, M., Svendsen, K. B., et al. (2018). In-vivo staging of pathology in REM sleep behaviour disorder: a multimodality imaging case-control study. Lancet Neurol. 17, 618–628. doi: 10.1016/s1474-4422(18)30162-5
Koirala, N., Anwar, A. R., Ciolac, D., Glaser, M., Pintea, B., Deuschl, G., et al. (2019). Alterations in white matter network and microstructural integrity differentiate Parkinson’s disease patients and healthy subjects. Front. Aging Neurosci. 11:191. doi: 10.3389/fnagi.2019.00191
Koirala, N., Fleischer, V., Glaser, M., Zeuner, K. E., Deuschl, G., Volkmann, J., et al. (2018). Frontal lobe connectivity and network community characteristics are associated with the outcome of subthalamic nucleus deep brain stimulation in patients with Parkinson’s disease. Brain Topogr. 31, 311–321. doi: 10.1007/s10548-017-0597-4
Lewis, S. J., Dove, A., Robbins, T. W., Barker, R. A., and Owen, A. M. (2003). Cognitive impairments in early Parkinson’s disease are accompanied by reductions in activity in frontostriatal neural circuitry. J. Neurosci. 23, 6351–6356. doi: 10.1523/jneurosci.23-15-06351.2003
Litvan, I., Aarsland, D., Adler, C. H., Goldman, J. G., Kulisevsky, J., Mollenhauer, B., et al. (2011). MDS task force on mild cognitive impairment in Parkinson’s disease: critical review of PD-MCI. Mov. Disord. 26, 1814–1824. doi: 10.1002/mds.23823
Melzer, T. R., Watts, R., Macaskill, M. R., Pitcher, T. L., Livingston, L., Keenan, R. J., et al. (2013). White matter microstructure deteriorates across cognitive stages in Parkinson disease. Neurology 80, 1841–1849. doi: 10.1212/wnl.0b013e3182929f62
Miller, D. B., and O’Callaghan, J. P. (2015). Biomarkers of Parkinson’s disease: present and future. Metabolism 64, S40–S46.
Mirelman, A., Gurevich, T., Giladi, N., Bar-Shira, A., Orr-Urtreger, A., and Hausdorff, J. M. (2011). Gait alterations in healthy carriers of the LRRK2 G2019S mutation. Ann. Neurol. 69, 193–197. doi: 10.1002/ana.22165
Molinuevo, J. L., Ripolles, P., Simo, M., Llado, A., Olives, J., Balasa, M., et al. (2014). White matter changes in preclinical Alzheimer’s disease: a magnetic resonance imaging-diffusion tensor imaging study on cognitively normal older people with positive amyloid beta protein 42 levels. Neurobiol. Aging 35, 2671–2680. doi: 10.1016/j.neurobiolaging.2014.05.027
Mori, S., Oishi, K., Jiang, H., Jiang, L., Li, X., Akhter, K., et al. (2008). Stereotaxic white matter atlas based on diffusion tensor imaging in an ICBM template. Neuroimage 40, 570–582. doi: 10.1016/j.neuroimage.2007.12.035
Niendam, T. A., Laird, A. R., Ray, K. L., Dean, Y. M., Glahn, D. C., and Carter, C. S. (2012). Meta-analytic evidence for a superordinate cognitive control network subserving diverse executive functions. Cogn. Affect. Behav. Neurosci. 12, 241–268. doi: 10.3758/s13415-011-0083-5
O’Sullivan, M., Jones, D. K., Summers, P. E., Morris, R. G., Williams, S. C., and Markus, H. S. (2001). Evidence for cortical “disconnection” as a mechanism of age-related cognitive decline. Neurology 57, 632–638. doi: 10.1212/wnl.57.4.632
Perry, M. E., Mcdonald, C. R., Hagler, D. J. Jr., Gharapetian, L., Kuperman, J. M., Koyama, A. K., et al. (2009). White matter tracts associated with set-shifting in healthy aging. Neuropsychologia 47, 2835–2842. doi: 10.1016/j.neuropsychologia.2009.06.008
Pierpaoli, C., and Basser, P. J. (1996). Toward a quantitative assessment of diffusion anisotropy. Magn. Reson. Med. 36, 893–906. doi: 10.1002/mrm.1910360612
Rahayel, S., Montplaisir, J., Monchi, O., Bedetti, C., Postuma, R. B., Brambati, S., et al. (2015). Patterns of cortical thinning in idiopathic rapid eye movement sleep behavior disorder. Mov. Disord. 30, 680–687. doi: 10.1002/mds.25820
Reitan, R. M. J. P., and Skills, M. (1958). Validity of the trail making test as an indicator of organic brain damage. Percept. Motor Skills 8, 271–276. doi: 10.2466/pms.1958.8.3.271
Rock, P. L., Roiser, J. P., Riedel, W. J., and Blackwell, A. D. (2014). Cognitive impairment in depression: a systematic review and meta-analysis. Psychol. Med. 44, 2029–2040. doi: 10.1017/s0033291713002535
Rueckert, D., Sonoda, L. I., Hayes, C., Hill, D. L., Leach, M. O., and Hawkes, D. J. (1999). Nonrigid registration using free-form deformations: application to breast MR images. IEEE Trans. Med. Imag. 18, 712–721. doi: 10.1109/42.796284
Sanchez-Cubillo, I., Perianez, J. A., Adrover-Roig, D., Rodriguez-Sanchez, J. M., Rios-Lago, M., Tirapu, J., et al. (2009). Construct validity of the trail making test: role of task-switching, working memory, inhibition/interference control, and visuomotor abilities. J. Int. Neuropsychol. Soc. 15, 438–450. doi: 10.1017/s1355617709090626
Scherfler, C., Frauscher, B., Schocke, M., Iranzo, A., Gschliesser, V., Seppi, K., et al. (2011). White and gray matter abnormalities in idiopathic rapid eye movement sleep behavior disorder: a diffusion-tensor imaging and voxel-based morphometry study. Ann. Neurol. 69, 400–407. doi: 10.1002/ana.22245
Schmahmann, J. D., Smith, E. E., Eichler, F. S., and Filley, C. M. (2008). Cerebral white matter: neuroanatomy, clinical neurology, and neurobehavioral correlates. Ann. N. Y. Acad. Sci. 1142, 266–309.
Smith, S. M., Jenkinson, M., Johansen-Berg, H., Rueckert, D., Nichols, T. E., Mackay, C. E., et al. (2006). Tract-based spatial statistics: voxelwise analysis of multi-subject diffusion data. Neuroimage 31, 1487–1505. doi: 10.1016/j.neuroimage.2006.02.024
Smith, S. M., Jenkinson, M., Woolrich, M. W., Beckmann, C. F., Behrens, T. E., Johansen-Berg, H., et al. (2004). Advances in functional and structural MR image analysis and implementation as FSL. Neuroimage 23(Suppl. 1), S208–S219.
Smith, S. M., and Nichols, T. E. (2009). Threshold-free cluster enhancement: addressing problems of smoothing, threshold dependence and localisation in cluster inference. Neuroimage 44, 83–98. doi: 10.1016/j.neuroimage.2008.03.061
Song, S. K., Sun, S. W., Ramsbottom, M. J., Chang, C., Russell, J., and Cross, A. H. (2002). Dysmyelination revealed through MRI as increased radial (but unchanged axial) diffusion of water. Neuroimage 17, 1429–1436. doi: 10.1006/nimg.2002.1267
Stiasny-Kolster, K., Mayer, G., Schafer, S., Moller, J. C., Heinzel-Gutenbrunner, M., and Oertel, W. H. (2007). The REM sleep behavior disorder screening questionnaire–a new diagnostic instrument. Mov. Disord. 22, 2386–2393. doi: 10.1002/mds.21740
Sun, S. W., Liang, H. F., Le, T. Q., Armstrong, R. C., Cross, A. H., and Song, S. K. (2006). Differential sensitivity of in vivo and ex vivo diffusion tensor imaging to evolving optic nerve injury in mice with retinal ischemia. Neuroimage 32, 1195–1204. doi: 10.1016/j.neuroimage.2006.04.212
Thaler, A., Mirelman, A., Helmich, R. C., Van Nuenen, B. F., Rosenberg-Katz, K., Gurevich, T., et al. (2013). Neural correlates of executive functions in healthy G2019S LRRK2 mutation carriers. Cortex 49, 2501–2511. doi: 10.1016/j.cortex.2012.12.017
Tolosa, E., Wenning, G., and Poewe, W. (2006). The diagnosis of Parkinson’s disease. Lancet Neurol 5, 75–86.
Unger, M. M., Belke, M., Menzler, K., Heverhagen, J. T., Keil, B., Stiasny-Kolster, K., et al. (2010). Diffusion tensor imaging in idiopathic REM sleep behavior disorder reveals microstructural changes in the brainstem, substantia nigra, olfactory region, and other brain regions. Sleep 33, 767–773. doi: 10.1093/sleep/33.6.767
Wen, M. C., Heng, H. S. E., Hsu, J. L., Xu, Z., Liew, G. M., Au, W. L., et al. (2017). Structural connectome alterations in prodromal and de novo Parkinson’s disease patients. Parkins. Relat. Disord. 45, 21–27. doi: 10.1016/j.parkreldis.2017.09.019
Zhang, Y., Wu, I. W., Buckley, S., Coffey, C. S., Foster, E., Mendick, S., et al. (2015). Diffusion tensor imaging of the nigrostriatal fibers in Parkinson’s disease. Mov. Disord. 30, 1229–1236. doi: 10.1002/mds.26251
Keywords: Parkinson’s disease, prodromal phase, diffusion tensor imaging, white matter, cognitive flexibility
Citation: Alzaid H, Ethofer T, Hobert MA, Kardatzki B, Erb M, Maetzler W and Berg D (2020) Distinct Relationship Between Cognitive Flexibility and White Matter Integrity in Individuals at Risk of Parkinson’s Disease. Front. Aging Neurosci. 12:250. doi: 10.3389/fnagi.2020.00250
Received: 08 March 2020; Accepted: 20 July 2020;
Published: 13 August 2020.
Edited by:
Xudong Huang, Massachusetts General Hospital and Harvard Medical School, United StatesReviewed by:
Deborah Lynn Harrington, University of California, San Diego, United StatesNabin Koirala, Haskins Laboratories, United States
Copyright © 2020 Alzaid, Ethofer, Hobert, Kardatzki, Erb, Maetzler and Berg. This is an open-access article distributed under the terms of the Creative Commons Attribution License (CC BY). The use, distribution or reproduction in other forums is permitted, provided the original author(s) and the copyright owner(s) are credited and that the original publication in this journal is cited, in accordance with accepted academic practice. No use, distribution or reproduction is permitted which does not comply with these terms.
*Correspondence: Haidar Alzaid, aGFpZGFyYWx6YWlkQGdtYWlsLmNvbQ==