 Jie Mei
 Christian Desrosiers
 Johannes Frasnelli
- 1Chemosensory Neuroanatomy Lab, Department of Anatomy, Université du Québec à Trois-Rivières (UQTR), Trois-Rivières, QC, Canada
- 2Laboratoire d'Imagerie, de Vision et d'Intelligence Artificielle (LIVIA), Department of Software and IT Engineering, École de Technologie Supérieure, Montreal, QC, Canada
- 3Centre de Recherche de l'Hôpital du Sacré-Coeur de Montréal, Centre Intégré Universitaire de Santé et de Services Sociaux du Nord-de-l'Île-de-Montréal (CIUSSS du Nord-de-l'Île-de-Montréal), Montreal, QC, Canada
Diagnosis of Parkinson's disease (PD) is commonly based on medical observations and assessment of clinical signs, including the characterization of a variety of motor symptoms. However, traditional diagnostic approaches may suffer from subjectivity as they rely on the evaluation of movements that are sometimes subtle to human eyes and therefore difficult to classify, leading to possible misclassification. In the meantime, early non-motor symptoms of PD may be mild and can be caused by many other conditions. Therefore, these symptoms are often overlooked, making diagnosis of PD at an early stage challenging. To address these difficulties and to refine the diagnosis and assessment procedures of PD, machine learning methods have been implemented for the classification of PD and healthy controls or patients with similar clinical presentations (e.g., movement disorders or other Parkinsonian syndromes). To provide a comprehensive overview of data modalities and machine learning methods that have been used in the diagnosis and differential diagnosis of PD, in this study, we conducted a literature review of studies published until February 14, 2020, using the PubMed and IEEE Xplore databases. A total of 209 studies were included, extracted for relevant information and presented in this review, with an investigation of their aims, sources of data, types of data, machine learning methods and associated outcomes. These studies demonstrate a high potential for adaptation of machine learning methods and novel biomarkers in clinical decision making, leading to increasingly systematic, informed diagnosis of PD.
Introduction
Parkinson's disease (PD) is one of the most common neurodegenerative diseases with a prevalence rate of 1% in the population above 60 years old, affecting 1–2 people per 1,000 (Tysnes and Storstein, 2017). The estimated global population affected by PD has more than doubled from 1990 to 2016 (from 2.5 million to 6.1 million), which is a result of increased number of elderly people and age-standardized prevalence rates (Dorsey et al., 2018). PD is a progressive neurological disorder associated with motor and non-motor features (Jankovic, 2008) which comprises multiple aspects of movements, including planning, initiation and execution (Contreras-Vidal and Stelmach, 1995).
During its development, movement-related symptoms such as tremor, rigidity and difficulties in initiation can be observed, prior to cognitive and behavioral alterations including dementia (Opara et al., 2012). PD severely affects patients' quality of life (QoL), social functions and family relationships, and places heavy economic burdens at individual and society levels (Johnson et al., 2013; Kowal et al., 2013; Yang and Chen, 2017).
The diagnosis of PD is traditionally based on motor symptoms. Despite the establishment of cardinal signs of PD in clinical assessments, most of the rating scales used in the evaluation of disease severity have not been fully evaluated and validated (Jankovic, 2008). Although non-motor symptoms (e.g., cognitive changes such as problems with attention and planning, sleep disorders, sensory abnormalities such as olfactory dysfunction) are present in many patients prior to the onset of PD (Jankovic, 2008; Tremblay et al., 2017), they lack specificity, are complicated to assess and/or yield variability from patient to patient (Zesiewicz et al., 2006). Therefore, non-motor symptoms do not yet allow for diagnosis of PD independently (Braak et al., 2003), although some have been used as supportive diagnostic criteria (Postuma et al., 2015).
Machine learning techniques are being increasingly applied in the healthcare sector. As its name implies, machine learning allows for a computer program to learn and extract meaningful representation from data in a semi-automatic manner. For the diagnosis of PD, machine learning models have been applied to a multitude of data modalities, including handwritten patterns (Drotár et al., 2015; Pereira et al., 2018), movement (Yang et al., 2009; Wahid et al., 2015; Pham and Yan, 2018), neuroimaging (Cherubini et al., 2014a; Choi et al., 2017; Segovia et al., 2019), voice (Sakar et al., 2013; Ma et al., 2014), cerebrospinal fluid (CSF) (Lewitt et al., 2013; Maass et al., 2020), cardiac scintigraphy (Nuvoli et al., 2019), serum (Váradi et al., 2019), and optical coherence tomography (OCT) (Nunes et al., 2019). Machine learning also allows for combining different modalities, such as magnetic resonance imaging (MRI) and single-photon emission computed tomography (SPECT) data (Cherubini et al., 2014b; Wang et al., 2017), in the diagnosis of PD. By using machine learning approaches, we may therefore identify relevant features that are not traditionally used in the clinical diagnosis of PD and rely on these alternative measures to detect PD in preclinical stages or atypical forms.
In recent years, the number of publications on the application of machine learning to the diagnosis of PD has increased. Although previous studies have reviewed the use of machine learning in the diagnosis and assessment of PD, they were limited to the analysis of motor symptoms, kinematics, and wearable sensor data (Ahlrichs and Lawo, 2013; Ramdhani et al., 2018; Belić et al., 2019). Moreover, some of these reviews only included studies published between 2015 and 2016 (Pereira et al., 2019). In this study, we aim to (a) comprehensively summarize all published studies that applied machine learning models to the diagnosis of PD for an exhaustive overview of data sources, data types, machine learning models, and associated outcomes, (b) assess and compare the feasibility and efficiency of different machine learning methods in the diagnosis of PD, and (c) provide machine learning practitioners interested in the diagnosis of PD with an overview of previously used models and data modalities and the associated outcomes, and recommendations on how experimental protocols and results could be reported to facilitate reproduction. As a result, the application of machine learning to clinical and non-clinical data of different modalities has often led to high diagnostic accuracies in human participants, therefore may encourage the adaptation of machine learning algorithms and novel biomarkers in clinical settings to assist more accurate and informed decision making.
Methods
Search Strategy
A literature search was conducted on the PubMed (https://pubmed.ncbi.nlm.nih.gov) and IEEE Xplore (https://ieeexplore.ieee.org/search/advanced/command) databases on February 14, 2020 for all returned results. Boolean search strings used are shown in Table 1. No additional filters were applied in the literature search. All retrieved studies were systematically identified, screened and extracted for relevant information following the Preferred Reporting Items for Systematic Reviews and Meta-Analyses (PRISMA) guidelines (Moher et al., 2009).
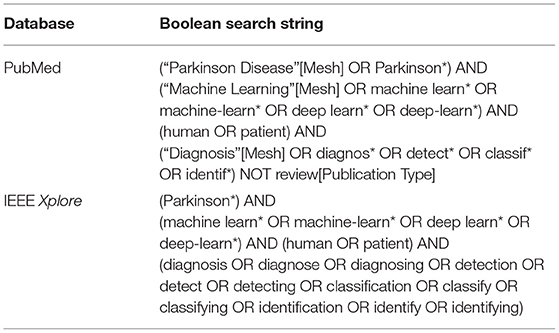
Table 1. Boolean search strings used for the retrieval of relevant publications on PubMed and IEEE Xplore databases.
Inclusion and Exclusion Criteria
Studies that satisfy one or more of the following criteria and used machine learning methods were included:
(1) Classification of PD from healthy controls (HC),
(2) Classification of PD from Parkinsonism (e.g., progressive supranuclear palsy (PSP) and multiple system atrophy (MSA)), and
(3) Classification of PD from other movement disorders (e.g., essential tremor (ET)).
Studies falling into one or more of the following categories were excluded:
(1) Studies related to Parkinsonism or/and diseases other than PD that did not involve classification or detection of PD (e.g., differential diagnosis of PSP, MSA, and other atypical Parkinsonian disorders),
(2) Studies not related to the diagnosis of PD (e.g., subtyping or severity assessment, analysis of behavior, disease progression, treatment outcome prediction, identification, and localization of brain structures or parameter optimization during surgery),
(3) Studies related to the diagnosis of PD, but performed analysis and assessed model performance at sample level (e.g., classification using individual MRI scans without aggregating scan-level performance to patient level),
(4) Classification of PD from non-Parkinsonism (e.g., Alzheimer's disease),
(5) Study did not use metrics that measure classification performance,
(6) Study used organisms other than human (e.g., Caenorhabditis elegans, mice or rats),
(7) Study did not provide sufficient or accurate descriptions of machine learning methods, datasets or subjects used (e.g., does not provide sample size, or incorrectly described the dataset(s) used),
(8) Not original journal article or conference proceedings papers (e.g., review and viewpoint paper), and
(9) In languages other than English.
Data Extraction
The following information is included in the data extraction table: (1) objectives, (2) type of diagnosis (diagnosis, differential diagnosis, sub-typing), (3) data source, (4) data type, (5) number of subjects, (6) machine learning method(s), splitting strategy and cross validation, (7) associated outcomes, (8) year, and (9) reference.
For studies published online first and archived in another year, “year of publication” was defined as the year during which the study was published online. If this information was unavailable, the year in which the article was copyrighted was regarded as the year of publication. For studies that introduced novel models and used existing models merely for comparison, information related to the novel models was extracted. Classification of PD and scans without evidence for dopaminergic deficit (SWEDD) was treated as subtyping (Erro et al., 2016).
Study Objectives
To outline the different goals and objectives of included studies, we have further categorized them based on the type of diagnosis and their general aim. From the perspective of diagnostics, these studies could be divided into (a) the diagnosis or detection of PD (which compares data collected from PD patients and healthy controls), (b) differential diagnosis (discrimination between patients with idiopathic PD and patients with atypical Parkinsonism), and (c) sub-typing (discrimination among sub-types of PD).
Included studies were also analyzed for their general aim: For studies with a focus on the development of novel technical approaches to be used in the diagnosis of Parkinson's disease, e.g., new machine learning and deep learning models and architectures, data acquisition devices, and feature extraction algorithms that haven't been previously presented and/or employed, we defined them as (a) “methodology” studies. Studies that validate and investigate (a) the application of previously published and validated machine learning and deep learning models, and/or (b) the feasibility of introducing data modalities that are not commonly used in the machine learning-based diagnosis of PD (e.g., CSF data), were defined as (b) “clinical application” studies.
Model Evaluation
In the present study, accuracy was used to compare performance of machine learning models. For each data type, we summarized the type of machine learning models that led to the per-study highest accuracy. However, in some studies, only one machine learning model was tested. Therefore, we define “model associated with the per-study highest accuracy” as (a) the only model implemented and used in a study or (b) the model that achieved the highest accuracy or that was highlighted in studies that used multiple models. Results are expressed as mean (SD).
For studies reporting both training and testing/validation accuracy, testing or validation accuracy was considered. For studies that reported both validation and test accuracy, test accuracy was considered. For studies with more than one dataset or classification problem (e.g., HC vs. PD and HC vs. idiopathic hyposmia vs. PD), accuracy was averaged across datasets or classification problems. For studies that reported classification accuracy for each group of subjects individually, accuracy was averaged across groups. For studies reporting a range of accuracies or accuracies given by different cross validation methods or feature combinations, the highest accuracies were considered. In studies that compared HC with diseases other than PD or PD with diseases other than Parkinsonism, diagnosis of diseases other than PD or Parkinsonism (e.g., amyotrophic lateral sclerosis) was not considered. Accuracy of severity assessment was not considered.
Results
Literature Review
Based on the search criteria, we retrieved 427 (PubMed) and 215 (IEEEXplore) search results, leading to a total of 642 publications. After removing duplicates, we screened 593 publications for titles and abstracts, following which we excluded 313 based on the exclusion criteria and examined 280 full text articles. Overall, we included 209 research articles for data extraction (Figure 1 and see Supplementary Materials for a full list of included studies). All articles were published from the year 2009 onwards, and an increase in the number of papers published per year was observed (Supplementary Figure 1).
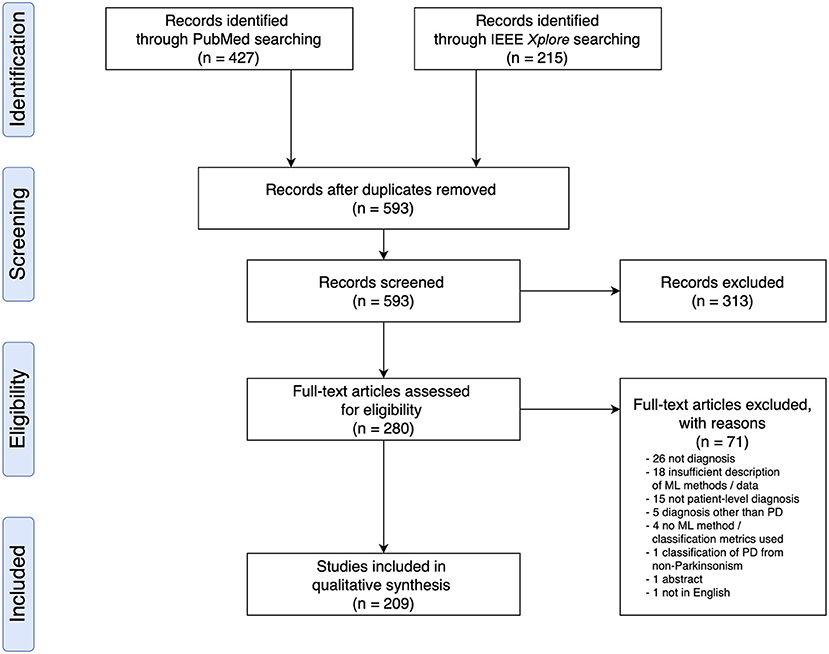
Figure 1. PRISMA Flow Diagram of Literature Search and Selection Process showing the number of studies identified, screened, extracted, and included in the review.
Data Source and Sample Size
In 93 out of 209 studies (43.1%), original data were collected from human participants. In 108 studies (51.7%), data used were from public repositories and databases, including University of California at Irvine (UCI) Machine Learning Repository (Dua and Graff, 2018) (n = 44), Parkinson's Progression Markers Initiative (Marek et al., 2011) (PPMI; n = 33), PhysioNet (Goldberger et al., 2000) (n = 15), HandPD dataset (Pereira et al., 2015) (n = 6), mPower database (Bot et al., 2016) (n = 4), and 6 other databases (Mucha et al., 2018; Vlachostergiou et al., 2018; Bhati et al., 2019; Hsu et al., 2019; Taleb et al., 2019; Wodzinski et al., 2019; Table 2).

Table 2. Source of data of the included studies.
In 3 studies, data from public repositories were combined with data from local databases or participants (Agarwal et al., 2016; Choi et al., 2017; Taylor and Fenner, 2017). In the remaining studies, data were sourced (Wahid et al., 2015) from another study (Fernandez et al., 2013), collected at another institution (Segovia et al., 2019), obtained from the authors' institutional database (Nunes et al., 2019), collected postmortem (Lewitt et al., 2013), or commercially sourced (Váradi et al., 2019).
The 209 studies had an average sample size of 184.6 (289.3), with a smallest sample size of 10 (Kugler et al., 2013), and a largest sample size of 2,289 (Tracy et al., 2019; Figure 2A). For studies that recruited human participants (n = 93), data from an average of 118.0 (142.9) participants were collected (range: 10–920; Figure 2B). For other studies (n = 116), an average sample size of 238.1 (358.5) was reported (range: 30–2,289; Figure 2B). For a description of average accuracy reported in these studies in relation to sample size, see Figure 2C.
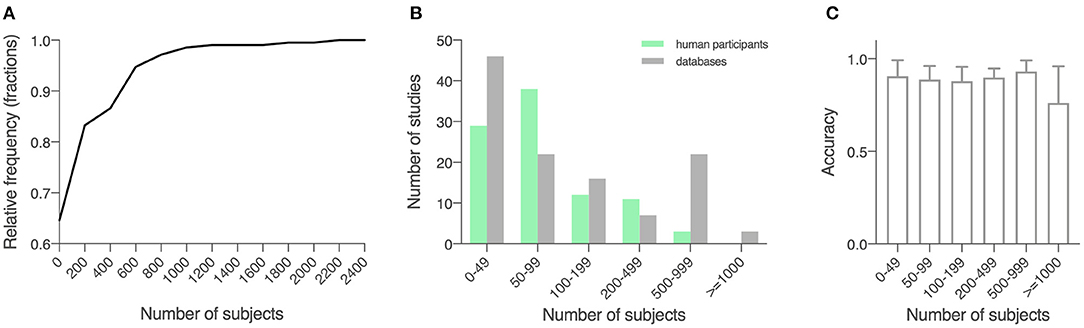
Figure 2. Sample size of the included studies. (A) Cumulative relative frequency graph depicting the frequency of the sample sizes studied. (B) Histogram depicting the frequency of a sample size of 0–50, 50–100, 100–200, 200–500, 500–100, and over 1,000 for studies using locally recruited human participants and studies using previously published open databases. Green, studies using locally recruited human participants; gray, studies using data sourced from public databases. (C) Model performance as measured by accuracy in relation to sample size, shown in means (SD).
Study Objectives
In included studies, although “diagnosis of PD” was used as the search criteria, machine learning had been applied for diagnosis (PD vs. HC), differential diagnosis (idiopathic PD vs. atypical Parkinsonism) and sub-typing (differentiation of sub-types of PD) purposes. Most studies focused on diagnosis (n = 168, 80.4%) or differential diagnosis (n = 20, 9.6%). Fourteen studies performed both diagnosis and differential diagnosis (6.7%), 5 studies (2.4%) diagnosed and subtyped PD, 2 studies (1.0%) included diagnosis, differential diagnosis, and subtyping.
Among the included studies, a total of 132 studies (63.2%) implemented and tested a machine learning method, a model architecture, a diagnostic system, a feature extraction algorithm, or a device for non-invasive, low-cost data acquisition that hasn't been established for the detection and early diagnosis of PD (methodology studies). In 77 studies (36.8%), previously proposed and validated machine learning methods were tested in clinical settings for early detection of PD, identification of novel biomarkers or examination of uncommonly used data modalities for the diagnosis of PD (e.g., CSF; clinical application studies).
Comparing Studies With Different Objectives
Source of Data
In the 132 studies that proposed or tested novel machine learning methods (i.e., methodology studies), a majority used data from publicly available databases (n = 89, 67.4%). Data collected from human participants were used in 41 studies (31.1%) and the two remaining studies (1.5%) used commercially sourced data or data from both existing public databases and local participants specifically recruited for the study. Out of the 77 studies that used machine learning models in clinical settings (i.e., clinical application studies), 52 (67.5%) collected data from human participants, 22 (28.6%) used data from public databases. Two (2.6%) studies obtained data from a database and a local cohort, and 1 (1.3%) study collected data postmortem.
Data Modality
In methodology studies, the most commonly used data modalities were voice recordings (n = 51, 38.6%), movement (n = 35, 26.5%), and MRI data (n = 15, 11.4%). For studies on clinical applications, MRI data (n = 21, 27.3%), movement (n = 16, 20.8%), and SPECT imaging data (n = 12, 15.6%) were of high relevance. All studies using CSF features (n = 5) focused on validation of existing machine learning models in a clinical setting (Figure 3A).
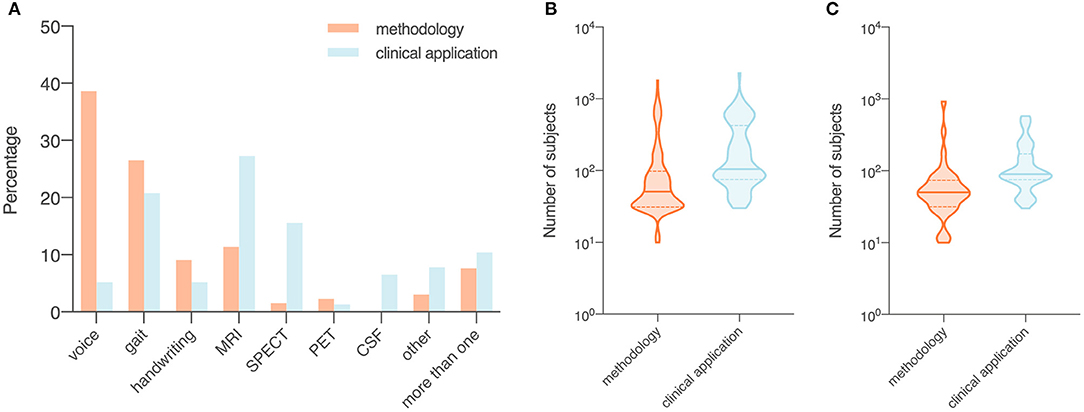
Figure 3. Data modality (A) and number of subjects (B,C) of included studies, summarized by objectives (i.e., methodology or clinical application). Orange, studies with a focus on the development of a novel technical approach to be used in the diagnosis of Parkinson's disease (i.e., methodology); blue, studies that investigate the use of published machine learning models or novel data modalities (i.e., clinical application). (A) Proportion of data modalities in included studies displayed as percentages. (B) Sample size in all included studies. (C) Sample size in studies that collected data from recruited human participants. Data shown are means (SD).
Number of Subjects
The average sample size was 137.1 for the 132 methodology studies (Figure 3B). For 41 out of the 132 studies that used data from recruited human participants, the average sample size was 81.7 (Figure 3C). In the 77 studies on clinical applications, the average sample size was 266.2 (Figure 3B). For 52 out of the 77 clinical studies that collected data from recruited participants, the average sample size was 145.9 (Figure 3C).
Machine Learning Methods Applied to the Diagnosis of PD
We divided 448 machine learning models from the 209 studies into 8 categories: (1) support vector machine (SVM) and variants (n = 132 from 130 studies), (2) neural networks (n = 76 from 62 studies), (3) ensemble learning (n = 82 from 57 studies), (4) nearest neighbor and variants (n = 33 from 33 studies), (5) regression (n = 31 from 31 studies), (6) decision tree (n = 28 from 27 studies), (7) naïve Bayes (n = 26, from 26 studies), and (8) discriminant analysis (n = 12 from 12 studies). A small percentage of models used did not fall into any of the categories (n = 28, used in 24 studies).
On average, 2.14 machine learning models per study were applied to the diagnosis of PD. One study may have used more than one category of models. For a full description of data types used to train each type of machine learning models and the associated outcomes, see Supplementary Materials and Supplementary Figure 2.
Performance Metrics
Various metrics have been used to assess the performance of machine learning models (Table 3). The most common metric was accuracy (n = 174, 83.3%), which was used individually (n = 55) or in combination with other metrics (n = 119) in model evaluation. Among the 174 studies that used accuracy, some have combined accuracy with sensitivity (i.e., recall) and specificity (n = 42), or with sensitivity, specificity and AUC (n = 16), or with recall (i.e., sensitivity), precision and F1 score (n = 7) for a more systematic understanding of model performance. A total of 35 studies (16.7%) used metrics other than accuracy. In these studies, the most used performance metrics were AUC (n = 19), sensitivity (n = 17), and specificity (n = 14), and the three were often applied together (n = 9) with or without other metrics.
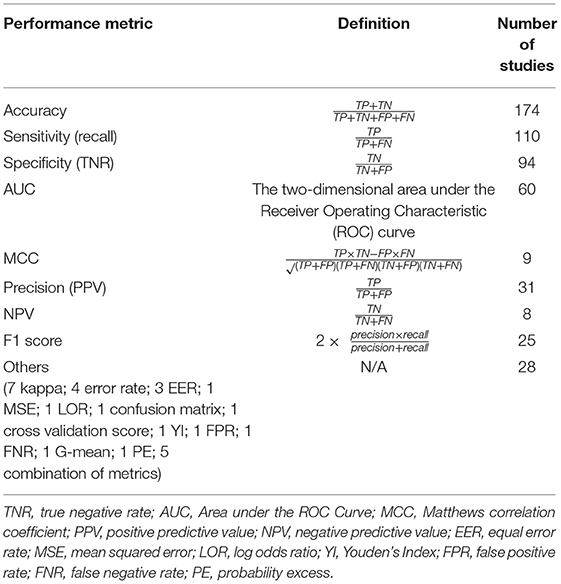
Table 3. Performance metrics used in the evaluation of machine learning models.
Data Types and Associated Outcomes
Out of 209 studies, 122 (58.4%) applied machine learning methods to movement-related data, i.e., voice recordings (n = 55, 26.3%), movement data (n = 51, 24.4%), or handwritten patterns (n = 16, 7.7%). Imaging modalities analyzed including MRI (n = 36, 17.2%), SPECT (n = 14, 6.7%), and positron emission tomography (PET; n = 4, 1.9%). Five studies analyzed CSF samples (2.4%). In 18 studies (8.6%), a combination of different types of data was used.
Ten studies (4.8%) used data that do not belong to any categories mentioned above, such as single nucleotide polymorphisms (Cibulka et al., 2019) (SNPs), electromyography (EMG) (Kugler et al., 2013), OCT (Nunes et al., 2019), cardiac scintigraphy (Nuvoli et al., 2019), Patient Questionnaire of Movement Disorder Society Unified Parkinson's Disease Rating Scale (MDS-UPDRS) (Prashanth and Dutta Roy, 2018), whole-blood gene expression profiles (Shamir et al., 2017), transcranial sonography (Shi et al., 2018) (TCS), eye movements (Tseng et al., 2013), electroencephalography (EEG) (Vanegas et al., 2018), and serum samples (Váradi et al., 2019).
Given that studies used different data modalities and sources, and sometimes different samples of the same database, a summary of model performance, instead of direct comparison across studies, is provided.
Voice Recordings (n = 55)
The 49 studies that used accuracy to evaluate machine learning models achieved an average accuracy of 90.9 (8.6) % (Figure 4A), ranging from 70.0% (Kraipeerapun and Amornsamankul, 2015; Ali et al., 2019a) to 100.0% (Hariharan et al., 2014; Abiyev and Abizade, 2016; Ali et al., 2019c; Dastjerd et al., 2019). In 3 studies, the highest accuracy was achieved by two types of machine learning models individually, namely regression or SVM (Ali et al., 2019a), neural network or SVM (Hariharan et al., 2014), and ensemble learning or SVM (Mandal and Sairam, 2013). The per-study highest accuracy was achieved with SVM in 23 studies (39.7%), with neural network in 16 studies (27.6%), with ensemble learning in 7 studies (12.1%), with nearest neighbor in 3 studies (5.2%), and with regression in 2 studies (3.4%). Models that do not belong to any given categories led to the per-study highest accuracy in 7 studies (12.1%; Figure 4B).

Figure 4. Data type, machine learning models applied, and accuracy. (A) Accuracy achieved in individual studies and average accuracy for each data type. Error bar: standard deviation. (B) Distribution of machine learning models applied per data type. MRI, magnetic resonance imaging; SPECT, single-photon emission computed tomography; PET, positron emission tomography; CSF, cerebrospinal fluid; SVM, support vector machine; NN, neural network; EL, ensemble learning; k-NN, nearest neighbor; regr, regression; DT, decision tree; NB, naïve Bayes; DA, discriminant analysis; other: data/models that do not belong to any of the given categories.
Voice recordings from the UCI machine learning repository were used in 42 studies (Table 4). Among the 42 studies, 39 used accuracy to evaluate classification performance and the average accuracy was 92.0 (9.0) %. The lowest accuracy was 70.0% and the highest accuracy was 100.0%. Eight out of 9 studies that collected voice recordings from human participants used accuracy as the performance metric, and the average, lowest and highest accuracies were 87.7 (6.8) %, 77.5%, and 98.6%, respectively. The 4 remaining studies used data from the Neurovoz corpus (n = 1), mPower database (n = 1), PC-GITA database (n = 1), or data from both the UCI machine learning repository and human participants (n = 1). Two out of these 4 studies used accuracy to evaluate model performance and reported an accuracy of 81.6 and 91.7%.
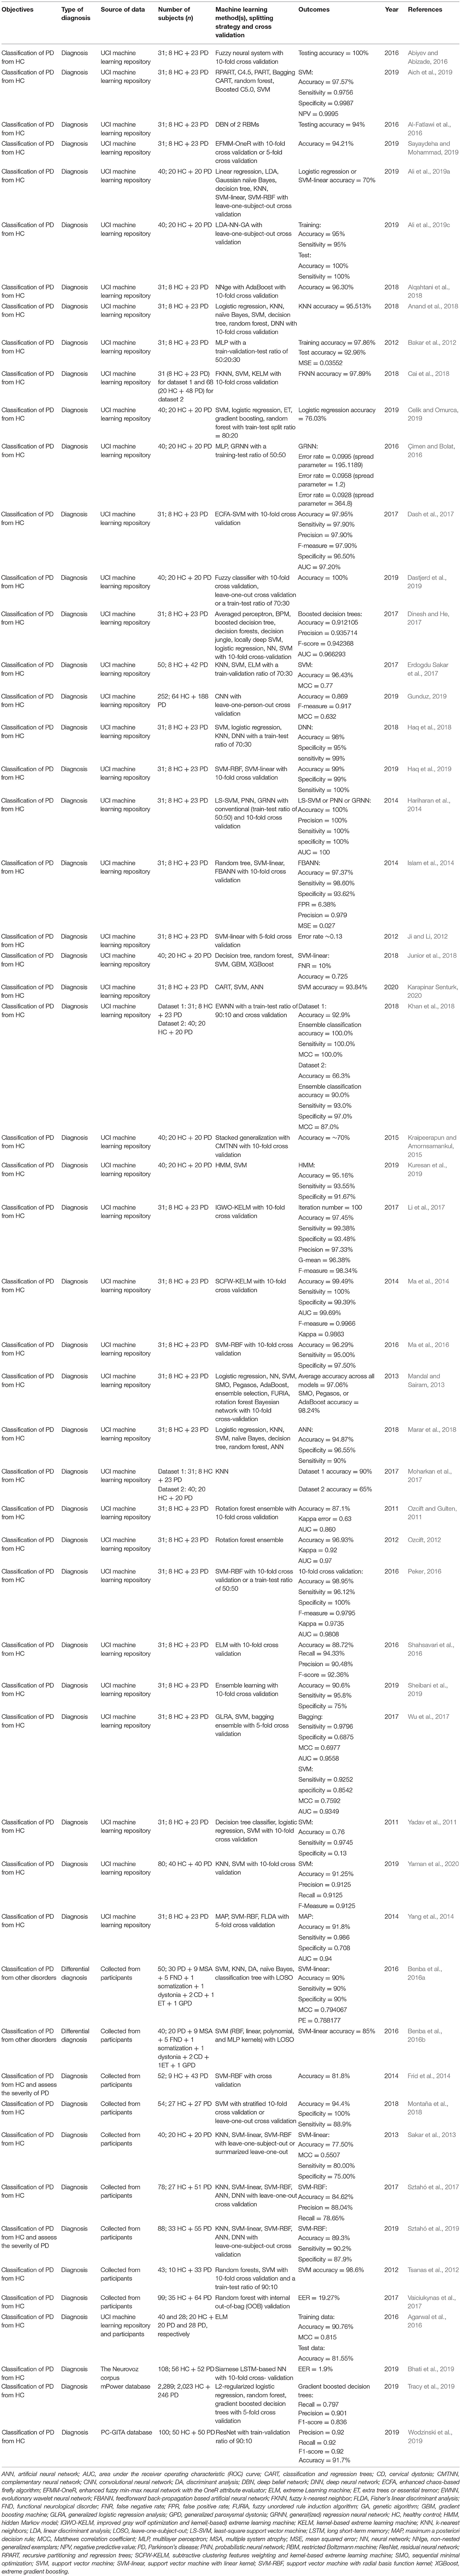
Table 4. Studies that applied machine learning models to voice recordings to diagnose PD (n = 55).
Movement Data (n = 51)
The 43 out of 51 studies using accuracy to assess model performance achieved an average accuracy of 89.1 (8.3) %, ranging from 62.1% (Prince and de Vos, 2018) to 100.0% (Surangsrirat et al., 2016; Joshi et al., 2017; Pham, 2018; Pham and Yan, 2018; Figure 4A). One study reported three machine learning methods (SVM, nearest neighbor and decision tree) achieving the highest accuracy individually (Félix et al., 2019). Out of the 51 studies, the per-study highest accuracy was achieved with SVM in 22 studies (41.5%), with ensemble learning in 13 studies (24.5%), with neural network in 9 studies (17.0%), with nearest neighbor in 4 studies (7.5%), with discriminant analysis in 1 study (1.9%), with naïve Bayes in 1 study (1.9%), and with decision tree in 1 study (1.9%). Models that do not belong to any given categories were associated with the highest per-study accuracy in two studies (3.8%; Figure 4B).
Among the 33 studies that collected movement data from recruited participants, 25 used accuracy in model evaluation, leading to an average accuracy of 87.0 (7.3) % (Table 5). The lowest and highest accuracies were 64.1% (Martínez et al., 2018) and 100.0% (Surangsrirat et al., 2016), respectively. Fifteen studies used data from the PhysioNet database (Table 5) and had an average accuracy of 94.4 (4.6) %, a lowest accuracy of 86.4% and a highest accuracy of 100%. Three studies used data from the mPower database (n = 2) or data sourced from another study (n = 1), and the average accuracy of these studies was 80.6 (16.2) %.
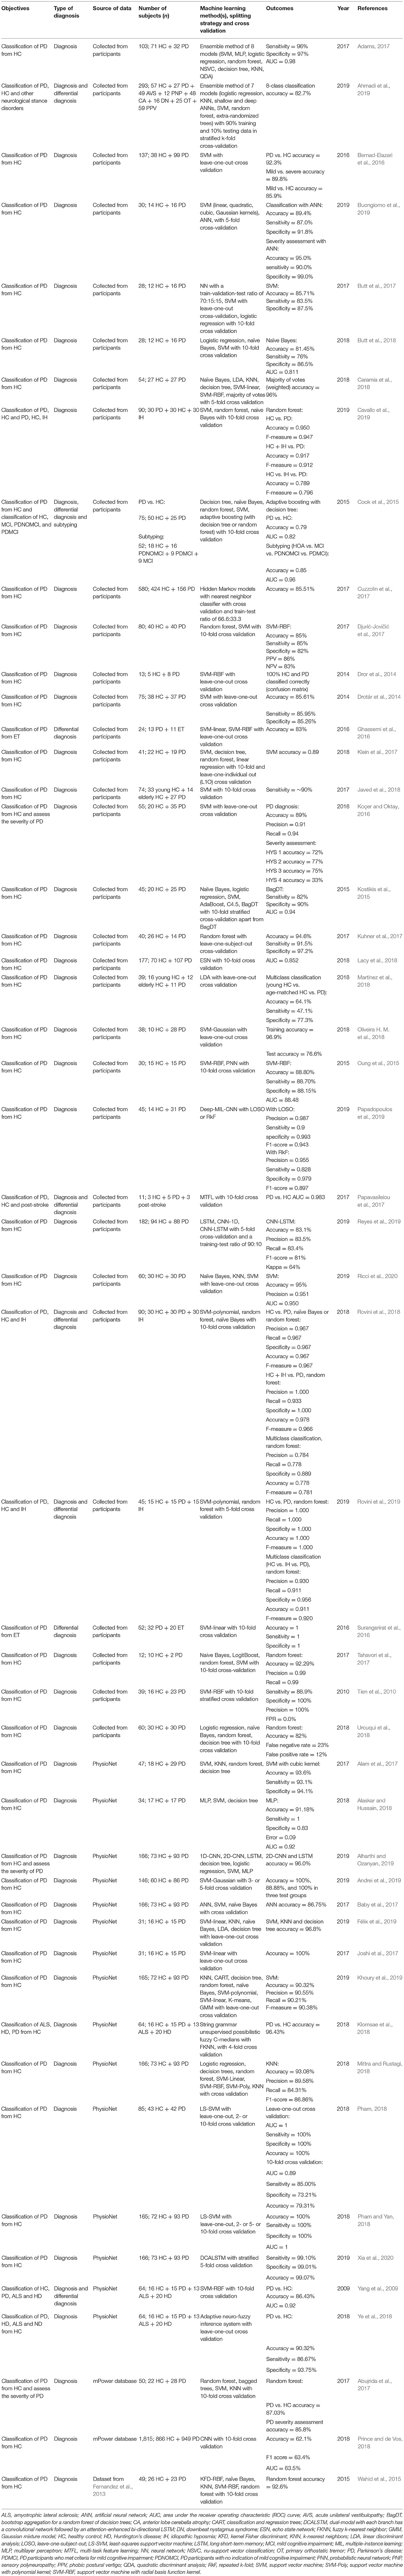
Table 5. Studies that applied machine learning models to movement data to diagnose PD (n = 51).
MRI (n = 36)
Average accuracy of the 32 studies that used accuracy to evaluate the performance of machine learning models was 87.5 (8.0) %. In these studies, the lowest accuracy was 70.5% (Liu L. et al., 2016) and the highest accuracy was 100.0% (Cigdem et al., 2019; Figure 4A). Out of the 36 studies, the per-study highest accuracy was obtained with SVM in 21 studies (58.3%), with neural network in 8 studies (22.2%), with discriminant analysis in 3 studies (8.3%), with regression in 2 studies (5.6%), and with ensemble learning in 1 study (2.8%). One study (2.8%) obtained the highest per-study accuracy using models that do not belong to any of the given categories (Figure 4B). In 8 of 36 studies, neural networks were directly applied to MRI data, while the remaining studies used machine learning models to learn from extracted features, e.g., cortical thickness and volume of brain regions, to diagnose PD.
Out of 17 studies that used MRI data from the PPMI database, 16 used accuracy to evaluate model performance and the average accuracy was 87.9 (8.0) %. The lowest and highest accuracies were 70.5 and 99.9%, respectively (Table 6). In 16 out of 19 studies that acquired MRI data from human participants, accuracy was used to evaluate classification performance and an average accuracy was 87.0 (8.1) % was achieved. The lowest reported accuracy was 76.2% and the highest reported accuracy was 100% (Table 6).
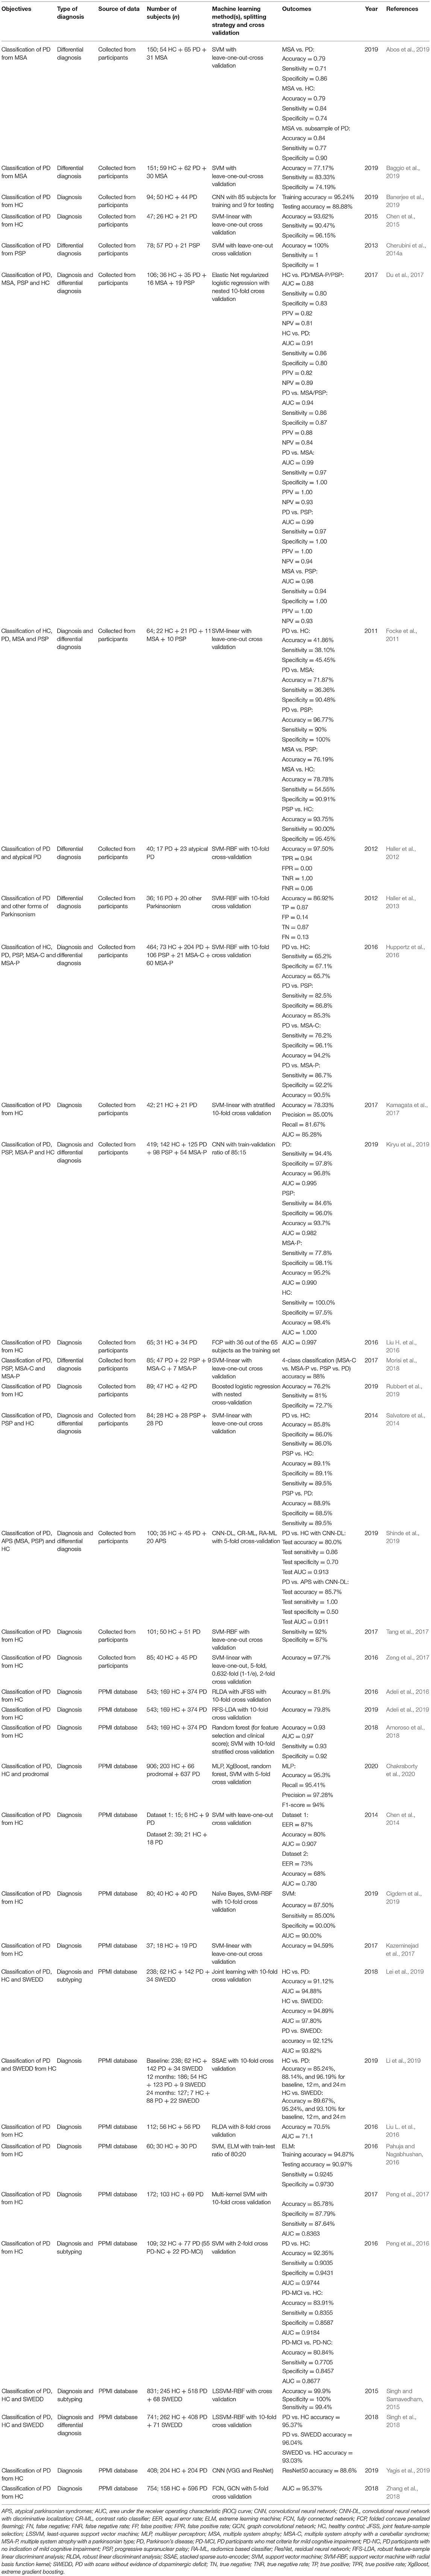
Table 6. Studies that applied machine learning models to MRI data to diagnose PD (n = 36).
Handwriting Patterns (n = 16)
Fifteen out of 16 studies used accuracy in model evaluation and the average accuracy was 87.0 (6.3) % (Table 7). Among these studies, the lowest accuracy was 76.44% (Ali et al., 2019b) and the highest accuracy was 99.3% (Pereira et al., 2018; Figure 4A). The highest accuracy per-study was obtained with neural network in 6 studies (37.5%), with SVM in 5 studies (31.3%), with ensemble learning in 4 studies (25.0%), and with naïve Bayes in 1 study (6.3%; Figure 4B).
Table 7. Studies that applied machine learning models to handwritten patterns, SPECT, PET, CSF, other data types and combinations of data to diagnose PD (n = 67).
SPECT (n = 14)
Average accuracy of 12 out of 14 studies that used accuracy to measure the performance of machine learning models was 94.4 (4.2) % (Table 7). The lowest reported accuracy was 83.2% (Hsu et al., 2019) and 97.9% (Oliveira F. et al., 2018; Figure 4A). SVM led to the highest per-study accuracy in 10 out of 14 studies (71.4%). The highest per-study accuracy was obtained with neural networks in 3 studies (21.4%) and with regression in 1 study (7.1%; Figure 4B).
PET (n = 4)
All 4 studies used sensitivity and specificity (Table 7) in model evaluation while 3 used accuracy. Average accuracy of the 3 studies was 85.6 (6.6) %, with a lowest accuracy of 78.16% (Segovia et al., 2015) and a highest accuracy of 90.72% (Wu et al., 2019; Figure 4A). Half of the 4 studies (50.0%) obtained the highest per-study accuracy with SVM (Segovia et al., 2015; Wu et al., 2019) and the other half (50.0%) with neural networks (Figure 4B).
CSF (n = 5)
All 5 studies used AUC, instead of accuracy, to evaluate machine learning models (Table 7). The average AUC was 0.8 (0.1), the lowest AUC was 0.6825 (Maass et al., 2020) and the highest AUC was 0.839 (Maass et al., 2018), respectively. Two studies obtained the highest per-study AUC with ensemble learning, 2 studies with SVM and 1 study with regression (Figure 4B).
Other Types of Data (n = 10)
Only 5 studies used accuracy to measure the performance of machine learning models (Table 7). An average accuracy of 91.9 (6.4) % was obtained, with a lowest accuracy of 84.85% (Shi et al., 2018) and a highest accuracy of 100% (Nuvoli et al., 2019; Figure 4A). Out of the 10 studies, 5 (50%) used SVM to achieve the per-study highest accuracy, 3 (30%) used ensemble learning, 1 (10%) used decision trees and 1 (10%) used machine learning models that do not belong to any given categories (Figure 4B).
Combination of More Than One Data Type (n = 18)
Out of the 18 studies that used more than one type of data, 15 used accuracy in model evaluation (Table 7). An average accuracy of 92.6 (6.1) % was obtained, and the lowest and highest accuracy among the 15 studies was 82.0% (Prince et al., 2019) and 100.0% (Cherubini et al., 2014b), respectively (Figure 4A). The per-study highest accuracy was achieved with ensemble learning in 6 studies (33.3%), with neural network in 5 studies (27.8%), with SVM in 4 studies (22.2%), with regression in 1 (5.6%) study and with nearest neighbor (5.6%) in 1 study. One study (5.6%) used machine learning models that do not belong to any given categories to obtain the highest per-study accuracy (Figure 4B).
Discussion
Principal Findings
In this review, we present results from published studies that applied machine learning to the diagnosis and differential diagnosis of PD. Since the number of included papers was relatively large, we focused on a high-level summary rather than a detailed description of methodology and direct comparison of outcomes of individual studies. We also provide an overview of sample size, data source and data type, for a more in-depth understanding of methodological differences across studies and their outcomes. Furthermore, we assessed (a) how large the participant pool/dataset was, (b) to what extent new data (i.e., unpublished, raw data acquired from locally recruited human participants) were collected and used, (c) the feasibility of machine learning and the possibility of introducing new biomarkers in the diagnosis of PD. Overall, methodology studies that proposed and tested novel technical approaches (e.g., machine learning and deep learning models, data acquisition devices, and feature extraction algorithms) have repetitively shown that features extracted from data modalities including voice recordings and handwritten patterns could lead to high patient-level diagnostic performance, while facilitating accessible and non-invasive data acquisition. Nevertheless, only a small number of studies further validated these technical approaches in clinical settings using local human participants recruited specifically for these studies, indicating a gap between model development and their clinical applications.
A per-study diagnostic accuracy above chance levels was achieved in all studies that used accuracy in model evaluation (Figure 4A). Apart from studies using CSF data that measured model performance with AUC, classification accuracy associated with 8 other data types ranged between 85.6% (PET) and 94.4% (SPECT), with an average of 89.9 (3.0) %. Therefore, although the small number of studies of some data types may not allow for a generalizable prediction of how well these data types can help us differentiate PD from HC or atypical Parkinsonian disorders, the application of machine learning to a variety of data types led to high accuracy in the diagnosis of PD. In addition, an accuracy significantly above chance levels was achieved in all machine learning models (Supplementary Table 1), while SVM, neural networks and ensemble learning were among the most popular model choices, all yielding great applicability to a variety of data modalities. In the meantime, when compared with other models, they led to the per-study highest classification accuracy in >50% of all cases (50.7, 51.9, and 52.3%, respectively; Supplementary Table 1). Despite the high diagnostic accuracy and performance reported, in a number of studies, data splitting strategies and the use of cross validation were not specified. For data modalities such as 3D MRI scans, when 2D slices are extracted from 3D volumes, multiple slices could be generated for one subject. Having data from the same subject across training, validation and tests sets can lead to a biased data split (Wen et al., 2020), causing data leakage and overestimation of model performance, thus compromising reproducibility of published results.
As previously discussed (Belić et al., 2019), although satisfactory diagnostic outcomes could be achieved, sample size in few studies was extremely small (<15 subjects). The application of some machine learning models, especially neural networks, typically rely on a large dataset. Nevertheless, collecting data from a large pool of participants remains challenging in clinical studies, and data generated are commonly of high dimensionality and small sample size (Vabalas et al., 2019). To address this challenge, one solution is to combine data from a local cohort with public repositories including PPMI, UCI machine learning repository, PhysioNet and many others, depending on the type of data that have been collected from the local cohort. Furthermore, when a great difference in group size is observed (i.e., class imbalance problem), labeling all samples after the majority class may lead to an undesired high accuracy. In this case, evaluating machine learning models with other metrics including precision, recall and F-1 score is recommended (Jeni et al., 2013).
Even though high diagnostic accuracy of PD has been achieved in clinical settings, machine learning approaches have also reached high accuracy as shown in the present study, while models including SVM and neural networks are particularly useful in (a) diagnosis of PD using data modalities that have been overlooked in clinical decision making (e.g., voice), and (b) identification of features of high relevance from these data. For example, the use of machine learning models with feature selection techniques allows for assessing the relative importance of features of a large feature space in order to select the most differentiating ones, which is conventionally challenging using manual approaches. For the discovery of novel markers allowing for non-invasive diagnostic options with relatively high accuracy, e.g., handwritten patterns, a small number of studies have been conducted, mostly using data from published databases. Given that these databases generally included handwritten patterns from a small number of diagnosed PD patients, sometimes under 15, it would be of great importance to validate the use of handwritten patterns in early diagnosis of PD in clinical studies of a larger scale. In the meantime, diagnosing PD using more than one data modality has led to promising results. Accordingly, supplying clinicians with non-motor data and machine learning approaches may support clinical decision making in patients with ambiguous symptom presentations, and/or improve diagnosis at an earlier stage.
An issue observed in many included studies was the insufficient or inaccurate description of methods or results, and some failed to provide accurate information of the number and type of subjects used (for example, methodology studies on early diagnosis of PD missing a table summarizing the characteristics of subjects, therefore it was challenging to understand the stage of PD in recruited patients), or how machine learning models were implemented, trained and tested. Infrequently, authors skipped basic information such as number of subjects and their medical conditions and referred to another publication. Although we attempted to list model hyperparameters and cross-validation strategies in the data extraction table, many included studies did not make this information available in the main text, leading to potential difficulties in replicating the results. Apart from these, rounding errors or inconsistent reporting of results also exist. Furthermore, although we treated the differentiation of PD from SWEDD as subtyping, there is ongoing controversy regarding whether it should be considered as differential diagnosis or subtyping (Lee et al., 2014; Erro et al., 2016; Chou, 2017; Kwon et al., 2018). Given these limitations, clinicians interested in adapting machine learning models or implementing diagnostic systems based on novel biomarkers are advised to interpret published results with care. Further, in this context we would like to stress the need for uniform reporting standards in studies using machine learning.
In both machine learning research and clinical settings, appropriately interpreting published results and methodologies is a necessary step toward an understanding of state-of-the-art methods. Therefore, vagueness in reporting not only compromises the interpretation of results but makes further methodological developments based on published research unnecessarily challenging. Moreover, for medical doctors interested in learning how machine learning methods could be applied in their domains, insufficient description of methods may lead to incorrect model implementation and failure of replication.
To enable efficient replication of published results, detailed descriptions of (a) model and architecture (hyperparameters, number and type of layers, layer-specific parameter settings, regularization strategies, activation functions), (b) implementation (programming language, machine learning and deep learning libraries used, model training and testing, metrics and model evaluation, validation strategy, optimization), and (c) version numbers of software/libraries used for both preprocessing and model implementation, are often desirable, as newer software versions may lead to differences in pre-processing and model implementation stages (Chepkoech et al., 2016).
Due to the use of imbalanced datasets in medical sciences, reporting model performance with a confusion matrix may give rise to a more comprehensive understanding of the model's ability to discriminate between PD and healthy controls. In the meantime, due to costs associated with acquisition of patient data, researchers often need to expand data collected from a local cohort using data sourced from publicly available databases or published studies. Nevertheless, unclear description of data acquisition and pre-processing protocols in some published studies may lead to challenges in the integration of newly acquired data and previously published data. Taken together, to facilitate early, refined diagnosis of PD and efficient application of novel machine learning approaches in a clinical setting, and to allow for improved reproducibility of studies on machine learning-based diagnosis and assessment of PD, a higher transparency in reporting data collection, pre-processing protocols, model implementation, and study outcomes is required.
Limitations
In the present study, we have excluded research articles in languages other than English and results published in the form of conference abstracts, posters, and talks. Despite the ongoing discussion of advantages and importance of including conference abstracts in systematic reviews and reviews (Scherer and Saldanha, 2019), conference abstracts often do not report sufficient key information which is why we had to exclude them. However, this may lead to a publication and result bias. In addition, since the aim of the present review is to assess and summarize published studies on the detection and early diagnosis of PD, we noticed that few large-scale, multi-centric studies on subtyping or/and severity assessment of PD were therefore excluded. Given the current challenges in subtyping, severity assessment and prognosis of PD, a further step toward a more systematic understanding of the application of machine learning to neurodegenerative diseases would be to review these studies.
Moreover, due to the high inter-study variance in the data source and presentation of results, it was challenging to directly compare outcomes associated with each type of model across studies, as some studies failed to indicate whether model performance was evaluated using a test set, and/or results given by models that did not yield the best per-study performance. Results of published studies were discussed and summarized based on data and machine learning models used, and for data modalities such as PET (n = 4) or CSF (n = 5), the number of studies were too small despite the high total number of studies included. Therefore, it was improbable to assess the general performance of machine learning techniques when PET or CSF data are used.
Conclusions
To the best of our knowledge, the present study is the first review which included results from all studies that applied machine learning methods to the diagnosis of PD. Here, we presented included studies in a high-level summary, providing access to information including (a) machine learning methods that have been used in the diagnosis of PD and associated outcomes, (b) types of clinical, behavioral and biometric data that could be used for rendering more accurate diagnoses, (c) potential biomarkers for assisting clinical decision making, and (d) other highly relevant information, including databases that could be used to enlarge and enrich smaller datasets. In summary, realization of machine learning-assisted diagnosis of PD yields high potential for a more systematic clinical decision-making system, while adaptation of novel biomarkers may give rise to easier access to PD diagnosis at an earlier stage. Machine learning approaches therefore have the potential to provide clinicians with additional tools to screen, detect or diagnose PD.
Data Availability Statement
The original contributions generated for the study are included in the article/Supplementary Material, further inquiries can be directed to the corresponding author/s.
Author Contributions
JM conceived and designed the study, collected the data, performed the analysis, and wrote the paper. CD and JF supervised the research. All authors contributed to the article and approved the submitted version.
Funding
JM was supported by the Québec Bio-Imaging Network Postdoctoral Fellowship (FRSQ—Réseaux de recherche thématiques; Dossier: 35450). JF was supported by FRQS (#283144), Parkinson Québec, Parkinson Canada (PPG-2020-0000000061), and CIHR (#PJT173514).
Conflict of Interest
The authors declare that the research was conducted in the absence of any commercial or financial relationships that could be construed as a potential conflict of interest.
Acknowledgments
We thank Dr. Antje Haehner for her comments on the manuscript. This work was supported by the Natural Sciences and Engineering Research Council of Canada (NSERC) and Québec Bio-Imaging Network.
Supplementary Material
The Supplementary Material for this article can be found online at: https://www.frontiersin.org/articles/10.3389/fnagi.2021.633752/full#supplementary-material
References
Abiyev, R. H., and Abizade, S. (2016). Diagnosing Parkinson's diseases using fuzzy neural system. Comput. Mathe. Methods Med. 2016:1267919. doi: 10.1155/2016/1267919
Abos, A., Baggio, H. C., Segura, B., Campabadal, A., Uribe, C., Giraldo, D. M., et al. (2019). Differentiation of multiple system atrophy from Parkinson's disease by structural connectivity derived from probabilistic tractography. Sci. Rep. 9:16488. doi: 10.1038/s41598-019-52829-8
Abujrida, H., Agu, E., and Pahlavan, K. (2017). “Smartphone-based gait assessment to infer Parkinson's disease severity using crowdsourced data,” in 2017 IEEE Healthcare Innovations and Point of Care Technologies (HI-POCT) (Bethesda, MD), 208–211. doi: 10.1109/HIC.2017.8227621
Adams, W. R. (2017). High-accuracy detection of early Parkinson's Disease using multiple characteristics of finger movement while typing. PLoS ONE 12:e0188226. doi: 10.1371/journal.pone.0188226
Adeli, E., Shi, F., An, L., Wee, C.-Y., Wu, G., Wang, T., et al. (2016). Joint feature-sample selection and robust diagnosis of Parkinson's disease from MRI data. NeuroImage 141, 206–219. doi: 10.1016/j.neuroimage.2016.05.054
Adeli, E., Thung, K.-H., An, L., Wu, G., Shi, F., Wang, T., et al. (2019). Semi-supervised discriminative classification robust to sample-outliers and feature-noises. IEEE Trans. Pattern Anal. Mach. Intell. 41, 515–522. doi: 10.1109/TPAMI.2018.2794470
Agarwal, A., Chandrayan, S., and Sahu, S. S. (2016). “Prediction of Parkinson's disease using speech signal with Extreme Learning Machine,” in 2016 International Conference on Electrical, Electronics, and Optimization Techniques (ICEEOT) (Chennai), 3776–3779. doi: 10.1109/ICEEOT.2016.7755419
Ahlrichs, C., and Lawo, M. (2013). Parkinson's disease motor symptoms in machine learning: a review. arXiv preprint arXiv:1312.3825. doi: 10.5121/hiij.2013.2401
Ahmadi, S. A., Vivar, G., Frei, J., Nowoshilow, S., Bardins, S., Brandt, T., et al. (2019). Towards computerized diagnosis of neurological stance disorders: data mining and machine learning of posturography and sway. J. Neurol. 266(Suppl 1), 108–117. doi: 10.1007/s00415-019-09458-y
Aich, S., Kim, H., younga, K., Hui, K. L., Al-Absi, A. A., and Sain, M. (2019). “A supervised machine learning approach using different feature selection techniques on voice datasets for prediction of Parkinson's disease,” in 2019 21st International Conference on Advanced Communication Technology (ICACT) (PyeongChang), 1116–1121. doi: 10.23919/ICACT.2019.8701961
Alam, M. N., Garg, A., Munia, T. T. K., Fazel-Rezai, R., and Tavakolian, K. (2017). Vertical ground reaction force marker for Parkinson's disease. PLoS ONE 12:e0175951. doi: 10.1371/journal.pone.0175951
Alaskar, H., and Hussain, A. (2018). “Prediction of Parkinson disease using gait signals,” in 2018 11th International Conference on Developments in eSystems Engineering (DeSE) (Cambridge), 23–26. doi: 10.1109/DeSE.2018.00011
Al-Fatlawi, A. H., Jabardi, M. H., and Ling, S. H. (2016). “Efficient diagnosis system for Parkinson's disease using deep belief network,” in 2016 IEEE Congress on Evolutionary Computation (CEC) (Vancouver, BC), 1324–1330. doi: 10.1109/CEC.2016.7743941
Alharthi, A. S., and Ozanyan, K. B. (2019). “Deep learning for ground reaction force data analysis: application to wide-area floor sensing,” in 2019 IEEE 28th International Symposium on Industrial Electronics (ISIE) (Vancouver, BC)„ 1401–1406. doi: 10.1109/ISIE.2019.8781511
Ali, L., Khan, S. U., Arshad, M., Ali, S., and Anwar, M. (2019a). “A multi-model framework for evaluating type of speech samples having complementary information about Parkinson's disease,” in 2019 International Conference on Electrical, Communication, and Computer Engineering (ICECCE) (Swat), 1–5. doi: 10.1109/ICECCE47252.2019.8940696
Ali, L., Zhu, C., Golilarz, N. A., Javeed, A., Zhou, M., and Liu, Y. (2019b). Reliable Parkinson's disease detection by analyzing handwritten drawings: construction of an unbiased cascaded learning system based on feature selection and adaptive boosting model. IEEE Access 7, 116480–116489. doi: 10.1109/ACCESS.2019.2932037
Ali, L., Zhu, C., Zhang, Z., and Liu, Y. (2019c). Automated detection of Parkinson's disease based on multiple types of sustained phonations using linear discriminant analysis and genetically optimized neural network. IEEE J. Transl. Eng. Health Med. 7, 1–10. doi: 10.1109/JTEHM.2019.2940900
Alqahtani, E. J., Alshamrani, F. H., Syed, H. F., and Olatunji, S. O. (2018). “Classification of Parkinson's disease using NNge classification algorithm,” in 2018 21st Saudi Computer Society National Computer Conference (NCC) (Riyadh), 1–7. doi: 10.1109/NCG.2018.8592989
Amoroso, N., La Rocca, M., Monaco, A., Bellotti, R., and Tangaro, S. (2018). Complex networks reveal early MRI markers of Parkinson's disease. Med. Image Anal. 48, 12–24. doi: 10.1016/j.media.2018.05.004
Anand, A., Haque, M. A., Alex, J. S. R., and Venkatesan, N. (2018). “Evaluation of machine learning and deep learning algorithms combined with dimentionality reduction techniques for classification of Parkinson's disease,” in 2018 IEEE International Symposium on Signal Processing and Information Technology (ISSPIT) (Louisville, KY), 342–347. doi: 10.1109/ISSPIT.2018.8642776
Andrei, A., Tău?an, A., and Ionescu, B. (2019). “Parkinson's disease detection from gait patterns,” in 2019 E-Health and Bioengineering Conference (EHB) (Iasi), 1–4. doi: 10.1109/EHB47216.2019.8969942
Baby, M. S., Saji, A. J., and Kumar, C. S. (2017). “Parkinsons disease classification using wavelet transform based feature extraction of gait data,” in 2017 International Conference on Circuit, Power and Computing Technologies (ICCPCT) (Kollam), 1–6. doi: 10.1109/ICCPCT.2017.8074230
Baggio, H. C., Abos, A., Segura, B., Campabadal, A., Uribe, C., Giraldo, D. M., et al. (2019). Cerebellar resting-state functional connectivity in Parkinson's disease and multiple system atrophy: characterization of abnormalities and potential for differential diagnosis at the single-patient level. NeuroImage. Clin. 22:101720. doi: 10.1016/j.nicl.2019.101720
Bakar, Z. A., Ispawi, D. I., Ibrahim, N. F., and Tahir, N. M. (2012). “Classification of Parkinson's disease based on Multilayer Perceptrons (MLPs) neural network and ANOVA as a feature extraction,” in 2012 IEEE 8th International Colloquium on Signal Processing and its Applications) (Malacca), 63–67. doi: 10.1109/CSPA.2012.6194692
Banerjee, M., Chakraborty, R., Archer, D., Vaillancourt, D., and Vemuri, B. C. (2019). “DMR-CNN: a CNN tailored For DMR scans with applications to PD classification,” in 2019 IEEE 16th International Symposium on Biomedical Imaging (ISBI 2019) (Venice), 388–391. doi: 10.1109/ISBI.2019.8759558
Belić, M., Bobić, V., BadŽa, M., Šolaja, N., Ã?urić-Jovičić, M., and Kostić, V. S. (2019). Artificial intelligence for assisting diagnostics and assessment of Parkinson's disease–a review. Clin. Neurol. Neurosurg. 184:105442. doi: 10.1016/j.clineuro.2019.105442
Benba, A., Jilbab, A., and Hammouch, A. (2016a). Discriminating between patients with Parkinson's and neurological diseases using cepstral analysis. IEEE Trans. Neural Syst. Rehab. Eng. 24, 1100–1108. doi: 10.1109/TNSRE.2016.2533582
Benba, A., Jilbab, A., Hammouch, A., and Sandabad, S. (2016b). “Using RASTA-PLP for discriminating between different neurological diseases,” in 2016 International Conference on Electrical and Information Technologies (ICEIT) (Tangiers), 406–409. doi: 10.1109/EITech.2016.7519630
Bernad-Elazari, H., Herman, T., Mirelman, A., Gazit, E., Giladi, N., and Hausdorff, J. M. (2016). Objective characterization of daily living transitions in patients with Parkinson's disease using a single body-fixed sensor. J. Neurol. 263, 1544–1551. doi: 10.1007/s00415-016-8164-6
Bhati, S., Velazquez, L. M., Villalba, J., and Dehak, N. (2019). “LSTM siamese network for Parkinson's disease detection from speech,” in 2019 IEEE Global Conference on Signal and Information Processing (GlobalSIP) (Ottawa, ON), 1–5. doi: 10.1109/GlobalSIP45357.2019.8969430
Bot, B. M., Suver, C., Neto, E. C., Kellen, M., Klein, A., Bare, C., et al. (2016). The mPower study, Parkinson disease mobile data collected using ResearchKit. Sci. Data 3, 1–9. doi: 10.1038/sdata.2016.11
Braak, H., Del Tredici, K., Rüb, U., De Vos, R. A., Steur, E. N. J., and Braak, E. (2003). Staging of brain pathology related to sporadic Parkinson's disease. Neurobiol. Aging 24, 197–211. doi: 10.1016/S0197-4580(02)00065-9
Buongiorno, D., Bortone, I., Cascarano, G. D., Trotta, G. F., Brunetti, A., and Bevilacqua, V. (2019). A low-cost vision system based on the analysis of motor features for recognition and severity rating of Parkinson's Disease. BMC Med. Inform. Decision Making 19(Suppl 9):243. doi: 10.1186/s12911-019-0987-5
Butt, A. H., Rovini, E., Dolciotti, C., Bongioanni, P., De Petris, G., and Cavallo, F. (2017). Leap motion evaluation for assessment of upper limb motor skills in Parkinson's disease. IEEE Int. Conf. Rehabil. Robot. 2017, 116–121. doi: 10.1109/ICORR.2017.8009232
Butt, A. H., Rovini, E., Dolciotti, C., De Petris, G., Bongioanni, P., Carboncini, M. C., et al. (2018). Objective and automatic classification of Parkinson disease with Leap Motion controller. Biomed. Eng. Online 17:168. doi: 10.1186/s12938-018-0600-7
Cai, Z., Gu, J., Wen, C., Zhao, D., Huang, C., Huang, H., et al. (2018). An intelligent Parkinson's disease diagnostic system based on a chaotic bacterial foraging optimization enhanced fuzzy KNN approach. Comp. Math. Methods Med. 2018:2396952. doi: 10.1155/2018/2396952
Caramia, C., Torricelli, D., Schmid, M., Munoz-Gonzalez, A., Gonzalez-Vargas, J., Grandas, F., et al. (2018). IMU-based classification of Parkinson's disease from gait: a sensitivity analysis on sensor location and feature selection. IEEE J. Biomed. Health Inf. 22, 1765–1774. doi: 10.1109/JBHI.2018.2865218
Castillo-Barnes, D., Ramírez, J., Segovia, F., Martínez-Murcia, F. J., Salas-Gonzalez, D., and Górriz, J. M. (2018). Robust ensemble classification methodology for I123-Ioflupane SPECT images and multiple heterogeneous biomarkers in the diagnosis of Parkinson's disease. Front. Neuroinf. 12:53. doi: 10.3389/fninf.2018.00053
Cavallo, F., Moschetti, A., Esposito, D., Maremmani, C., and Rovini, E. (2019). Upper limb motor pre-clinical assessment in Parkinson's disease using machine learning. Parkinsonism Relat. Disord. 63, 111–116. doi: 10.1016/j.parkreldis.2019.02.028
Celik, E., and Omurca, S. I. (2019). “Improving Parkinson's disease diagnosis with machine learning methods,” in 2019 Scientific Meeting on Electrical-Electronics & Biomedical Engineering and Computer Science (EBBT) (Istanbul), 1–4. doi: 10.1109/EBBT.2019.8742057
Chakraborty, S., Aich, S., and Kim, H.-C. (2020). 3D textural, morphological and statistical analysis of voxel of interests in 3T MRI scans for the detection of Parkinson's disease using artificial neural networks. Healthcare 8:E34. doi: 10.3390/healthcare8010034
Challa, K. N. R., Pagolu, V. S., Panda, G., and Majhi, B. (2016). “An improved approach for prediction of Parkinson's disease using machine learning techniques,” in 2016 International Conference on Signal Processing, Communication, Power and Embedded System (SCOPES) (Paralakhemundi), 1446–1451. doi: 10.1109/SCOPES.2016.7955679
Chen, Y., Storrs, J., Tan, L., Mazlack, L. J., Lee, J.-H., and Lu, L. J. (2014). Detecting brain structural changes as biomarker from magnetic resonance images using a local feature based SVM approach. J. Neurosci. Methods 221, 22–31. doi: 10.1016/j.jneumeth.2013.09.001
Chen, Y., Yang, W., Long, J., Zhang, Y., Feng, J., Li, Y., et al. (2015). Discriminative analysis of Parkinson's disease based on whole-brain functional connectivity. PLoS ONE 10:e0124153. doi: 10.1371/journal.pone.0124153
Chepkoech, J. L., Walhovd, K. B., Grydeland, H., Fjell, A. M., and Alzheimer's Disease Neuroimaging Initiative (2016). Effects of change in FreeSurfer version on classification accuracy of patients with Alzheimer's disease and mild cognitive impairment. Hum. Brain Mapp. 37, 1831–1841. doi: 10.1002/hbm.23139
Cherubini, A., Morelli, M., Nisticó, R., Salsone, M., Arabia, G., Vasta, R., et al. (2014a). Magnetic resonance support vector machine discriminates between Parkinson disease and progressive supranuclear palsy. Move. Disord. 29, 266–269. doi: 10.1002/mds.25737
Cherubini, A., Nisticó, R., Novellino, F., Salsone, M., Nigro, S., Donzuso, G., et al. (2014b). Magnetic resonance support vector machine discriminates essential tremor with rest tremor from tremor-dominant Parkinson disease. Move. Disord. 29, 1216–1219. doi: 10.1002/mds.25869
Choi, H., Ha, S., Im, H. J., Paek, S. H., and Lee, D. S. (2017). Refining diagnosis of Parkinson's disease with deep learning-based interpretation of dopamine transporter imaging. NeuroImage Clin. 16, 586–594. doi: 10.1016/j.nicl.2017.09.010
Chou, K. L. (2017). Diagnosis and Differential Diagnosis of Parkinson Disease. Waltham, MA: UpToDate.
Cibulka, M., Brodnanova, M., Grendar, M., Grofik, M., Kurca, E., Pilchova, I., et al. (2019). SNPs rs11240569, rs708727, and rs823156 in SLC41A1 do not discriminate between slovak patients with idiopathic parkinson's disease and healthy controls: statistics and machine-learning evidence. Int. J. Mol. Sci. 20:4688. doi: 10.3390/ijms20194688
Cigdem, O., Demirel, H., and Unay, D. (2019). “The performance of local-learning based clustering feature selection method on the diagnosis of Parkinson's disease using structural MRI,” in 2019 IEEE International Conference on Systems, Man and Cybernetics (SMC) (Bari), 1286–1291. doi: 10.1109/SMC.2019.8914611
Çimen, S., and Bolat, B. (2016). “Diagnosis of Parkinson's disease by using ANN,” in 2016 International Conference on Global Trends in Signal Processing, Information Computing and Communication (ICGTSPICC) (Jalgaon), 119–121. doi: 10.1109/ICGTSPICC.2016.7955281
Contreras-Vidal, J., and Stelmach, G. E. (1995). Effects of Parkinsonism on motor control. Life Sci. 58, 165–176. doi: 10.1016/0024-3205(95)02237-6
Cook, D. J., Schmitter-Edgecombe, M., and Dawadi, P. (2015). Analyzing activity behavior and movement in a naturalistic environment using smart home techniques. IEEE J. Biomed. Health Inf. 19, 1882–1892. doi: 10.1109/JBHI.2015.2461659
Cuzzolin, F., Sapienza, M., Esser, P., Saha, S., Franssen, M. M., Collett, J., et al. (2017). Metric learning for Parkinsonian identification from IMU gait measurements. Gait Posture 54, 127–132. doi: 10.1016/j.gaitpost.2017.02.012
Dash, S., Thulasiram, R., and Thulasiraman, P. (2017). “An enhanced chaos-based firefly model for Parkinson's disease diagnosis and classification,” in 2017 International Conference on Information Technology (ICIT) (Bhubaneswar), 159–164. doi: 10.1109/ICIT.2017.43
Dastjerd, N. K., Sert, O. C., Ozyer, T., and Alhajj, R. (2019). Fuzzy classification methods based diagnosis of Parkinson's disease from speech test cases. Curr. Aging Sci. 12, 100–120. doi: 10.2174/1874609812666190625140311
de Souza, J. W. M., Alves, S. S. A., Rebouças, E. d,.S, Almeida, J. S., and Rebouças Filho, P.P. (2018). A new approach to diagnose Parkinson's disease using a structural cooccurrence matrix for a similarity analysis. Comput. Intell. Neurosci. 2018:7613282. doi: 10.1155/2018/7613282
Dhami, D. S., Soni, A., Page, D., and Natarajan, S. (2017). Identifying Parkinson's patients: a functional gradient boosting approach. Artif. Intell. Med. Conf. Artif. Intell. Med. 10259, 332–337. doi: 10.1007/978-3-319-59758-4_39
Dinesh, A., and He, J. (2017). “Using machine learning to diagnose Parkinson's disease from voice recordings,” in 2017 IEEE MIT Undergraduate Research Technology Conference (URTC) (Cambridge, MA), 1–4. doi: 10.1109/URTC.2017.8284216
Dinov, I. D., Heavner, B., Tang, M., Glusman, G., Chard, K., Darcy, M., et al. (2016). Predictive big data analytics: a study of parkinson's disease using large, complex, heterogeneous, incongruent, multi-source and incomplete observations. PLoS ONE 11:e0157077. doi: 10.1371/journal.pone.0157077
Djurić-Jovičić, M., Belić, M., Stanković, I., Radovanović, S., and Kostić, V. S. (2017). Selection of gait parameters for differential diagnostics of patients with de novo Parkinson's disease. Neurol. Res. 39, 853–861. doi: 10.1080/01616412.2017.1348690
Dorsey, E. R., Elbaz, A., Nichols, E., Abd-Allah, F., Abdelalim, A., Adsuar, J. C., et al. (2018). Global, regional, and national burden of Parkinson's disease, 1990–2016: a systematic analysis for the Global Burden of Disease Study 2016. Lancet Neurol. 17, 939–953. doi: 10.1016/S1474-4422(18)30295-3
Dos Santos, M. C. T., Scheller, D., Schulte, C., Mesa, I. R., Colman, P., Bujac, S. R., et al. (2018). Evaluation of cerebrospinal fluid proteins as potential biomarkers for early stage Parkinson's disease diagnosis. PLoS ONE 13:e0206536. doi: 10.1371/journal.pone.0206536
Dror, B., Yanai, E., Frid, A., Peleg, N., Goldenthal, N., Schlesinger, I., et al. (2014). “Automatic assessment of Parkinson's disease from natural hands movements using 3D depth sensor,” in 2014 IEEE 28th Convention of Electrical & Electronics Engineers in Israel (IEEEI) (Eilat), 1–5. doi: 10.1109/EEEI.2014.7005763
Drotár, P., Mekyska, J., Rektorová, I., Masarová, L., Smékal, Z., and Faundez-Zanuy, M. (2014). Analysis of in-air movement in handwriting: a novel marker for Parkinson's disease. Comp. Methods Progr. Biomed. 117, 405–411. doi: 10.1016/j.cmpb.2014.08.007
Drotár, P., Mekyska, J., Rektorová, I., Masarová, L., Smékal, Z., and Faundez-Zanuy, M. (2015). Decision support framework for Parkinson's disease based on novel handwriting markers. IEEE Trans. Neural Syst. Rehabil. Eng. 23, 508–516. doi: 10.1109/TNSRE.2014.2359997
Drotár, P., Mekyska, J., Rektorová, I., Masarová, L., Smékal, Z., and Faundez-Zanuy, M. (2016). Evaluation of handwriting kinematics and pressure for differential diagnosis of Parkinson's disease. Artif. Intell. Med. 67, 39–46. doi: 10.1016/j.artmed.2016.01.004
Du, G., Lewis, M. M., Kanekar, S., Sterling, N. W., He, L., Kong, L., et al. (2017). Combined Diffusion tensor imaging and apparent transverse relaxation rate differentiate Parkinson disease and atypical Parkinsonism. Am. J. Neuroradiol. 38, 966–972. doi: 10.3174/ajnr.A5136
Dua, D., and Graff, C. (2018). UCI Machine Learning Repository. Irvine, CA: University of California, School of Information and Computer Science.
Erdogdu Sakar, B., Serbes, G., and Sakar, C. O. (2017). Analyzing the effectiveness of vocal features in early telediagnosis of Parkinson's disease. PLoS ONE 12:e0182428. doi: 10.1371/journal.pone.0182428
Erro, R., Schneider, S. A., Stamelou, M., Quinn, N. P., and Bhatia, K. P. (2016). What do patients with scans without evidence of dopaminergic deficit (SWEDD) have? New evidence and continuing controversies. J. Neurol. Neurosurg. Psychiatry 87, 319–323. doi: 10.1136/jnnp-2014-310256
Félix, J. P., Vieira, F. H. T., Cardoso, Á. A., Ferreira, M. V. G., Franco, R. A. P., Ribeiro, M. A., et al. (2019). “A Parkinson's disease classification method: an approach using gait dynamics and detrended fluctuation analysis,” in 2019 IEEE Canadian Conference of Electrical and Computer Engineering (CCECE) (Edmonton, AB), 1–4. doi: 10.1109/CCECE.2019.8861759
Fernandes, C., Fonseca, L., Ferreira, F., Gago, M., Costa, L., Sousa, N., et al. (2018). “Artificial neural networks classification of patients with Parkinsonism based on gait,” in 2018 IEEE International Conference on Bioinformatics and Biomedicine (BIBM) (Madrid), 2024–2030. doi: 10.1109/BIBM.2018.8621466
Fernandez, K. M., Roemmich, R. T., Stegemöller, E. L., Amano, S., Thompson, A., Okun, M. S., et al. (2013). Gait initiation impairments in both Essential Tremor and Parkinson's disease. Gait Posture 38, 956–961. doi: 10.1016/j.gaitpost.2013.05.001
Focke, N. K., Helms, G., Scheewe, S., Pantel, P. M., Bachmann, C. G., Dechent, P., et al. (2011). Individual voxel-based subtype prediction can differentiate progressive supranuclear palsy from idiopathic Parkinson syndrome and healthy controls. Human Brain Mapp. 32, 1905–1915. doi: 10.1002/hbm.21161
Frid, A., Safra, E. J., Hazan, H., Lokey, L. L., Hilu, D., Manevitz, L., et al. (2014). “Computational diagnosis of Parkinson's disease directly from natural speech using machine learning techniques,” in 2014 IEEE International Conference on Software Science, Technology and Engineering (Ramat Gan), 50–53. doi: 10.1109/SWSTE.2014.17
Ghassemi, N. H., Marxreiter, F., Pasluosta, C. F., Kugler, P., Schlachetzki, J., Schramm, A., et al. (2016). Combined accelerometer and EMG analysis to differentiate essential tremor from Parkinson's disease. Annu. Int. Conf. IEEE Eng. Med. Biol. Soc. 2016, 672–675. doi: 10.1109/EMBC.2016.7590791
Glaab, E., Trezzi, J.-P., Greuel, A., Jäger, C., Hodak, Z., Drzezga, A., et al. (2019). Integrative analysis of blood metabolomics and PET brain neuroimaging data for Parkinson's disease. Neurobiol. Dis. 124, 555–562. doi: 10.1016/j.nbd.2019.01.003
Goldberger, A. L., Amaral, L. A., Glass, L., Hausdorff, J. M., Ivanov, P. C., Mark, R. G., et al. (2000). PhysioBank, PhysioToolkit, and PhysioNet: components of a new research resource for complex physiologic signals. Circulation 101, e215–e220. doi: 10.1161/01.CIR.101.23.e215
Gunduz, H. (2019). Deep learning-based parkinson's disease classification using vocal feature sets. IEEE Access 7, 115540–115551. doi: 10.1109/ACCESS.2019.2936564
Haller, S., Badoud, S., Nguyen, D., Barnaure, I., Montandon, M. L., Lovblad, K. O., et al. (2013). Differentiation between Parkinson disease and other forms of Parkinsonism using support vector machine analysis of susceptibility-weighted imaging (SWI): initial results. Eur. Radiol. 23, 12–19. doi: 10.1007/s00330-012-2579-y
Haller, S., Badoud, S., Nguyen, D., Garibotto, V., Lovblad, K. O., and Burkhard, P. R. (2012). Individual detection of patients with Parkinson disease using support vector machine analysis of diffusion tensor imaging data: initial results. Am. J. Neuroradiol. 33, 2123–2128. doi: 10.3174/ajnr.A3126
Haq, A. U., Li, J., Memon, M. H., Khan, J., Din, S. U., Ahad, I., et al. (2018). “Comparative analysis of the classification performance of machine learning classifiers and deep neural network classifier for prediction of Parkinson disease,” in 2018 15th International Computer Conference on Wavelet Active Media Technology and Information Processing (ICCWAMTIP) (Chengdu), 101–106.
Haq, A. U., Li, J. P., Memon, M. H., khan, J., Malik, A., Ahmad, T., et al. (2019). Feature selection based on L1-Norm support vector machine and effective recognition system for Parkinson's disease using voice recordings. IEEE Access 7, 37718–37734. doi: 10.1109/ACCESS.2019.2906350
Hariharan, M., Polat, K., and Sindhu, R. (2014). A new hybrid intelligent system for accurate detection of Parkinson's disease. Comput. Methods Programs Biomed. 113, 904–913. doi: 10.1016/j.cmpb.2014.01.004
Hirschauer, T. J., Adeli, H., and Buford, J. A. (2015). Computer-aided diagnosis of Parkinson's disease using enhanced probabilistic neural network. J. Med. Syst. 39:179. doi: 10.1007/s10916-015-0353-9
Hsu, S.-Y., Lin, H.-C., Chen, T.-B., Du, W.-C., Hsu, Y.-H., Wu, Y.-C., et al. (2019). Feasible classified models for Parkinson disease from (99m)Tc-TRODAT-1 SPECT imaging. Sensors 19:1740. doi: 10.3390/s19071740
Huertas-Fernández, I., García-Gómez, F. J., García-Solís, D., Benítez-Rivero, S., Marín-Oyaga, V. A., Jesús, S., et al. (2015). Machine learning models for the differential diagnosis of vascular parkinsonism and Parkinson's disease using [(123)I]FP-CIT SPECT. Eur. J. Nucl. Med. Mol. Imag. 42, 112–119. doi: 10.1007/s00259-014-2882-8
Huppertz, H.-J., Möller, L., Südmeyer, M., Hilker, R., Hattingen, E., Egger, K., et al. (2016). Differentiation of neurodegenerative parkinsonian syndromes by volumetric magnetic resonance imaging analysis and support vector machine classification. Mov. Disord. 31, 1506–1517. doi: 10.1002/mds.26715
I, K., Ulukaya, S., and Erdem, O. (2019). “Classification of Parkinson's disease using dynamic time warping,” in 2019 27th Telecommunications Forum (TELFOR) (Belgrade), 1–4
Illan, I. A., Gorrz, J. M., Ramirez, J., Segovia, F., Jimenez-Hoyuela, J. M., and Ortega Lozano, S. J. (2012). Automatic assistance to Parkinson's disease diagnosis in DaTSCAN SPECT imaging. Med. Phys. 39, 5971–5980. doi: 10.1118/1.4742055
Islam, M. S., Parvez, I., Hai, D., and Goswami, P. (2014). “Performance comparison of heterogeneous classifiers for detection of Parkinson's disease using voice disorder (dysphonia),” in 2014 International Conference on Informatics, Electronics & Vision (ICIEV) (Dhaka), 1–7. doi: 10.1109/ICIEV.2014.6850849
Jankovic, J. (2008). Parkinson's disease: clinical features and diagnosis. J. Neurol. Neurosurg. Psychiatry 79, 368–376. doi: 10.1136/jnnp.2007.131045
Javed, F., Thomas, I., and Memedi, M. (2018). A comparison of feature selection methods when using motion sensors data: a case study in Parkinson's disease. Annu. Int. Conf. IEEE Eng. Med. Biol. Soc. 2018, 5426–5429. doi: 10.1109/EMBC.2018.8513683
Jeni, L. A., Cohn, J. F., and De La Torre, F. (2013). “Facing imbalanced data–recommendations for the use of performance metrics,” in 2013 Humaine Association Conference on Affective Computing and Intelligent Interaction (Geneva: IEEE), 245–251. doi: 10.1109/ACII.2013.47
Ji, W., and Li, Y. (2012). Energy-based feature ranking for assessing the dysphonia measurements in Parkinson detection. IET Signal Proc. 6, 300–305. doi: 10.1049/iet-spr.2011.0186
Johnson, S. J., Diener, M. D., Kaltenboeck, A., Birnbaum, H. G., and Siderowf, A. D. (2013). An economic model of P arkinson's disease: implications for slowing progression in the United States. Move. Disord. 28, 319–326. doi: 10.1002/mds.25328
Joshi, D., Khajuria, A., and Joshi, P. (2017). An automatic non-invasive method for Parkinson's disease classification. Comput. Methods Programs Biomed. 145, 135–145. doi: 10.1016/j.cmpb.2017.04.007
Junior, S. B., Costa, V. G. T., Chen, S., and Guido, R. C. (2018). “U-healthcare system for pre-diagnosis of Parkinson's disease from voice signal,” in 2018 IEEE International Symposium on Multimedia (ISM) (Taichung), 271–274.
Kamagata, K., Zalesky, A., Hatano, T., Di Biase, M. A., El Samad, O., Saiki, S., et al. (2017). Connectome analysis with diffusion MRI in idiopathic Parkinson's disease: evaluation using multi-shell, multi-tissue, constrained spherical deconvolution. NeuroImage. Clin. 17, 518–529. doi: 10.1016/j.nicl.2017.11.007
Karapinar Senturk, Z. (2020). Early diagnosis of Parkinson's disease using machine learning algorithms. Med. Hypoth. 138:109603. doi: 10.1016/j.mehy.2020.109603
Kazeminejad, A., Golbabaei, S., and Soltanian-Zadeh, H. (2017). “Graph theoretical metrics and machine learning for diagnosis of Parkinson's disease using rs-fMRI,” in 2017 Artificial Intelligence and Signal Processing Conference (AISP) (Shiraz), 134–139. doi: 10.1109/AISP.2017.8324124
Khan, M. M., Mendes, A., and Chalup, S. K. (2018). Evolutionary Wavelet Neural Network ensembles for breast cancer and Parkinson's disease prediction. PLoS ONE 13:e0192192. doi: 10.1371/journal.pone.0192192
Khatamino, P., I, C., and Özyilmaz, L. (2018). “A deep learning-CNN based system for medical diagnosis: an application on Parkinson's disease handwriting drawings,” in 2018 6th International Conference on Control Engineering & Information Technology (CEIT) (Istanbul), 1–6. doi: 10.1109/CEIT.2018.8751879
Khoury, N., Attal, F., Amirat, Y., Oukhellou, L., and Mohammed, S. (2019). Data-driven based approach to aid Parkinson's disease diagnosis. Sensors 19:242. doi: 10.3390/s19020242
Kiryu, S., Yasaka, K., Akai, H., Nakata, Y., Sugomori, Y., Hara, S., et al. (2019). Deep learning to differentiate parkinsonian disorders separately using single midsagittal MR imaging: a proof of concept study. Eur. Radiol. 29, 6891–6899. doi: 10.1007/s00330-019-06327-0
Klein, Y., Djaldetti, R., Keller, Y., and Bachelet, I. (2017). Motor dysfunction and touch-slang in user interface data. Scientific reports 7:4702. doi: 10.1038/s41598-017-04893-1
Klomsae, A., Auephanwiriyakul, S., and Theera-Umpon, N. (2018). String grammar unsupervised possibilistic fuzzy C-medians for gait pattern classification in patients with neurodegenerative diseases. Comput. Intell. Neurosci. 2018:1869565. doi: 10.1155/2018/1869565
Koçer, A., and Oktay, A. B. (2016). Nintendo Wii assessment of Hoehn and Yahr score with Parkinson's disease tremor. Technol. Health Care 24, 185–191. doi: 10.3233/THC-151124
Kostikis, N., Hristu-Varsakelis, D., Arnaoutoglou, M., and Kotsavasiloglou, C. (2015). A smartphone-based tool for assessing Parkinsonian hand tremor. IEEE J. Biomed. Health Inf. 19, 1835–1842. doi: 10.1109/JBHI.2015.2471093
Kowal, S. L., Dall, T. M., Chakrabarti, R., Storm, M. V., and Jain, A. (2013). The current and projected economic burden of Parkinson's disease in the United States. Move. Disord. 28, 311–318. doi: 10.1002/mds.25292
Kraipeerapun, P., and Amornsamankul, S. (2015). “Using stacked generalization and complementary neural networks to predict Parkinson's disease,” in 2015 11th International Conference on Natural Computation (ICNC) (Zhangjiajie), 1290–1294. doi: 10.1109/ICNC.2015.7378178
Kugler, P., Jaremenko, C., Schlachetzki, J., Winkler, J., Klucken, J., and Eskofier, B. (2013). Automatic recognition of Parkinson's disease using surface electromyography during standardized gait tests. Annu. Int. Conf. IEEE Eng. Med. Biol. Soc. 2013, 5781–5784. doi: 10.1109/EMBC.2013.6610865
Kuhner, A., Schubert, T., Cenciarini, M., Wiesmeier, I. K., Coenen, V. A., Burgard, W., et al. (2017). Correlations between motor symptoms across different motor tasks, quantified via random forest feature classification in Parkinson's disease. Front. Neurol. 8:607. doi: 10.3389/fneur.2017.00607
Kuresan, H., Samiappan, D., and Masunda, S. (2019). Fusion of WPT and MFCC feature extraction in Parkinson's disease diagnosis. Technol. Health Care 27, 363–372. doi: 10.3233/THC-181306
Kwon, D.-Y., Kwon, Y., and Kim, J.-W. (2018). Quantitative analysis of finger and forearm movements in patients with off state early stage Parkinson's disease and scans without evidence of dopaminergic deficit (SWEDD). Parkinsonism Related Disord. 57, 33–38. doi: 10.1016/j.parkreldis.2018.07.012
Lacy, S. E., Smith, S. L., and Lones, M. A. (2018). Using echo state networks for classification: A case study in Parkinson's disease diagnosis. Artif. Intell. Med. 86, 53–59. doi: 10.1016/j.artmed.2018.02.002
Lee, M. J., Kim, S. L., Lyoo, C. H., and Lee, M. S. (2014). Kinematic analysis in patients with Parkinson's disease and SWEDD. J. Parkinsons Dis. 4, 421–430. doi: 10.3233/JPD-130233
Lei, H., Huang, Z., Zhou, F., Elazab, A., Tan, E.-L., Li, H., et al. (2019). Parkinson's disease diagnosis via joint learning from multiple modalities and relations. IEEE J. Biomed. Health Inf. 23, 1437–1449. doi: 10.1109/JBHI.2018.2868420
Lewitt, P. A., Li, J., Lu, M., Beach, T. G., Adler, C. H., Guo, L., et al. (2013). 3-hydroxykynurenine and other Parkinson's disease biomarkers discovered by metabolomic analysis. Move. Disord. 28, 1653–1660. doi: 10.1002/mds.25555
Li, Q., Chen, H., Huang, H., Zhao, X., Cai, Z., Tong, C., et al. (2017). An enhanced grey wolf optimization based feature selection wrapped kernel extreme learning machine for medical diagnosis. Comput. Math. Methods Med. 2017:9512741. doi: 10.1155/2017/9512741
Li, S., Lei, H., Zhou, F., Gardezi, J., and Lei, B. (2019). “Longitudinal and Multi-modal Data Learning for Parkinson's Disease Diagnosis via Stacked Sparse Auto-encoder,” in 2019 IEEE 16th International Symposium on Biomedical Imaging (ISBI 2019) (Venice), 384–387. doi: 10.1109/ISBI.2019.8759385
Liu, H., Du, G., Zhang, L., Lewis, M. M., Wang, X., Yao, T., et al. (2016). Folded concave penalized learning in identifying multimodal MRI marker for Parkinson's disease. J. Neurosci. Methods 268, 1–6. doi: 10.1016/j.jneumeth.2016.04.016
Liu, L., Wang, Q., Adeli, E., Zhang, L., Zhang, H., and Shen, D. (2016). Feature selection based on iterative canonical correlation analysis for automatic diagnosis of Parkinson's disease. Med. Image Comput. Computer Assist. Interv. 9901, 1–8. doi: 10.1007/978-3-319-46723-8_1
Ma, C., Ouyang, J., Chen, H.-L., and Zhao, X.-H. (2014). An efficient diagnosis system for Parkinson's disease using kernel-based extreme learning machine with subtractive clustering features weighting approach. Computat. Math. Methods Med. 2014:985789. doi: 10.1155/2014/985789
Ma, H., Tan, T., Zhou, H., and Gao, T. (2016). “Support Vector Machine-recursive feature elimination for the diagnosis of Parkinson disease based on speech analysis,” in 2016 Seventh International Conference on Intelligent Control and Information Processing (ICICIP) (Siem Reap), 34–40. doi: 10.1109/ICICIP.2016.7885912
Maass, F., Michalke, B., Leha, A., Boerger, M., Zerr, I., Koch, J.-C., et al. (2018). Elemental fingerprint as a cerebrospinal fluid biomarker for the diagnosis of Parkinson's disease. J. Neurochemistry 145, 342–351. doi: 10.1111/jnc.14316
Maass, F., Michalke, B., Willkommen, D., Leha, A., Schulte, C., Tönges, L., et al. (2020). Elemental fingerprint: reassessment of a cerebrospinal fluid biomarker for Parkinson's disease. Neurobiol. Dis. 134:104677. doi: 10.1016/j.nbd.2019.104677
Mabrouk, R., Chikhaoui, B., and Bentabet, L. (2019). Machine learning based classification using clinical and DaTSCAN SPECT imaging features: a study on Parkinson's disease and SWEDD. IEEE Trans. Rad. Plasma Med. Sci. 3, 170–177. doi: 10.1109/TRPMS.2018.2877754
Mandal, I., and Sairam, N. (2013). Accurate telemonitoring of Parkinson's disease diagnosis using robust inference system. Int. J. Med. Informatics 82, 359–377. doi: 10.1016/j.ijmedinf.2012.10.006
Marar, S., Swain, D., Hiwarkar, V., Motwani, N., and Awari, A. (2018). “Predicting the occurrence of Parkinson's disease using various classification models,” in 2018 International Conference on Advanced Computation and Telecommunication (ICACAT) (Bhopal), 1–5. doi: 10.1109/ICACAT.2018.8933579
Marek, K., Jennings, D., Lasch, S., Siderowf, A., Tanner, C., Simuni, T., et al. (2011). The parkinson progression marker initiative (PPMI). Progress Neurobiol. 95, 629–635. doi: 10.1016/j.pneurobio.2011.09.005
Martínez, M., Villagra, F., Castellote, J. M., and Pastor, M. A. (2018). Kinematic and kinetic patterns related to free-walking in Parkinson's disease. Sensors 18:4224. doi: 10.3390/s18124224
Martinez-Murcia, F. J., Górriz, J. M., Ramírez, J., and Ortiz, A. (2018). Convolutional neural networks for neuroimaging in Parkinson's disease: is preprocessing needed? Int. J. Neural Syst. 28:1850035. doi: 10.1142/S0129065718500351
Memedi, M., Sadikov, A., Groznik, V., Žabkar, J., Možina, M., Bergquist, F., et al. (2015). Automatic spiral analysis for objective assessment of motor symptoms in Parkinson's disease. Sensors 15, 23727–23744. doi: 10.3390/s150923727
Mittra, Y., and Rustagi, V. (2018). “Classification of subjects with Parkinson's disease using gait data analysis,” in 2018 International Conference on Automation and Computational Engineering (ICACE) (Greater Noida), 84–89. doi: 10.1109/ICACE.2018.8687022
Moharkan, Z. A., Garg, H., Chodhury, T., and Kumar, P. (2017). “A classification based Parkinson detection system,” in 2017 International Conference On Smart Technologies For Smart Nation (SmartTechCon) (Bengaluru), 1509–1513. doi: 10.1109/SmartTechCon.2017.8358616
Moher, D., Liberati, A., Tetzlaff, J., and Altman, D. G. (2009). Preferred reporting items for systematic reviews and meta-analyses: the PRISMA statement. Ann. Inter. Med. 151, 264–269. doi: 10.7326/0003-4819-151-4-200908180-00135
Montaña, D., Campos-Roca, Y., and Pérez, C. J. (2018). A Diadochokinesis-based expert system considering articulatory features of plosive consonants for early detection of Parkinson's disease. Comp. Methods Programs Biomed. 154, 89–97. doi: 10.1016/j.cmpb.2017.11.010
Morisi, R., Manners, D. N., Gnecco, G., Lanconelli, N., Testa, C., Evangelisti, S., et al. (2018). Multi-class parkinsonian disorders classification with quantitative MR markers and graph-based features using support vector machines. Parkinsonism Relat. Disord. 47, 64–70. doi: 10.1016/j.parkreldis.2017.11.343
Mucha, J., Mekyska, J., Faundez-Zanuy, M., Lopez-De-Ipina, K., Zvoncak, V., Galaz, Z., et al. (2018). “Advanced Parkinson's disease dysgraphia analysis based on fractional derivatives of online handwriting,” in 2018 10th International Congress on Ultra Modern Telecommunications and Control Systems and Workshops (ICUMT) (Moscow), 1–6. doi: 10.1109/ICUMT.2018.8631265
Nicastro, N., Wegrzyk, J., Preti, M. G., Fleury, V., Van de Ville, D., Garibotto, V., et al. (2019). Classification of degenerative parkinsonism subtypes by support-vector-machine analysis and striatal (123)I-FP-CIT indices. J. Neurol. 266, 1771–1781. doi: 10.1007/s00415-019-09330-z
Nõmm, S., Bard,õš, K., Toomela, A., Medijainen, K., and Taba, P. (2018). “Detailed analysis of the Luria's alternating seriestests for Parkinson's disease diagnostics,” in 2018 17th IEEE International Conference on Machine Learning and Applications (ICMLA) (Orlando, FL), 1347–1352. doi: 10.1109/ICMLA.2018.00219
Nunes, A., Silva, G., Duque, C., Januário, C., Santana, I., Ambrósio, A. F., et al. (2019). Retinal texture biomarkers may help to discriminate between Alzheimer's, Parkinson's, and healthy controls. PLoS One 14:e0218826. doi: 10.1371/journal.pone.0218826
Nuvoli, S., Spanu, A., Fravolini, M. L., Bianconi, F., Cascianelli, S., Madeddu, G., et al. (2019). [(123)I]Metaiodobenzylguanidine (MIBG) cardiac scintigraphy and automated classification techniques in Parkinsonian disorders. Mol. Imaging Biol. 22, 703–710. doi: 10.1007/s11307-019-01406-6
Oliveira, F. P. M., and Castelo-Branco, M. (2015). Computer-aided diagnosis of Parkinson's disease based on [(123)I]FP-CIT SPECT binding potential images, using the voxels-as-features approach and support vector machines. J. Neural Eng. 12:026008. doi: 10.1088/1741-2560/12/2/026008
Oliveira, F. P. M., Faria, D. B., Costa, D. C., Castelo-Branco, M., and Tavares, J. M. R. S. (2018). Extraction, selection and comparison of features for an effective automated computer-aided diagnosis of Parkinson's disease based on [(123)I]FP-CIT SPECT images. Eur. J. Nucl. Med. Mol. Imaging 45, 1052–1062. doi: 10.1007/s00259-017-3918-7
Oliveira, H. M., Machado, A. R. P., and Andrade, A. O. (2018a). On the use of t-distributed stochastic neighbor embedding for data visualization and classification of individuals with Parkinson's disease. Comput. Math. Methods Med. 2018:8019232. doi: 10.1155/2018/8019232
Opara, J., Brola, W., Leonardi, M., and Błaszczyk, B. (2012). Quality of life in Parkinsons disease. J. Med. Life 5:375.
Oung, Q. W., Hariharan, M., Lee, H. L., Basah, S. N., Sarillee, M., and Lee, C. H. (2015). “Wearable multimodal sensors for evaluation of patients with Parkinson disease,” in 2015 IEEE International Conference on Control System, Computing and Engineering (ICCSCE) (Penang), 269–274. doi: 10.1109/ICCSCE.2015.7482196
Ozcift, A. (2012). SVM feature selection based rotation forest ensemble classifiers to improve computer-aided diagnosis of Parkinson disease. J. Med. Syst. 36, 2141–2147. doi: 10.1007/s10916-011-9678-1
Ozcift, A., and Gulten, A. (2011). Classifier ensemble construction with rotation forest to improve medical diagnosis performance of machine learning algorithms. Comp. Methods Progr. Biomed. 104, 443–451. doi: 10.1016/j.cmpb.2011.03.018
Pahuja, G., and Nagabhushan, T. N. (2016). “A novel GA-ELM approach for Parkinson's disease detection using brain structural T1-weighted MRI data,” in 2016 Second International Conference on Cognitive Computing and Information Processing (CCIP) (Mysuru), 1–6. doi: 10.1109/CCIP.2016.7802848
Palumbo, B., Fravolini, M. L., Buresta, T., Pompili, F., Forini, N., Nigro, P., et al. (2014). Diagnostic accuracy of Parkinson disease by support vector machine (SVM) analysis of 123I-FP-CIT brain SPECT data: implications of putaminal findings and age. Medicine 93:e228. doi: 10.1097/MD.0000000000000228
Papadopoulos, A., Kyritsis, K., Klingelhoefer, L., Bostanjopoulou, S., Chaudhuri, K. R., and Delopoulos, A. (2019). Detecting Parkinsonian tremor from IMU data collected in-the-wild using deep multiple-instance learning. IEEE J. Biomed. Health Inform. 24, 2559–2569. doi: 10.1109/JBHI.2019.2961748
Papavasileiou, I., Zhang, W., Wang, X., Bi, J., Zhang, L., and Han, S. (2017). “Classification of neurological gait disorders using multi-task feature learning,” in 2017 IEEE/ACM International Conference on Connected Health: Applications, Systems and Engineering Technologies (CHASE) (Philadelphia, PA), 195–204. doi: 10.1109/CHASE.2017.78
Peker, M. (2016). A decision support system to improve medical diagnosis using a combination of k-medoids clustering based attribute weighting and SVM. J. Med. Syst. 40:116. doi: 10.1007/s10916-016-0477-6
Peng, B., Wang, S., Zhou, Z., Liu, Y., Tong, B., Zhang, T., et al. (2017). A multilevel-ROI-features-based machine learning method for detection of morphometric biomarkers in Parkinson's disease. Neurosci. Lett. 651, 88–94. doi: 10.1016/j.neulet.2017.04.034
Peng, B., Zhou, Z., Geng, C., Tong, B., Zhou, Z., Zhang, T., et al. (2016). “Computer aided analysis of cognitive disorder in patients with Parkinsonism using machine learning method with multilevel ROI-based features,” in 2016 9th International Congress on Image and Signal Processing, BioMedical Engineering and Informatics (CISP-BMEI) (Datong), 1792–1796. doi: 10.1109/CISP-BMEI.2016.7853008
Pereira, C. R., Pereira, D. R., da Silva, F. A., Hook, C., Weber, S. A., Pereira, L. A., et al. (2015). “A step towards the automated diagnosis of parkinson's disease: Analyzing handwriting movements,” in 2015 IEEE 28th International Symposium on Computer-Based Medical Systems (Sao Carlos: IEEE), 171–176. doi: 10.1109/CBMS.2015.34
Pereira, C. R., Pereira, D. R., Rosa, G. H., Albuquerque, V. H. C., Weber, S. A. T., Hook, C., et al. (2018). Handwritten dynamics assessment through convolutional neural networks: An application to Parkinson's disease identification. Artif. Intell. Med. 87, 67–77. doi: 10.1016/j.artmed.2018.04.001
Pereira, C. R., Pereira, D. R., Silva, F. A., Masieiro, J. P., Weber, S. A. T., Hook, C., et al. (2016a). A new computer vision-based approach to aid the diagnosis of Parkinson's disease. Comp. Methods Progr. Biomed. 136, 79–88. doi: 10.1016/j.cmpb.2016.08.005
Pereira, C. R., Pereira, D. R., Weber, S. A., Hook, C., de Albuquerque, V. H. C., and Papa, J. P. (2019). A survey on computer-assisted Parkinson's disease diagnosis. Artif. Intell. Med. 95, 48–63. doi: 10.1016/j.artmed.2018.08.007
Pereira, C. R., Weber, S. A. T., Hook, C., Rosa, G. H., and Papa, J. P. (2016b). “Deep learning-aided Parkinson's disease diagnosis from handwritten dynamics,” in 2016 29th SIBGRAPI Conference on Graphics, Patterns and Images (SIBGRAPI) (São Paulo), 340–346. doi: 10.1109/SIBGRAPI.2016.054
Pham, H. N., Do, T. T. T., Chan, K. Y. J., Sen, G., Han, A. Y. K., Lim, P., et al. (2019). “Multimodal detection of Parkinson disease based on vocal and improved spiral test,” in 2019 International Conference on System Science and Engineering (ICSSE) (Dong Hoi), 279–284. doi: 10.1109/ICSSE.2019.8823309
Pham, T. D. (2018). Pattern analysis of computer keystroke time series in healthy control and early-stage Parkinson's disease subjects using fuzzy recurrence and scalable recurrence network features. J. Neurosci. Methods 307, 194–202. doi: 10.1016/j.jneumeth.2018.05.019
Pham, T. D., and Yan, H. (2018). Tensor decomposition of gait dynamics in Parkinson's disease. IEEE Trans. Bio-Med. Eng. 65, 1820–1827. doi: 10.1109/TBME.2017.2779884
Postuma, R. B., Berg, D., Stern, M., Poewe, W., Olanow, C. W., Oertel, W., et al. (2015). MDS clinical diagnostic criteria for Parkinson's disease. Move. Disord. 30, 1591–1601. doi: 10.1002/mds.26424
Prashanth, R., and Dutta Roy, S. (2018). Early detection of Parkinson's disease through patient questionnaire and predictive modelling. In. J. Med. Inform. 119, 75–87. doi: 10.1016/j.ijmedinf.2018.09.008
Prashanth, R., Dutta Roy, S., Mandal, P. K., and Ghosh, S. (2016). High-accuracy detection of early Parkinson's disease through multimodal features and machine learning. Int. J. Med. Inform. 90, 13–21. doi: 10.1016/j.ijmedinf.2016.03.001
Prashanth, R., Roy, S. D., Mandal, P. K., and Ghosh, S. (2014). “Parkinson's disease detection using olfactory loss and REM sleep disorder features,” in Annu. Int. Conf. IEEE Eng. Med. Biol. Soc. 2014, 5764–5767. doi: 10.1109/EMBC.2014.6944937
Prashanth, R., Roy, S. D., Mandal, P. K., and Ghosh, S. (2017). High-accuracy classification of Parkinson's disease through shape analysis and surface fitting in 123I-Ioflupane SPECT imaging. IEEE J. Biomed. Health Inform. 21, 794–802. doi: 10.1109/JBHI.2016.2547901
Prince, J., Andreotti, F., and Vos, M. D. (2019). Multi-source ensemble learning for the remote prediction of Parkinson's disease in the presence of source-wise missing data. IEEE Trans. Biomed. Eng. 66, 1402–1411. doi: 10.1109/TBME.2018.2873252
Prince, J., and de Vos, M. (2018). “A deep learning framework for the remote detection of Parkinson's disease using smart-phone sensor data,” in 2018 40th Annual International Conference of the IEEE Engineering in Medicine and Biology Society (EMBC) (Honolulu, HI), 3144–3147. doi: 10.1109/EMBC.2018.8512972
Ramdhani, R. A., Khojandi, A., Shylo, O., and Kopell, B. H. (2018). Optimizing clinical assessments in Parkinson's disease through the use of wearable sensors and data driven modeling. Front. Comput. Neurosci. 12:72. doi: 10.3389/fncom.2018.00072
Reyes, J. F., Montealegre, J. S., Castano, Y. J., Urcuqui, C., and Navarro, A. (2019). “LSTM and convolution networks exploration for Parkinson's diagnosis,” in 2019 IEEE Colombian Conference on Communications and Computing (COLCOM) (Barranquilla), 1–4. doi: 10.1109/ColComCon.2019.8809160
Ribeiro, L. C. F., Afonso, L. C. S., and Papa, J. P. (2019). Bag of samplings for computer-assisted Parkinson's disease diagnosis based on recurrent neural networks. Comp. Biol. Med. 115:103477. doi: 10.1016/j.compbiomed.2019.103477
Ricci, M., Lazzaro, G. D., Pisani, A., Mercuri, N. B., Giannini, F., and Saggio, G. (2020). Assessment of motor impairments in early untreated parkinson's disease patients: the wearable electronics impact. IEEE J. Biomed. Health Inform. 24, 120–130. doi: 10.1109/JBHI.2019.2903627
Rios-Urrego, C. D., Vásquez-Correa, J. C., Vargas-Bonilla, J. F., Nöth, E., Lopera, F., and Orozco-Arroyave, J. R. (2019). Analysis and evaluation of handwriting in patients with Parkinson's disease using kinematic, geometrical, and non-linear features. Comput. Methods Progr. Biomed. 173, 43–52. doi: 10.1016/j.cmpb.2019.03.005
Rovini, E., Maremmani, C., Moschetti, A., Esposito, D., and Cavallo, F. (2018). Comparative motor pre-clinical assessment in parkinson's disease using supervised machine learning approaches. Annals Biomed. Eng. 46, 2057–2068. doi: 10.1007/s10439-018-2104-9
Rovini, E., Moschetti, A., Fiorini, L., Esposito, D., Maremmani, C., and Cavallo, F. (2019). “Wearable sensors for prodromal motor assessment of parkinson's disease using supervised learning,” in 2019 41st Annual International Conference of the IEEE Engineering in Medicine and Biology Society (EMBC), 4318–4321. doi: 10.1109/EMBC.2019.8856804
Rubbert, C., Mathys, C., Jockwitz, C., Hartmann, C. J., Eickhoff, S. B., Hoffstaedter, F., et al. (2019). Machine-learning identifies Parkinson's disease patients based on resting-state between-network functional connectivity. Br. J. Radiol. 92:20180886. doi: 10.1259/bjr.20180886
Sakar, B. E., Isenkul, M. E., Sakar, C. O., Sertbas, A., Gurgen, F., Delil, S., et al. (2013). Collection and analysis of a Parkinson speech dataset with multiple types of sound recordings. IEEE J. Biomed. Health Inform. 17, 828–834. doi: 10.1109/JBHI.2013.2245674
Salvatore, C., Cerasa, A., Castiglioni, I., Gallivanone, F., Augimeri, A., Lopez, M., et al. (2014). Machine learning on brain MRI data for differential diagnosis of Parkinson's disease and progressive supranuclear palsy. J. Neurosci. Methods 222, 230–237. doi: 10.1016/j.jneumeth.2013.11.016
Sayaydeha, O. N. A., and Mohammad, M. F. (2019). “Diagnosis of the Parkinson disease using enhanced fuzzy min-max neural network and OneR attribute evaluation method,” in 2019 International Conference on Advanced Science and Engineering (ICOASE) (Zakho-Duhok), 64–69. doi: 10.1109/ICOASE.2019.8723870
Scherer, R. W., and Saldanha, I. J. (2019). How should systematic reviewers handle conference abstracts? A view from the trenches. Syst. Rev. 8:264. doi: 10.1186/s13643-019-1188-0
Segovia, F., Górriz, J. M., Ramírez, J., Levin, J., Schuberth, M., Brendel, M., et al. (2015). “Analysis of 18F-DMFP PET data using multikernel classification in order to assist the diagnosis of Parkinsonism,” in 2015 IEEE Nuclear Science Symposium and Medical Imaging Conference (NSS/MIC) (San Diego, CA), 1–4. doi: 10.1109/NSSMIC.2015.7582227
Segovia, F., Górriz, J. M., Ramírez, J., Martínez-Murcia, F. J., and Castillo-Barnes, D. (2019). Assisted diagnosis of Parkinsonism based on the striatal morphology. Int. J. Neural Syst. 29:1950011. doi: 10.1142/S0129065719500114
Shahsavari, M. K., Rashidi, H., and Bakhsh, H. R. (2016). “Efficient classification of Parkinson's disease using extreme learning machine and hybrid particle swarm optimization,” in 2016 4th International Conference on Control, Instrumentation, and Automation (ICCIA) (Qazvin), 148–154. doi: 10.1109/ICCIAutom.2016.7483152
Shamir, R., Klein, C., Amar, D., Vollstedt, E.-J., Bonin, M., Usenovic, M., et al. (2017). Analysis of blood-based gene expression in idiopathic Parkinson disease. Neurology 89, 1676–1683. doi: 10.1212/WNL.0000000000004516
Sheibani, R., Nikookar, E., and Alavi, S. E. (2019). An ensemble method for diagnosis of Parkinson's disease based on voice measurements. J. Med. Signals Sens. 9, 221–226. doi: 10.4103/jmss.JMSS_57_18
Shen, T., Jiang, J., Lin, W., Ge, J., Wu, P., Zhou, Y., et al. (2019). Use of overlapping group LASSO sparse deep belief network to discriminate Parkinson's disease and normal control. Front. Neurosci. 13:396. doi: 10.3389/fnins.2019.00396
Shi, J., Yan, M., Dong, Y., Zheng, X., Zhang, Q., and An, H. (2018). “Multiple kernel learning based classification of Parkinson's disease with multi-modal transcranial sonography,” in 2018 40th Annual International Conference of the IEEE Engineering in Medicine and Biology Society (EMBC) (Honolulu, HI), 61–64. doi: 10.1109/EMBC.2018.8512194
Shinde, S., Prasad, S., Saboo, Y., Kaushick, R., Saini, J., Pal, P. K., et al. (2019). Predictive markers for Parkinson's disease using deep neural nets on neuromelanin sensitive MRI. NeuroImage. Clin. 22:101748. doi: 10.1016/j.nicl.2019.101748
Singh, G., and Samavedham, L. (2015). Unsupervised learning based feature extraction for differential diagnosis of neurodegenerative diseases: a case study on early-stage diagnosis of Parkinson disease. J. Neurosci. Methods 256, 30–40. doi: 10.1016/j.jneumeth.2015.08.011
Singh, G., Samavedham, L., Lim, E. C.-H., Alzheimer's Disease Neuroimaging, I., and Parkinson Progression Marker, I. (2018). Determination of imaging biomarkers to decipher disease trajectories and differential diagnosis of neurodegenerative diseases (DIsease TreND). J. Neurosci. Methods 305, 105–116. doi: 10.1016/j.jneumeth.2018.05.009
Stoessel, D., Schulte, C., Teixeira Dos Santos, M. C., Scheller, D., Rebollo-Mesa, I., Deuschle, C., et al. (2018). Promising metabolite profiles in the plasma and CSF of early clinical Parkinson's disease. Front. Aging Neurosci. 10:51. doi: 10.3389/fnagi.2018.00051
Surangsrirat, D., Thanawattano, C., Pongthornseri, R., Dumnin, S., Anan, C., and Bhidayasiri, R. (2016). Support vector machine classification of Parkinson's disease and essential tremor subjects based on temporal fluctuation. Annu. Int. Conf. IEEE Eng. Med. Biol. Soc. 2016, 6389–6392. doi: 10.1109/EMBC.2016.7592190
Sztahó, D., Tulics, M. G., Vicsi, K., and Valálik, I. (2017). “Automatic estimation of severity of Parkinson's disease based on speech rhythm related features,” in 2017 8th IEEE International Conference on Cognitive Infocommunications (CogInfoCom) (Debrecen), 000011–000016. doi: 10.1109/CogInfoCom.2017.8268208
Sztahó, D., Valálik, I., and Vicsi, K. (2019). “Parkinson's disease severity estimation on Hungarian speech using various speech tasks,” in 2019 International Conference on Speech Technology and Human-Computer Dialogue (SpeD) (Timisoara), 1–6. doi: 10.1109/SPED.2019.8906277
Tagare, H. D., DeLorenzo, C., Chelikani, S., Saperstein, L., and Fulbright, R. K. (2017). Voxel-based logistic analysis of PPMI control and Parkinson's disease DaTscans. NeuroImage 152, 299–311. doi: 10.1016/j.neuroimage.2017.02.067
Tahavori, F., Stack, E., Agarwal, V., Burnett, M., Ashburn, A., Hoseinitabatabaei, S. A., et al. (2017). “Physical activity recognition of elderly people and people with parkinson's (PwP) during standard mobility tests using wearable sensors,” in 2017 International Smart Cities Conference (ISC2) (Wuxi), 1–4. doi: 10.1109/ISC2.2017.8090858
Taleb, C., Khachab, M., Mokbel, C., and Likforman-Sulem, L. (2019). “Visual representation of online handwriting time series for deep learning Parkinson's disease detection,” in 2019 International Conference on Document Analysis and Recognition Workshops (ICDARW) (Sydney, NSW), 25–30. doi: 10.1109/ICDARW.2019.50111
Tang, Y., Meng, L., Wan, C. M., Liu, Z. H., Liao, W. H., Yan, X. X., et al. (2017). Identifying the presence of Parkinson's disease using low-frequency fluctuations in BOLD signals. Neurosci. Lett. 645, 1–6. doi: 10.1016/j.neulet.2017.02.056
Taylor, J. C., and Fenner, J. W. (2017). Comparison of machine learning and semi-quantification algorithms for (I123)FP-CIT classification: the beginning of the end for semi-quantification? EJNMMI Phys. 4:29. doi: 10.1186/s40658-017-0196-1
Tien, I., Glaser, S. D., and Aminoff, M. J. (2010). “Characterization of gait abnormalities in Parkinson's disease using a wireless inertial sensor system,” in Annu. Int. Conf. IEEE Eng. Med. Biol. Soc. 2010, 3353–3356. doi: 10.1109/IEMBS.2010.5627904
Tracy, J. M., Özkanca, Y., Atkins, D. C., and Hosseini Ghomi, R. (2019). Investigating voice as a biomarker: deep phenotyping methods for early detection of Parkinson's disease. J. Biomed. Inform. 104:103362. doi: 10.1016/j.jbi.2019.103362
Tremblay, C., Martel, P. D., and Frasnelli, J. (2017). Trigeminal system in Parkinson's disease: a potential avenue to detect Parkinson-specific olfactory dysfunction. Parkinsonism Relat. Dis. 44, 85–90. doi: 10.1016/j.parkreldis.2017.09.010
Trezzi, J.-P., Galozzi, S., Jaeger, C., Barkovits, K., Brockmann, K., Maetzler, W., et al. (2017). Distinct metabolomic signature in cerebrospinal fluid in early parkinson's disease. Mov. Disord. 32, 1401–1408. doi: 10.1002/mds.27132
Tsanas, A., Little, M. A., McSharry, P. E., Spielman, J., and Ramig, L. O. (2012). Novel speech signal processing algorithms for high-accuracy classification of Parkinson's disease. IEEE Trans. Bio. Med. Eng. 59, 1264–1271. doi: 10.1109/TBME.2012.2183367
Tseng, P.-H., Cameron, I. G. M., Pari, G., Reynolds, J. N., Munoz, D. P., and Itti, L. (2013). High-throughput classification of clinical populations from natural viewing eye movements. J. Neurol. 260, 275–284. doi: 10.1007/s00415-012-6631-2
Tsuda, M., Asano, S., Kato, Y., Murai, K., and Miyazaki, M. (2019). Differential diagnosis of multiple system atrophy with predominant parkinsonism and Parkinson's disease using neural networks. J. Neurol. Sci. 401, 19–26. doi: 10.1016/j.jns.2019.04.014
Tysnes, O.-B., and Storstein, A. (2017). Epidemiology of Parkinson's disease. J. Neural Trans. 124, 901–905. doi: 10.1007/s00702-017-1686-y
Urcuqui, C., Castaño, Y., Delgado, J., Navarro, A., Diaz, J., Muñoz, B., et al. (2018). “Exploring Machine Learning to Analyze Parkinson's Disease Patients,” in 2018 14th International Conference on Semantics, Knowledge and Grids (SKG) (Guangzhou), 160–166. doi: 10.1109/SKG.2018.00029
Vabalas, A., Gowen, E., Poliakoff, E., and Casson, A. J. (2019). Machine learning algorithm validation with a limited sample size. PLoS ONE 14:e0224365. doi: 10.1371/journal.pone.0224365
Vaiciukynas, E., Verikas, A., Gelzinis, A., and Bacauskiene, M. (2017). Detecting Parkinson's disease from sustained phonation and speech signals. PLoS ONE 12:e0185613. doi: 10.1371/journal.pone.0185613
Vanegas, M. I., Ghilardi, M. F., Kelly, S. P., and Blangero, A. (2018). “Machine learning for EEG-based biomarkers in Parkinson's disease,” in 2018 IEEE International Conference on Bioinformatics and Biomedicine (BIBM) (Madrid), 2661–2665. doi: 10.1109/BIBM.2018.8621498
Váradi, C., Nehéz, K., Hornyák, O., Viskolcz, B., and Bones, J. (2019). Serum N-glycosylation in Parkinson's disease: a novel approach for potential alterations. Molecules 24:2220. doi: 10.3390/molecules24122220
Vásquez-Correa, J. C., Arias-Vergara, T., Orozco-Arroyave, J. R., Eskofier, B., Klucken, J., and Nöth, E. (2019). Multimodal assessment of parkinson's disease: a deep learning approach. IEEE J. Biomed. Health Inform. 23, 1618–1630. doi: 10.1109/JBHI.2018.2866873
Vlachostergiou, A., Tagaris, A., Stafylopatis, A., and Kollias, S. (2018). “Multi-task learning for predicting Parkinson's disease based on medical imaging information,” in 2018 25th IEEE International Conference on Image Processing (ICIP) (Athens), 2052–2056. doi: 10.1109/ICIP.2018.8451398
Wahid, F., Begg, R. K., Hass, C. J., Halgamuge, S., and Ackland, D. C. (2015). Classification of Parkinson's disease gait using spatial-temporal gait features. IEEE J. Biomed. Health Inform. 19, 1794–1802. doi: 10.1109/JBHI.2015.2450232
Wang, Z., Zhu, X., Adeli, E., Zhu, Y., Nie, F., Munsell, B., et al. (2017). Multi-modal classification of neurodegenerative disease by progressive graph-based transductive learning. Med Image Anal. 39, 218–230. doi: 10.1016/j.media.2017.05.003
Wen, J., Thibeau-Sutre, E., Diaz-Melo, M., Samper-González, J., Routier, A., Bottani, S., et al. (2020). Convolutional neural networks for classification of Alzheimer's disease: overview and reproducible evaluation. Med. Image Anal. 63:101694. doi: 10.1016/j.media.2020.101694
Wenzel, M., Milletari, F., Krüger, J., Lange, C., Schenk, M., Apostolova, I., et al. (2019). Automatic classification of dopamine transporter SPECT: deep convolutional neural networks can be trained to be robust with respect to variable image characteristics. Eur. J. Nuclear Med. Mol. Imaging 46, 2800–2811. doi: 10.1007/s00259-019-04502-5
Wodzinski, M., Skalski, A., Hemmerling, D., Orozco-Arroyave, J. R., and Nöth, E. (2019). “Deep learning approach to Parkinson's disease detection using voice recordings and convolutional neural network dedicated to image classification,” in 2019 41st Annual International Conference of the IEEE Engineering in Medicine and Biology Society (EMBC) (Berlin), 717–720. doi: 10.1109/EMBC.2019.8856972
Wu, Y., Chen, P., Yao, Y., Ye, X., Xiao, Y., Liao, L., et al. (2017). Dysphonic voice pattern analysis of patients in Parkinson's disease using minimum interclass probability risk feature selection and bagging ensemble learning methods. Comput. Math. Methods Med. 2017:4201984. doi: 10.1155/2017/4201984
Wu, Y., Jiang, J.-H., Chen, L., Lu, J.-Y., Ge, J.-J., Liu, F.-T., et al. (2019). Use of radiomic features and support vector machine to distinguish Parkinson's disease cases from normal controls. Ann. Transl. Med. 7:773. doi: 10.21037/atm.2019.11.26
Xia, Y., Yao, Z., Ye, Q., and Cheng, N. (2020). A dual-modal attention-enhanced deep learning network for quantification of Parkinson's disease characteristics. IEEE Trans. Neural Syst. Rehab. Eng. 28, 42–51. doi: 10.1109/TNSRE.2019.2946194
Yadav, G., Kumar, Y., and Sahoo, G. (2011). Predication of Parkinson's disease using data mining methods: a comparative analysis of tree, statistical, and support vector machine classifiers. Ind. J. Med. Sci. 65, 231–242. doi: 10.4103/0019-5359.107023
Yagis, E., Herrera, A. G. S. D., and Citi, L. (2019). “Generalization Performance of Deep Learning Models in Neurodegenerative Disease Classification,” in 2019 IEEE International Conference on Bioinformatics and Biomedicine (BIBM) (San Diego, CA), 1692–1698. doi: 10.1109/BIBM47256.2019.8983088
Yaman, O., Ertam, F., and Tuncer, T. (2020). Automated Parkinson's disease recognition based on statistical pooling method using acoustic features. Med. Hypoth. 135:109483. doi: 10.1016/j.mehy.2019.109483
Yang, J.-X., and Chen, L. (2017). Economic burden analysis of Parkinson's disease patients in China. Parkinson's Dis. 2017:8762939. doi: 10.1155/2017/8762939
Yang, M., Zheng, H., Wang, H., and McClean, S. (2009). “Feature selection and construction for the discrimination of neurodegenerative diseases based on gait analysis,” in 2009 3rd International Conference on Pervasive Computing Technologies for Healthcare (London), 1–7. doi: 10.4108/ICST.PERVASIVEHEALTH2009.6053
Yang, S., Zheng, F., Luo, X., Cai, S., Wu, Y., Liu, K., et al. (2014). Effective dysphonia detection using feature dimension reduction and kernel density estimation for patients with Parkinson's disease. PLoS ONE 9:e88825. doi: 10.1371/journal.pone.0088825
Ye, Q., Xia, Y., and Yao, Z. (2018). Classification of gait patterns in patients with neurodegenerative disease using adaptive neuro-fuzzy inference system. Computat. Math. Methods Med. 2018:9831252. doi: 10.1155/2018/9831252
Zeng, L.-L., Xie, L., Shen, H., Luo, Z., Fang, P., Hou, Y., et al. (2017). Differentiating patients with Parkinson's disease from normal controls using gray matter in the cerebellum. Cerebellum 16, 151–157. doi: 10.1007/s12311-016-0781-1
Zesiewicz, T. A., Sullivan, K. L., and Hauser, R. A. (2006). Nonmotor symptoms of Parkinson's disease. Expert Rev. Neurother. 6, 1811–1822. doi: 10.1586/14737175.6.12.1811
Zhang, X., He, L., Chen, K., Luo, Y., Zhou, J., and Wang, F. (2018). Multi-view graph convolutional network and its applications on neuroimage analysis for Parkinson's disease. Annu. Symp. Proc. 2018, 1147–1156.
Zhao, Y., Wu, P., Wang, J., Li, H., Navab, N., Yakushev, I., et al. (2019). “A 3D deep residual convolutional neural network for differential diagnosis of Parkinsonian syndromes on 18F-FDG PET images,” in 2019 41st Annual International Conference of the IEEE Engineering in Medicine and Biology Society (EMBC), 3531–3534. doi: 10.1109/EMBC.2019.8856747
Keywords: Parkinson's disease, machine learning, deep learning, diagnosis, differential diagnosis
Citation: Mei J, Desrosiers C and Frasnelli J (2021) Machine Learning for the Diagnosis of Parkinson's Disease: A Review of Literature. Front. Aging Neurosci. 13:633752. doi: 10.3389/fnagi.2021.633752
Received: 26 November 2020; Accepted: 22 March 2021;
Published: 06 May 2021.
Edited by:
Christian Gaser, Friedrich Schiller University Jena, GermanyReviewed by:
Erika Rovini, Sant'Anna School of Advanced Studies, ItalySilke Weber, Sao Paulo State University, Brazil
Copyright © 2021 Mei, Desrosiers and Frasnelli. This is an open-access article distributed under the terms of the Creative Commons Attribution License (CC BY). The use, distribution or reproduction in other forums is permitted, provided the original author(s) and the copyright owner(s) are credited and that the original publication in this journal is cited, in accordance with accepted academic practice. No use, distribution or reproduction is permitted which does not comply with these terms.
*Correspondence: Jie Mei, amllLm1laUB1cXRyLmNh