 Dona M. P. Jayakody1,2,3*
 Justin Wishart4
 Inge Stegeman5,6
 Robert Eikelboom1,2,7
 Thomas C. Moyle8
 Jessica M. Yiannos1
 Jack James Goodman-Simpson1
 Osvaldo P. Almeida3
- 1Ear Science Institute Australia, Subiaco, WA, Australia
- 2Ear Sciences Centre, Medical School, University of Western Australia, Perth, WA, Australia
- 3Centre for Health and Ageing, University of Western Australia, Perth, WA, Australia
- 4Department of Mathematics and Statistics, Faculty of Science and Engineering, Macquarie University, Sydney, NSW, Australia
- 5Department of Otorhinolaryngology, Head and Neck Surgery, University Medical Center Utrecht, Utrecht, Netherlands
- 6Brain Center Rudolf Magnus, University Medical Center Utrecht, Utrecht, Netherlands
- 7Department of Speech-Language Pathology and Audiology, Faculty of Humanities, University of Pretoria, Pretoria, South Africa
- 8Department of Physics, Faculty of Engineering, Mathematics and Sciences, University of Western Australia, Perth, WA, Australia
Objective: Age-related hearing loss is one of the leading causes of disability in older adults. This cross-sectional study investigated the association between untreated hearing loss, social (perception of quality and quantity of social network) and emotional loneliness (perception of limited emotional support), social isolation (size of the social network), social support (actual or perceived availability of resources from the social network) and psychological discomfort (depression, anxiety, and stress) in older adults.
Study Design: Cross-sectional study design.
Methods: A total of 202 community derived sample of volunteers, age range 40–89 years, mean age (M) = 65.3 ± 11.0 years were recruited. Of these 115 were females (M = 63.2 ± 12.0 years) and 87 were males (M = 68.2 ± 8.9 years). All participants completed a hearing assessment, social interaction and support questionnaire and a social and emotional loneliness questionnaire.
Results: Hearing loss significantly contributed to both moderate [P < 0.001, B (95% CI): 0.01 (0.99–1.02)] and intense levels [P < 0.001, 0.02 (1.00–1.04)] of emotional loneliness. Depression was significantly associated with satisfaction with social support [P < 0.001; −0.17 (−0.23 to −0.11), social interaction [P = 0.01; −0.07 (−0.12 to −0.01)], and moderate [P < 0.001; 0.31 (1.22–1.53)] and intense [P < 0.001; 0.29 (1.20–1.50)] levels of emotional loneliness and intense levels of social loneliness [P = 0.01; 0.12 (1.05–1.21)].
Conclusion: Untreated hearing loss significantly increases the odds of being emotionally lonely. Depression significantly contributes to social and emotional loneliness, satisfaction with social support and social loneliness. Given the higher prevalence of loneliness and psychological discomfort and their associations with untreated hearing loss, hearing-impaired older adults are at significant risk of developing loneliness and psychological discomfort. Therefore, hearing health professionals should be aware of the psychosocial burden that may accompany hearing loss, in order to provide appropriate advice and support.
Introduction
In 2019, 1 billion of the total world population was 60 years or older, which will increase to 2.1 billion by 2050 (World Health Organization [WHO], 2021a). As the number and proportion of adults aged 60 years and older are growing, factors related to these older adults’ health and wellbeing deserves attention. An individual’s social health depends on their capacity to establish meaningful relationships, adapt to social situations, and interact with social networks (Freak-Poli et al., 2021a). Therefore, we explore three distinct yet interconnected components of social health (Freak-Poli et al., 2021b): social isolation, loneliness, and social support.
Social Isolation, Loneliness, and Social Support
Social isolation and loneliness are descriptive terms that are often used interchangeably, although they refer to two distinct concepts. Social isolation is an objective and quantifiable measure, while loneliness is a subjective emotional experience (De Jong-Gierveld and Kamphuls, 1985; Holt-Lunstad et al., 2015). Social isolation is characterized by a limited relational network and social contacts (Holt-Lunstad et al., 2015), while loneliness describes the unpleasant feeling resulting from the discrepancy between desired and existing social relationships (Pinquart and Sörensen, 2003; Boldy and Grenade, 2011). Loneliness can be further subdivided into “social loneliness” (the perceived lack of a good-quality social network) and “emotional loneliness” (the perceived lack of intimate/emotional support from a significant other) (Weiss, 1973; Gierveld et al., 2006). Thus, an individual’s perception of the size of their social network and the emotional connections they have will influence whether they feel lonely or not (Weiss, 1973; Gierveld et al., 2006; Cacioppo et al., 2015).
Even though the terms’ “social isolation” (negative) and “social support” (positive) are used interchangeably, they do not refer to diametrical concepts (Berkman et al., 2000; Holt-Lunstad et al., 2015). While social isolation is an objective measure of the number of social connections (Holt-Lunstad et al., 2015), social support is a subjective measure of the actual or perceived availability of psychological and material resources provided by the social network (Cohen, 2004). Social support further can be divided into three categories based on the resources: tangible (provision of materials), informational (guidance or support), and emotional (empathy, care) (House and Kahn, 1985).
Impact of Social Isolation, Loneliness and Social Support on Health and Wellbeing of Older Adults
Loneliness is associated with depressive symptoms (Cacioppo et al., 2006, 2010; Zebhauser et al., 2014), reduced physical activity (Hawkley et al., 2009), decreased satisfaction with life (Zebhauser et al., 2014; Bai and Knapp, 2016) and poor subjective wellbeing (Pinquart and Sörensen, 2003). Loneliness has also been associated with cognitive impairment (Donovan et al., 2017; Kim et al., 2020), increased risk of dementia (Zhou et al., 2018) and cardiovascular disease, diabetes and migraine (Christiansen et al., 2016). Social isolation has been associated with falls, re-hospitalization, cardiac heart disease, cancer, and nutritional risk (Nicholson, 2012). Current literature highlights that loneliness and social isolation resulting from poor social relationships increase the mortality rate among older adults (Luo et al., 2012; Holt-Lunstad et al., 2015). On a positive note, social support increases the resilience to stressful events (Ozbay et al., 2007) and suicidal ideation (Zhang et al., 2018), plays a protective role against depression (Gariépy et al., 2016) and reduces the Diabetes burden (Kaya and Caydam, 2019). Identifying factors that contribute to developing strong positive social relationships in older adults could help reduce this population’s high morbidity and mortality.
Hearing Loss and Its’ Consequences
Age-related hearing loss (ARHL) is prevalent in later life and has an increasing trend across ages; 10.9–17.6% in 60–69 years, 41.9–51.2% in 80–89 years, and 52.9–64.9% in 90 years and above (World Health Organization [WHO], 2021b). ARHL is associated with an increased risk of cognitive impairment (Jayakody et al., 2017), dementia (Dalton et al., 2003; Lin et al., 2011), and Alzheimer’s disease (Lin et al., 2011), poor quality of life (Dalton et al., 2003), physical inactivity (Gispen et al., 2014), social isolation (Strawbridge et al., 2000), as well as depression, anxiety, and stress (Jayakody et al., 2018). ARHL is characterized by loss of peripheral hearing sensitivity and decreased ability to understand speech, mainly when there is background noise (Davis et al., 2016). Thus, hearing impairment poses a major challenge as it impairs the ability to hear, listen and understand the intended message. Hence, the consequences of hearing impairment affect not only the hearing-impaired individual but their communication partners/significant others as well (Kamil and Lin, 2015). Communication partners experience poorer quality of life and relationship satisfaction, a restricted social life and increased communication burden, and (Kamil and Lin, 2015).
Communication refers to the “bidirectional transfer of information, meaning, and intent between two or more individuals” (Kiessling et al., 2003). Communication forms part of a social act which involves expressing oneself and relating to others and is moderated by the emotions, attitudes and beliefs of the communication partners and the rules of the society (Lemke and Scherpiet, 2015). Verbal communication requires both participants to hear, listen and comprehend (Kiessling et al., 2003). According to the World Health Organization’s International Classification of Functioning, Disability, and Health (World Health Organization [WHO], 2001), communication disability due to hearing impairment is an outcome of interactions between sensory impairment and participation in life. Hence, communication impairment resulting from hearing loss restricts active involvement in social and cultural activities leading to withdrawal and feelings of loneliness (Strawbridge et al., 2000) and social isolation (Pronk et al., 2011; Zebhauser et al., 2014). Several studies have found that hearing loss is associated with a higher risk of social isolation and loneliness (Pronk et al., 2014; Mick and Pichora-Fuller, 2016; Contrera et al., 2017). It is possible that people with hearing loss withdraw from social situations due to difficulties in communicating and following conversations, which leads to social isolation. This association has been found more frequently in women compared to men (Mick et al., 2014), possibly due to several reasons: (i) Women feel more comfortable in reporting social isolation/loneliness compared to men (Shukla et al., 2020); (ii) women rely more on verbal communication for social networking (Maltz and Borker, 1982) and (iii) become socially and emotionally vulnerable if they are unable to effectively connect with their social network due to their hearing impairment (Shukla et al., 2020).
Hence, it is important to investigate the impact of untreated hearing loss on social and emotional loneliness, social isolation, perceived social support, and psychological discomfort (symptoms of depression, anxiety, stress).
Materials and Methods
Study Design and Setting
This was a cross-sectional study of a community-derived sample of volunteers and adults in contact with the clinical services of the Ear Science Institute of Australia in Perth, Western Australia. Participants were either native or fluent English speakers older than 40 years, did not use any hearing aids or hearing implants, had bilateral symmetrical pure tone audiometric thresholds of hearing sensitivity and did not have any morbidities or disabilities that prevented them from completing the assessments.
Materials and Procedure
The assessment materials consisted of measures of hearing, mental health, social support and interaction, and social and emotional loneliness. The Human Research Ethics Committee of the University of Western Australia approved the study protocol (RA/4/1/7368), and all participants provided written informed consent.
Hearing Assessment
This included an otoscopic examination (OTOS/AA HDL otoscope, Welch Allyn, NY) and a pure-tone audiometric assessment (MIDIMATE 602 Audiometer, GN Otometrics Ltd., Sydney). Following an otoscopic examination, bilateral air conduction thresholds between 0.5 and 8 kHz and bone conduction thresholds between 0.5 and 4 kHz were obtained through standard audiometric assessment protocols conducted by a qualified audiologist in a standard sound-attenuated booth. These data were used to stratify participants into the following groups by their better ear four frequency pure-tone average thresholds at 0.5, 1, 2, and 4 kHz (BE4PTA): normal hearing (NH: 0–25 dB), mild to moderate sensorineural hearing loss (MMH: > 25–55 dB), moderately severe to profound sensorineural hearing loss (MSPH: 56+ dB).
Assessment of Social Isolation and Social Support
The Duke Social Support Index (DSSI-10) was used to measure the social interaction and satisfaction with social support received (Pachana et al., 2008; Wardian et al., 2013). The DSSI-10 contains two subscales of (a) social interaction (denoted SI) and (b) satisfaction with social support (denoted SS). The DSSI-10 has shown a good test-retest reliability, concurrent validity, and construct validity for the two independent subscales within the Australian Longitudinal Study on Women’s Health (Women’s Health Australia, 2004).
The social interaction subscale measures the size and structure of the social network and contains questions regarding the number of social interactions a person had within the past week with low social interaction subscale scores indicating greater social isolation (Freak-Poli et al., 2021b). The social support subscale measures perceived satisfaction with the behavioral or emotional support received from the social network and contained questions related to the subjective quality of those relationships with higher social support satisfaction subscale scores indicating better social support (Freak-Poli et al., 2021b).
Assessment of Loneliness
The de Jong-Gierveld loneliness scale (De Jong-Gierveld and Kamphuls, 1985) measured social and emotional loneliness. We used the short 6-item version of this scale (Gierveld et al., 2006), which contains three questions on social loneliness (SL) and three questions on emotional loneliness (EL). All statements are scored using a three-point scale (no, more or less, yes). To respond to the questions in this questionnaire, participants need to appraise their social relationships against their expectations (Valtorta et al., 2016). These are summed, with higher scores indicating higher levels of loneliness. Existing data support the validity and reliability of the scale (De Jong Gierveld and Van Tilburg, 2010).
Assessment of Psychological Discomfort (Depression, Anxiety, and Stress)
The Depression Anxiety Stress Scales: DASS-21 (Lovibond and Lovibond, 1995) was used to measure the severity (over the past 7 days) of a range of symptoms common to depression, anxiety, and stress. A 4-point combined severity/frequency scale is used to rate how the participant has experienced each question/statement over the past week. Each test item is scored from 0 (did not apply to me at all over the last week) to 3 (applied to me very much or most of the time over the past week). Seven statements are used to assess each of the three mental health domains, with total sub-scores for depression, anxiety, and stress calculated by summing the scores for the relevant items and multiplying them by two, so that each sub-score can range from 0 to 42 (Psychology Foundation of Australia, 2014).
Additional Measures
Participants self-reported their sex (male or female) and age (in years), years of formal education, physical exercises undertaken, smoking (current and past), alcohol consumption, and current living status (alone or with other people). We used the National Adult Reading Test-Revised (NART-R) to assess participants’ premorbid intellectual function scores (Nelson and Willison, 1991). All participants were asked to read aloud a list of 50 words from the NART-R test while the researcher recorded the number of errors made by the participant. The verbal intelligence quotient (VIQ) was calculated based on the NART-R error score.
Statistical Analysis
The statistical analyses were carried out in SPSS Statistics for Windows version 25.0 (Armonk, NY: IBM Corp.) and R version 3.5.1 (R Core Team, 2018). Univariate linear regression was used to assess the association between Social Support, Social Interaction, and BE4PTA. The statically significant outcomes observed in the univariate analysis were then used in multiple linear regression. A P-value of less than 0.05 was considered to indicate statistical significance.
All authors accessed the study data and reviewed and approved the final manuscript. We used the STROBE statement to check the completeness of our study report (Von Elm et al., 2014).
Results
Two hundred and two volunteers, aged between 40 and 88 years (M = 65.32 ± 11.07 years) took part in the study (Table 1). Of the 202 participants, 115 (57%) were male (M = 63.16 ± 12.05 years of age) and 87 (43%) were female (M = 68.17 ± 8.91 years of age). Detailed information on participant demographics is presented in Table 1.
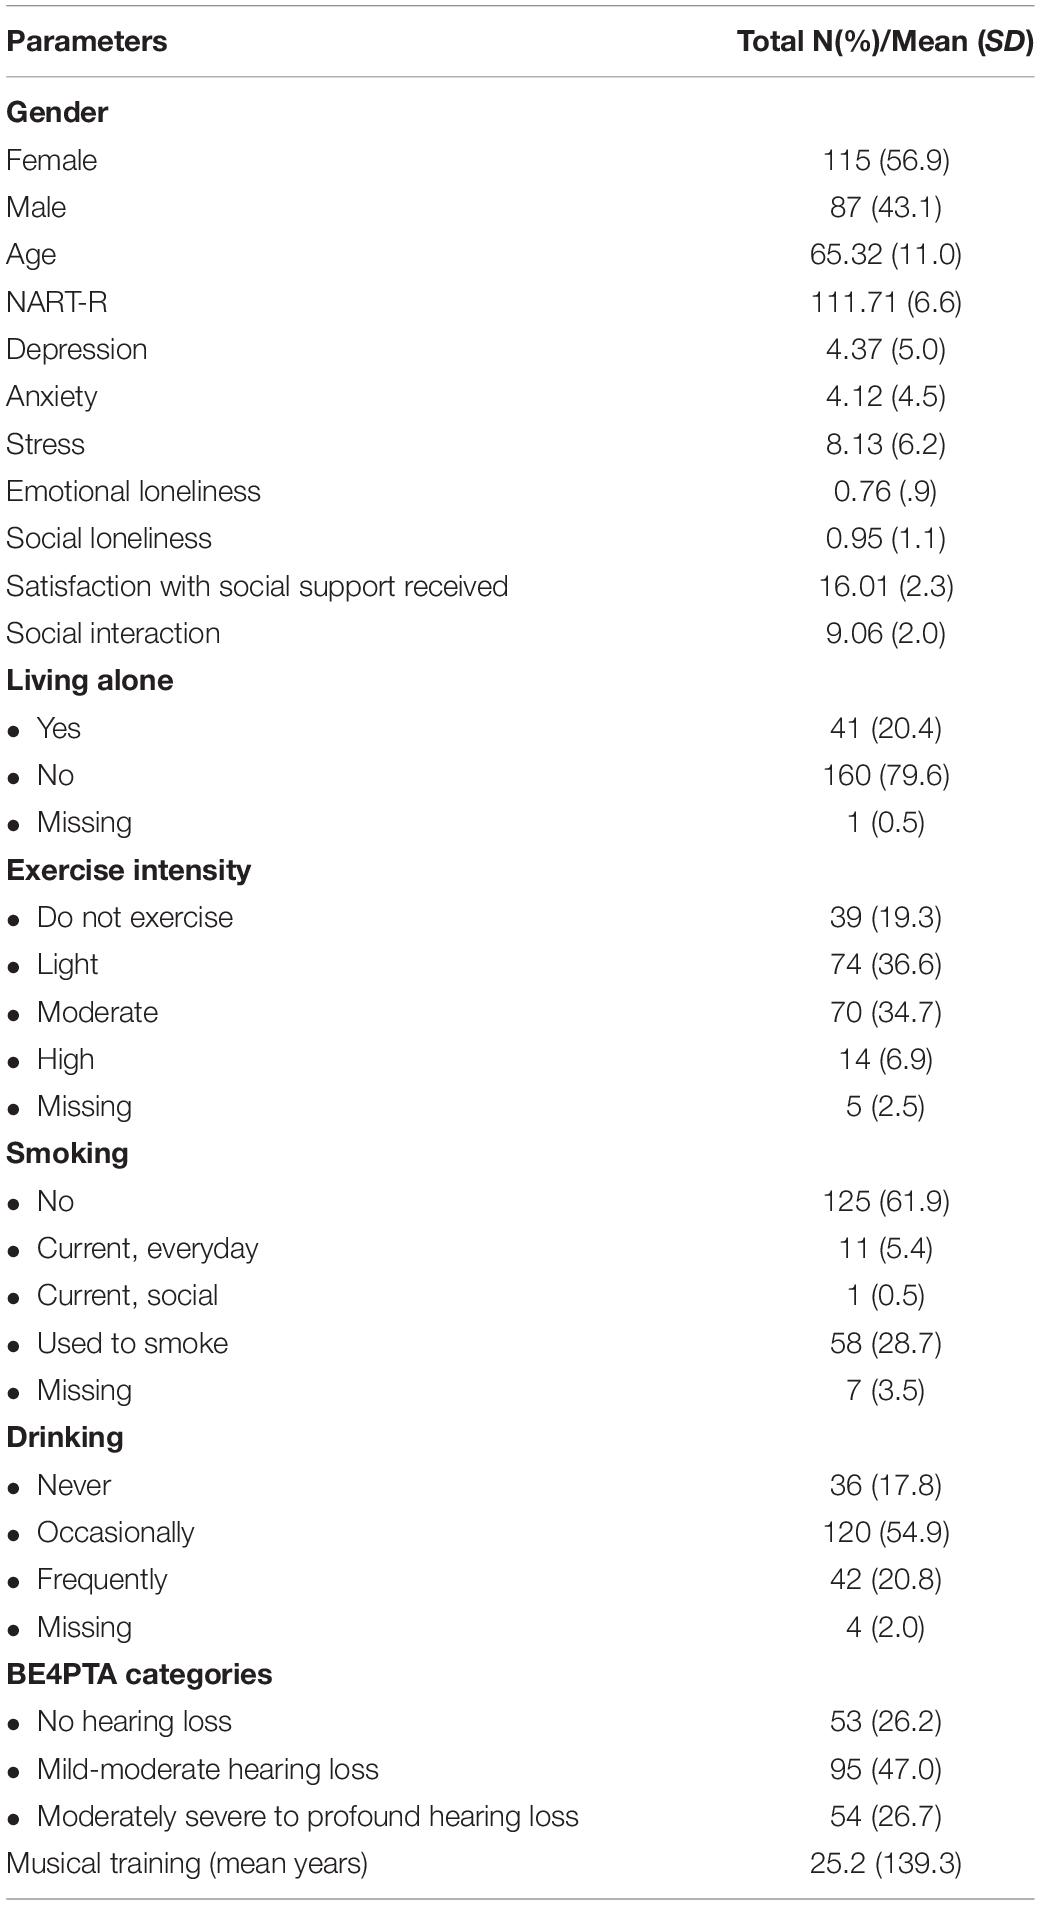
Table 1. Demographic details of the participants.
Satisfaction With Social Support/Perceived Social Support
After univariate analysis, hearing was not statistically significant associated with SS. (P = 0.07). Poor satisfaction with social support scores was observed in individuals who live alone (P = 0.003), and experience more stress (P < 0.001), anxiety (P = 0.001), and depression (P < 0.001) or vice versa (see Tables 2, 3).

Table 2. Multi linear regression analysis results -better ear 4PTA average vs. social interaction and satisfaction with social support.
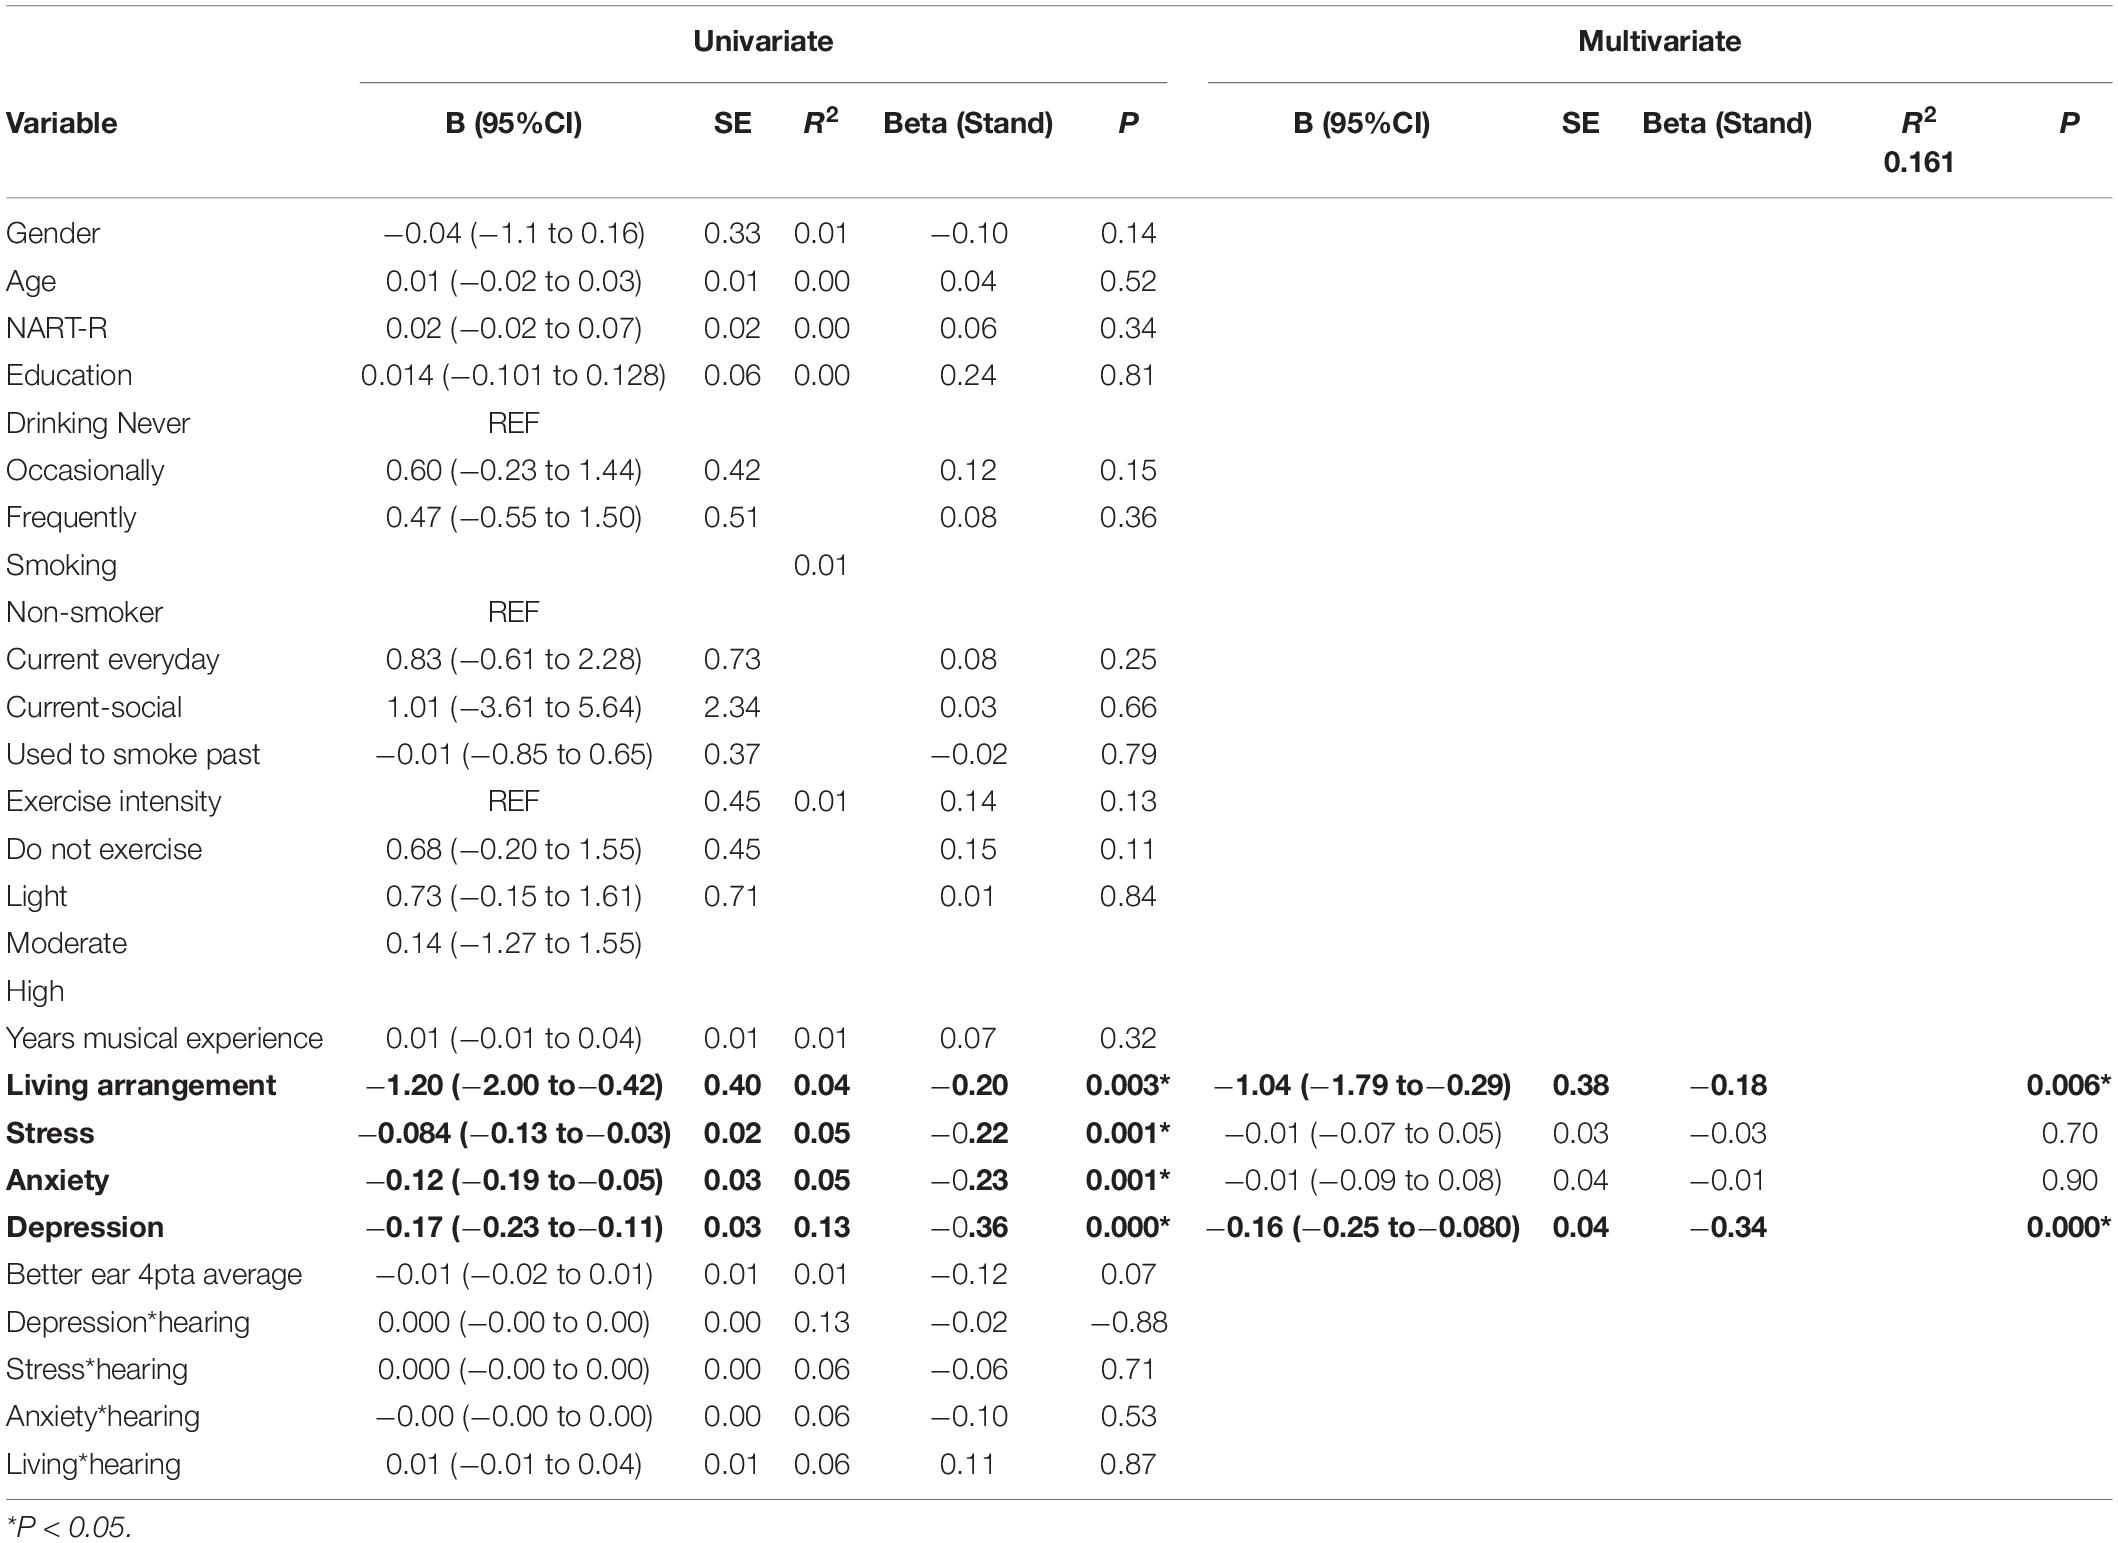
Table 3. Univariate and multivariate analysis, satisfaction with social support received (SS).
Social Interaction/Social Isolation
Two variables have a significant effect on SI in the univariate analyses: depression (P = 0.01) and age (P < 0.001). After multivariate analysis for confounders, aging (P = 0.01) and depression (P = 0.01) continued to be statistically significant. These results suggest that higher depression scores and older age contributes to increased social isolation. A statistically significant interaction between age and hearing was observed (P = 0.04). Poorer SI scores are seen for people who are not only older but with poorer hearing. Results are summarized in Table 4. No significant effect of years of formal education, premorbid IQ (NART-R), smoking, alcohol ≥ 14 drinks per week or exercise were observed on SI and SS.
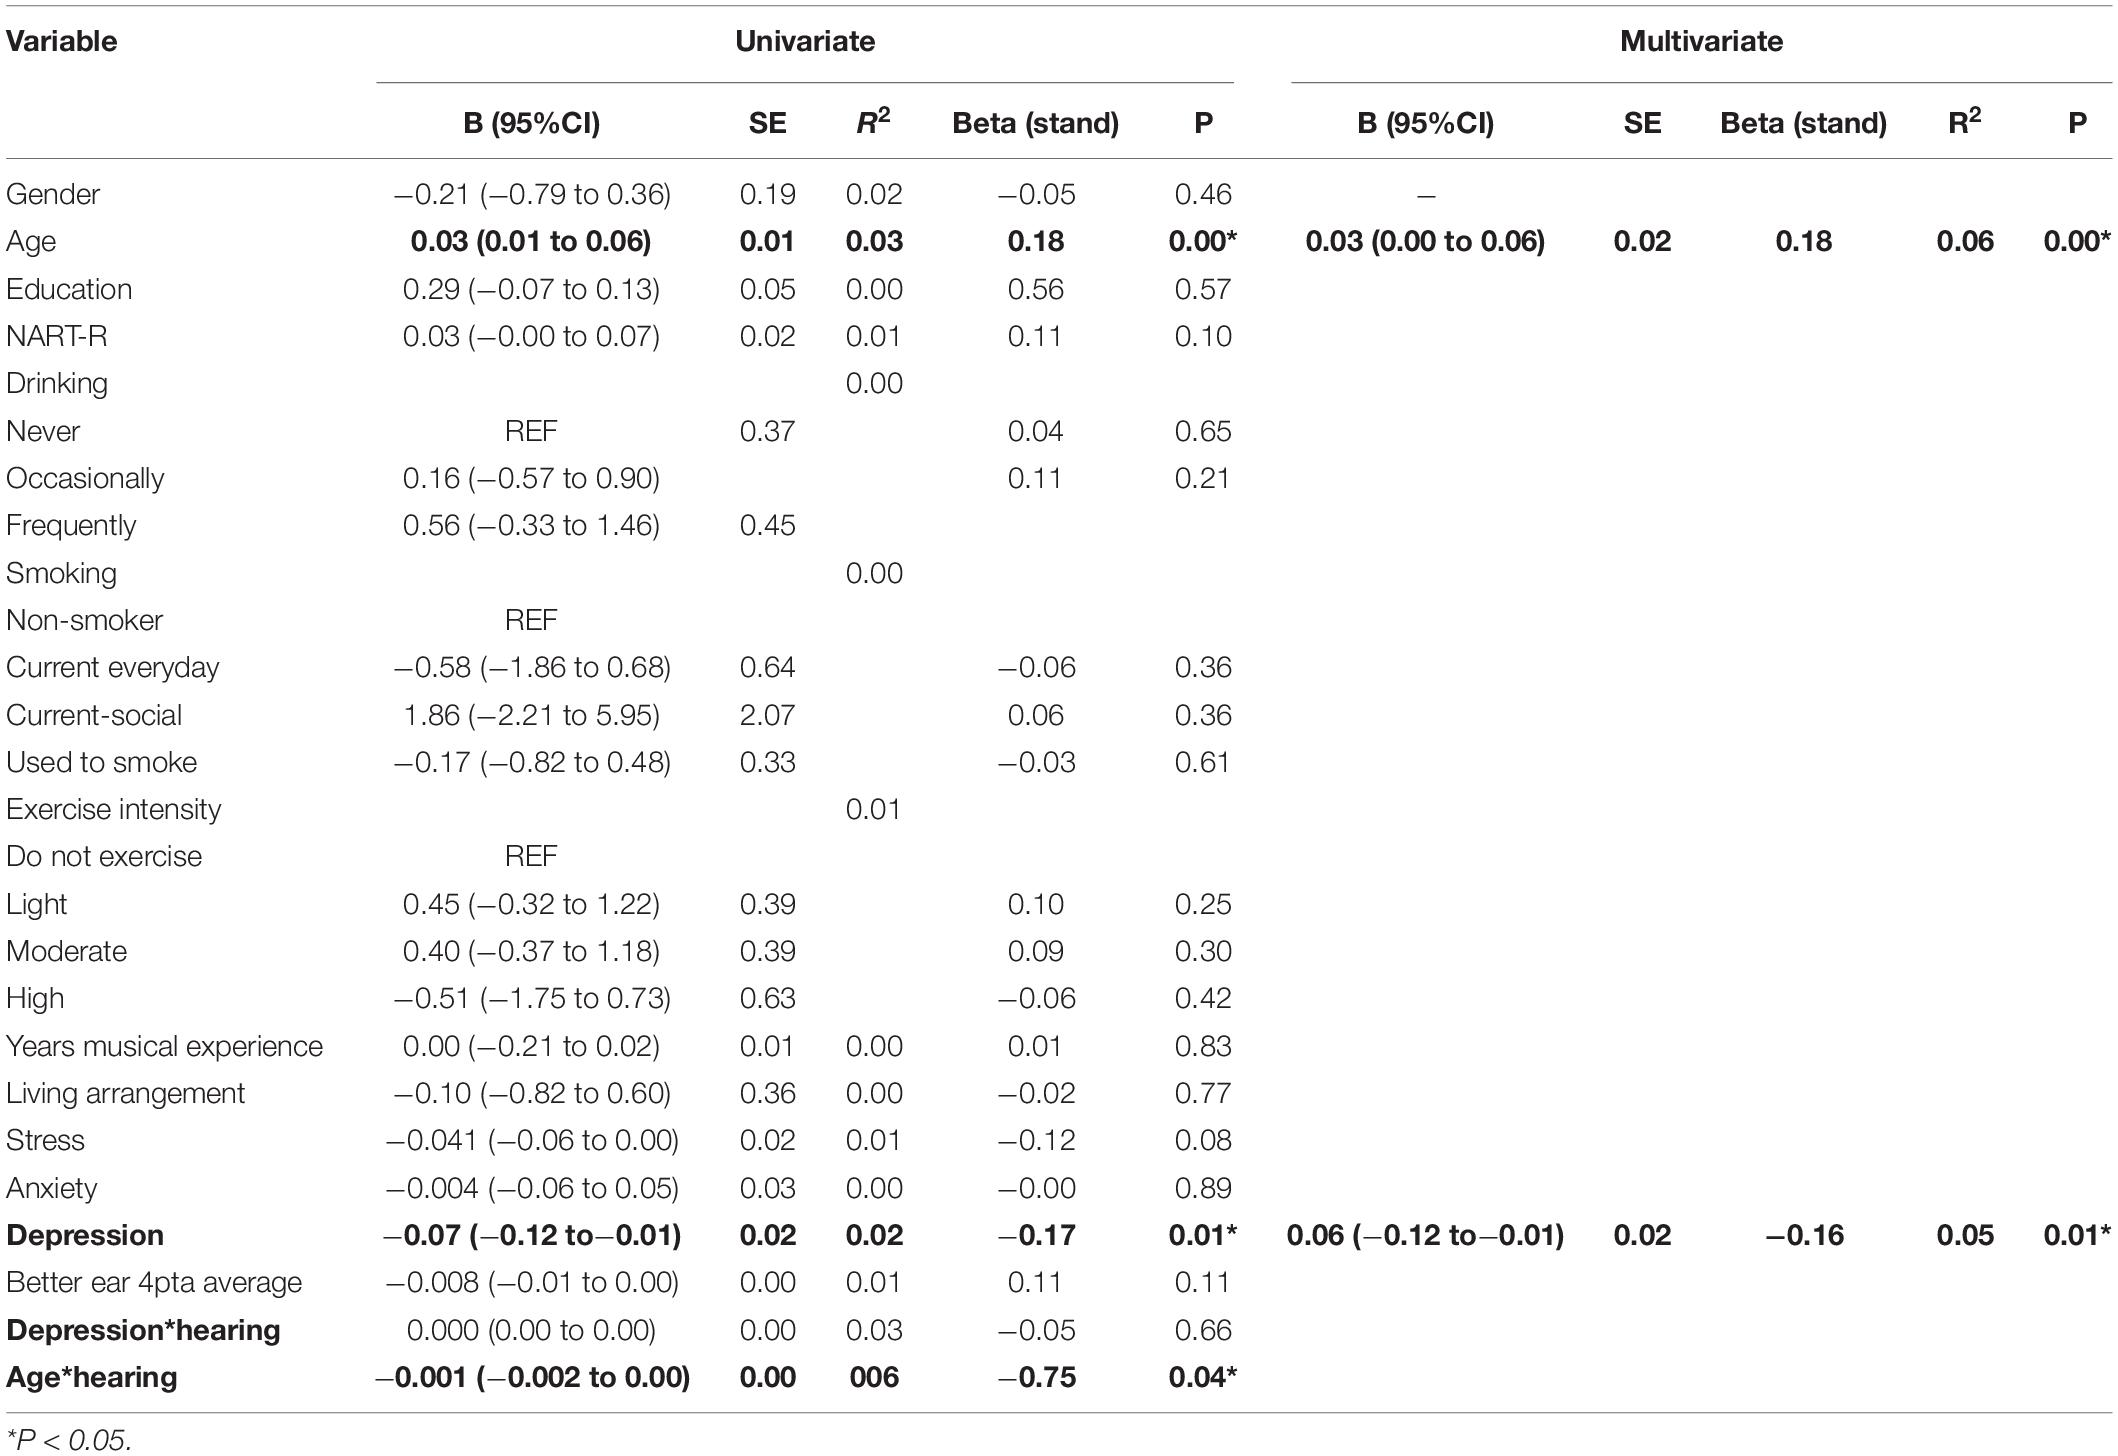
Table 4. Univariate and multivariate analyses, social interaction (SI).
Emotional Loneliness
The total number and percentage of participants for each EL and SL category are reported in Table 5. Logistic multinominal regression analysis did not show any effect of gender, premorbid IQ (NART-R), alcohol ≥ 14 drinks per week, smoking and exercises on EL. Living alone (P = 0.01) significantly contributed to the intense levels of emotional loneliness. Age (P = 0.02) and (P = 0.02), depression (P < 0.001) and (P < 0.001), anxiety (P < 0.001) and (P < 0.001), stress (P < 0.001) and (P < 0.001), BE 4PTA (P < 0.001) and (P < 0.001) significantly contributed to both moderate and intense levels of EL, respectively (see Tables 5, 6).
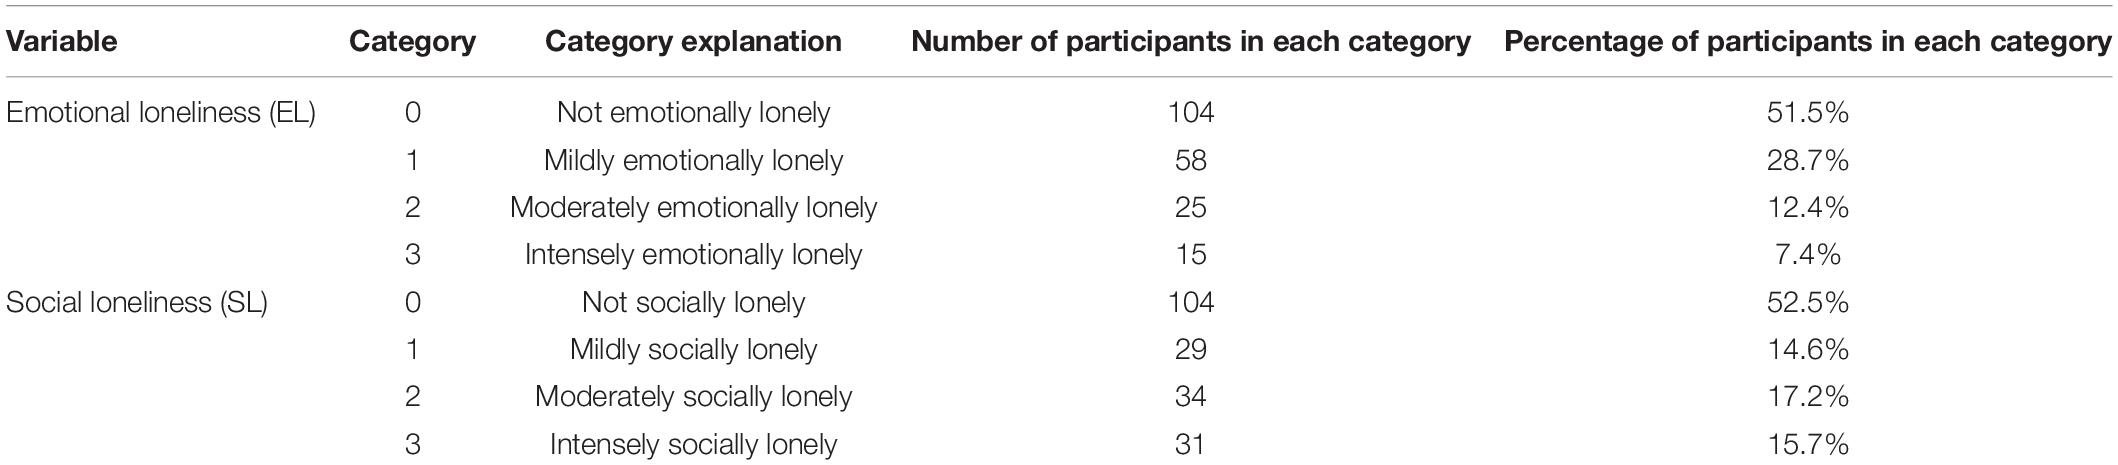
Table 5. Nominal regression emotional loneliness (EL) and social loneliness (SL).
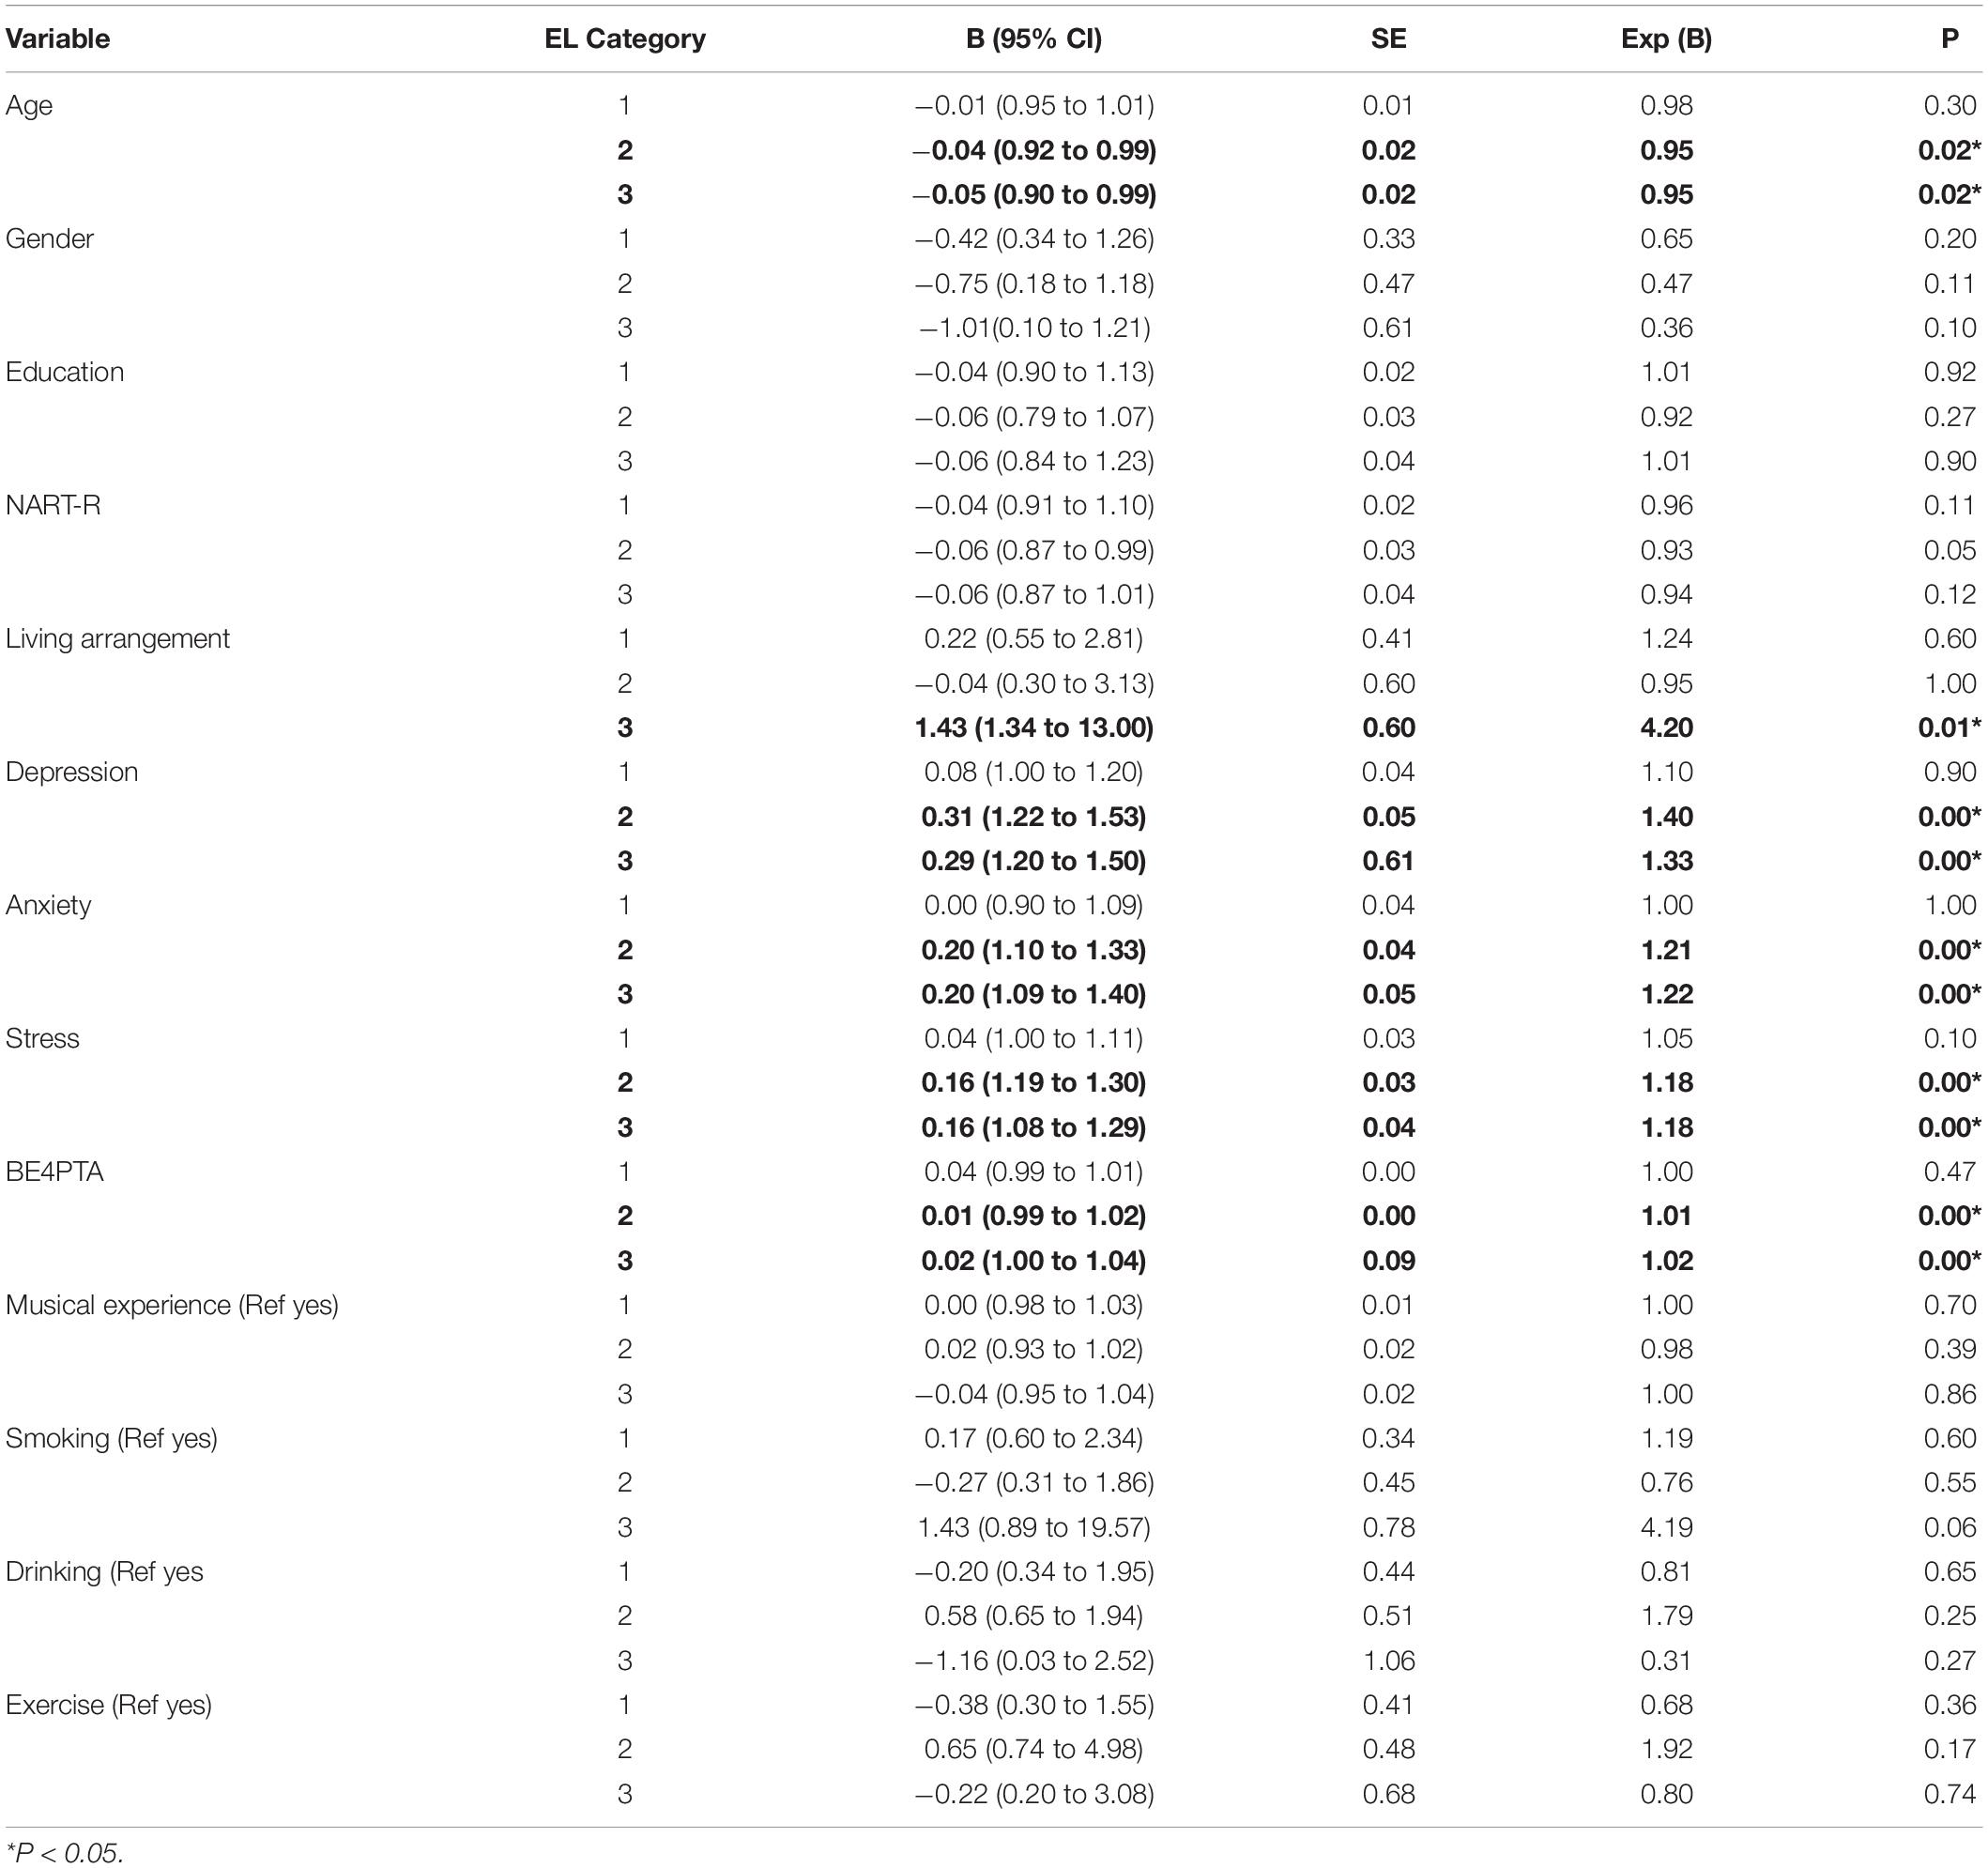
Table 6. Association between Age, living arrangement, depression, anxiety, stress, and better ear 4PTA hearing thresholds on EL categories.
An adjacent category ordinal regression analysis was conducted to investigate this association between EL and BE 4PTA, living alone and age. The adjacent category logistic regression model was implemented in the VGAM framework (Yee and Wild, 1996; Yee, 2010, 2015) using the R statistical language (R Core Team, 2018). This adjacent ordinal model considers the impact of the predictors on the odds ratio on the adjacent ordinal response levels with the following mathematical model,
In our case, the pi denote the probabilities of being at an emotional loneliness level i. This is modeling the log-odds as a linear function of the predictors in design matrix X and the linear predictor β. Therefore, the full model would involve the three logistic equations,
Only three equations are modeled since there are only three transitions to cover the four EL ordinal levels. The likelihood ratio test was used to investigate the proportional odds assumption, i.e., if there are different predictor effects at different ordinal levels, but there was no statistical evidence for this with a p-value of 0.86, the same effect of the predictors is present across all adjacent transitions; only an intercept adjustment is required. Furthermore, there was no statistical evidence to suggest an interaction between the predictor terms. The final model is,
where β0,i is an intercept term for each transition level that gives the estimated log odds for the adjacent levels at the baseline predictor level. Here, the baseline predictors are for participants that live alone (Living alone 0). The living alone variables in the equation above are indicators that take the value 1 for participants that live alone. The exponentiated effect estimates are shown above in the equation. The corresponding p-values and 95% CI are BE4PTA [0.048, (95% CI: 1.00 to −1.01)], Age [0.002, (95% CI: 0.95 to −0.99)], Living alone [0.044, (95% CI: 1.01 to −2.36)], and Depression [2.5×10⁻⁹, (95% CI: 1.06–1.16)]. Interpreting this model suggests that a participant living alone increases their odds of transitioning to the next higher EL level by 54.6%. For each unit of BE4PTA, a participant’s odds of transitioning to the next higher EL level increased by 0.6%. For example, if a person whose hearing deteriorates from no hearing loss to mild to moderate hearing loss, where the BE4PTA increases from 25 to 50 dB, they will have 1.00625 = 1.16 or a 16% increase in their odds of transitioning to the next higher EL level.
Social Loneliness
Multinominal analysis revealed that age, gender, premorbid IQ (NART-R), anxiety, BE4PTA, smoking, and alcohol ≥ 14 drinks per week had no effect on SL. Three of the variables exhibited a statistically significant association with the SL response. Living alone (P = 0.01), depression (P = 0.01), and stress (P = 0.01) had a significant impact on intense levels of SL. Results are summarized in Table 7.
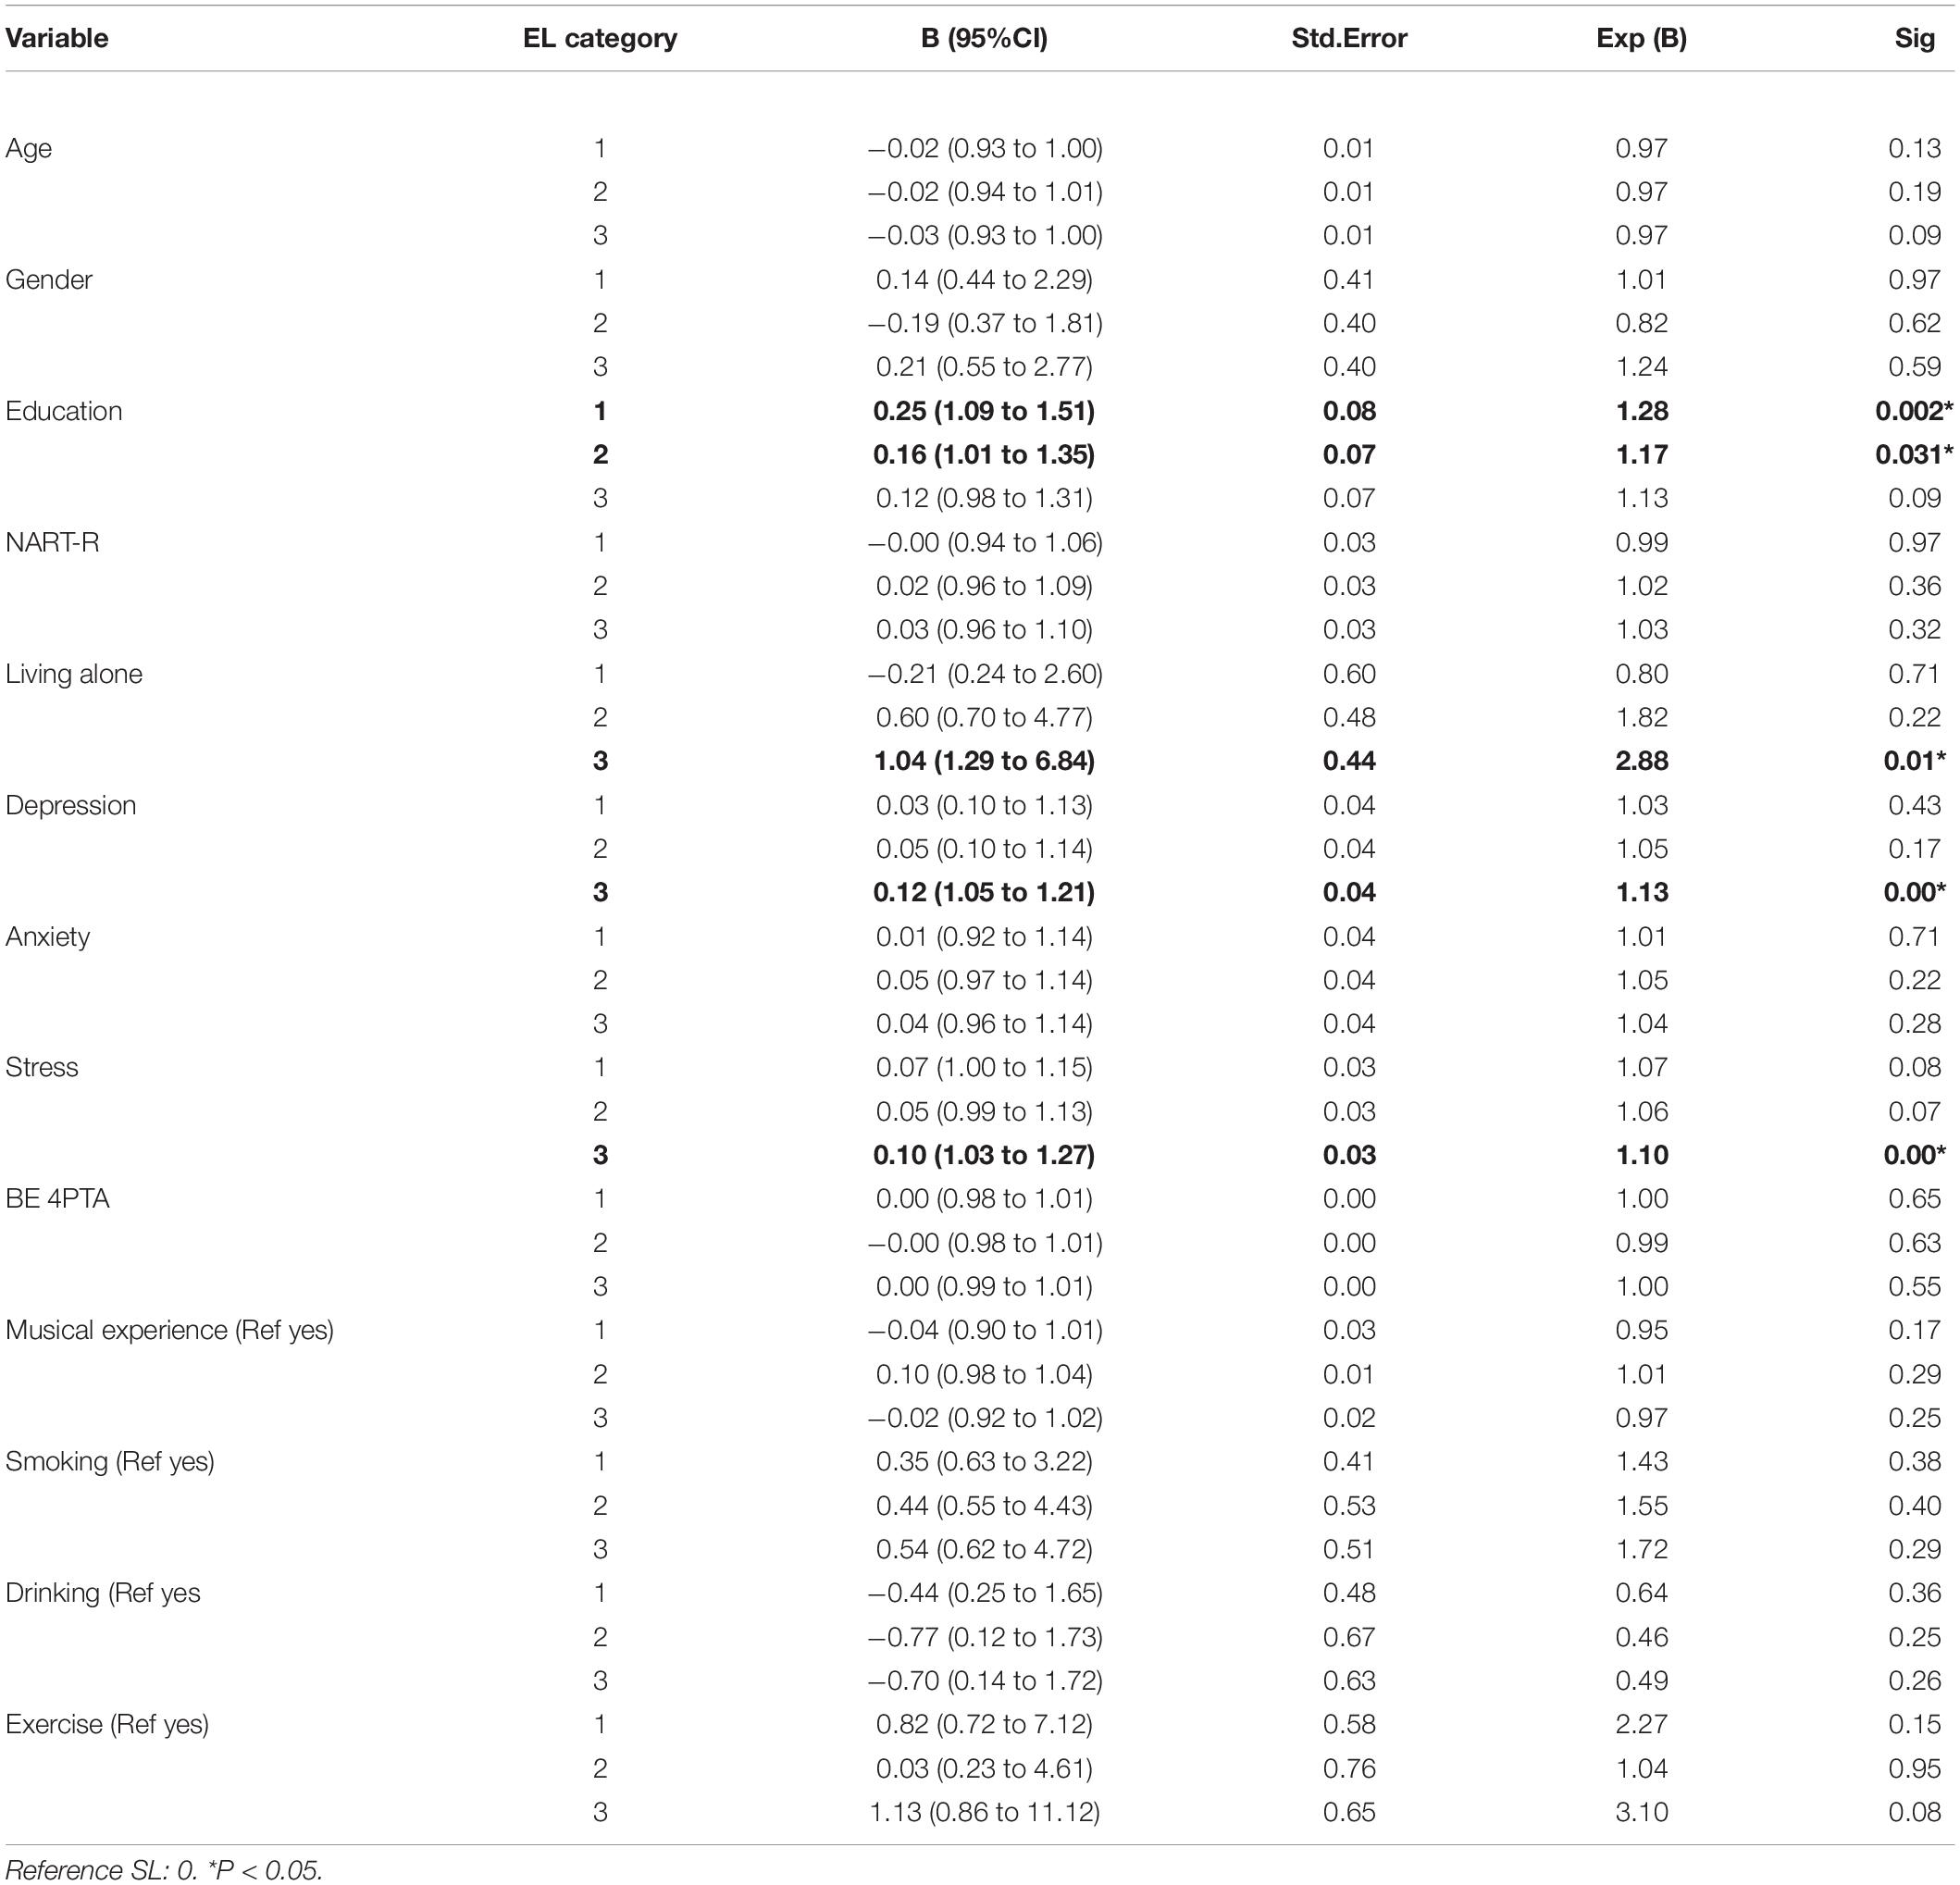
Table 7. Association between living arrangement, depression, and Stress on SL categories.
Discussion
This study investigated the association between untreated hearing loss and three aspects of social health: social isolation, loneliness, and social support in older adults and psychological discomfort.
The key finding is that untreated hearing loss was not associated with social loneliness but was significantly associated with emotional loneliness. For every unit of increase in hearing loss, the odds of transitioning from mild to moderate or moderate to intense levels of emotional loneliness increased by 0.6%. If an older adult’s hearing deteriorates from mild-moderate, the chances of moving from mild-moderate or moderate to intense levels of emotional loneliness are 16%.
Weiss (1973) differentiated between emotional and social loneliness (Weiss, 1973). Emotional loneliness results from an absence of an intimate or a close emotional relationship (a partner, a best friend), and it is associated with feelings of abandonment, aloneness, and anxiety. Social loneliness results from the lack of many contacts or social networks (friends, colleagues, neighbors) (Weiss, 1973). Loneliness is more closely related to the quality than quantity of social interactions (Hawkley et al., 2008). Communication is a two-way process involving both the person with a hearing loss and their communication partner (Scarinci et al., 2008). Intimate, close partner relationships can suffer considerably from hearing loss (Scarinci et al., 2008). Studies on challenges experienced by hearing-impaired people and their significant others have reported difficulties communicating in background noise, annoyance due to having to repeat during a conversation, frustration and/or annoyance due to hearing loss (Stark and Hickson, 2004). Based on our data, we posit that the breakdown in communication resulting from moderate to severe levels of hearing impairment could have a significant impact on close relationships resulting in emotional loneliness.
Particularly noteworthy are the findings that living alone increases the odds of transitioning from mild-moderate or moderate-intense levels of emotional loneliness by 54.6%. This is a significant concern as older adults who live alone and experience emotional loneliness seem to be at greater risk of all-cause mortality (HR = 1.186, p = 0.029, 95% CI = 1.017–1.383) compared to older adults who live with someone else and experience emotional loneliness (O’Súilleabháin et al., 2019). We posit that, even if older adults live with someone, if their intimate or close relationship is compromised due to a communication barrier due to untreated hearing loss, they could be at greater risk of all-cause mortality than normal hearing- or hearing-impaired older adults using hearing rehabilitation devices.
We also found that those with high emotional and social loneliness scores also had high depression and stress scores and were living alone. Our findings complement those of Alpass and Neville (2003), who found a significant association between loneliness and depressive symptoms in 217 older men. Similarly, Savikko et al. (2005) reported that living alone or in a residential home is a risk factor for loneliness. In contrast, poor health and functionality, vision and hearing impairment increases the prevalence of risk of loneliness.
The theory of conservation resources states that wellbeing can be social or psychological (Hobfoll, 1989, 2001). Losses in psychological resources such as mental health increase the likelihood of loneliness (Aartsen and Jylhä, 2011). Further, reductions in personal resources, compared to social resources, strongly predict loneliness (Fry and Debats, 2002). Our previously published results reported a significant association between clinically significant depression, stress and anxiety and untreated hearing loss (Jayakody et al., 2018). A significant association between loneliness and increases in depressive symptoms (Cacioppo et al., 2006, 2010; Sung et al., 2016) has a reciprocal influence on loneliness and depressive symptoms over time (Cacioppo et al., 2006).
We also explored the association between untreated hearing loss and social isolation (through social interaction) and perceived social support (satisfaction with social support received). Those who had higher depression scores showed increased social isolation scores and poor social support. Previous studies have shown that social support and depression share a bidirectional relationship (Stice et al., 2004; Almquist et al., 2016). According to the stress-buffer mechanism, social support attenuates the effects of stressful life events through effective coping strategies (Cohen and Wills, 1985). It influences positive health-related behaviors by regulating emotional responses to stressful or other high-risk situations (Cohen, 1988, 2004).
We failed to observe any significant association between untreated hearing loss and social isolation or perceived social support. The underlying reasons for these results are unclear. DSSI-10 measures both structural (number, diversity, density of a person’s social network) and functional aspects (involvement, perceived availability, and adequacy) of social relationships (Valtorta et al., 2016); however, it does not explicitly measure the impact of communication impairment on social interaction/isolation or perceived social support. Future studies should investigate this association using tools that are more sensitive to the effects of communication impairment resulting from hearing loss.
On the other hand, we found that interaction between aging and hearing loss significantly contributed to social interaction/isolation. Aging reduces the number of social contacts and brings a decline in social activity (Dykstra et al., 2005). Epidemiological data also document an increase in hearing loss due to aging (Cruickshanks et al., 2003; Gopinath et al., 2009). Hearing loss imposes more demands on communicating partners, such as speaking slowly, exaggerating articulatory movements, and moving closer to the listener (Arlinger, 2003). These increases in demands may make people less in contact with hearing-impaired individuals (Arlinger, 2003). Hence, it is no surprise that aging and age-related hearing loss significantly impairs social relationships by reducing social networks’ size and structure.
In summary, we observed a significant relationship between untreated hearing loss and emotional loneliness. Depression was a common factor that contributed to loneliness, social isolation, and poor social support. West (2017) reported that social support moderates the association between self-reported hearing loss and depression. Excluding the additional costs associated with using the health care systems, such as more general practitioner visits, medications, emergency services, outpatient and hospital admissions due to social isolation/loneliness (Longman et al., 2013), the cost of social isolation and loneliness to the Australian economy is AUD$1.7 billion (Australian Institute of Health and Welfare [AIHW], 2021). Some of these costs are due to the consequences associated with social isolation/loneliness; however, some are due to lonely people visiting physicians to satisfy their need for social relationships (Gerst-Emerson and Jayawardhana, 2015). Similarly, in audiological clinical practice, we often come across older adults coming in for hearing aid programming or cochlear implant mapping appointments to compensate for their loneliness.
The following steps can be taken to increase the social support and help reduce the burden of loneliness and isolation: (i) encourage the use of engaged coping strategies such as managing the hearing loss using hearables/hearing aids or hearing implants or using communication strategies (Heffernan et al., 2016); (ii) provide training to communication partners/significant others on support socially the person with hearing impairment (Preminger and Meeks, 2010) and (iii) train audiologists in providing counseling and emotional support to their patients (Saunders et al., 2021).
Limitations
This is a cross-sectional study; therefore, results must be interpreted cautiously. A study with more power and a longitudinal design could provide more insight into the causal relationship between untreated hearing loss, loneliness, social isolation, and social support.
Future Directions
A follow-up manuscript will investigate the effect of hearing loss treatment using hearing aids/hearing implants that could help alleviate loneliness, social isolation, and depression. Future research is required to investigate whether social support could buffer the association between hearing loss and emotional loneliness.
Data Availability Statement
The raw data supporting the conclusions of this article will be made available by the authors, without undue reservation.
Ethics Statement
The studies involving human participants were reviewed and approved by the Human Research Ethics Committee of the University of Western Australia approved the study protocol (RA/4/1/7368). The patients/participants provided their written informed consent to participate in this study.
Author Contributions
TM, JY, and JG-S contributed to the data collection. DJ, OA, and RE contributed to the study design, interpretation of results, and manuscript writing. JW and IS contributed to the analysis, interpretation of data, and drafting the manuscript. All authors contributed to the article and approved the submitted version.
Conflict of Interest
The authors declare that the research was conducted in the absence of any commercial or financial relationships that could be construed as a potential conflict of interest.
Publisher’s Note
All claims expressed in this article are solely those of the authors and do not necessarily represent those of their affiliated organizations, or those of the publisher, the editors and the reviewers. Any product that may be evaluated in this article, or claim that may be made by its manufacturer, is not guaranteed or endorsed by the publisher.
References
Aartsen, M., and Jylhä, M. (2011). Onset of loneliness in older adults: results of a 28 year prospective study. Eur. J. Ageing 8, 31–38. doi: 10.1007/s10433-011-0175-7
Almquist, Y. B., Landstedt, E., and And Hammarström, A. (2016). Associations between social support and depressive symptoms: social causation or social selection—or both? Eur. J. Public Health 27, 84–89. doi: 10.1093/eurpub/ckw120
Alpass, F. M., and Neville, S. (2003). Loneliness, health and depression in older males. Aging Ment. Health 7, 212–216. doi: 10.1080/1360786031000101193
Arlinger, S. (2003). Negative consequences of uncorrected hearing loss–a review. Int. J. Audiol. 42, s17–s20.
Australian Institute of Health and Welfare [AIHW] (2021). Snapshot: Social Isolation and Loneliness. Available online at: www.aihw.gov.au/reports/australias-welfare/social-isolation-and-loneliness (accessed April 1, 2022).
Bai, X., and Knapp, Y. M. (2016). Social support, loneliness and life satisfaction in older adults living alone. Gerontologist 56, 714–714. doi: 10.1093/geront/gnw162.2911
Berkman, L. F., Glass, T., Brissette, I., and Seeman, T. E. (2000). From social integration to health: durkheim in the new millennium. Soc. Sci. Med. 51, 843–857. doi: 10.1016/s0277-9536(00)00065-4
Boldy, D., and Grenade, L. (2011). Loneliness and social isolation among older people: the views of community organisations and groups. Aust. N. Z. J. Public Health 35:583. doi: 10.1111/j.1753-6405.2011.00795.x
Cacioppo, J. T., Hawkley, L. C., and Thisted, R. A. (2010). Perceived social isolation makes me sad: 5-year cross-lagged analyses of loneliness and depressive symptomatology in the Chicago Health. Aging Social Relations Study. Psychol. Aging 25, 453–463. doi: 10.1037/a0017216
Cacioppo, J. T., Hughes, M. E., Waite, L. J., Hawkley, L. C., and Thisted, R. A. (2006). Loneliness as a specific risk factor for depressive symptoms: cross-sectional and longitudinal analyses. Psychol. Aging 21, 140–151. doi: 10.1037/0882-7974.21.1.140
Cacioppo, S., Grippo, A. J., London, S., Goossens, L., and Cacioppo, J. T. (2015). Loneliness: clinical import and interventions. Perspect Psychol. Sci. 10, 238–249. doi: 10.1177/1745691615570616
Christiansen, J., Larsen, F. B., and Lasgaard, M. (2016). Do stress, health behavior, and sleep mediate the association between loneliness and adverse health conditions among older people? Soc. Sci. Med. 152, 80–86. doi: 10.1016/j.socscimed.2016.01.020
Cohen, S. (1988). Psychosocial models of the role of social support in the etiology of physical disease. Health Psychol. 7, 269–297. doi: 10.1037/0278-6133.7.3.269
Cohen, S. (2004). Social relationships and health. Am. Psychol. 59, 676–684. doi: 10.1037/0003-066x.59.8.676
Cohen, S., and Wills, T. A. (1985). Stress, Social Support, and the Buffering Hypothesis. Psychol. Bull. 98, 310–357. doi: 10.1037/0033-2909.98.2.310
Contrera, K. J., Sung, Y. K., Betz, J., Li, L., and Lin, F. R. (2017). Change in loneliness after intervention with cochlear implants or hearing aids. Laryngoscope 127, 1885–1889. doi: 10.1002/lary.26424
R Core Team (2018). R: A language and Environment for Statistical Computing. Vienna: R Foundation for Statistical Computing.
Cruickshanks, K. J., Tweed, T. S., Wiley, T. L., Klein, B. E., Klein, R., Chappell, R., et al. (2003). The 5-year incidence and progression of hearing loss: the epidemiology of hearing loss study. Arch. Otolaryngol. Head Neck Surg. 129, 1041–1046. doi: 10.1001/archotol.129.10.1041
Dalton, D. S., Cruickshanks, K. J., Klein, B. E., Klein, R., Wiley, T. L., and Nondahl, D. M. (2003). The impact of hearing loss on quality of life in older adults. Gerontologist 43, 661–668. doi: 10.1093/geront/43.5.661
Davis, A., Mcmahon, C. M., Pichora-Fuller, K. M., Russ, S., Lin, F., Olusanya, B. O., et al. (2016). Aging and Hearing Health: the Life-course Approach. Gerontologist 56, S256–S267. doi: 10.1093/geront/gnw033
De Jong Gierveld, J., and Van Tilburg, T. (2010). The De Jong Gierveld short scales for emotional and social loneliness: tested on data from 7 countries in the Un generations and gender surveys. Eur. J. Ageing 7, 121–130. doi: 10.1007/s10433-010-0144-6
De Jong-Gierveld, J., and Kamphuls, F. (1985). The Development of a Rasch-Type Loneliness Scale. Appl. Psychol. Meas. 9, 289–299. doi: 10.1177/014662168500900307
Donovan, N. J., Wu, Q., Rentz, D. M., Sperling, R. A., Marshall, G. A., and Glymour, M. M. (2017). Loneliness, depression and cognitive function in older U.S. adults. Int. J. Geriatr. Psychiatry 32, 564–573. doi: 10.1002/gps.4495
Dykstra, P. A., Van Tilburg, T. G., and Gierveld, J. D. J. (2005). Changes in Older Adult Loneliness: results From a Seven-Year Longitudinal Study. Res. Aging 27, 725–747. doi: 10.1177/0164027505279712
Freak-Poli, R., Ryan, J., Neumann, J. T., Tonkin, A., Reid, C. M., Woods, R. L., et al. (2021a). Social isolation, social support and loneliness as predictors of cardiovascular disease incidence and mortality. BMC Geriatr. 21:711. doi: 10.1186/s12877-021-02602-2
Freak-Poli, R., Ryan, J., Tran, T., Owen, A., Power, J. M., Berk, M., et al. (2021b). Social isolation, social support and loneliness as independent concepts, and their relationship with health-related quality of life among older women. Aging Ment. Health 5, 1–10. doi: 10.1080/13607863.2021.1940097
Fry, P. S., and Debats, D. L. (2002). Self-efficacy beliefs as predictors of loneliness and psychological distress in older adults. Int. J. Aging Hum. Dev. 55, 233–269. doi: 10.2190/KBVP-L2TE-2ERY-BH26
Gariépy, G., Honkaniemi, H., and And Quesnel-Vallée, A. (2016). Social support and protection from depression: systematic review of current findings in Western countries. Br. J. Psychiatry 209, 284–293. doi: 10.1192/bjp.bp.115.169094
Gerst-Emerson, K., and Jayawardhana, J. (2015). Loneliness as a public health issue: the impact of loneliness on health care utilisation among older adults. Am. J. Public Health 105, 1013–1019. doi: 10.2105/Ajph.2014.302427
Gierveld, J. D. J., Filburg, T. V., and Dykstra, P. A. (2006). “Loneliness and social isolation,” in Cambridge Handbook of Personal Relationships, eds A. L. Vangelisti and D. Perlman (Cambridge: Cambridge University Press). doi: 10.1007/s00127-021-02051-7
Gispen, F. E., Chen, D. S., Genther, D. J., and Lin, F. R. (2014). Association between hearing impairment and lower levels of physical activity in older adults. J. Am. Geriatr. Soc. 62, 1427–1433. doi: 10.1111/jgs.12938
Gopinath, B., Rochtchina, E., Wang, J. J., Schneider, J., Leeder, S. R., and Mitchell, P. (2009). Prevalence of age-related hearing loss in older adults: blue Mountains Study. Arch. Intern. Med. 169, 415–416. doi: 10.1001/archinternmed.2008.597
Hawkley, L. C., Hughes, M. E., Waite, L. J., Masi, C. M., Thisted, R. A., and Cacioppo, J. T. (2008). From social structural factors to perceptions of relationship quality and loneliness: the Chicago health, aging, and social relations study. J. Gerontol. B Psychol. Sci. Soc. Sci. 63, S375–S384. doi: 10.1093/geronb/63.6.s375
Hawkley, L. C., Thisted, R. A., and Cacioppo, J. T. (2009). Loneliness predicts reduced physical activity: cross-sectional & longitudinal analyses. Health Psychol. 28, 354–363. doi: 10.1037/a0014400
Heffernan, E., Coulson, N. S., Henshaw, H., Barry, J. G., and And Ferguson, M. A. (2016). Understanding the psychosocial experiences of adults with mild-moderate hearing loss: an application of Leventhal’s self-regulatory model. Int. J. Audiol. 55, S3–S12. doi: 10.3109/14992027.2015.1117663
Hobfoll, S. (2001). The Influence of Culture, Community, and the Nested-Self in the Stress Process: advancing Conservation of Resources Theory. Appl. Psychol. 50, 337–421. doi: 10.1111/1464-0597.00062
Hobfoll, S. E. (1989). Conservation of resources. A new attempt at conceptualising stress. Am. Psychol. 44, 513–524. doi: 10.1037/0003-066X.44.3.513
Holt-Lunstad, J., Smith, T. B., Baker, M., Harris, T., and Stephenson, D. (2015). Loneliness and social isolation as risk factors for mortality: a meta-analytic review. Perspect Psychol. Sci. 10, 227–237. doi: 10.1177/1745691614568352
House, J. S., and Kahn, R. L. (1985). “Measures and concepts of social support,” in Social Support and Health, eds S. Cohen and S. L. Syme (New York, NY: Academic Press), 83–108.
Jayakody, D. M. P., Friedland, P. L., Martins, R. N., and Sohrabi, H. R. (2018). Impact of Aging on the Auditory System and Related Cognitive Functions: a Narrative Review. Front. Neurosci. 12:125. doi: 10.3389/fnins.2018.00125
Jayakody, D. M. P., Friedland, P. L., Nel, E., Martins, R. N., Atlas, M. D., and Sohrabi, H. R. (2017). Impact of Cochlear Implantation on Cognitive Functions of Older Adults: pilot Test Results. Otol. Neurotol. 38, e289–e295. doi: 10.1097/Mao.0000000000001502
Kamil, R. J., and Lin, F. R. (2015). The effects of hearing impairment in older adults on communication partners: a systematic review. J. Am. Acad. Audiol. 26, 155–182. doi: 10.3766/jaaa.26.2.6
Kaya, U. P., and Caydam, O. D. (2019). Association between Social Support and Diabetes Burden among Elderly Patients with Diabetes: a Cross-Sectional Study from Turkey. Saudi J. Med Med. Sci. 7, 86–92. doi: 10.4103/sjmms.sjmms_44_18
Kiessling, J., Pichora-Fuller, M. K., Gatehouse, S., Stephens, D., Arlinger, S., Chisolm, T., et al. (2003). Candidature for and delivery of audiological services: special needs of older people. Int. J. Audiol. 42, s92–s101. doi: 10.3109/14992020309074650
Kim, A. J., Beam, C. R., Greenberg, N. E., and Burke, S. L. (2020). Health Factors as Potential Mediators of the Longitudinal Effect of Loneliness on General Cognitive Ability. Am. J. Geriatr. Psychiatry 28, 1272–1283. doi: 10.1016/j.jagp.2020.07.017
Lemke, U., and Scherpiet, S. (2015). Oral communication in individuals with hearing impairment-considerations regarding attentional, cognitive and social resources. Front. Psychol. 6:998. doi: 10.3389/fpsyg.2015.00998
Lin, F. R., Metter, E. J., O’brien, R. J., Resnick, S. M., Zonderman, A. B., and Ferrucci, L. (2011). Hearing loss and incident dementia. Arch. Neurol. 68, 214–220. doi: 10.1001/archneurol.2010.362
Longman, J., Passey, M., Singer, J., and And Morgan, G. (2013). The role of social isolation in frequent and/or avoidable hospitalisation: rural community-based service providers’ perspectives. Aust. Health Rev. 37, 223–231. doi: 10.1071/ah12152
Lovibond, P. F., and Lovibond, S. H. (1995). The Structure of Negative Emotional States: Comparison of the Depression Anxiety Stress Scales (Dass) With the Beck Depression and Anxiety Inventories. Netherlands: Elsevier Science.
Luo, Y., Hawkley, L. C., Waite, L. J., and Cacioppo, J. T. (2012). Loneliness, health, and mortality in old age: a national longitudinal study. Soc. Sci. Med. 74, 907–914. doi: 10.1016/j.socscimed.2011.11.028
Maltz, D. N., and Borker, R. A. (1982). “A cultural approach to male–female miscommunication,” in A Cultural Approach to Interpersonal Communication: Essential Readings, eds L. Monaghan, J. E. Goodman, and J. M. Robinson (Malden, MA: Wiley-Blackwell), 168–185.
Mick, P., and Pichora-Fuller, M. K. (2016). Is Hearing Loss Associated with Poorer Health in Older Adults Who Might Benefit from Hearing Screening? Ear Hear. 37, e194–e201. doi: 10.1097/Aud.0000000000000267
Mick, P., Kawachi, I., and Lin, F. R. (2014). The association between hearing loss and social isolation in older adults. Otolaryngol. Head Neck Surg. 150, 378–384. doi: 10.1177/0194599813495815a228
Nelson, H. E., and Willison, J. R. (1991). The Revised National Adult Reading Test-Test Manual. Windsor: NFER-Nelson.
Nicholson, N. R. (2012). A Review of Social Isolation: an Important but Underassessed Condition in Older Adults. J. Prim. Prev. 33, 137–152. doi: 10.1007/s10935-012-0271-2
O’Súilleabháin, P. S., Gallagher, S., and Steptoe, A. (2019). Loneliness, Living Alone, and All-Cause Mortality: the Role of Emotional and Social Loneliness in the Elderly During 19 Years of Follow-Up. Psychosom. Med. 81, 521–526. doi: 10.1097/Psy.0000000000000710
Ozbay, F., Johnson, D. C., Dimoulas, E., Morgan, C. A., Charney, D., and And Southwick, S. (2007). Social support and resilience to stress: from neurobiology to clinical practice. Psychiatry 4, 35–40.
Pachana, N. A., Smith, N., Watson, M., Mclaughlin, D., and Dobson, A. (2008). Responsiveness of the Duke Social Support sub-scales in older women. Age Ageing 37, 666–672. doi: 10.1093/ageing/afn205
Pinquart, M., and Sörensen, S. (2003). “Risk factors for loneliness in adulthood and old age-a meta-analysis”, in Advances in Psychology Research, ed. S. P. Shohov (Hauppauge, NY: Nova Science Publishers), 111–143. doi: 10.1093/geronb/56.4.p195
Preminger, J. E., and Meeks, S. (2010). Evaluation of an audiological rehabilitation program for spouses of people with hearing loss. J. Am. Acad. Audiol. 21, 315–328. doi: 10.3766/jaaa.21.5.4
Pronk, M., Deeg, D. J., Smits, C., Twisk, J. W., Van Tilburg, T. G., Festen, J. M., et al. (2014). Hearing Loss in Older Persons: does the Rate of Decline Affect Psychosocial Health? J. Aging Health 26, 703–723. doi: 10.1177/0898264314529329
Pronk, M., Deeg, D. J., Smits, C., Van Tilburg, T. G., Kuik, D. J., Festen, J. M., et al. (2011). Prospective effects of hearing status on loneliness and depression in older persons: identification of subgroups. Int. J. Audiol. 50, 887–896. doi: 10.3109/14992027.2011.599871
Psychology Foundation of Australia (2014). Depression Anxiety Stress Scales (Dass). Australia: Psychology Foundation of Australia.
Saunders, G. H., Vercammen, C., Timmer, B. H. B., Singh, G., Pelosi, A., Meis, M., et al. (2021). Changing the narrative for hearing health in the broader context of healthy living: a call to action. Int. J. Audiol. 60, 86–91. doi: 10.1080/14992027.2021.1905892
Savikko, N., Routasalo, P., Tilvis, R. S., Strandberg, T. E., and Pitkälä, K. H. (2005). Predictors and subjective causes of loneliness in an aged population. Arch. Gerontol. Geriatr. 41, 223–233. doi: 10.1016/j.archger.2005.03.002
Scarinci, N., Worrall, L., and Hickson, L. (2008). The effect of hearing impairment in older people on the spouse. Int. J. Audiol. 47, 141–151. doi: 10.1080/14992020701689696
Shukla, A., Harper, M., Pedersen, E., Goman, A., Suen, J. J., Price, C., et al. (2020). Hearing Loss, Loneliness, and Social Isolation: a Systematic Review. Otolaryngol. Head Neck Surg. 162, 622–633. doi: 10.1177/0194599820910377
Stark, P., and Hickson, L. (2004). Outcomes of hearing aid fitting for older people with hearing impairment and their significant others. Int. J. Audiol. 43, 390–398. doi: 10.1080/14992020400050050
Stice, E., Ragan, J., and And Randall, P. (2004). Prospective Relations Between Social Support and Depression: differential Direction of Effects for Parent and Peer Support? J. Abnorm. Psychol. 113, 155–159. doi: 10.1037/0021-843X.113.1.155
Strawbridge, W. J., Wallhagen, M. I., Shema, S. J., and Kaplan, G. A. (2000). Negative consequences of hearing impairment in old age: a longitudinal analysis. Gerontologist 40, 320–326. doi: 10.1093/geront/40.3.320
Sung, Y. K., Li, L., Blake, C., Betz, J., and Lin, F. R. (2016). Association of Hearing Loss and Loneliness in Older Adults. J. Aging Health 28, 979–994. doi: 10.1177/0898264315614570
Valtorta, N. K., Kanaan, M., Gilbody, S., and And Hanratty, B. (2016). Loneliness, social isolation and social relationships: what are we measuring? A novel framework for classifying and comparing tools. BMJ Open 6:e010799. doi: 10.1136/bmjopen-2015-010799
Von Elm, E., Altman, D. G., Egger, M., Pocock, S. J., Gøtzsche, P. C., and Vandenbroucke, J. P. (2014). The Strengthening the Reporting of Observational Studies in Epidemiology (Strobe) Statement: guidelines for reporting observational studies. Int. J. Surg. 12, 1495–1499. doi: 10.1136/bmj.39335.541782.Ad
Wardian, J., Robbins, D., Wolfersteig, W., Johnson, T., and Dustman, P. (2013). Validation of the Dssi-10 to Measure Social Support in a General Population. Res. Soc. Work Pract. 23, 100–106. doi: 10.1177/1049731512464582
Weiss, R. S. (1973). Loneliness: the Experience of Emotional and Social Isolation. Cambridge: The Mit Press.
West, J. S. (2017). Hearing impairment, social support, and depressive symptoms among U.S. adults: a test of the stress process paradigm. Soc. Sci. Med. 192, 94–101. doi: 10.1016/j.socscimed.2017.09.031
Women’s Health Australia (2004). Duke Social Support Index Alswh Data Dictionary Supplement: Section 2 Core Survey Dataset: 2.7 Psychosocial Variables. Available Online at: https://alswh.org.au/ wp-content/uploads/2020/08/Ddssection2.7dssi.pdf [Accessed on Aprl 10, 2022].
World Health Organization [WHO] (2001). International Classification of Functioning, Disability and Health, ICF. Geneva: World Health Organization.
World Health Organization [WHO] (2021b). World Report on Hearing. Geneva: World Health Organization.
Yee, T. W. (2015). Vector Generalized Linear and Additive Models: With an Implementation in R. New York, USA: Springer.
Yee, T. W., and Wild, C. J. (1996). Vector Generalized Additive Models. J. R. Stat. Soc. 58, 481–493. doi: 10.1002/sim.1822
Zebhauser, A., Hofmann-Xu, L., Baumert, J., Häfner, S., Lacruz, E., Emeny, R., et al. (2014). How much does it hurt to be lonely? Mental and physical differences between older men and women in the Kora-Age Study. Int. J. Geriatr. Psychiatry 29, 245–252. doi: 10.1002/gps.3998
Zhang, D., Yang, Y., Wu, M., Zhao, X., Sun, Y., Xie, H., et al. (2018). The moderating effect of social support on the relationship between physical health and suicidal thoughts among Chinese rural elderly: a nursing home sample. Int. J. Ment. Health Nurs. 27, 1371–1382. doi: 10.1111/inm.12436
Keywords: hearing loss, social loneliness, emotional loneliness, social support, social interaction
Citation: Jayakody DMP, Wishart J, Stegeman I, Eikelboom R, Moyle TC, Yiannos JM, Goodman-Simpson J and Almeida OP (2022) Is There an Association Between Untreated Hearing Loss and Psychosocial Outcomes? Front. Aging Neurosci. 14:868673. doi: 10.3389/fnagi.2022.868673
Received: 03 February 2022; Accepted: 13 April 2022;
Published: 19 May 2022.
Edited by:
Rodolfo Sardone, National Institute of Gastroenterology S. de Bellis Research Hospital (IRCCS), ItalyReviewed by:
Antonio Daniele, Catholic University of the Sacred Heart, ItalyLidan Zheng, University of New South Wales, Australia
Copyright © 2022 Jayakody, Wishart, Stegeman, Eikelboom, Moyle, Yiannos, Goodman-Simpson and Almeida. This is an open-access article distributed under the terms of the Creative Commons Attribution License (CC BY). The use, distribution or reproduction in other forums is permitted, provided the original author(s) and the copyright owner(s) are credited and that the original publication in this journal is cited, in accordance with accepted academic practice. No use, distribution or reproduction is permitted which does not comply with these terms.
*Correspondence: Dona M. P. Jayakody, ZG9uYS5qYXlha29keUB1d2EuZWR1LmF1