Abstract
Objective:
Mild cognitive impairment (MCI) is a preclinical and transitional stage between healthy ageing and dementia. The purpose of our study was to investigate the recent pooled global prevalence of MCI.
Methods:
This meta-analysis was in line with the recommendations of Cochrane’s Handbook and Preferred Reporting Items for Systematic Reviews and Meta-Analyses (PRISMA) 2020. We conducted a comprehensive search using the PubMed, Embase, Web of Science, CNKI, WFD, VIP, and CBM from their inception to March 1, 2023. Quality assessment was guided by the Agency for Healthcare Research and Quality (AHRQ) methodology checklist. The pooled global prevalence of MCI was synthesized using meta-analysis via random effect model. Subgroup analyses were performed to examine considered factors potentially associated with MCI prevalence.
Results:
We identified 233 studies involving 676,974 individuals aged above 50 years. All the studies rated as moderated-to-high quality. The overall prevalence of MCI was 19.7% [95% confidence interval (95% CI): 18.3–21.1%]. Subgroup analyses revealed that the global prevalence of MCI increased over time, with a significant rise [32.1% (95% CI: 22.6–41.6%)] after 2019. Additionally, MCI prevalence in hospitals [34.0% (95% CI: 22.2–45.7%)] was higher than in nursing homes [22.6% (95% CI: 15.5–29.8%)] and communities [17.9% (95% CI: 16.6–19.2%)], particularly after the epidemic of coronavirus disease 2019 (COVID-19).
Conclusion:
The global prevalence of MCI was 19.7% and mainly correlated with beginning year of survey and sample source. The MCI prevalence increased largely in hospitals after 2019 may be related to the outbreak of COVID-19. Further attention to MCI is necessary in the future to inform allocation of health resources for at-risk populations.
1. Introduction
Mild cognitive impairment (MCI) is a condition characterized by mild cognitive deficit, while still retains the ability to perform daily living activities (Petersen et al., 2014). A recent review reported that up to 15.56% of community dwellers aged over 50 years were affected by MCI worldwide (Bai et al., 2022). MCI is considered as a symptomatic precursor of dementia, serving as an intermediate stage between normal aging and dementia. Over 46% of individuals with MCI progressed to clinical dementia within 3 years, which is one of the major causes of disability and dependency among older people (Trambaiolli et al., 2021). Therefore, MCI as predementia imposes potential economic burden on individuals, families, and society (Wang et al., 2022).
MCI is currently viewed as an “intervention window” for delaying the onset of dementia (Anderson, 2019; Liang et al., 2019; Wang et al., 2020). Understanding the global prevalence of MCI is essential for developing relevant strategies to prevent dementia. In recent years, several epidemiological studies have been conducted on MCI prevalence at different levels. For instance, Bai et al. revealed that the prevalence of MCI among community dwellers worldwide was over 15% and influenced by factors such as age, sex, educational level, and sample source (Bai et al., 2022). Deng et al. reported a prevalence rate of MCI in China was 15.4%, which was associated with unhealthy lifestyles such as alcohol consumption and lack of exercise, as well as health conditions like diabetes, hypertension, coronary heart disease, and depression (Deng et al., 2021). This information is crucial for developing prevention strategies aimed at addressing these risk factors. However, there are significant heterogeneities among previous studies. First, some studies may reveal the partial results when investigating the prevalence of MCI among the global population. On the one hand, differences in population characteristics could lead to variation in prevalence. Specifically, populations with the high-risk diseases, such as diabetes and depression, have a higher MCI prevalence (Hasche et al., 2010; Bo et al., 2015), which could affect the accuracy of total prevalence in healthy individuals. On the other hand, differences in geographical distribution could also affect the precision of global MCI prevalence when investigators omitted evidence from other geographical areas and sample source (Bai et al., 2022; Chen et al., 2023). Second, during the same period and in the same region, different studies have reported significant disparities in results. For instance, two studies from China in 2019 produced significantly different prevalence: one reported 9.67% (Ruan et al., 2020), while the other reported 27.8% (Lu et al., 2019). Similarly, two studies conducted 1 year apart reported nearly a threefold difference in MCI prevalence results in China: one reported 33.3% in 2015, while the other reported 10.42% in 2016 (McGrattan et al., 2021). These discrepancies may be attributed to variations in study design, such as search sources, screening tools, and diagnostic criteria for MCI. Lastly, the outbreak of the coronavirus disease 2019 (COVID-19) has significantly impacted society, affecting the lifestyle and health of everyone. There is evidence suggesting that some patients who have recovered from COVID-19 exhibit cognitive deficits (Liu et al., 2021; Crivelli et al., 2022). Consequently, the prevalence of neurological diseases, including MCI, may be even more severe as a result of COVID-19. However, whether COVID-19 has increased MCI prevalence remains unknown, highlighting the need for more updated research into the prevalence of MCI. Therefore, a comprehensive and updated meta-analysis on the global prevalence of MCI is urgently needed to identify the risk factors and provide a reference for researchers and clinicians. The purpose of this study is to investigate the recent global prevalence of MCI among the widest possible population.
2. Methods
This systematic review was conducted in accordance with the recommendations of Cochrane’s Handbook (Cumpston et al., 2019) and the Systematic Reviews and Meta-Analyses (PRISMA) 2020 (Page et al., 2021) (Supplementary File S2). These analyses relied solely on previously published studies, so ethical approval or patient consent was not required.
2.1. Search strategies
The eligible studies were identified through a comprehensive literature search in PubMed, Embase, Web of Science, CNKI, WFD, VIP, and CBM databases from their inception to March 1, 2023. A search strategy was employed using Medical Subject Headings (MeSH) terms associated with keywords and Boolean operators on “cognitive dysfunction,” “mild cognitive impairment,” “mild cognitive disorder,” “prevalence,” “epidemiology,” and “epidemiological study” et al. In addition, manual retrieval was performed on the reference lists of relevant reviews and meta-analysis to search for additional studies on MCI prevalence. All database specific search queries could be found in Supplementary File S1.
2.2. Inclusion and exclusion criteria
Inclusion criteria were developed based on the PICOS principle, including participants (P), outcomes (O), and study design (S):
-
Participants: Studies were included when participants were diagnosed with MCI using recognized criteria, such as Petersen criteria (P-MCI) (Ronald, 2011), Diagnostic and Statistical Manual of Mental Disorders (DSM) (Sharp, 2022), etc.
-
Outcomes: Prevalence of MCI (or any of MCI subtypes) or data regarding the prevalence of MCI were provided in the report. If multiple articles were published based on the same dataset, only the most recent study was included.
-
Study design: Our study included all types of cohort and cross-sectional studies without any restriction in language, region, or publication date.
Studies were excluded if they met the following conditions:
-
Participants: Studies involving other types of cognitive dysfunction, such as dementia.
-
Outcomes: Studies involving the prevalence of comorbidity with MCI, such as hypertension, coronary heart disease, and depression.
-
Study design: Randomized controlled trials (RCT), systematic reviews, meta-analysis, case–control studies, bibliographic review articles, letters to the editor, and articles published only in abstract form.
-
Full texts or data could not be obtained for our analyses.
2.3. Literature selection and data extraction
All citations were downloaded and managed using EndNote X9 software (Thompson ISI Research Soft, Clarivate Analytics, Philadelphia, United States). First, duplicate items were retrieved and removed. Then, based on inclusion and exclusion criteria, three investigators (WXS, YYZ, and HLX) independently reviewed the titles, abstracts, and full texts of publications to exclude irrelevant studies. All the eligible citations were cross-checked again to ensure accuracy. The relevant key data from the included studies were extracted into Microsoft Excel worksheets: (1) basic information: first author, publication year; (2) baseline characteristics: sample size, cases, age, proportion of males, beginning of survey, diagnostic criteria, region. The corresponding authors were consulted to obtain the essential information missing in the original studies.
2.4. Quality assessment
Three researchers (WXS, YYZ, and HLX) independently assessed the methodological quality of the included studies using the Agency for Healthcare Research and Quality (AHRQ) methodology checklist (Rostom et al., 2004). The checklist included 11 items: (I) Define the source of information; (II) List inclusion and exclusion criteria for exposed and unexposed subjects or provide a reference to previous publications that describe these criteria; (III) Indicate time period used for identifying patients; (IV) Indicate whether or not subjects were consecutive if not population-based; (V) Indicate if evaluators of subjective components of were masked to other aspects of the status of the participants; (VI) Describe any assessments undertaken for quality control purposes; (VII) Explain any patient exclusions from analysis; (VIII) Describe how confounding was assessed and/or controlled; (IX) If applicable, explain how missing data were handled in the analysis; (X) Summarize patient response rates and completeness of data collection; (XI) Clarify what follow-up, if any, was expected and the percentage of patients for which incomplete data or follow-up was obtained. The quality score for individual study ranges from 0 to 11, with 1 point for each item, and the study quality is separated into three levels: low (0–3), moderate (4–7), and high (8–11) (Hu et al., 2015). Any disagreements and uncertainty were resolved by discussion.
2.5. Statistical analyses
The overall prevalence and 95% confidence intervals (95% CI) was estimated using a random-effects model (Hedges, 1984). Heterogeneity was assessed by utilizing I2 statistics, with I2 > 50% or p < 0.1 indicating high heterogeneity (Higgins et al., 2003). A series of subgroup analyses were conducted to examine considered factors potentially associated with MCI prevalence. The subgroup variables included study type (cohort, cross-sectional), diagnostic method (P-MCI, DSM), male-to-female ratio (male/female ≥1, male/female <1), region1 (developing country, developed country), regions2 (Asia, Europe, North America, Africa, Oceania, South America), beginning year of survey (≤ 2009, 2010–2018, ≥ 2019), sample size (0–1,000, 1,001–5,000, 5,001–10,000, ≥10,001), sample source (community, nursing home, hospital), MCI subtype (aMCI/naMCI ≥1, aMCI/naMCI <1), basic diseases/non basic diseases (≥ 1, < 1) and the time trends in prevalence from different sample sources. Potential publication bias was assessed by using the funnel plot (Sedgwick, 2015) and Egger’s test (Egger et al., 2003). All the aforementioned sequences of analyses were performed in Stata version 15.0 (Nyaga et al., 2014) using “metan” and “metabias” packages.
3. Results
3.1. Literature selection
We initially obtained 143,006 studies, including 142,706 citations from databases and 300 additional studies from manual retrieval. Then, 33,931 studies were excluded for duplication, 108,457 articles were removed due to irrelevant titles and abstracts. Subsequently, 385 studies were excluded for various reasons: 66 were not available in full, 31 were non-observational studies (RCT, reviews, commentaries, systematic reviews, meta-analysis, conference abstracts, case reports), 159 had no available data, 83 had unclear diagnostic criteria, and 46 were reduplicated. Finally, 233 studies were included in this meta-analysis. The study selection process is shown in Figure 1. And all included studies in this systematic review and meta-analysis showed in Supplementary File S4.
Figure 1

The screening process of the literature.
3.2. Characteristics and quality of included studies
The 233 included studies were conducted between 1981 and 2021, enrolling 676,974 individuals aged from 50 to 107 years old. Most studies were cross-sectional studies (N = 207, 88.8%) and conducted in Asia (N = 171, 75.0%). The common diagnostic criteria for MCI was P-MCI (N = 150, 77.7%). Other detailed information on study characteristics is presented in Table 1.
Table 1
| ID | Study | Study design | Cases | Sample | Age, mean ± sd (range) | Proportion of males (%) | Beginning of survey | Diagnostic criteria | Region | Quality score |
|---|---|---|---|---|---|---|---|---|---|---|
| 1 | Björk et al. (2018) | Cross-sectional | 1,067 | 4,545 | 85.50 ± 7.80 | 36.41% | 2013–2014 | P-MCI | Swedish | 9 |
| 2 | Tiwari et al. (2013) | Cross-sectional | 98 | 2,146 | ≥60 | 47.44% | 2008–2010 | P-MCI | India | 8 |
| 3 | Rao et al. (2018) | Cross-sectional | 299 | 2,111 | ≥65 | 40.50% | 2009 | P-MCI | China | 8 |
| 4 | VancamPfort et al. (2017) | Cross-sectional | 5,005 | 32,715 | ≥50 | 48.30% | 2007–2010 | DSM-IV | China, Ghana, India, Mexico, Russia, South africa | 7 |
| 5 | Lu et al. (2019) | Cross-sectional | 1,541 | 5,542 | ≥60 | 46.26% | 2010 and 2015 | P-MCI | China | 7 |
| 6 | Su et al. (2013) | Cross-sectional | 145 | 796 | ≥60 | 32.79% | 2012 | P-MCI | China | 4 |
| 7 | Zhang et al. (2013) | Cross-sectional | 450 | 2,460 | 60–89 | 45.98% | NR | P-MCI | China | 5 |
| 8 | Zhang et al. (2015) | Cross-sectional | 651 | 1,971 | ≥60 | 37.44% | NR | DSM-IV | China | 6 |
| 9 | Li et al. (2013) | Cross-sectional | 332 | 3,484 | ≥65 | 41.30% | 2007–2009 | P-MCI | China | 9 |
| 10 | Guo et al. (2013) | Cross-sectional | 136 | 940 | ≥60 | 43.19% | NR | P-MCI | China | 6 |
| 11 | Yin et al. (2012) | Cross-sectional | 67 | 1,011 | ≥65 | 40.55% | 2007–2009 | P-MCI | China | 7 |
| 12 | Pan et al. (2012) | Cross-sectional | 154 | 897 | 69.68 ± 7.06 | 48.38% | 2011–2011 | P-MCI | China | 9 |
| 13 | Xia et al. (2006) | Cross-sectional | 16 | 145 | 67.96 ± 6.49 | 39.31% | 2000–2004 | DSM-IV | China | 7 |
| 14 | Yang et al. (2017) | Cross-sectional | 296 | 1,000 | 71.45 ± 5.86 | 48.60% | NR | P-MCI | China | 7 |
| 15 | Zhang et al. (2018) | Cohort study | 430 | 1,033 | ≥55 | 33.69% | 2016–2017 | P-MCI | China | 7 |
| 16 | Jiang et al. (2019) | Cross-sectional | 833 | 2,886 | 69.98 ± 5.90 | 41.61% | 2017 | P-MCI | China | 7 |
| 17 | Dai et al. (2019) | Cross-sectional | 201 | 1,184 | 67.96 ± 6.49 | 50.17% | 2019 | CDGM | China | 8 |
| 18 | Liu et al. (2019) | Cross-sectional | 73 | 554 | ≥60 | 64.80% | 2018 | CDGM | China | 9 |
| 19 | Yuan et al. (2019) | Cross-sectional | 199 | 1,032 | 66 ± 7 | 38.19% | 2015 | P-MCI | China | 6 |
| 20 | Yuan et al. (2021) | Cross-sectional | 613 | 3,043 | ≥60 | 51.36% | 2016 | P-MCI | China | 8 |
| 21 | Luo et al. (2015) | Cross-sectional | 554 | 3,063 | 70.00 ± 7.70 | 45.60% | 2010 | P-MCI | China | 6 |
| 22 | Xu et al. (2014) | Cross-sectional | 526 | 2,426 | 69.10 ± 6.80 | 39.30% | 2010–2011 | P-MCI | China | 8 |
| 23 | Tang et al. (2007) | Cross-sectional | 217 | 1,865 | 60–100 | 48.10% | 2004 | P-MCI | China | 6 |
| 24 | Gang et al. (2008) | Cross-sectional | 203 | 1,750 | 60–100 | 48.51% | 2004 | P-MCI | China | 8 |
| 25 | Huang et al. (2008) | Cross-sectional | 257 | 4,697 | ≥60 | 41.15% | 2001–2002 | P-MCI | China | 8 |
| 26 | Ren et al. (2013) | Cross-sectional | 99 | 946 | ≥60 | 50.74% | 2011 | DSM-IV | China | 8 |
| 27 | Zhou et al. (2011) | Cross-sectional | 107 | 1,227 | ≥60 | 43.68% | 2009–2010 | DSM-IV | China | 8 |
| 28 | Chen et al. (2015) | Cross-sectional | 352 | 1,695 | ≥60 | 46.90% | NR | P-MCI | China | 4 |
| 29 | Pan et al. (2012) | Cross-sectional | 67 | 287 | ≥60 | 42.86% | NR | P-MCI | China | 7 |
| 30 | Song et al. (2012) | Cross-sectional | 167 | 2,279 | ≥60 | 48.79% | 2010–2011 | P-MCI | China | 8 |
| 31 | Zhu et al. (2009) | Cross-sectional | 148 | 1,511 | ≥60 | 45.40% | 2008 | DSM-IV | China | 8 |
| 32 | Wu et al. (2012) | Cross-sectional | 396 | 1,583 | ≥60 | 50.28% | 2011–2012 | CDGM | China | 7 |
| 33 | Liao et al. (2012) | Cross-sectional | 41 | 399 | 60–92 | 46.37% | NR | P-MCI | China | 5 |
| 34 | Zhang et al. (2014) | Cross-sectional | 287 | 1,764 | ≥60 | 44.05% | 2012 | P-MCI | China | 7 |
| 35 | Afgin et al. (2012) | Cohort study | 303 | 944 | ≥65 | 49.30% | NR | DSM-IV | Israel | 10 |
| 36 | Artero et al. (2008) | Cohort study | 2,882 | 6,892 | ≥65 | 53.19% | 1991–2001 | DSM-IV | French | 9 |
| 37 | Lee et al. (2009) | Cohort study | 188 | 927 | ≥60 | 33.66% | 2005–2007 | P-MCI | Korea | 8 |
| 38 | Ogunniyi et al. (2016) | Cross-sectional | 111 | 613 | 72.90 ± 8.50 | 68.35% | 2013–2014 | DSM-IV and P-MCI | Nigerian | 9 |
| 39 | Petersen et al. (2010) | Cross-sectional | 329 | 1,969 | 70–89 | 50.89% | 2004–2007 | DSM-IV | United States | 11 |
| 40 | Pilleron et al. (2015) | Cohort study | 133 | 2,002 | ≥65 | NR | 2011–2012 | P-MCI | Central Africa | 6 |
| 41 | Richard et al. (2013) | Cohort study | 429 | 2,160 | NR | NR | 1999–2001 | P-MCI | United States | 8 |
| 42 | Kumar et al. (2005) | Cohort study | 93 | 2,518 | NR | NR | 2001–2002 | P-MCI | Australia | 9 |
| 43 | Lee et al. (2009) | Cohort study | 197 | 714 | 71.90 ± 5.70 | 42.16% | 2005 | P-MCI | Korea | 6 |
| 44 | Lee et al. (2012) | Cross-sectional | 67 | 318 | 65.90 ± 5.30 | 40.88% | 2008–2009 | P-MCI | Malaysian | 8 |
| 45 | Purser et al. (2005) | Cohort study | 810 | 3,673 | 74 | 38.69% | 1981, 1984, 1987, and 1990 | P-MCI | United States | 8 |
| 46 | De Jager et al. (2005) | Cohort study | 40 | 157 | NR | NR | NR | P-MCI | United Kingdom | 7 |
| 47 | Khedr et al. (2015) | Cross-sectional | 12 | 691 | ≥60 | NR | 2011–2013 | DSM-IV | Egypt | 7 |
| 48 | Yu et al. (2016) | Cohort study | 66 | 376 | 68.60 ± 4.70 | NR | NR | DSM-IV | China | 5 |
| 49 | Ma et al. (2016) | Cross-sectional | 574 | 5,241 | 72.13 ± 4.22 | 43.90% | 2012–2012 | P-MCI | China | 9 |
| 50 | Wang et al. (2015) | Cross-sectional | 625 | 3,136 | 69.30 ± 6.80 | 40.66% | 2012–2012 | P-MCI | China | 8 |
| 51 | Jia et al. (2013) | Cross-sectional | 2,137 | 10,276 | NR | 42.41% | 2008–2009 | DSM-IV | China | 9 |
| 52 | Hu et al. (2012) | Cross-sectional | 1,782 | 9,146 | 65.62 ± 7.52 | 43.83% | 2008–2009 | DSM-IV | China | 7 |
| 53 | Qiu et al. (2003) | Cross-sectional | 92 | 3,910 | 66.97 ± 8.44 | 49.68% | 2000–2001 | P-MCI | China | 8 |
| 54 | Lei et al. (2008) | Cross-sectional | 680 | 4,419 | 66.40 ± 5.60 | 41.68% | 2005 | The diagnostic criteria for MCI in Sweden, 2001 | China | 8 |
| 55 | Lao et al. (2011) | Cross-sectional | 326 | 7,665 | ≥55 | 45.78% | 2010 | P-MCI | China | 5 |
| 56 | Yang et al. (2011) | Cross-sectional | 337 | 454 | 72.67 ± 6.34 | 69.16% | 2009 | Chinese guidelines and P-MCI | China | 4 |
| 57 | Yin et al. (2011) | Cross-sectional | 310 | 2,164 | ≥60 | 45.84% | 2010 | P-MCI | China | 6 |
| 58 | Tong et al. (2013) | Cross-sectional | 200 | 1,575 | ≥60 | NR | 2012 | P-MCI | China | 6 |
| 59 | Xiong et al. (2013) | Cross-sectional | 339 | 2,978 | ≥65 | 44.12% | 2011 | DSM-IV | China | 7 |
| 60 | Zhang et al. (2013) | Cross-sectional | 450 | 2,460 | ≥60 | 45.98% | NR | P-MCI | China | 8 |
| 61 | Gu et al. (2014) | Cohort study | 92 | 679 | 60–91 | 44.33% | 2010–2013 | IWG | China | 7 |
| 62 | Qin et al. (2014) | Cross-sectional | 612 | 4,086 | ≥55 | 35.00% | 2011–2012 | P-MCI | China | 8 |
| 63 | Sun et al. (2016) | Cross-sectional | 40 | 384 | ≥65 | 52.08% | NR | IWG and ADNI | China | 4 |
| 64 | Zhou et al. (2016) | Cross-sectional | 221 | 804 | 60–88 | 46.52% | 2014–2015 | Chinese guidelines and P-MCI | China | 7 |
| 65 | Guo et al. (2012) | Cross-sectional | 35 | 264 | ≥65 | 50.76% | 2008–2009 | P-MCI | China | 8 |
| 66 | Jia et al. (2014) | Cross-sectional | 2,137 | 10,276 | ≥65 | 42.61% | 2008–2009 | DSM-IV | China | 8 |
| 67 | Li et al. (2013) | Cross-sectional | 160 | 1,020 | ≥55 | 36.67% | NR | P-MCI | China | 8 |
| 68 | Ding et al. (2015) | Cross-sectional | 601 | 2,985 | ≥60 | NR | 2010–2011 | DSM-IV | China | 8 |
| 69 | Xu et al. (2014) | Cross-sectional | 526 | 2,426 | ≥60 | 39.32% | 2010–2011 | P-MCI | China | 8 |
| 70 | Zanetti et al. (2006) | Cohort study | 65 | 400 | ≥65 | NR | 2000 | DSM-IV | Italy | 7 |
| 71 | Pioggiosi et al. (2006) | Cross-sectional | 11 | 34 | 96.40 ± 3.90 | 20.59% | 1994–1996 | DSM-IV | Italy | 7 |
| 72 | Manly et al. (2005) | Cohort study | 372 | 1,315 | ≥65 | 31.18% | NR | P-MCI | United States | 6 |
| 73 | Purser et al. (2005) | Cohort study | 810 | 3,673 | ≥65 | 38.69% | 1981–1991 | P-MCI | United States | 6 |
| 74 | Kim et al. (2007) | Cohort study | 388 | 1,215 | ≥60 | 42.80% | 2004–2006 | P-MCI | Korea | 8 |
| 75 | Jungwirth et al. (2005) | Cross-sectional | 41 | 592 | 75 | NR | 2002 | P-MCI | Australia | 7 |
| 76 | Das et al. (2007) | Cross-sectional | 111 | 745 | ≥50 | 49.26% | 2003–2004 | DSM-IV | India | 8 |
| 77 | Tognoni et al. (2005) | Cross-sectional | 79 | 1,600 | ≥65 | 40.38% | 2000–2001 | P-MCI | Italy | 8 |
| 78 | Boeve et al. (2003) | Cross-sectional | 13 | 111 | 90–99 | 20.72% | 1997–1999 | P-MCI | United States | 8 |
| 79 | Ganguli et al. (2004) | Cohort study | 40 | 1,248 | NR | 39.26% | 1987–2001 | P-MCI | United States | 7 |
| 80 | Ravaglia et al. (2008) | Cohort study | 72 | 865 | ≥65 | NR | 1999–2004 | IWG | United States | 8 |
| 81 | Xie et al. (2003) | Cross-sectional | 54 | 311 | ≥75 | 100% | 1998 | P-MCI | NR | 4 |
| 82 | Yu et al. (2003) | Cross-sectional | 216 | 2,674 | ≥60 | 60.96% | 2001 | DSM-IV | China | 6 |
| 83 | Wu et al. (2005) | Cross-sectional | 45 | 267 | ≥80 | 37.08% | NR | Chinese guidelines and P-MCI | China | 4 |
| 84 | Yang et al. (2008) | Cross-sectional | 647 | 3,175 | ≥60 | 38.33% | NR | Chinese guidelines and P-MCI | China | 4 |
| 85 | Liu et al. (2007) | Cross-sectional | 838 | 2,944 | ≥60 | 84.65% | NR | Chinese guidelines and P-MCI | China | 6 |
| 86 | Wada-isoe et al. (2012) | Cohort study | 211 | 723 | 77.80 ± 6.79 | NR | 2010 | IWG | Japan | 7 |
| 87 | Vlachos et al. (2020) | Cohort study | 243 | 1,960 | ≥65 | 40.61% | NR | P-MCI | Greece | 4 |
| 88 | Bickel et al. (2006) | Cross-sectional | 287 | 794 | 65–85 | 40.68% | NR | DSM-IV | German | 8 |
| 89 | Busse et al. (2003) | Cohort study | 116 | 1,045 | NR | NR | 1997–1998 | P-MCI | German | 6 |
| 90 | Rahman et al. (2009) | Cross-sectional | 104 | 268 | 60–76 | 54.48% | NR | DSM-IV | Egypt | 5 |
| 91 | Yu et al. (2003) | Cross-sectional | 216 | 2,674 | ≥60 | 60.96% | NR | P-MCI | China | 7 |
| 92 | Assaf et al. (2021) | Cross-sectional | 50 | 337 | ≥60 | 54.70% | NR | IWG | Lebanon | 8 |
| 93 | Eramudugolla et al. (2022) | Cohort study | 132 | 1,427 | 60–64 | 44.11% | NR | DSM-IV | Australia | 8 |
| 94 | Hussenoeder et al. (2020) | Cross-sectional | 110 | 903 | 86.50 ± 3.10 | 33.22% | 2003–2013 | IWG | Germany | 8 |
| 95 | Mooldijk et al. (2022) | Cohort study | 648 | 7,058 | ≥60 | 42.87% | 2002–2014 | P-MCI | Netherland | 8 |
| 96 | Nakahata et al. (2021) | Cross-sectional | 191 | 2,286 | 69 | NR | 2014–2017 | NIA-AA | Japan | 7 |
| 97 | Samson et al. (2022) | Cross-sectional | 255 | 506 | 55–93 | 47.23% | NR | P-MCI | United States | 8 |
| 98 | Lee et al. (2022) | Cross-sectional | 2,520 | 13,623 | ≥65 | 45.50% | 2007–2010 | DSM-IV | China, Ghana, India, Mexico, Russia, South Africa | 7 |
| 99 | Smith et al. (2022) | Cross-sectional | 5,005 | 32,715 | 50–65 | 48.30% | 2007–2010 | DSM-IV | China, Ghana, India, Mexico, Russia, South Africa | 7 |
| 100 | Xu et al. (2021) | Cross-sectional | 55 | 171 | 70.68 ± 7.92 | 49.12% | 2010–2010 | P-MCI | China | 7 |
| 101 | Yamane et al. (2022) | Cross-sectional | 61 | 865 | ≥65 | 38.96% | 2014–2017 | P-MCI | Japan | 4 |
| 102 | Yang et al. (2021) | Cross-sectional | 276 | 925 | 71.16 ± 4.41 | NR | NR | DSM-IV | China | 7 |
| 103 | Yu et al. (2022) | Cross-sectional | 86 | 163 | 81.20 ± 4.70 | 28.83% | 2018–2021 | ADNI | Spanish | 8 |
| 104 | Tang al. 2007 | Cross-sectional | 217 | 1,865 | ≥60 | 48.10% | 2004–2004 | P-MCI | China | 7 |
| 105 | Gjøra et al. (2021) | Cross-sectional | 3,382 | 9,663 | ≥70 | 43.25% | 2017–2019 | DSM-V | Swedish | 9 |
| 106 | Ramlall et al. (2013) | Cross-sectional | 38 | 140 | 75.20 ± 8.90 | 30.71% | NR | IWG | South Africa | 6 |
| 107 | Yang et al. (2019) | Cross-sectional | 318 | 2,015 | 79.5 | NR | 2014 | NIA-AA | China | 10 |
| 108 | Amoo et al. (2020) | Cross-sectional | 397 | 532 | 71.40 ± 8.86 | 35.30% | NR | P-MCI | Nigera | 5 |
| 109 | Bae et al. (2017) | Cross-sectional | 698 | 3,312 | NR | 44.17% | NR | IWG | Japan | 6 |
| 110 | Fernández-Blázquez et al. (2021) | Cross-sectional | 83 | 1,180 | 74.90 ± 3.90 | 36.44% | 2011 | NIA-AA | Spanish | 8 |
| 111 | Ganguli et al. (2010) | Cross-sectional | 697 | 1,982 | 77.60 ± 7.40 | 38.90% | NR | P-MCI | United States | 6 |
| 112 | González et al. (2019) | Cross-sectional | 5,851 | 59,714 | 63.00 ± 6.80 | 45.00% | NR | NIA-AA | Spanish | 8 |
| 113 | Guaita et al. (2015) | Cross-sectional | 65 | 1,321 | 71.68 ± 1.43 | 54.05% | NR | P-MCI | Italy | 8 |
| 114 | Heywood et al. (2017) | Cross-sectional | 507 | 2,599 | ≥55 | 36.24% | 2006–2009 | P-MCI | Singapore | 9 |
| 115 | Kivipelto et al. (2001) | Cross-sectional | 82 | 1,352 | 65–79 | 37.87% | NR | P-MCI | Finland | 6 |
| 116 | Lara et al. (2016) | Cross-sectional | 348 | 3,625 | 66.26 ± 0.18 | 45.32% | NR | NIA-AA | Spanish | 6 |
| 117 | Chong et al. (2019) | Cross-sectional | 158 | 1,209 | 68.08 ± 5.63 | 49.96% | NR | P-MCI | Malaysia | 6 |
| 118 | Das et al. (2007) | Cross-sectional | 111 | 745 | 66.75 ± 9.96 | 49.26% | 2003–2004 | P-MCI | India | 7 |
| 119 | Juarez- Cedillo et al. (2012) | Cross-sectional | 190 | 2,944 | 71.00 ± 7.10 | 42.19% | NR | P-MCI | Mexico | 7 |
| 120 | Ding et al. (2015) | Cross-sectional | 601 | 3,141 | 73.30 ± 8.60 | 45.78% | NR | P-MCI | China | 9 |
| 121 | Jia et al. (2014) | Cross-sectional | 2,137 | 13,806 | ≥65 | 31.72% | NR | P-MCI | China | 8 |
| 122 | Jia et al. (2020) | Cross-sectional | 7,215 | 46,011 | 70.00 ± 7.51 | 49.70% | 2015–2018 | NIA-AA | China | 11 |
| 123 | Anstey et al. (2013) | Cross-sectional | 141 | 2,551 | 68–72 | 39.98% | 1999–2007 | P-MCI | Australia | 8 |
| 124 | Dimitrov et al. (2012) | Cross-sectional | 37 | 605 | 73.20 ± 5.70 | 42.98% | NR | P-MCI | Bulgaria | 6 |
| 125 | Gavrila et al. (2009) | Cross-sectional | 88 | 1,074 | 74.30 ± 6.50 | 48.23% | 2003–2005 | P-MCI | Spanish | 6 |
| 126 | Han et al. (2017) | Cross-sectional | 305 | 755 | ≥65 | NR | 2012 | P-MCI | Korea | 7 |
| 127 | Hänninen et al. (2002) | Cross-sectional | 43 | 806 | 68.10 ± 4.50 | 39.83% | NR | P-MCI | Finland | 6 |
| 128 | Juncos-Rabadán et al. (2012) | Cross-sectional | 169 | 580 | ≥50 | 30.86% | NR | P-MCI | Spanish | 5 |
| 129 | Kim et al. (2011) | Cross-sectional | 1,455 | 6,141 | ≥65 | 39.81% | 2008 | P-MCI | Korea | 5 |
| 130 | Limongi et al. (2017) | Cross-sectional | 505 | 2,337 | 74 | 41.68% | 2002–2004 | P-MCI | Italy | 9 |
| 131 | Liu et al. (2022) | Cross-sectional | 122 | 1,010 | ≥60 | 31.49% | 2011–2016 | P-MCI | Singapore | 8 |
| 132 | Lopez-Anton et al. (2015) | Cross-sectional | 323 | 4,803 | ≥65 | NR | NR | DSM-IV | Spanish | 6 |
| 133 | Luck et al. (2007) | Cross-sectional | 499 | 3,242 | ≥75 | 34.42% | 2003–2004 | IWG | Germany | 9 |
| 134 | Mohan et al. (2019) | Cross-sectional | 111 | 426 | 69.90 ± 7.90 | 38.03% | 2012–2014 | P-MCI | India | 8 |
| 135 | Mooi et al. (2016) | Cross-sectional | 1,442 | 2,112 | 68.80 ± 6.10 | 48.58% | 2013–2014 | P-MCI | Malaysia | 8 |
| 136 | Moretti et al. (2013) | Cross-sectional | 3,351 | 7,930 | 61–107 | 39.66% | NR | IWG and P-MCI | Italy | 9 |
| 137 | Noguchi-Shinohara et al. (2013) | Cross-sectional | 107 | 650 | 76 | 40.46% | NR | IWG and P-MCI | Japan | 7 |
| 138 | Peltz et al. (2012) | Cross-sectional | 70 | 420 | ≥90 | 34.05% | 2003 and 2008 | DSM-IV | USA | 5 |
| 139 | Robertson et al. (2019) | Cross-sectional | 964 | 1,721 | ≥65 | 40.44% | 2008–2011 | DSM-IV | Canada | 6 |
| 140 | Sasaki et al. (2009) | Cross-sectional | 557 | 1,433 | ≥65 | NR | 2001–2002 | DSM-IV | Japan | 5 |
| 141 | Shahnawaz et al. (2013) | Cross-sectional | 299 | 767 | 70–90 | 43.55% | NR | IWG | Australia | 4 |
| 142 | Teh et al. (2021) | Cross-sectional | 32 | 2,165 | ≥60 | 45.87% | 2012–2013 | IWG and P-MCI | Singapore | 7 |
| 143 | Tsoy et al. (2019) | Cross-sectional | 201 | 662 | ≥60 | 24.32% | NR | IWG | Kazakhstan | 8 |
| 144 | Vlachos et al. (2020) | Cross-sectional | 243 | 1,960 | 73.46 ± 5.47 | 40.61% | NR | IWG and P-MCI | Greece | 6 |
| 145 | Liu et al. (2022) | Cross-sectional | 5,432 | 10,432 | ≥65 | 47.68% | 2011–2013 | ADNI | China | 7 |
| 146 | Su et al. (2014) | Cross-sectional | 145 | 796 | ≥60 | 32.79% | NR | P-MCI | China | 6 |
| 147 | Mías et al. (2007) | Cross-sectional | 102 | 418 | ≥50 | 22.01% | 2004–2005 | P-MCI | Argentina | 8 |
| 148 | Pedraza et al. (2017) | Cross-sectional | 421 | 1,235 | ≥50 | 24.78% | NR | P-MCI | Bogotá | 8 |
| 149 | Sánchez et al. (2019) | Cross-sectional | 63 | 352 | ≥60 | 27.05% | NR | P-MCI | Peru | 7 |
| 150 | Monteagudo Torres et al. (2009) | Cross-sectional | 19 | 201 | ≥60 | NR | 2006–2007 | P-MCI | Cuba | 6 |
| 151 | Wesseling et al. (2013) | Cross-sectional | 35 | 401 | ≥65 | 39.65% | 2010–2011 | P-MCI | Costa Rica | 7 |
| 152 | Li et al. (2020) | Cohort study | 535 | 3,135 | 71.58 ± 8.06 | NR | 2011–2012 | P-MCI | China | 9 |
| 153 | Rao et al. (2018) | Cross-sectional | 299 | 2,111 | ≥65 | 40.50% | NR | P-MCI | China | 7 |
| 154 | Sun et al. (2014) | Cross-sectional | 1,957 | 10,432 | ≥65 | 47.70% | NR | ADNI | China | 5 |
| 155 | Xiao et al. (2016) | Cohort study | 267 | 1,068 | 72.80 ± 8.50 | 42.23% | NR | P-MCI | China | 9 |
| 156 | Liu et al. (2018) | Cross-sectional | 317 | 1,796 | ≥60 | 46.05% | NR | DSM-IV | China | 6 |
| 157 | Wu et al. (2017) | Cross-sectional | 371 | 1,846 | 69.52 ± 6.86 | 46.64% | 2013–2014 | P-MCI | China | 8 |
| 158 | Chuang et al. (2021) | Cross-sectional | 82 | 470 | 71.20 ± 5.40 | 38.72% | 2017–2019 | NIA-AA | China | 7 |
| 159 | Janelidze et al. (2018) | Cross-sectional | 113 | 851 | 56.50 ± 11.80 | 37.02% | NR | DSM-IV | Georgia | 6 |
| 160 | Pilleron et al. (2015) | Cross-sectional | 266 | 2,002 | ≥65 | NR | 2011–2012 | P-MCI and DSM-IV | South Africa | 8 |
| 161 | Vancampfort et al. (2017) | Cross-sectional | 5,005 | 32,715 | 62.10 ± 15.60 | 48.30% | NR | P-MCI | China, Ghana, India, Mexico, Russia, South africa | 9 |
| 162 | Koyanagi et al. (2019) | Cross-sectional | 312 | 3,672 | ≥50 | 44.01% | 2007–2008 | P-MCI | South Africa | 7 |
| 163 | Li et al. (2013) | Cross-sectional | 160 | 1,020 | 63.90 ± 6.60 | 36.67% | NR | P-MCI | China | 8 |
| 164 | Kang et al. (2016) | Cross-sectional | 180 | 1,248 | ≥60 | 51.68% | 2015–2016 | P-MCI | China | 6 |
| 165 | Huang et al. (2021) | Cross-sectional | 1,830 | 5,103 | ≥55 | 44.95% | 2018–2019 | P-MCI | China | 6 |
| 166 | Bai et al. (2021) | Cross-sectional | 92 | 428 | 86.34 ± 3.57 | 28.97% | 2018–2019 | P-MCI | China | 6 |
| 167 | Lu et al. (2022) | Cross-sectional | 47 | 260 | ≥60 | 53.46% | 2021 | CGDM | China | 6 |
| 168 | Shi et al. (2019) | Cross-sectional | 175 | 513 | 40–98 | 86.74% | 2015–2019 | P-MCI | China | 6 |
| 169 | Liu et al. (2005) | Cross-sectional | 88 | 410 | ≥60 | 35.12% | 2004 | P-MCI | China | 5 |
| 170 | Sun et al. (2013) | Cross-sectional | 53 | 471 | 83.00 ± 3.50 | 97.45% | 2009–2010 | IWG and P-MCI | China | 7 |
| 171 | Hai et al. (2010) | Cross-sectional | 61 | 202 | 82.51 ± 2.14 | 74.26% | 2007 | IWG and P-MCI | China | 6 |
| 172 | Yuan et al. (2017) | Cross-sectional | 158 | 1,013 | 60–96 | 52.82% | 2014–2016 | P-MCI. | China | 8 |
| 173 | Ji et al. (2017) | Cross-sectional | 318 | 3,200 | ≥60 | 49.76% | NR | P-MCI | China | 4 |
| 174 | Wang et al. (2013) | Cross-sectional | 199 | 1,033 | ≥55 | 38.14% | NR | P-MCI | China | 6 |
| 175 | Zhao et al. (2015) | Cross-sectional | 171 | 976 | ≥60 | 46.82% | 2013–2014 | P-MCI | China | 5 |
| 176 | Li et al. (2013) | Cross-sectional | 115 | 1,226 | ≥60 | 46.74% | NR | P-MCI | China | 5 |
| 177 | Pan et al. (2020) | Cross-sectional | 214 | 1,012 | ≥60 | 47.23% | 2015 | P-MCI | China | 6 |
| 178 | Yu et al. (2012) | Cross-sectional | 168 | 1,086 | 84.80 ± 4.40 | 100% | 2010 | IWG | China | 7 |
| 179 | Yu et al. (2002) | Cross-sectional | 123 | 1,630 | 65–92 | 100% | 2001 | P-MCI | China | 6 |
| 180 | Cai et al. (2010) | Cross-sectional | 105 | 1,498 | ≥60 | NR | 2004–2005 | P-MCI | China | 7 |
| 181 | Chen et al. (2009) | Cross-sectional | 195 | 925 | ≥60 | 40.65% | NR | P-MCI | China | 5 |
| 182 | Zhang et al. (2013) | Cross-sectional | 86 | 321 | 81.55 ± 4.14 | 100% | 2009 | P-MCI | China | 6 |
| 183 | Sun et al. (2008) | Cross-sectional | 45 | 536 | 72.60 ± 5.60 | 79.85% | 2005 | P-MCI and DSM-IV | China | 5 |
| 184 | Yu et al. (2004) | Cross-sectional | 36 | 420 | 73.60 ± 5.60 | 74.29% | NR | P-MCI and DSM-IV | China | 4 |
| 185 | Zhang et al. (2008) | Cross-sectional | 104 | 586 | 75.92 ± 4.35 | 70.48% | 2005–2007 | P-MCI and DSM-IV | China | 6 |
| 186 | Jiang et al. (2019) | Cross-sectional | 833 | 2,886 | ≥60 | 41.61% | 2017–2017 | P-MCI and DSM-IV | China | 8 |
| 187 | Hu et al. (2012) | Cross-sectional | 1,782 | 9,146 | ≥55 | 43.83% | 2008–2009 | DSM-IV | China | 6 |
| 188 | Guo et al. (2013) | Cross-sectional | 178 | 1,367 | ≥60 | 49.60% | 2011 | DSM-IV | China | 5 |
| 189 | Li et al. (2015) | Cross-sectional | 260 | 1,971 | ≥60 | 37.39% | NR | DSM-IV | China | 5 |
| 190 | Fan et al. (2014) | Cross-sectional | 73 | 213 | 65.70 ± 6.08 | 36.15% | 2012 | P-MCI and DSM-IV | China | 5 |
| 191 | Lv et al. (2016) | Cross-sectional | 95 | 820 | 60–85 | 47.68% | NR | P-MCI and DSM-IV | China | 6 |
| 192 | Zhang et al. (2021) | Cross-sectional | 253 | 309 | 58.85 ± 0.58 | 53.40% | 2019 | P-MCI | China | 7 |
| 193 | Yuan et al. (2013) | Cross-sectional | 631 | 3,311 | ≥60 | 32.47% | NR | P-MCI | China | 6 |
| 194 | Fang et al. (2015) | Cross-sectional | 137 | 1,059 | ≥60 | 46.18% | NR | P-MCI | China | 5 |
| 195 | Pan et al. (2021) | Cross-sectional | 326 | 734 | ≥60 | 40.74% | 2019 | P-MCI | China | 5 |
| 196 | Tao et al. (2016) | Cross-sectional | 1,546 | 9,121 | 70.50 ± 7.68 | 53.95% | 2013–2014 | P-MCI | China | 7 |
| 197 | Li et al. (2021) | Cross-sectional | 177 | 413 | ≥60 | 41.65% | 2019 | P-MCI | China | 5 |
| 198 | Xu et al. (2001) | Cross-sectional | 417 | 1,516 | ≥65 | NR | NR | P-MCI | China | 5 |
| 199 | Zhou et al. (2020) | Cross-sectional | 49 | 114 | 81.30 ± 7.87 | 55.26% | 2018–2019 | P-MCI | China | 4 |
| 200 | Qiu et al. (2018) | Cross-sectional | 65 | 239 | 65.68 ± 6.16 | 49.79% | NR | P-MCI | China | 4 |
| 201 | Xia et al. (2011) | Cross-sectional | 47 | 20,367 | NR | NR | 2009–2019 | DSM-IV | China | 4 |
| 202 | Wang et al. (2015) | Cross-sectional | 236 | 718 | NR | 47.63% | 2013–2014 | ADNI | China | 4 |
| 203 | Zhang et al. (2020) | Cross-sectional | 260 | 1,614 | ≥60 | 60.22% | 2019–2019 | P-MCI | China | 4 |
| 204 | Gao et al. (2011) | Cross-sectional | 243 | 1,773 | ≥60 | 44.21% | 2010–2011 | P-MCI | China | 8 |
| 205 | Xue et al. (2010) | Cross-sectional | 93 | 1,713 | ≥60 | NR | 2006 | P-MCI | China | 6 |
| 206 | Zhou et al. (2010) | Cross-sectional | 136 | 1,065 | ≥60 | 43.29% | NR | DSM-IV | China | 5 |
| 207 | Liang et al. (2008) | Cross-sectional | 220 | 2,895 | ≥60 | 50.09% | NR | P-MCI | China | 4 |
| 208 | He et al. (2013) | Cross-sectional | 69 | 598 | 60–90 | 71.57% | 2011–2012 | P-MCI | China | 5 |
| 209 | Zhang et al. (2014) | Cross-sectional | 152 | 826 | 67.50 ± 7.03 | 60.65% | 2012 | P-MCI | China | 5 |
| 210 | Sun et al. (2012) | Cross-sectional | 131 | 505 | 75.91 ± 7.96 | 34.46% | 2011–2012 | P-MCI | China | 5 |
| 211 | Sun et al. (2019) | Cross-sectional | 402 | 2,105 | 74.35 ± 6.92 | 67.70% | 2018 | P-MCI | China | 6 |
| 212 | Xiong et al. (2013) | Cross-sectional | 339 | 2,978 | ≥65 | 44.12% | NR | Chinese guidelines and P-MCI | China | 4 |
| 213 | Zhao et al. (2015) | Cross-sectional | 174 | 1,598 | ≥60 | 54.26% | NR | DSM-IV | China | 5 |
| 214 | Sun et al. (2013) | Cross-sectional | 74 | 427 | 79.17 ± 7.22 | 38.64% | 2011 | P-MCI | China | 5 |
| 215 | Song et al. (2019) | Cross-sectional | 85 | 106 | 64.99 ± 7.05 | NR | 1987–2017 | Chinese guidelines and P-MCI | China | 6 |
| 216 | Wu et al. (2017) | Cross-sectional | 371 | 1,996 | 69.50 ± 6.86 | 46.39% | NR | P-MCI | China | 7 |
| 217 | Yang et al. (2016) | Cross-sectional | 340 | 1,218 | ≥65 | 44.01% | NR | Chinese guidelines and P-MCI | China | 5 |
| 218 | Su et al. (2016) | Cross-sectional | 145 | 796 | ≥60 | 32.79% | NR | P-MCI | China | 5 |
| 219 | Xiang et al. (2009) | Cross-sectional | 72 | 532 | ≥60 | 47.37% | NR | Chinese guidelines and P-MCI | China | 5 |
| 220 | Xu et al. (2010) | Cross-sectional | 571 | 2,161 | ≥60 | 50.49% | 2007–2009 | Chinese guidelines and P-MCI | China | 6 |
| 221 | Ma et al. (2019) | Cross-sectional | 224 | 1,005 | ≥60 | 41.69% | 2017–2018 | P-MCI | China | 5 |
| 222 | An et al. (2020) | Cross-sectional | 396 | 3,247 | 71.58 ± 5.41 | 45.64% | 2019 | Chinese guidelines and P-MCI | China | 6 |
| 223 | Yang et al. (2019) | Cross-sectional | 319 | 2,015 | ≥65 | NR | 2014 | NIA-AA | China | 7 |
| 224 | Liu et al. (2022) | Cross-sectional | 69 | 476 | ≥60 | 45.38% | 2018–2021 | CDGM | China | 7 |
| 225 | Wang et al. (2017) | Cross-sectional | 209 | 1,781 | ≥60 | 39.53% | 2015 | P-MCI | China | 6 |
| 226 | Wang et al. (2017) | Cross-sectional | 25 | 84 | ≥60 | 60.71% | 2015 | P-MCI | China | 6 |
| 227 | Liu et al. (2021) | Cross-sectional | 64 | 287 | ≥65 | 50.17% | 2019–2020 | Chinese guidelines and P-MCI | China | 6 |
| 228 | Zhou et al. (2013) | Cross-sectional | 59 | 218 | ≥60 | 49.08% | 2012 | Chinese guidelines and P-MCI | China | 5 |
| 229 | Jia et al. (2020) | Cross-sectional | 87 | 255 | >80 | 100% | NR | P-MCI | China | 5 |
| 230 | Song et al. (2011) | Cross-sectional | 11 | 88 | 74–89 | 44.32% | NR | COMD-3 | China | 4 |
| 231 | Xu et al. (2016) | Cross-sectional | 24 | 206 | ≥75 | 100% | 2012 | DSM-IV | China | 6 |
| 232 | Ma et al. (2017) | Cross-sectional | 148 | 895 | ≥60 | 48.94% | NR | ADNI | China | 5 |
| 233 | Zhang et al. (2014) | Cross-sectional | 287 | 1,764 | ≥60 | 44.05% | 2012 | Chinese guidelines and P-MCI | China | 6 |
Characteristics of studies included in this meta-analysis.
The number of amnestic MCI (aMCI) and no amnestic MCI (naMCI) were reported in these studies.
①NR, not reported; ②P-MCI, classical Petersen’s criteria of MCI; ③DSM, diagnostic and statistical manual of mental disorders; ④ANDI, Alzheimer’s disease neruimaging initiative; ⑤NIA-AA, the National Institute on Aging-Alzheimer’s Association; ⑥CDGM, Chinese guidelines for diagnosis and management of cognitive impairment and dementia; ⑦IWG, international working group; ⑧COMD-3, the spirit of China disorders classification and diagnostic criteria, third edition.
Study quality assessment scores ranged from 4 to 11, with 76 studies (32.6%) rated as “high quality” and 157 studies (67.4%) rated as “moderate quality.” All the 233 studies scored no less than 3, so no study was excluded. Further details of the quality assessment are shown in Supplementary File S3.
3.3. Prevalence of MCI
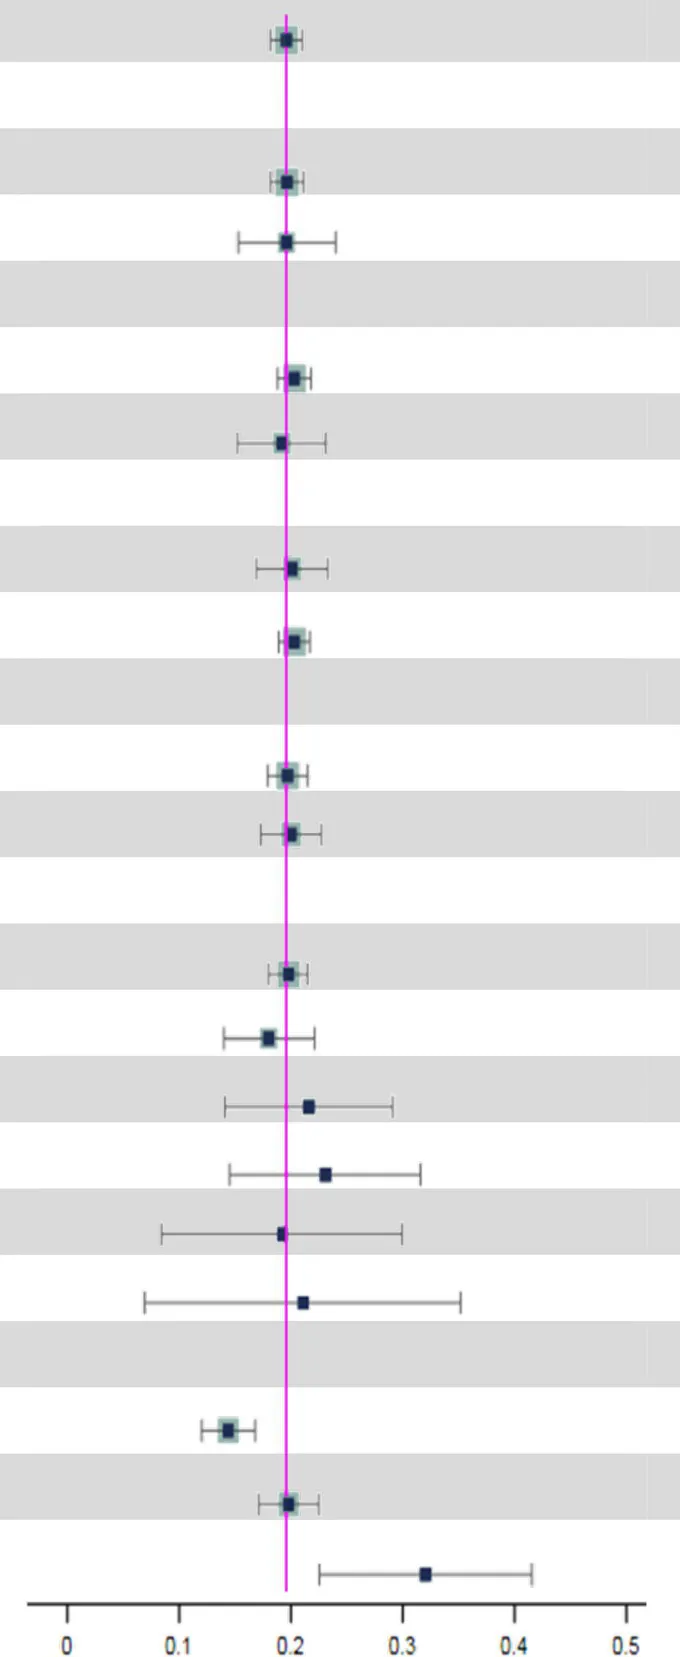
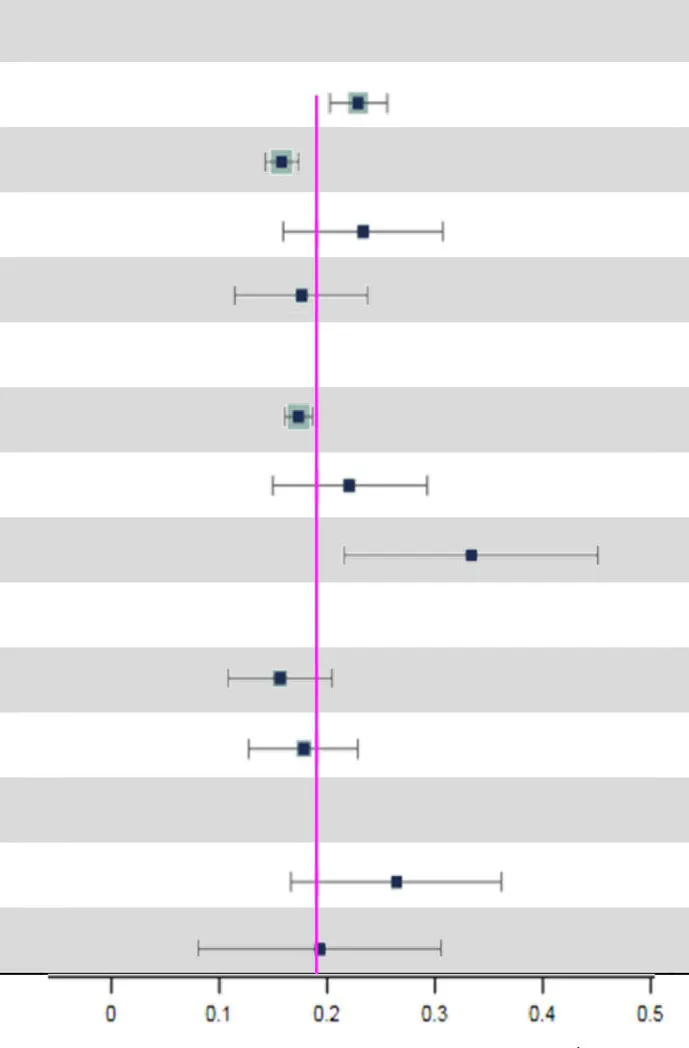
A total of 233 studies were included in the analysis of overall pooled prevalence of MCI via a random effect model. The total global prevalence of MCI was 19.7% [(95% CI: 18.3–21.1%), p-value1 < 0.001, I2 = 99.80%], showing significant heterogeneity among studies. The funnel plot and Egger’s test (P-Egger’s test < 0.001) both detected potential publication bias among the pooled results (Figure 2).
Figure 2

Funnel plot of pooled prevalence of MCI.
3.4. Subgroup analyses
Subgroup analyses indicated that the possible sources of heterogeneity were the sample source and beginning year of survey. The total prevalence of MCI in hospitals [34.0% (95% CI: 22.2–45.7%)] was the highest compared to that in nursing homes [22.6% (95% CI: 15.5–29.8%)] and communities [17.9% (95% CI: 16.6–19.2%)]. Moreover, MCI prevalence increased significantly over time. In particular, the global prevalence rose sharply after 2019 [32.1% (95% CI: 22.6–41.6%)] compared to the rates between 2010 and 2018 [19.8% (95% CI: 17.1–22.5%)] and before 2009 [14.5% (95% CI: 12.1–16.9%)]. Subsequently, we conducted further subgroup analyses to explore the time trends in prevalence from different sample sources (Table 2). Surprisingly, there were no significant differences in MCI prevalence among hospitals, nursing homes and communities before 2019. However, the MCI prevalence in hospitals [61.7% (95% CI: 27.8–95.7%)] was significantly higher than in nursing homes [16.1% (95% CI: 14.3–17.9%)] and communities [25.3% (95% CI: 17.4–33.2%)] after 2019. Additionally details of the subgroup analyses can be found in Table 3.
Table 2
| Subgroup | No. of cases | No. of samples | Prevalence, 95%CI (%) | p-value1 | p-value2 |
|---|---|---|---|---|---|
| ≤ 2009 | 0.228 | ||||
| Community | 18,914 | 106,057 | 15.8 (13.0–18.6) | <0.001 | |
| Nursing home | 356 | 3,460 | 13.1 (9.4–16.8) | <0.001 | |
| Hospital | 1,513 | 23,330 | 35.7 (4.2–67.1) | 0.026 | |
| 2010–2018 | 0.565 | ||||
| Community | 33,245 | 169,301 | 18.7 (15.7–21.6) | <0.001 | |
| Nursing home | 999 | 9,438 | 27.7 (11.4–44.0) | 0.001 | |
| Hospital | 1,163 | 6,087 | 18.8 (13.8–23.8) | <0.001 | |
| ≥ 2019 | 0.003 | ||||
| Community | 934 | 5,505 | 25.3 (17.4–33.2) | <0.001 | |
| Nursing home | 260 | 1,614 | 16.1 (14.3–17.9) | <0.001 | |
| Hospital | 579 | 1,054 | 61.7 (27.8–95.7) | <0.001 |
The time trends in MCI prevalence from different sample sources.
p-value1 is the p-value within subgroups; p-value2 is the p-value across subgroups; 95%CI, 95% confidence interval.
Table 3
| Subgroup | No. study | No. of cases | No. of sample | Prevalence, 95%CI (%) | p-value1 | p-value2 | |
|---|---|---|---|---|---|---|---|
| Overall | 233 | 115,958 | 676,974 |
|
19.7 (18.3–21.1) | <0.001 | |
| Study type | 0.976 | ||||||
| Cross-sectional | 207 | 106,067 | 627,798 | 19.7 (18.2–21.2) | <0.001 | ||
| Cohort | 26 | 9,891 | 49,176 | 19.6 (15.3–24.0) | <0.001 | ||
| Diagnostic method | 0.786 | ||||||
| P-MCI | 150 | 54,227 | 309,548 | 20.1 (18.5–21.6) | <0.001 | ||
| DSM | 43 | 34,003 | 196,537 | 19.5 (15.7–23.3) | <0.001 | ||
| Male to female Ratio | 0.918 | ||||||
| Male/female ≥1 | 43 | 11,351 | 57,164 | 20.1 (16.9–23.3) | <0.001 | ||
| Male/female <1 | 164 | 99,214 | 560,490 | 20.3 (18.9–21.7) | <0.001 | ||
| Region1 | 0.856 | ||||||
| Developing country | 168 | 66,411 | 382,725 | 19.7 (17.9–21.5) | <0.001 | ||
| Developed country | 60 | 31,958 | 182,170 | 20.0 (17.3–22.7) | <0.001 | ||
| Region2 | 0.909 | ||||||
| Asia | 171 | 70,205 | 400,010 | 19.8 (18.0–21.5) | <0.001 | ||
| Europe | 27 | 20,703 | 125,743 | 18.0 (14.0–22.1) | <0.001 | ||
| North America | 14 | 4,599 | 18,936 | 21.6 (14.1–29.1) | <0.001 | ||
| Africa | 8 | 1,251 | 9,192 | 23.1 (14.5–31.6) | <0.001 | ||
| Oceania | 4 | 713 | 5,337 | 19.3 (8.5–30.0) | <0.001 | ||
| South America | 4 | 898 | 5,677 | 21.2 (7.0–35.3) | 0.003 | ||
| Beginning year of Survey | <0.001 | ||||||
| ≤ 2009 | 54 | 162,314 | 20,548 | 14.5 (12.1–16.9) | <0.001 | ||
| 2010–2018 | 72 | 195,203 | 40,908 | 19.8 (17.1–22.5) | <0.001 | ||
| ≥ 2019 | 9 | 2,025 | 10,024 | 32.1 (22.6–41.6) | <0.001 | ||
| Sample size |
|
<0.001 | |||||
| 0–1,000 | 94 | 10,760 | 48,769 | 23.5 (20.9–26.2) | <0.001 | ||
| 1,001–5,000 | 115 | 39,651 | 246,475 | 16.4 (14.9–18.0) | <0.001 | ||
| 5,001–10,000 | 12 | 21,099 | 88,648 | 23.9 (16.5–31.3) | <0.001 | ||
| ≥10,001 | 12 | 44,448 | 293,082 | 18.2 (12.0–24.3) | <0.001 | ||
| Sample source | 0.014 | ||||||
| Community | 170 | 84,742 | 498,057 | 17.9 (16.6–19.2) | <0.001 | ||
| Nursing home | 21 | 8,754 | 30,251 | 22.6 (15.5–29.8) | <0.001 | ||
| Hospital | 16 | 3,541 | 31,239 | 34.0 (22.2–45.7) | <0.001 | ||
| MCI subtype | 0.555 | ||||||
| aMCI/naMCI ≥1 | 17 | 7,174 | 41,589 | 16.2 (11.4–21.0) | <0.001 | ||
| aMCI/naMCI <1 | 5 | 1,252 | 6,535 | 18.4 (13.3–23.4) | <0.001 | ||
| Basic diseases/Non basic diseases | 0.349 | ||||||
| ≥ 1 | 7 | 2,026 | 10,049 | 27.0 (17.2–36.7) | <0.001 | ||
| < 1 | 6 | 3,211 | 15,800 | 19.9 (8.6–31.1) | 0.001 | ||
Subgroup analyses of MCI prevalence.
p-value1 is the p-value within subgroups; p-value2 is the p-value across subgroups; Region1 is classified according to developed/developing countries; Region2 is based on the region of each country.
①95%CI, 95% confidence interval; ②P-MCI, classical Petersen’s criteria of MCI; ③DSM, diagnostic and statistical manual of mental disorders; ④MCI, mild cognitive impairment.
4. Discussion
Previous studies revealed partial results when investigating the prevalence of MCI with different degrees of limitation. In our study, we conducted an extensive literature search based on seven electronic databases and manual retrieval, ultimately identifying 233 studies with a total of 115,958 participants. Furthermore, we included more variables of interest into subgroup analyses, such as sample source, basic diseases, the beginning year of survey, and others. Considering the COVID-19 pandemic period, we attached importance to the MCI prevalence before and after 2019. To our knowledge, this is the most recent meta-analysis to provide a comprehensive overview of MCI prevalence without any limitations in age or region.
We concluded that the global total prevalence of MCI is 19.7% (95% CI: 18.3–21.1%) among 233 included studies. In addition, Subgroup analyses revealed that the sample source and beginning year of survey were considered factors potentially associated with MCI prevalence (p-value2 < 0.05) (Table 3).
On the one hand, the prevalence of MCI patients in hospitals [34.0% (95% CI: 22.2–45.7%)] was higher than those in nursing homes [22.6% (95% CI: 15.5–29.8%)] and communities [17.9% (95% CI: 16.6–19.2%)]. Several previous studies also draw the consistent conclusions. For example, Xue et al. reported that clinical patients [16.72% (95% CI: 15.6–17.7%)] have a higher MCI prevalence than nonclinical patients [14.61% (95% CI: 14.4–14.8%)] (Xue et al., 2018). The higher MCI prevalence in hospitals may be attributed to professional diagnosis and treatment procedures. Meanwhile, patients in hospitals have more apparent clinical symptoms of MCI and receive more attention from clinicians, which greatly improves the detection rate of MCI. Similarly, the population in nursing homes [21.2% (95% CI: 18.7–23.6%)] have a higher MCI prevalence than community dwellers [5.56% (95% CI: 13.2–18.0%)] (Bai et al., 2022; Chen et al., 2023). Compared to those living in nursing homes, people living in the communities have better material and emotional support from their families, which might make a difference in reducing MCI prevalence.
On the other hand, we found that the total prevalence of MCI increased over time, especially after 2019. Notably, before 2019, there were no significant differences in MCI prevalence among three sample sources. However, the MCI prevalence after 2019 in hospitals [61.7% (95% CI: 27.8–95.7%)] was significantly higher than those in nursing homes [16.1% (95% CI: 14.3–17.9%)] and communities [25.3% (95% CI: 17.4–33.2%)] (Table 2). Since the COVID-19 outbreak globally in 2019, hospital with the support of limited health resources and medical personnel with professional clinical knowledge has become the main refuge for COVID-19 patients (Kadri et al., 2020; Wadhera et al., 2020). There is cumulative evidence suggesting that COVID-19 impacts brain function and is associated with an elevated risk of neurodegenerative conditions, including cognitive dysfunction (Miners et al., 2020; Nath, 2020; Alquisiras-Burgos et al., 2021). Various post-COVID-19 symptoms indicate that coronaviruses, including SARS-CoV-2, could infect the central nervous system (CNS) through hematogenous pathways or neuronal retrograde neuro-invasion. This infiltration leads to subsequent microglial activation and enduring neuroinflammation, with dysregulated neuro-immunity serving as a foundational cause of nerve cell damage (Ellul et al., 2020; Troyer et al., 2020). Supporting the theory that COVID-19 can influence and exacerbate cognitive dysfunction, our data reveals a notable spike in the prevalence of MCI in hospitals post-2019. However, this rate may be conservative. The causes for this speculation are likely multifactorial, such as patients avoidance of emergency care due to fear of COVID-19 or the increased threshold for hospitalization of non-COVID-19 patients by clinicians due to the severity and urgency of COVID-19 (Blecker et al., 2021), which could masks the true prevalence. Therefore, more studies are needed in the future to investigate the potential link between COVID-19 and MCI.
5. Strengths and limitations
Based on previous research, this meta-analysis is the latest meta-analysis to provide a comprehensive overview of MCI prevalence without any age and regional limitations. This meta-analysis may aid policymakers, clinicians in making decisions and clinical directions, thus facilitating future studies and clinical applications. Our study, including the most extensive information currently available, is the first to analyze the association between COVID-19 and global MCI prevalence. However, there are also some limitations. First, the included data is unevenly distributed across regions. A large number of studies have been included from Asia, Europe, and North America, while relatively few have been included from Africa, Oceania, and South America. This unbalanced distribution of literature across regions may introduce bias in subgroups. Naturally, due to the vast amount of data included, our study unavoidably presents significant publication bias. Finally, the MCI prevalence in post-COVID-19 era still requires further investigation to provide more accurate evidence for the allocation of medical and health resources.
6. Conclusion
Our systematic review indicates that the current pooled global prevalence of Mild Cognitive Impairment (MCI) stands at 19.7%. Notably, we found a significant correlation between beginning year of survey and the global prevalence of MCI, with prevalence rates rising significantly after 2019. Furthermore, it is noteworthy that the prevalence of MCI in hospital settings outstripped those in nursing homes and community settings, especially after 2019. This trend may be in part attributable to the outbreak of COVID-19. The potential connection between COVID-19 and MCI warrants further investigation in future studies. Lastly, we posit that our review holds substantial value for policymakers and clinicians. The insights gleaned can guide health-related decision-making processes and inform the strategic allocation of health resources to better serve patients with MCI.
Statements
Data availability statement
The original contributions presented in the study are included in the article/Supplementary material, further inquiries can be directed to the corresponding authors.
Author contributions
J-hL, JC, and S-xX conceived and designed the study. W-xS and W-wW performed the data analysis and wrote the manuscript. Y-yZ, H-lX, S-yJ, and G-cC assessed the literature and extracted the data. All authors contributed to the article and approved the submitted version.
Funding
This study was supported by the National Natural Science Foundation of China (82174316), Shenzhen Medical and Health Three Projects (SZZYSM202106006), National TCM Clinical Research Base Construction Project [No. State TCM Science and Technology Letter (2018) No. 131], Shaoxiang Xian National Famous Elder TCM Experts Inheritance Studio [State TCM Human Education Letter (2022) No. 75], Basic and Applied Research of Guangzhou Municipal University Joint Funding Project (202201020342), Qihuang Scholar Training program and Guangzhou Science and Technology Bureau 2022 Key R&D Project (2060404).
Acknowledgments
We affirm that the work submitted for publication is original and has not been published other than as an abstract or preprint in any language or format and has not been submitted elsewhere for print or electronic publication consideration. We affirm that each person listed as the author participated in the work in a substantive manner, in accordance with ICMJE authorship guidelines, and is prepared to take public responsibility for it. All authors consent to the investigation of any improprieties that may be alleged regarding the work.
Conflict of interest
The authors declare that the research was conducted in the absence of any commercial or financial relationships that could be construed as a potential conflict of interest.
Publisher’s note
All claims expressed in this article are solely those of the authors and do not necessarily represent those of their affiliated organizations, or those of the publisher, the editors and the reviewers. Any product that may be evaluated in this article, or claim that may be made by its manufacturer, is not guaranteed or endorsed by the publisher.
Supplementary material
The Supplementary material for this article can be found online at: https://www.frontiersin.org/articles/10.3389/fnagi.2023.1227112/full#supplementary-material
References
1
Alquisiras-Burgos I. Peralta-Arrieta I. Alonso-Palomares L. A. Zacapala-Gómez A. E. Salmerón-Bárcenas E. G. Aguilera P. (2021). Neurological complications associated with the blood-brain barrier damage induced by the inflammatory response during SARS-CoV-2 infection. Mol. Neurobiol.58, 520–535. doi: 10.1007/s12035-020-02134-7
2
Anderson N. D. (2019). State of the science on mild cognitive impairment (MCI). CNS Spectr.24, 78–87. doi: 10.1017/S1092852918001347
3
Bai W. Chen P. Cai H. Zhang Q. Su Z. Cheung T. et al . (2022). Worldwide prevalence of mild cognitive impairment among community dwellers aged 50 years and older: a meta-analysis and systematic review of epidemiology studies. Age Ageing51:afac173. doi: 10.1093/ageing/afac173
4
Blecker S. Jones S. A. Petrilli C. M. Admon A. J. Weerahandi H. Francois F. et al . (2021). Hospitalizations for chronic disease and acute conditions in the time of COVID-19. JAMA Intern. Med.181, 269–271. doi: 10.1001/jamainternmed.2020.3978
5
Bo M. Gallo S. Zanocchi M. Maina P. Balcet L. Bonetto M. et al . (2015). Prevalence, clinical correlates, and use of glucose-lowering drugs among older patients with type 2 diabetes living in long-term care facilities. J. Diabetes Res.2015:174316, 1–5. doi: 10.1155/2015/174316
6
Chen P. Cai H. Bai W. Su Z. Tang Y. L. Ungvari G. S. et al . (2023). Global prevalence of mild cognitive impairment among older adults living in nursing homes: a meta-analysis and systematic review of epidemiological surveys. Transl. Psychiatry13:88. doi: 10.1038/s41398-023-02361-1
7
Crivelli L. Palmer K. Calandri I. Guekht A. Beghi E. Carroll W. et al . (2022). Changes in cognitive functioning after COVID-19: A systematic review and meta-analysis. Alzheimers Dement.18, 1047–1066. doi: 10.1002/alz.12644
8
Cumpston M. Li T. Page M. J. Chandler J. Welch V. A. Higgins J. P. et al . (2019). Updated guidance for trusted systematic reviews: a new edition of the Cochrane handbook for systematic reviews of interventions. Cochrane Database Syst. Rev.10:ED000142. doi: 10.1002/14651858.ED000142
9
Deng Y. Zhao S. Cheng G. Yang J. Li B. Xu K. et al . (2021). The prevalence of mild cognitive impairment among Chinese people: a Meta-analysis. Neuroepidemiology55, 79–91. doi: 10.1159/000512597
10
Egger M. Juni P. Bartlett C. Holenstein F. Sterne J. (2003). How important are comprehensive literature searches and the assessment of trial quality in systematic reviews? Empirical study. Health Technol. Assess.7, 1–82. doi: 10.3310/hta7010
11
Ellul M. A. Benjamin L. Singh B. Lant S. Michael B. D. Easton A. et al . (2020). Neurological associations of COVID-19. Lancet Neurol.19, 767–783. doi: 10.1016/S1474-4422(20)30221-0
12
Hasche L. K. Morrow-Howell N. Proctor E. K. (2010). Quality of life outcomes for depressed and nondepressed older adults in community long-term care. Am. J. Geriatr. Psychiatry18, 544–553. doi: 10.1097/JGP.0b013e3181cc037b
13
Hedges L. V. (1984). Advances in statistical methods for meta-analysis. New Dir. Prog. Eval.1984, 25–42. doi: 10.1002/ev.1376
14
Higgins J. P. T. Thompson S. G. Deeks J. J. Altman D. G. (2003). Measuring inconsistency in meta-analyses. BMJ327, 557–560. doi: 10.1136/bmj.327.7414.557
15
Hu J. Dong Y. Chen X. Liu Y. Ma D. Liu X. et al . (2015). Prevalence of suicide attempts among Chinese adolescents: a meta-analysis of cross-sectional studies. Compr. Psychiatry61, 78–89. doi: 10.1016/j.comppsych.2015.05.001
16
Kadri S. S. Gundrum J. Warner S. Cao Z. Babiker A. Klompas M. et al . (2020). Uptake and accuracy of the diagnosis code for COVID-19 among US hospitalizations. JAMA324, 2553–2554. doi: 10.1001/jama.2020.20323
17
Liang J. H. Shen W. T. Li J. Y. Qu X. Y. Li J. Jia R. X. et al . (2019). The optimal treatment for improving cognitive function in elder people with mild cognitive impairment incorporating Bayesian network meta-analysis and systematic review. Ageing Res. Rev.51, 85–96. doi: 10.1016/j.arr.2019.01.009
18
Liu Y. H. Wang Y. R. Wang Q. H. Chen Y. Chen X. Li Y. et al . (2021). Post-infection cognitive impairments in a cohort of elderly patients with COVID-19. Mol. Neurodegener.16:48. doi: 10.1186/s13024-021-00469-w
19
Lu H. Wang X.-D. Shi Z. Yue W. Zhang Y. Liu S. et al . (2019). Comparative analysis of cognitive impairment prevalence and its etiological subtypes in a rural area of northern China between 2010 and 2015. Sci. Rep.9:851. doi: 10.1038/s41598-018-37286-z
20
McGrattan A. M. Zhu Y. Richardson C. D. Mohan D. Soh Y. C. Sajjad A. et al . (2021). Prevalence and risk of mild cognitive impairment in low and middle-income countries: a systematic review. J. Alzheimers Dis.79, 743–762. doi: 10.3233/JAD-201043
21
Miners S. Kehoe P. G. Love S. (2020). Cognitive impact of COVID-19: looking beyond the short term. Alzheimers Res. Ther.12:170. doi: 10.1186/s13195-020-00744-w
22
Nath A. (2020). Long-Haul COVID. Neurology95, 559–560. doi: 10.1212/WNL.0000000000010640
23
Nyaga V. N. Arbyn M. Aerts M. (2014). Metaprop: a Stata command to perform meta-analysis of binomial data. Arch Public Health72:39. doi: 10.1186/2049-3258-72-39
24
Page M. J. McKenzie J. E. Bossuyt P. M. Boutron I. Hoffmann T. C. Mulrow C. D. et al . (2021). The PRISMA 2020 statement: an updated guideline for reporting systematic reviews. BMJ372:n71. doi: 10.1136/bmj.n71
25
Petersen R. C. Caracciolo B. Brayne C. Gauthier S. Jelic V. Fratiglioni L. (2014). Mild cognitive impairment: a concept in evolution. J. Intern. Med.275, 214–228. doi: 10.1111/joim.12190
26
Ronald C. P. (2011). Mild cognitive impairment. N. Engl. J. Med.364, 2227–2234. doi: 10.1056/NEJMcp0910237
27
Rostom A. Dube C. Cranney A. Saloojee N. Sy R. Garritty C. et al . (2004). Celiac disease. Evid. Rep. Technol. Assess.104:6.
28
Ruan Q. Xiao F. Gong K. Zhang W. Zhang M. Ruan J. et al . (2020). Prevalence of cognitive frailty phenotypes and associated factors in a community-dwelling elderly population. J. Nutr. Health Aging24, 172–180. doi: 10.1007/s12603-019-1286-7
29
Sharp C. (2022). Personality disorders. N. Engl. J. Med.387, 916–923. doi: 10.1056/NEJMra2120164
30
Trambaiolli L. R. Cassani R. Mehler D. M. A. Falk T. H. (2021). Neurofeedback and the aging brain: a systematic review of training protocols for dementia and mild cognitive impairment. Front. Aging Neurosci.13:682683. doi: 10.3389/fnagi.2021.682683
31
Troyer E. A. Kohn J. N. Hong S. (2020). Are we facing a crashing wave of neuropsychiatric sequelae of COVID-19? Neuropsychiatric symptoms and potential immunologic mechanisms. Brain Behav. Immun.87, 34–39. doi: 10.1016/j.bbi.2020.04.027
32
Wadhera R. K. Wadhera P. Gaba P. Figueroa J. F. Joynt Maddox K. E. Yeh R. W. et al . (2020). Variation in COVID-19 hospitalizations and deaths across new York City boroughs. JAMA323, 2192–2195. doi: 10.1001/jama.2020.7197
33
Wang C. Song P. Niu Y. (2022). The management of dementia worldwide: a review on policy practices, clinical guidelines, end-of-life care, and challenge along with aging population. Biosci. Trends16, 119–129. doi: 10.5582/bst.2022.01042
34
Wang Y. Q. Jia R. X. Liang J. H. Li J. Qian S. Li J. Y. et al . (2020). Effects of non-pharmacological therapies for people with mild cognitive impairment. A Bayesian network meta-analysis. Int. J. Geriatr. Psychiatry35, 591–600. doi: 10.1002/gps.5289
35
Xue J. Li J. Liang J. Chen S. (2018). The prevalence of mild cognitive impairment in China: a systematic review. Aging Dis.9, 706–715. doi: 10.14336/AD.2017.0928
Summary
Keywords
mild cognitive impairment, global prevalence, COVID-19, meta-analysis, systematic review
Citation
Song W-x, Wu W-w, Zhao Y-y, Xu H-l, Chen G-c, Jin S-y, Chen J, Xian S-x and Liang J-h (2023) Evidence from a meta-analysis and systematic review reveals the global prevalence of mild cognitive impairment. Front. Aging Neurosci. 15:1227112. doi: 10.3389/fnagi.2023.1227112
Received
22 May 2023
Accepted
26 September 2023
Published
27 October 2023
Volume
15 - 2023
Edited by
Fangyi Xu, University of Louisville, United States
Reviewed by
Maria Casagrande, Sapienza University of Rome, Italy; Masafumi Yoshimura, Kansai Medical University, Japan
Updates
Copyright
© 2023 Song, Wu, Zhao, Xu, Chen, Jin, Chen, Xian and Liang.
This is an open-access article distributed under the terms of the Creative Commons Attribution License (CC BY). The use, distribution or reproduction in other forums is permitted, provided the original author(s) and the copyright owner(s) are credited and that the original publication in this journal is cited, in accordance with accepted academic practice. No use, distribution or reproduction is permitted which does not comply with these terms.
*Correspondence: Jing-hong Liang, liangjh78@mail2.sysu.edu.cnJie Chen, 2287550@qq.comShao-xiang Xian, zjxzms2014@163.com
Disclaimer
All claims expressed in this article are solely those of the authors and do not necessarily represent those of their affiliated organizations, or those of the publisher, the editors and the reviewers. Any product that may be evaluated in this article or claim that may be made by its manufacturer is not guaranteed or endorsed by the publisher.