 Feng Zhang
 Zhongxing Ning2
- 1Department of Neurology, The Affiliated Nanhua Hospital, Hengyang Medical School, University of South China, Hengyang, Hunan, China
- 2Department of Intensive Care Unit, Guangxi Hospital Division of The First Affiliated Hospital, Sun Yat-sen University, Nanning, China
Background: Obesity negatively impacts cognitive function. However, the correlation between the body roundness index (BRI) and cognitive performance remains inadequately explored.
Methods: This study used data from the National Health and Nutrition Examination Survey (NHANES) collected from 2011 to 2014 to examine the correlation between BRI and cognitive function in individuals aged 65 and older. Models of multiple linear regression were used to investigate the relationship between BRI and cognitive performance. Additionally, smoothed curve fittings explored potential non-linear associations. Interaction tests and subgroup analyses were also performed.
Results: One thousand eight hundred seventy participants were taken into account, revealing an important negative relationship between BRI levels and cognitive performance. In the fully adjusted model, elevated BRI was substantially correlated with lower Digit Symbol Substitution Test (DSST) scores (β = −0.34, 95% CI = −0.64 to −0.05, p = 0.023), indicating that the higher BRI values are linked to worse cognitive performance. Sex differences were observed, with males showing a stronger negative association (p for interaction = 0.040).
Conclusion: Elevated BRI is related to worse cognitive function in the elderly population.
1 Introduction
With the global aging population, the prevalence of dementia is expected to increase significantly (Ahmadi-Abhari et al., 2017), affecting an estimated 152 million individuals by 2050 (Nichols et al., 2022). Dementia, characterized by progressive cognitive decline and memory loss, severely impairs daily activities. Alzheimer’s disease (AD), in particular, has become a major global public health challenge (Wimo et al., 2023; Feigin et al., 2021). Despite extensive research over the past few decades, no effective treatment for dementia has been discovered. Cognitive decline is recognized as a key predictor of dementia. Thus, it is essential to discover modifiable risk factors linked to cognitive impairment in order to reduce the occurrence of dementia.
Obesity, a growing global issue, can disrupt brain homeostasis and adversely affect the central nervous system and cognitive function (O’Brien et al., 2017). Studies have demonstrated a significant association between obesity and cognitive impairment (Beeri et al., 2022). Furthermore, obesity is closely associated with AD, a specific subtype of dementia (Livingston et al., 2020; Anstey et al., 2011; Arnold et al., 2018). However, traditional obesity indicators such as waist circumference (WC) and body mass index (BMI) have limitations in accurately reflecting fat distribution (Li et al., 2024). To address these limitations, Thomas et al. developed the body roundness index (BRI), a more precise method for evaluating body and visceral fat (Thomas et al., 2013). Compared to BMI, BRI incorporates both weight and WC, enabling a more accurate evaluation of body fat and visceral fat distribution (Rico-Martín et al., 2020; Tang et al., 2021). Studies indicate that visceral fat is metabolically active and is closely associated with metabolic disorders like insulin resistance, dyslipidemia, and inflammation, all of which significantly increase the risk of cognitive decline (Zeng et al., 2023). Therefore, as a marker of visceral fat, BRI may outperform traditional obesity measures (such as BMI) in predicting cognitive decline. However, the research linking BRI to cognitive function is still limited, necessitating further studies to confirm its validity.
This research analyzes data from the National Health and Nutrition Examination Survey (NHANES) to examine the correlation between BRI and cognitive performance in older persons in the United States. The objective is to get a better understanding of early diagnosis of dementia.
2 Materials and methods
2.1 Survey description
The NHANES survey, conducted by the National Center for Health Statistics (NCHS), is an extensive nationwide study that evaluates the health and nutritional status of Americans (Johnson et al., 2014). This survey operates on a two-year cycle, using representative samples and a complicated multi-stage stratified random sampling approach. Participants had a home interview initially, and subsequently visited a mobile examination center (MEC) for a health assessment. The NCHS Research Ethics Review Board granted authorization for the research protocol, and each participant provided signed informed consent. Detailed information about the data is available on the NHANES official website1. The STROBE standards for cross-sectional research were followed in this investigation.
2.2 Study population
Data from the NHANES cycles 2011–2012 and 2013–2014 were used in this investigation. From 2011 and 2014, 19,931 participants enrolled in the NHANES. Adults 65 years of age and older who completed the MEC cognitive functioning survey were the subjects of this research, with an initial sample size of 2,556. Individuals with incomplete BRI data (n = 413) and those with incomplete or inaccurate cognitive test scores (n = 273) were excluded. After these exclusions, the final size was 1,870 individuals (Figure 1).
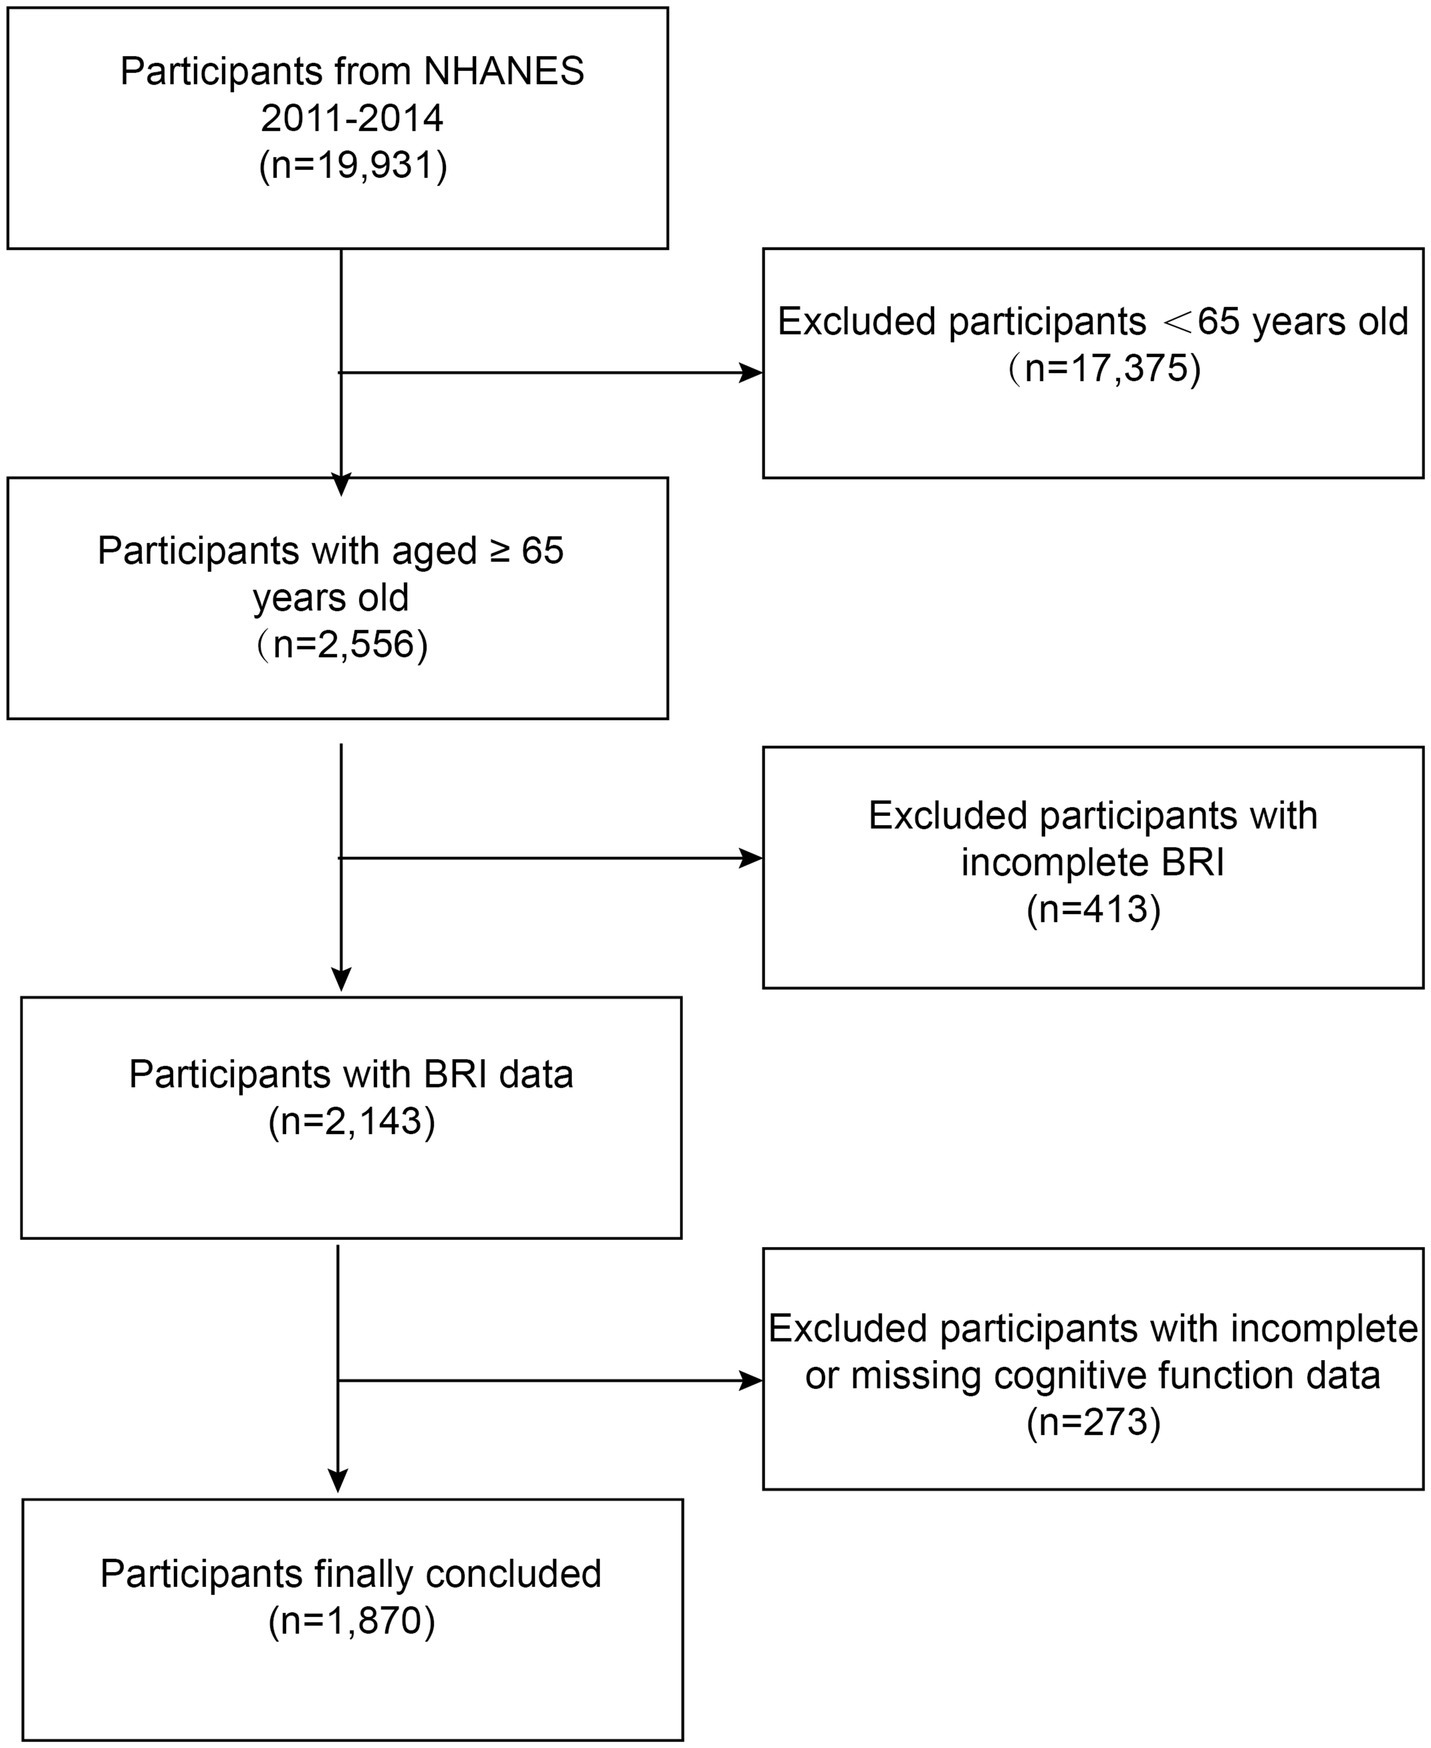
Figure 1. Flowchart of participant selection. NHANES, National Health and Nutrition Examination Survey; BRI, body roundness index.
2.3 Assessment of body roundness index
The BRI is a novel metric for assessing body shape, calculated using height (cm) and WC (cm). Data on height and WC were collected from the examination records of the subjects. Measurements were taken by certified health specialists with assistance from assistants at mobile testing facilities to guarantee accuracy. Participants removed their clothing and shoes before measurements. Height was measured as standing height, while WC was evaluated at the level midway between the lower rib and the top of the hip while standing. The formula for calculating BRI is as follows (Thomas et al., 2013):
The higher BRI values indicate greater obesity. Due to the lack of clear reference ranges, this study divided BRI into quartiles based on previous literature to analyze its association with cognitive function (Zhou et al., 2022).
2.4 Assessment of cognitive function
This study used three assessments to evaluate cognitive function: the Consortium to Establish a Registry for Alzheimer’s Disease Word List (CERAD W-L), the Animal Fluency Test (AFT), and the Digit Symbol Substitution Test (DSST) (Morris et al., 1989).
The CERAD W-L uses one delayed recall test and three quick recall trials to evaluate a person’s ability to learn and remember new verbal knowledge (Fillenbaum and Mohs, 2023; Paajanen et al., 2014). This exam has a total score range of 0–40. The AFT is designed to assess categorical verbal fluency (Ardila, 2020). Participants had 1 min to list as many animals as they could, with each correctly named animal earning one point. Scores for the AFT range from 3 to 39. The DSST, adapted from the Wechsler Adult Intelligence Scale, is a cognitive performance test that evaluates processing speed, sustained attention, and working memory. It functions as an experimental instrument for comprehending associative learning in humans (Jaeger, 2018). Participants completed a two-minute task of replicating graphic symbols in 133 boxes. Scores for the DSST range from 0 to 105.
In accordance with prior studies, the cut-off values for low cognitive functioning were set at 21 for CERAD W-L, 13 for AFT, and 34 for DSST (Chen et al., 2017). Lower scores on these tests indicate poorer cognitive functioning (Wang et al., 2024).
2.5 Covariates
After reviewing the available literature, many possible factors that may influence the outcome were examined (Jia et al., 2024). These factors included age, sex (male or female), race (Mexican American, other Races, non-Hispanic White individuals, or non-Hispanic Black individuals), education level (below high school, high school, or above high school), poverty income ratio (PIR). Smoking status was assessed by asking participants, “Do you currently smoke?” Those who responded with ‘1’ (every day) or ‘2’ (some days) were categorized as ‘current smokers,’ while all other responses were classified as ‘non-smokers.’ Alcohol consumption was assessed by asking, “How often did you drink alcohol in the past 12 months?” Those who gave a numeric response were categorized as ‘drinkers,’ while others were classified as ‘non-drinkers.’ Hypertension, hyperlipidemia, diabetes, and stroke were obtained through self-reports from the subjects, specifically inquiring whether they had ever been diagnosed with these conditions by a physician. Depression symptoms were assessed with the Patient Health Questionnaire-9 (PHQ-9), which evaluates the frequency of symptoms over the past 2 weeks. Response options ranged from 0 to 3, with a total score of PHQ-9 ≥ 10, indicating depression, a threshold with high sensitivity and specificity (Kroenke et al., 2001). All data were obtained through standardized questionnaires, physical examinations, and laboratory examinations collected by licensed healthcare professionals. The questionnaires were administered via face-to-face interviews to ensure participants provided accurate responses relevant to the study. Detailed measuring protocols for these variables can be found on the official NHANES website.
2.6 Statistical analysis
R (The R Foundation, Vienna, Austria) and Empower (X&Y Solutions, Boston, MA, United States) were used for statistical analyses. Continuous variables were shown in terms of means with standard deviations (SD) in the baseline characteristics table; categorical variables were presented as percentages (%). The random forest imputation method, implemented with the missForest package (version 1.4) in R, was used to impute missing covariates. This approach enhances statistical efficiency and reduces bias by utilizing the relationships among the available variables. Given the complex sampling design of NHANES, all statistical analyses followed CDC analytical guidelines, incorporating sample weights, clustering, and stratification. NHANES survey weights adjust for unequal selection probabilities, non-response, and post-stratification to ensure the results represent the U.S. civilian non-institutionalized population. The relationship between BRI and cognitive function was analyzed using three distinct weighted multivariate linear regression models. Model 1 did not involve adjustments for covariates. Model 2 adjusted for age, sex, and race. Model 3 adjusted for age, sex, race, education level, PIR, alcohol and smoking use status, hypertension, hyperlipidemia, diabetes, stroke, and depression. After converting the BRI score from a continuous variable to quartiles, trend tests were conducted to assess linear correlations between BRI and cognitive function. Weighted subgroup analyses of the association between BRI and cognitive function were conducted using stratification factors including sex, race, education level, alcohol and smoking use status, hypertension, hyperlipidemia, diabetes, stroke, and depression. Interaction tests were applied to evaluate the consistency of this association across different groups. In addition, the weighted smooth curve fitting was used to examine the non-linear relationship between BRI and cognitive performance. A two-tailed p value below 0.05 was regarded as statistically significant.
3 Results
3.1 Characteristics of the study population
One thousand, eight hundred seventy individuals aged 65 years and older were enrolled in this research; their weighted mean age was 72.72 years (SD = 5.32), and 51.18% of them were female (weighted percentage). Participants were stratified into four quartiles according to their BRI values: 1.44–4.53 (Quartile 1), 4.53–5.69 (Quartile 2), 5.69–7.03 (Quartile 3), and 7.03–15.42 (Quartile 4). Weighted analyses showed that individuals in the highest quartile of the BRI were more likely to be female, have higher educational levels, consume alcohol more frequently, and smoke less. They also had higher rates of hypertension and hyperlipidemia, but lower rates of diabetes, stroke, and depression. Additionally, they were more likely to belong to lower-income households compared to those in the lowest quartile. Moreover, these individuals scored lower on the DSST (Table 1).
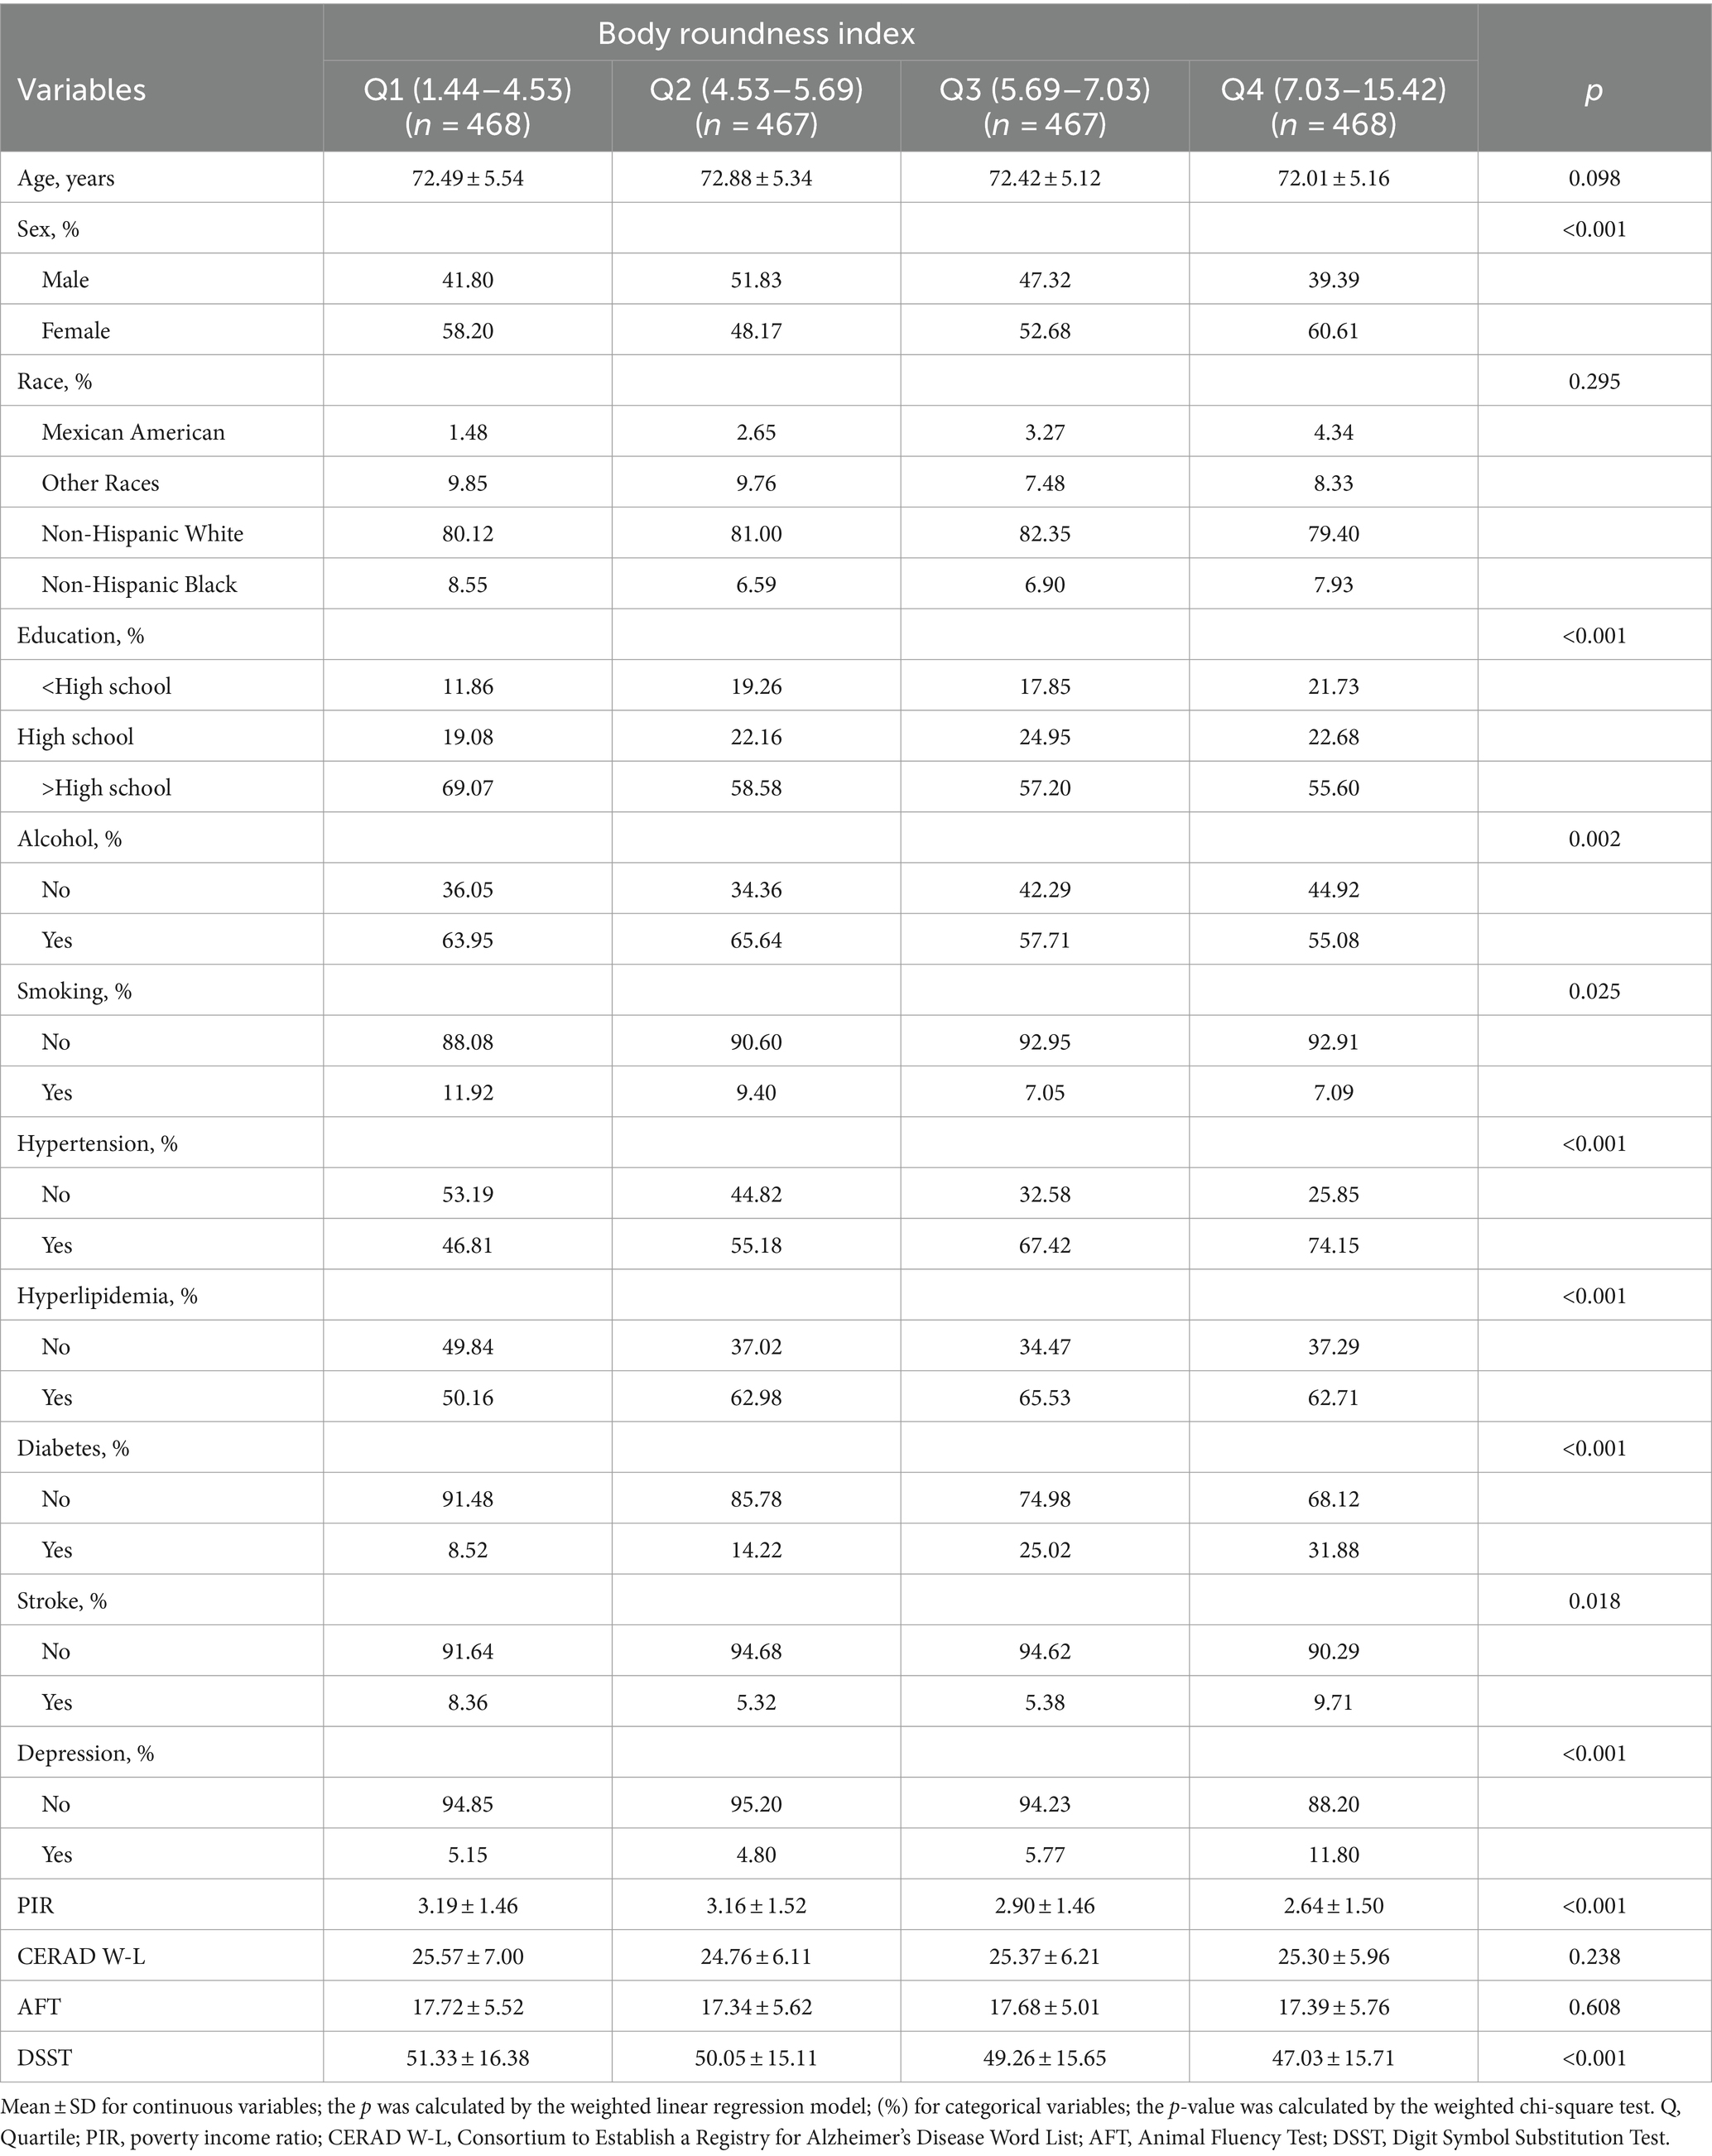
Table 1. Basic characteristics of participants by BRI tertiles among U.S. older adults.
3.2 Association between BRI and cognitive function
Weighted regression analysis (Table 2) demonstrated a negative correlation between BRI levels and DSST scores. This relationship remained significant after adjusting for all confounding factors (β = −0.34, 95% CI = −0.64 to −0.05, p = 0.023). Treating BRI as a categorical variable (quartiles) confirmed the persistence of this significant association in both unadjusted models and in models adjusted for key demographic factors (p for trend <0.001). However, the increase was not significant (p for trend = 0.302) after correcting for all covariates. There were no significant relationships between BRI and the CERAD W-L or AFT scores. These weighted results imply that a greater BRI is linked to a lower level of cognitive function, particularly as measured by the DSST, indicating that a higher BRI may negatively impact cognitive performance.
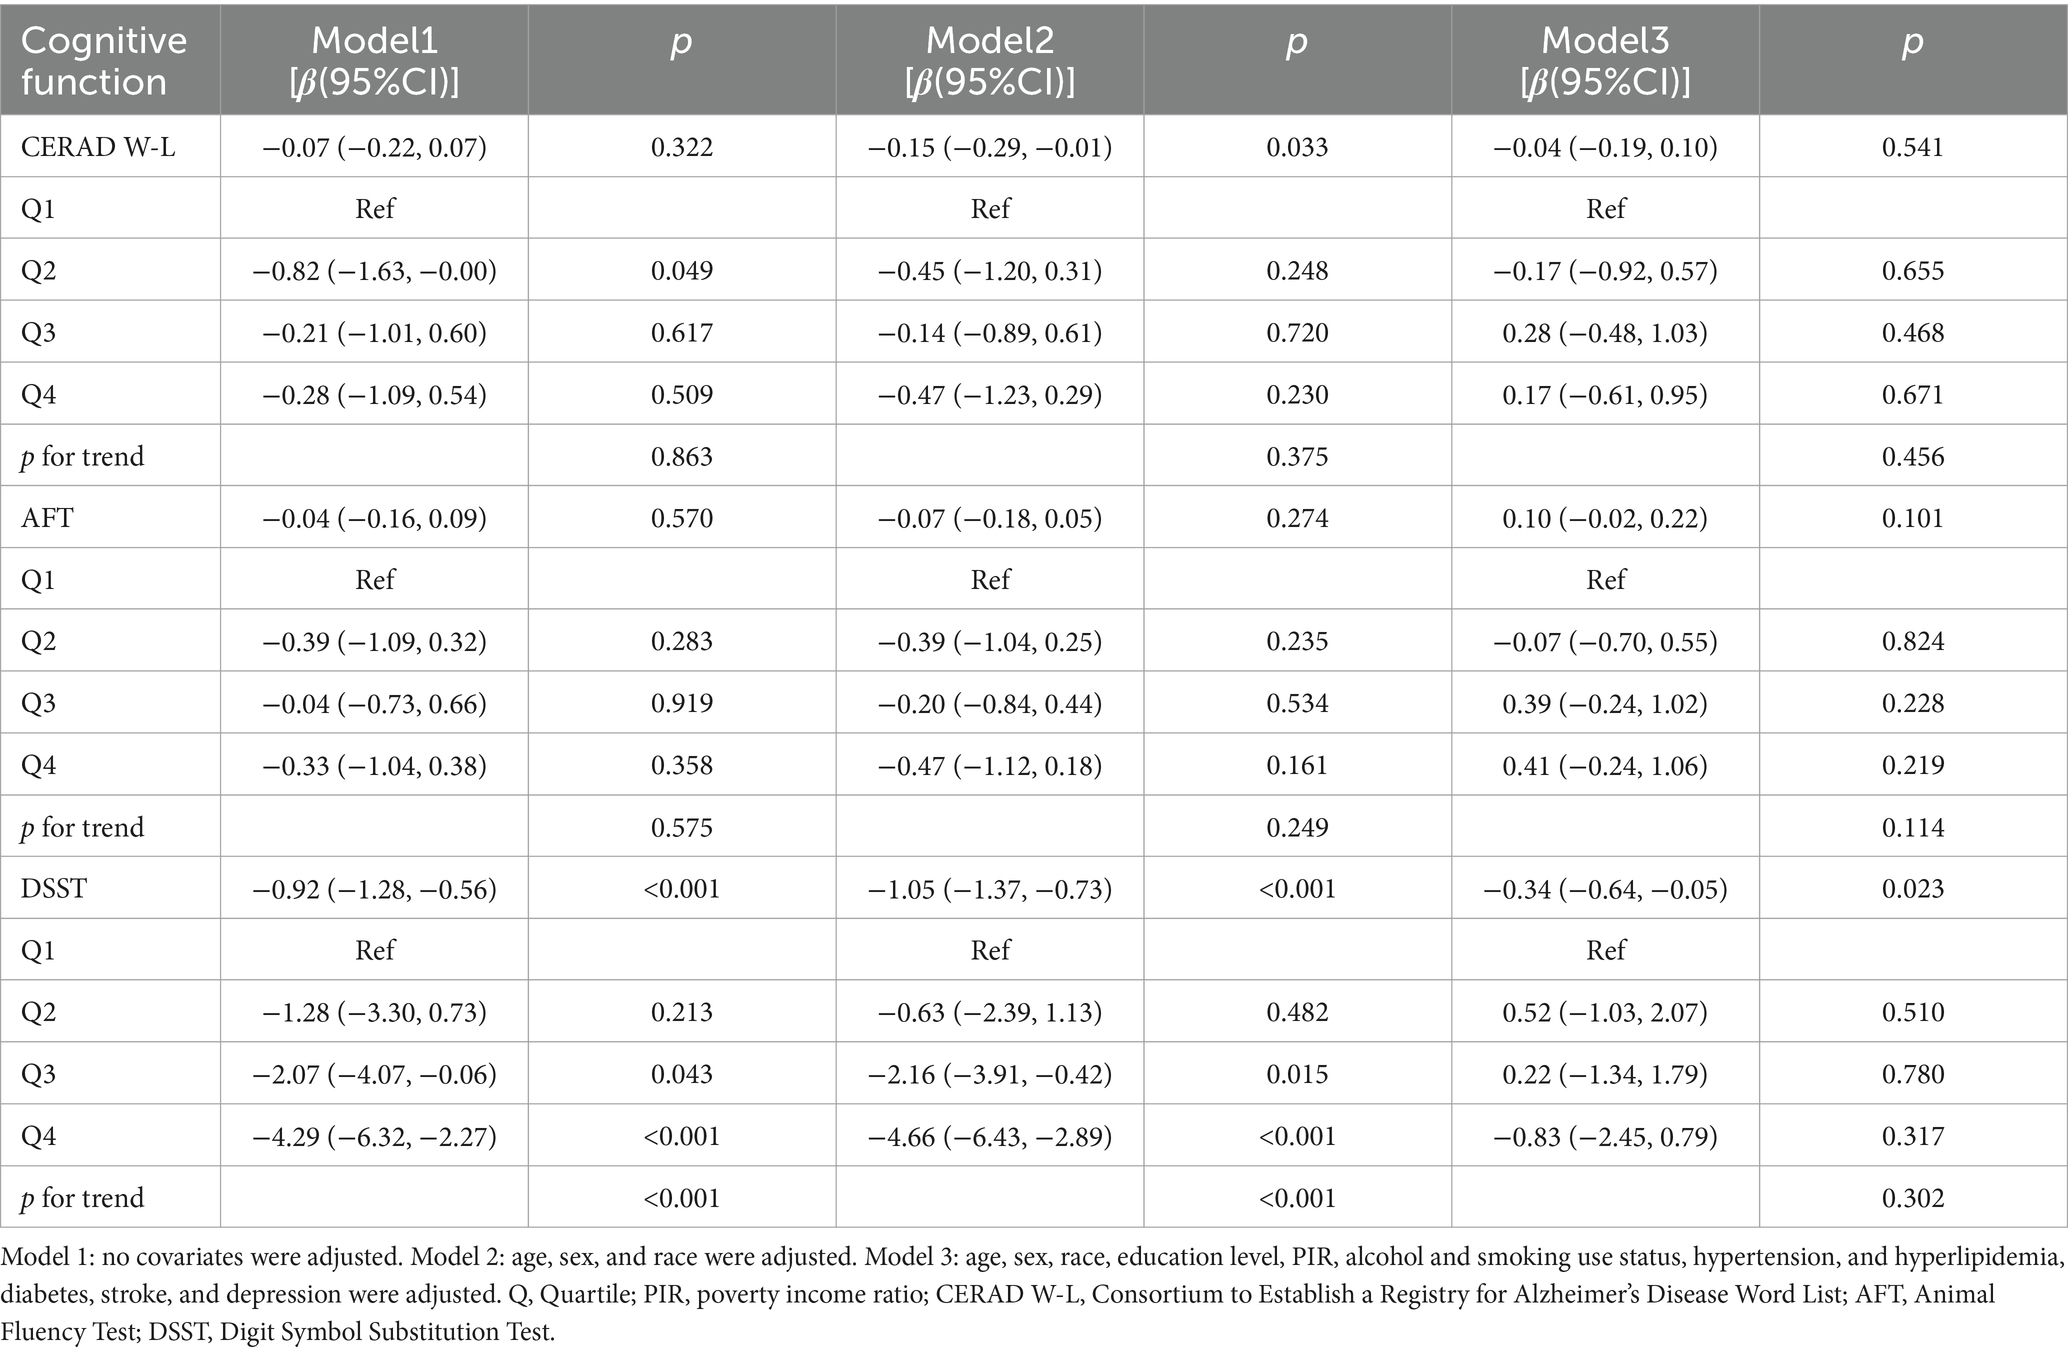
Table 2. Associations between the BRI with cognitive function.
From a non-linear perspective, the negative correlation between BRI levels and DSST scores was further corroborated by weighted smooth curve fitting (Figure 2).
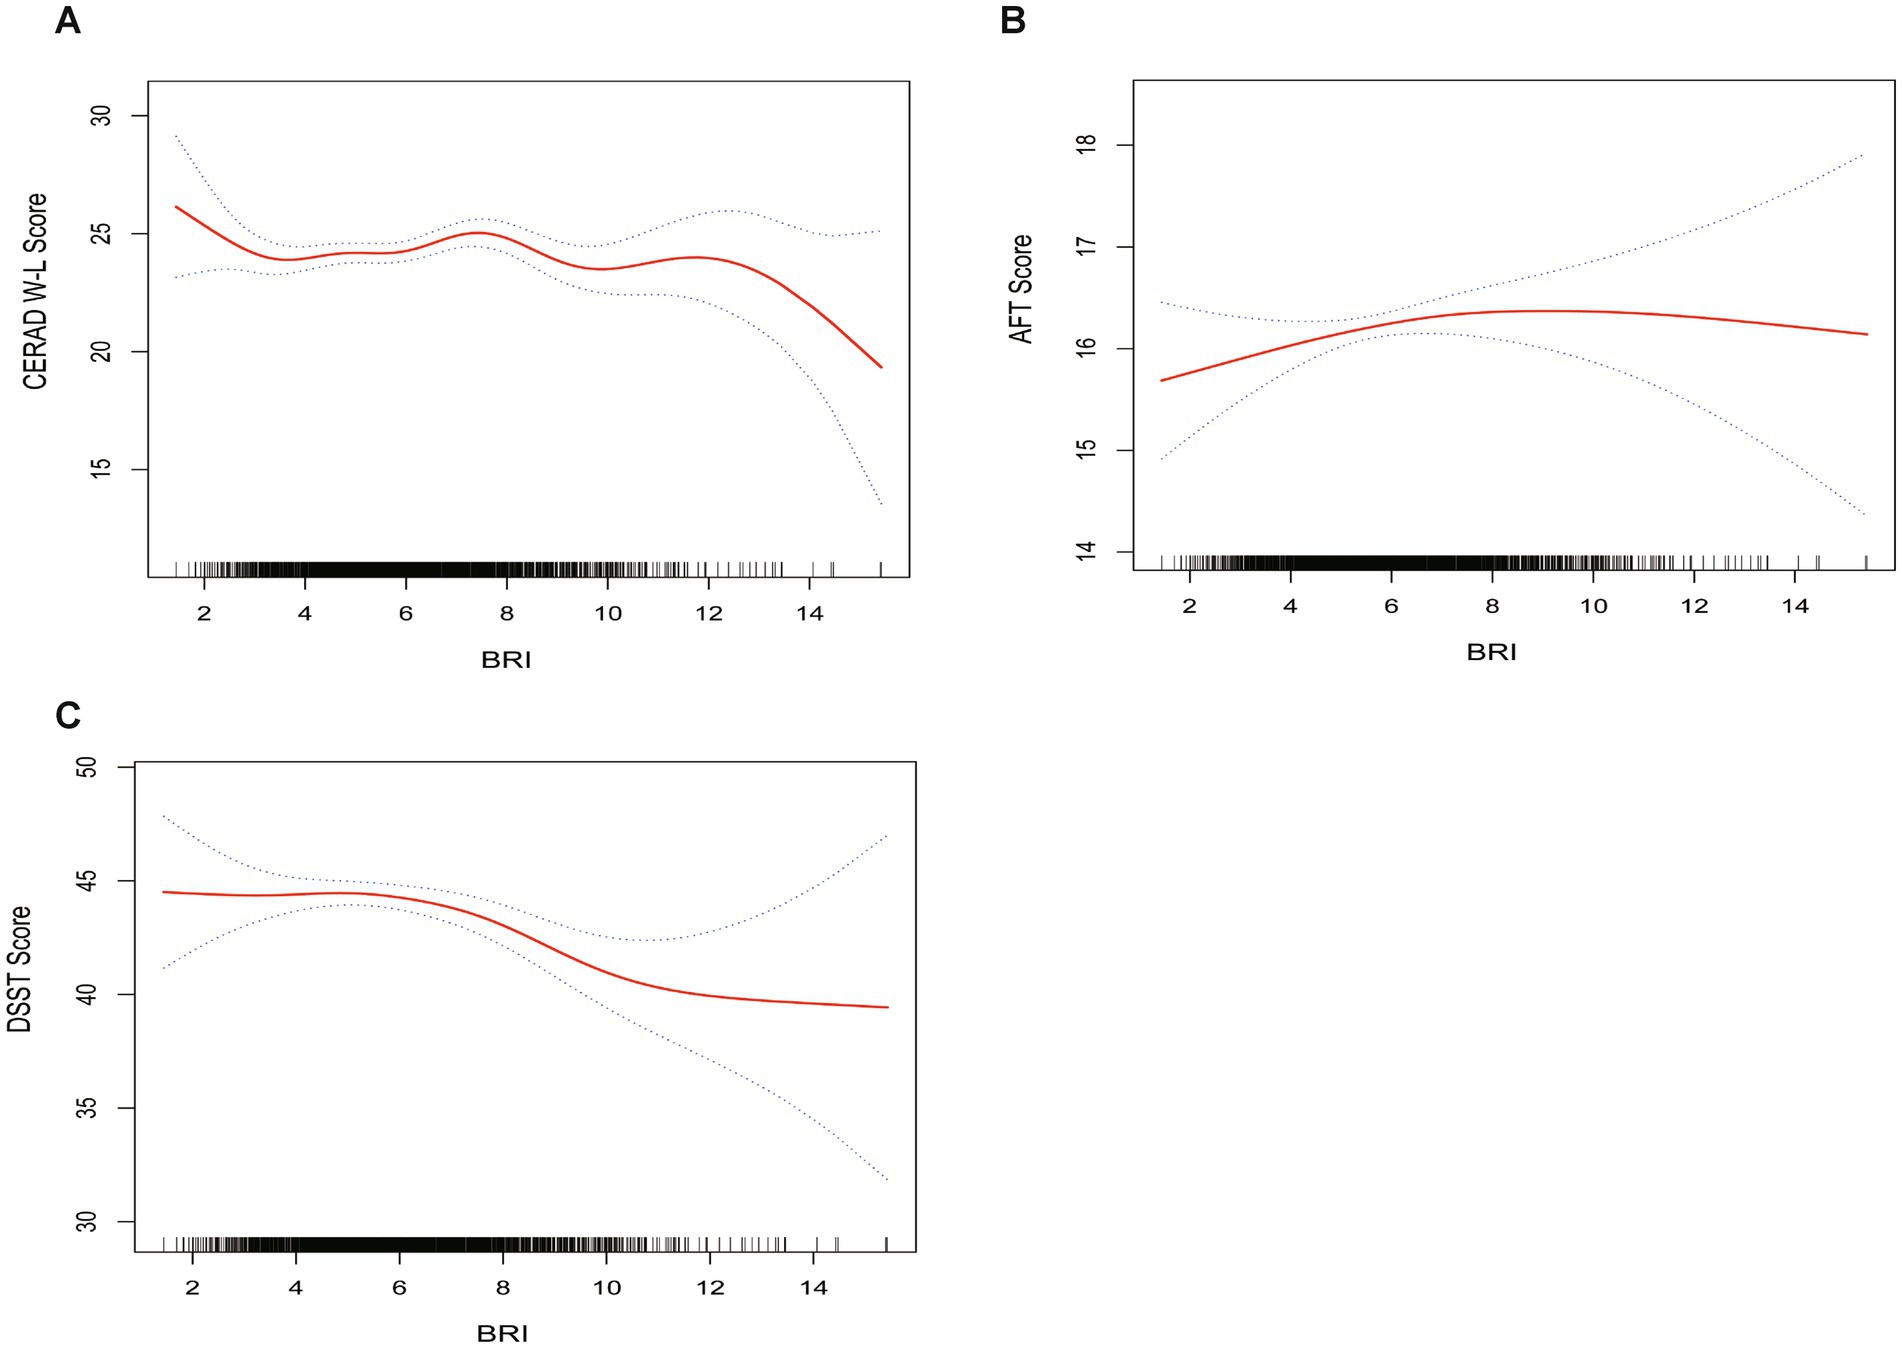
Figure 2. The weighted non-linear relationships between BRI and cognitive function. The solid red line represents the smooth curve fit between variables. Blue bands represent the 95% of confidence interval from the fit. (A) BRI and CERAD W-L; (B) BRI and AFT; (C) BRI and DSST.
3.3 Subgroup analysis
Weighted subgroup and interaction analyses were conducted, taking into factors such as sex, race, education level, alcohol intake, smoking status, hypertension, hyperlipidemia, diabetes, stroke history, and depression. The purpose of these studies was to investigate if there are any possible differences between certain subgroups and the general population regarding the relationship between BRI and cognitive performance (Table 3).
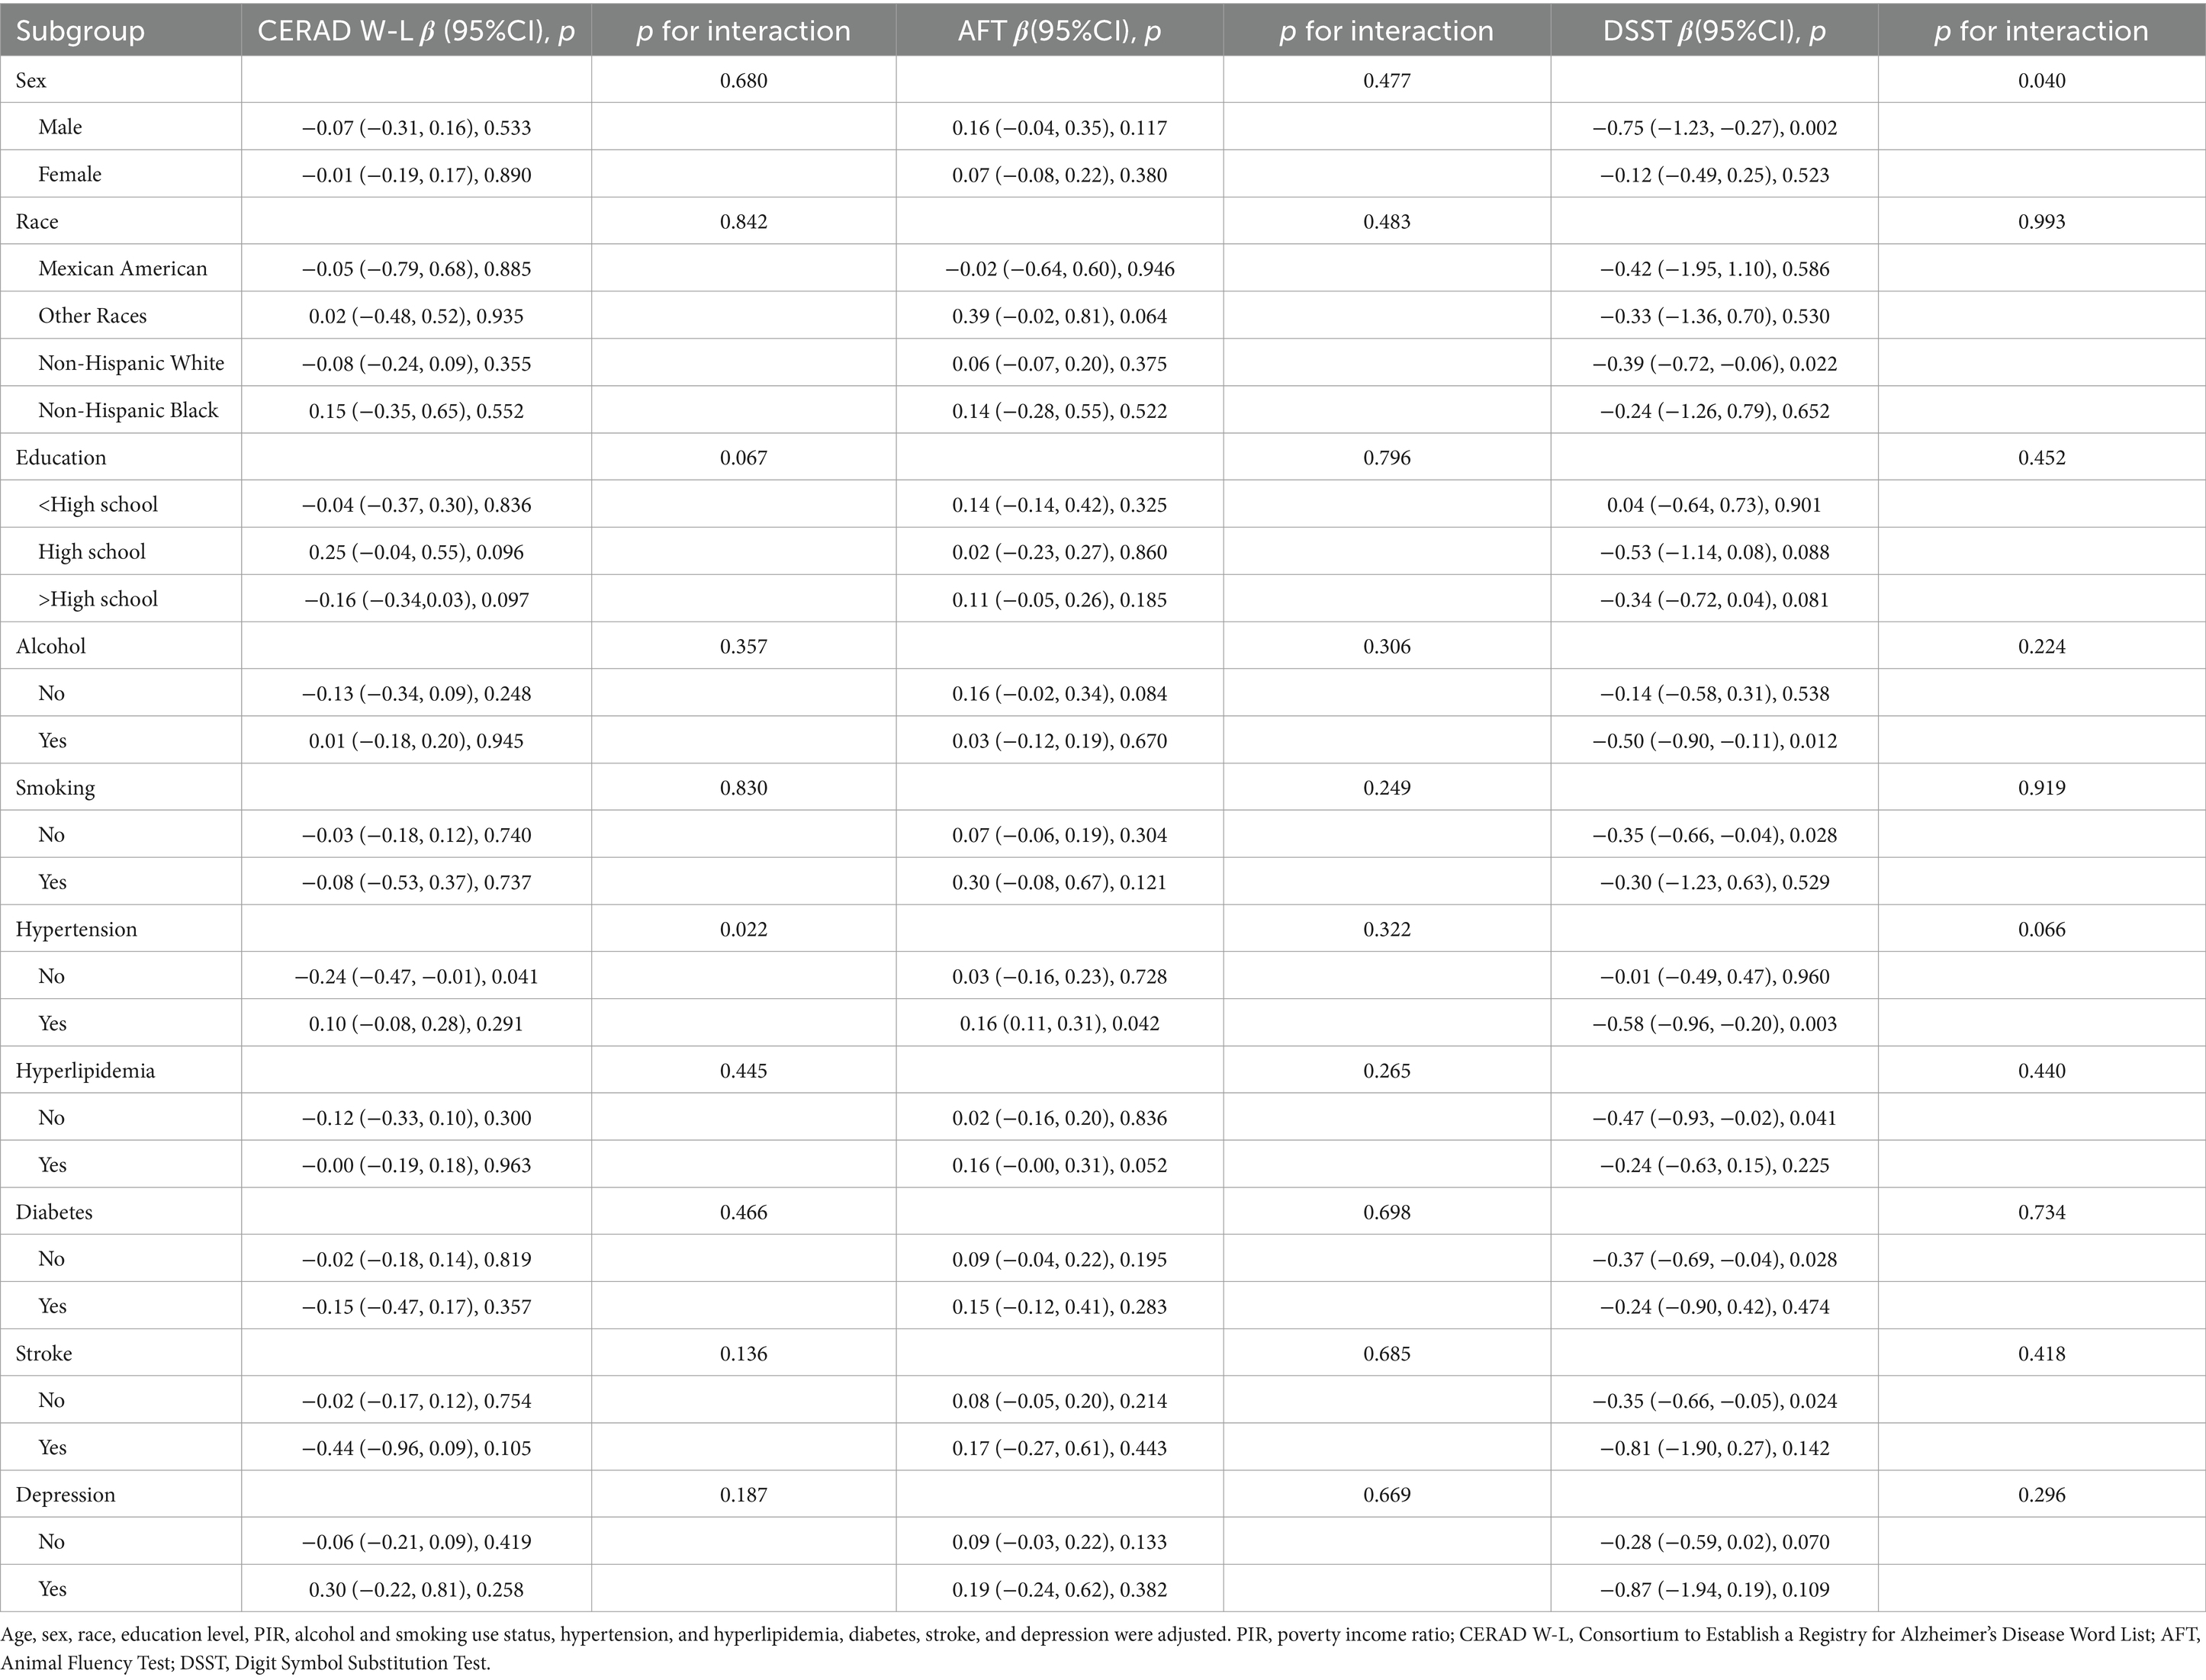
Table 3. Subgroup analysis of the association between BRI and cognitive function.
According to the weighted subgroup analysis, the relationship between BRI and cognitive performance, particularly in the DSST, showed a significant sex interaction (p for interaction = 0.040). In males, the higher BRI was significantly negatively associated with lower DSST scores (β = −0.75, 95% CI = −1.23 to −0.27, p = 0.002), while no significant association was observed in females (p = 0.523), indicating that the negative impact of BRI on cognitive function was more pronounced in males. Additionally, significant negative associations were found in the following weighted subgroups: non-Hispanic White individuals (β = −0.39, 95% CI = −0.72 to −0.06, p = 0.022), alcohol users (β = −0.50, 95% CI = −0.90 to −0.11, p = 0.012), non-smokers (β = −0.35, 95% CI = −0.66 to −0.04, p = 0.028), individuals with hypertension (β = −0.58, 95% CI = −0.96 to −0.20, p = 0.003), those without hyperlipidemia (β = −0.47, 95% CI = −0.93 to −0.02, p = 0.041), individuals without diabetes (β = −0.37, 95% CI = −0.69 to −0.04, p = 0.028), and individuals without a history of stroke (β = −0.35, 95% CI = −0.66 to −0.05, p = 0.024).
In the weighted analysis, a significant interaction between hypertension status and BRI was observed in the CERAD W-L test (p for interaction = 0.022), indicating that individuals without hypertension exhibited a stronger negative association between BRI and cognitive performance compared to those with hypertension. Specifically, individuals without hypertension showed a significant negative association with poorer cognitive performance on the CERAD W-L test (β = −0.24, 95% CI = −0.47 to −0.01, p = 0.041). In contrast, individuals with hypertension exhibited a significant positive association with cognitive performance on the AFT test (β = 0.16, 95% CI = 0.01 to 0.31, p = 0.042). These findings suggest that the higher BRI is associated with poorer cognitive performance in certain subgroups, with varying patterns of association across different cognitive tests and specific subgroups.
4 Discussion
This cross-sectional study aimed to investigate the correlation between the BRI and cognitive function in a sample of 1,870 older individuals aged 65 and older in the United States. The results reveal a notable negative correlation between elevated BRI and reduced DSST scores, suggesting that increased BRI is associated with greater cognitive decline. This relationship was consistent across various subgroups, particularly among males, non-Hispanic white individuals, alcohol consumers, non-smokers, and those with hypertension, without hyperlipidemia, diabetes, or a history of stroke. Importantly, this is the first study to assess the relationship between BRI and cognitive function in older Americans, suggesting that BRI may serve as a useful indicator for assessing body shape-related cognitive decline in the elderly population.
Numerous studies have shown a significant link between obesity and an increased risk of cognitive impairment (Norris et al., 2023; Peykari, 2021; Ge et al., 2023). These studies support our observation that a higher BRI is significantly correlated with more severe cognitive decline. Large-scale studies in China and the United States have consistently found that overweight or obesity increases the risk of dementia in older adults (Feinkohl et al., 2018; Wang et al., 2019; Espeland et al., 2018). Obesity has been recognized as a major risk factor for AD (Dye et al., 2017; Bischof and Park, 2015). However, variations in sample size and research methodologies across different regions can lead to inconsistent findings. Obesity is closely linked to brain structural changes, including excessive atrophy and white matter lesions (Gustafson et al., 2004; Gustafson et al., 2004; Ward et al., 2005). A prospective study among African Americans found that increased central adiposity was associated with accelerated cognitive decline over a five-year follow-up period (Anand et al., 2022). Additionally, research indicates that cognitive function can improve following weight loss surgery in obese individuals (Vreeken et al., 2023). These findings provide strong evidence supporting the link between obesity and cognitive decline, emphasizing the significance of obesity as a risk factor for cognitive impairment. However, the detrimental impact of obesity on cognitive function is not consistently observed. Recent research on elderly Colombians has found no significant association between overweight or obesity and the progression of cognitive decline (O’Donovan et al., 2022). Some studies suggest that overweight or obesity in old age might confer a protective effect against cognitive impairment or dementia (Qu et al., 2020; Puzianowska-Kuznicka et al., 2019; Hughes et al., 2009; Buchman et al., 2006). These studies primarily used BMI to measure obesity, reflecting overall fat distribution rather than regional fat distribution (Prentice and Jebb, 2001), particularly in older adults (Tchkonia et al., 2010). The limitations of BMI may contribute to these inconsistent findings. BRI, as a novel anthropometric measure, combines weight and WC to provide a more comprehensive assessment of visceral fat. Compared to traditional BMI, BRI better reflects fat distribution and body shape characteristics (Zhang et al., 2024). Recently, Zhang et al. studied the association between ABSI and cognitive function in the elderly U.S. population, finding a significant negative correlation between ABSI and cognitive impairment (Zhang et al., 2024). Compared to ABSI, BRI assesses visceral fat distribution using a simple calculation of WC and height. While ABSI offers a more complex evaluation of central obesity’s relationship with cognitive decline, BRI, as a simpler tool, also demonstrates strong predictive ability. Future studies should compare the applications of ABSI and BRI across diverse populations to determine which index offers greater clinical value in predicting cognitive impairment.
Earlier research has demonstrated a significant link between obesity and cognitive impairment, but the results have been inconsistent, partly due to varying metrics used to measure obesity. BMI may not adequately reflect the specific impact of obesity on cognitive function. In contrast, the BRI, a new metric, provides a more accurate assessment. This study used BRI to confirm a significant negative correlation between obesity and cognitive decline, particularly in the elderly population. Future research should continue to examine the causal relationship between BRI and cognitive function. Employing longitudinal study designs and larger sample sizes will enhance understanding and provide a more reliable basis for early detection and intervention.
Recent studies have revealed the complex biological mechanisms between obesity and cognitive decline. First, the adipose tissue in obese individuals abnormally secretes pro-inflammatory cytokines, including IL-6 and TNF-α (Salas-Venegas et al., 2022). Excessive IL-6 induces vascular endothelial growth factor production, promotes nitric oxide synthase release in endothelial cells, disrupting the tight junction proteins of the blood brain barrier (BBB), increasing its permeability (Ali et al., 2022), upregulating BACE1 enzyme expression, and ultimately leading to neuronal apoptosis and memory impairment (Naomi et al., 2023). TNF-α also activates astrocytes and microglia, inhibits excitatory synaptic transmission, impairs hippocampus-dependent learning and memory, and exacerbates damage by inhibiting long-term potentiation (Takahashi et al., 2021). TNF-α inhibits cAMP response element-binding protein activity, disrupts the expression of spatial memory-related genes (including c-FOS, BDNF, and Arc), and weakens neuronal survival and neurogenesis, leading to impaired spatial and contextual fear memory (Naomi et al., 2023). Second, obesity affects cognitive function by regulating leptin and adiponectin levels. Elevated leptin levels trigger leptin resistance, exacerbate insulin resistance by inflammatory responses, and ultimately lead to cognitive impairment (Wong Zhang et al., 2023). Although adiponectin has anti-inflammatory effects, its levels significantly decrease in obesity, increasing the risk of insulin resistance and inflammation, which further aggravates cognitive dysfunction and the risk of AD (Forny-Germano et al., 2018).
Third, obesity not only induces peripheral insulin resistance but may also trigger brain insulin resistance, marked by impaired insulin-induced long-term inhibition and reduced insulin signaling in the brain (Sripetchwandee et al., 2018). Peripheral insulin resistance may promote hepatic lipid production and ceramide formation, contributing to brain insulin resistance (Summers, 2006). Ceramides, composed of sphingosine and fatty acids, can cross the BBB, triggering oxidative stress and inflammation in the brain, ultimately causing neurodegeneration (Tong and de la Monte, 2009). Furthermore, mitochondrial dysfunction in the brain (e.g., excess reactive oxygen species, mitochondrial depolarization, and swelling) is closely related to brain insulin resistance, and these pathological processes may contribute to cognitive decline and increase the risk of AD (Sripetchwandee et al., 2018). Lastly, obesity-induced gut microbiota dysbiosis impairs brain health by promoting systemic inflammation and disrupting the BBB (Wong Zhang et al., 2023). Gut microbiota dysbiosis may alter tryptophan metabolism, affecting serotonin signaling (Whiley et al., 2021). Weakened serotonin signaling may also increase hypothalamic–pituitary–adrenal (HPA) axis activity in dementia patients (Whiley et al., 2021). Increased HPA axis activity raises cortisol levels, potentially reducing hippocampal volume and impairing cognitive function (Wong Zhang et al., 2023). Gut microbiota dysbiosis reduces short-chain fatty acid levels, weakening their anti-inflammatory effects and altering neural signaling, potentially worsening cognitive impairment (Salami, 2021). These biological mechanisms reveal how obesity affects cognitive function through multiple pathways, offering new perspectives for predicting obesity-related cognitive decline and l a basis for future interventions.
Subgroup analysis demonstrated a significant inverse relationship between BRI and DSST scores in males, indicating that the higher BRI adversely affects cognitive function in males. Research shows that obesity affects cognitive function in men and women through distinct mechanisms. Obesity can accelerate cognitive decline in elderly men, partly due to reduces testosterone levels, which have demonstrated neuroprotective effects by reducing amyloid-β toxicity and oxidative stress (Noh et al., 2019). A higher BMI may also protect cognitive function in women, possibly due to increased endogenous estrogen levels in adipose tissue. Despite age-related estrogen decline, women may still prevent neuropathology accumulation by maintaining estrogen receptor signaling in the brain (Espeland et al., 2018). These findings suggest that obesity may affect cognitive function in men and women via different biological mechanisms. Racial analysis demonstrated a strong inverse correlation between BRI and DSST scores in non-Hispanic white individuals, but not in other racial groups. This may be attributed to differences in gene expression and metabolic pathways among races, which increase susceptibility to obesity-related cognitive decline. Research indicates that specific variations in the FTO gene are significantly linked with obesity, hypertension, and diabetes in white individuals, but not in black individuals (Yu et al., 2023). Additionally, the ApoEε4 allele increases the risk of AD, whereas the ApoEε2 allele has a protective effect (Dye et al., 2017). Frequency and expression differences of these gene variants among races may explain the varying relationships between BRI and cognitive function.
Furthermore, there was a notable positive link between BRI and DSST scores among those who use alcohol, suggesting that lifestyle factors may influence the relationship between BRI and cognitive function. Studies indicate that chronic alcohol consumption leads to iron accumulation in specific brain regions, triggering microglial activation and the release of pro-inflammatory cytokines and reactive oxygen species (Wilcockson and Roy, 2024). This process damages neurons and surrounding brain tissue, exacerbating cognitive dysfunction (Wilcockson and Roy, 2024). Furthermore, the impact of BRI on cognitive function in hypertensive individuals varies significantly across different cognitive tests. In the CERAD W-L test among non-hypertensive individuals, BRI shows a significant negative association with cognitive function. This could be due to the lack of compensatory mechanisms in non-hypertensive individuals, where the higher BRI may directly contribute to vascular and metabolic dysfunction, impairing the brain’s learning and memory abilities. In the AFT test, BRI in hypertensive individuals is positively associated with cognitive function, possibly due to hypertensive patients’ ability to maintain vascular function through blood flow redistribution (Talman et al., 1994). This compensatory mechanism may help some hypertensive patients preserve cognitive function, mitigating the adverse impact of BRI. In contrast, in the DSST test, BRI in hypertensive individuals is significantly negatively associated with executive function and processing speed. This could be attributed to long-term hypertensive microvascular damage affecting brain white matter, especially in regions linked to executive function (Uiterwijk et al., 2016). Although no significant negative associations between BRI and cognitive function were found in smokers, dyslipidemia, diabetes, stroke, or depression, this may be due to sample size limitations or other confounding factors. Further research is needed to better understand the long-term effects of these chronic conditions on cognitive function. Additionally, it is essential to acknowledge that the data on smoking, alcohol consumption, and comorbidities were self-reported, which may have introduced reporting bias. Self-reported data are susceptible to memory biases, social desirability effects, and differences in interpretation, potentially affecting the reliability of the data. Specifically, for lifestyle factors like smoking and alcohol consumption, participants may underestimate or overestimate their behaviors. In addition, certain comorbidities, such as hypertension and diabetes, may introduce bias due to undiagnosed conditions. Therefore, future studies should incorporate objective clinical measurement to reduce biases arising from self-reported data.
In this study, we found that the association between BRI and cognitive decline in older adults remained significant even after adjusting for depression as a covariate. This suggests that while psychological factors like depression may influence cognitive function, BRI still independently predicts cognitive decline after controlling for confounders. However, unmeasured confounders, including physical activity, dietary habits, genetic factors, and psychosocial variables, may also influence the relationship between BRI and cognitive function. Moreover, mental health conditions, such as anxiety and depression, may heighten the risk of cognitive decline by impairing brain health (Zhang et al., 2024; Lotfi et al., 2022). Therefore, future research should explore how these psychological factors mediate the relationship between BRI and cognitive function. Although BRI holds promise as a non-invasive marker for predicting cognitive decline, its small effect size may limit its use as a standalone predictor. We recommend incorporating BRI into a multifactorial assessment, alongside other key risk factors such as lifestyle, genetic background, and mental health status, for a more comprehensive risk evaluation. Future longitudinal studies and larger sample multivariate analyses are needed to validate the role of BRI and enhance understanding of its applicability in diverse populations.
This study possesses several strengths, notably the use of a sample that use of a nationally representative from the NHANES, ensuring the broad applicability of the findings. Furthermore, it is the first to systematically examine the association between the BRI and cognitive function, underscoring BRI’s potential in predicting cognitive decline. This offers a unique viewpoint and instrument for identifying and addressing cognitive decline in older individuals at an early stage. The study also performed subgroup analyses, corroborating the robustness of the findings across various populations. However, this study has some limitations. First, the cross-sectional study design limits the ability to definitively establish a causal relationship between BRI and cognitive decline. Therefore, future studies should use longitudinal data or experimental designs to further validate these associations. Second, relying on specific cognitive tests may introduce bias, as these tests mainly assess memory and processing speed, potentially overlooking other cognitive domains, which may limit the ability to fully reflect overall cognitive capacity. Future studies should employ more comprehensive cognitive assessment tools to reduce this bias. Additionally, comparing BRI with traditional obesity measures (such as BMI) and exploring their respective strengths and weaknesses will provide a more accurate assessment of BRI’s effectiveness in predicting cognitive decline. Despite rigorous adjustments, fully eliminating the influence of unmeasured confounding factors remains challenging. Future studies should consider using larger sample sizes or multicenter studies to further validate these findings and provide a more comprehensive evaluation of BRI’s applicability in the elderly population.
Despite its limitations, BRI continues to show promise in predicting cognitive decline among the elderly. Integrating BRI into clinical practice could aid in early identification of high-risk individuals for cognitive decline, particularly when obesity is strongly linked to cognitive impairment. Regular BRI monitoring enables the development of personalized interventions, including dietary adjustments, exercise routines, and weight management strategies, tailored to an individual’s obesity status and cognitive risk. In public health interventions, BRI can function as a non-invasive screening tool for monitoring the health of large populations and contribute to the formulation of strategies aimed at preventing cognitive decline. Future studies should further investigate the application of BRI across various clinical settings and populations, while validating its sensitivity and specificity in predicting and monitoring cognitive decline.
5 Conclusion
In this cross-sectional study of adults aged 65 and older, the higher BRI was significantly associated with cognitive decline. This study is the first to establish this association in older U.S. adults, suggesting that BRI could be a valuable non-invasive marker for identifying individuals at risk of cognitive decline.
Data availability statement
The datasets presented in this study can be found in online repositories. The names of the repository/repositories and accession number(s) can be found at: www.cdc.gov/nchs/nhanes/.
Ethics statement
The studies involving humans were approved by National Health and Nutrition Examination Survey (NCHS Ethics Review Board). The studies were conducted in accordance with the local legislation and institutional requirements. The participants provided their written informed consent to participate in this study.
Author contributions
FZ: Data curation, Methodology, Writing – original draft, Writing – review & editing. ZN: Supervision, Validation, Writing – review & editing. CW: Writing – review & editing.
Funding
The author(s) declare financial support was received for the research, authorship, and/or publication of this article. This work was supported by National Key Clinical Specialty Scientific Research Project (Z2023161) and National Natural Science Foundation of Hunan Province in 2022 Clinical Medical Technology Innovation Guidance Project (2021SK51901).
Acknowledgments
We are grateful for the public accessibility of NHANES data and sincerely thank the NHANES staff and participants for their invaluable contributions to the project.
Conflict of interest
The authors declare that the research was conducted in the absence of any commercial or financial relationships that could be construed as a potential conflict of interest.
Publisher’s note
All claims expressed in this article are solely those of the authors and do not necessarily represent those of their affiliated organizations, or those of the publisher, the editors and the reviewers. Any product that may be evaluated in this article, or claim that may be made by its manufacturer, is not guaranteed or endorsed by the publisher.
Abbreviations
AD, Alzheimer’s disease; WC, waist circumference; BMI, body mass index; BRI, body roundness index; NHANES, National Health and Nutrition Examination Survey; NCHS, National Center for Health Statistics; MEC, mobile examination center; CERAD W-L, Consortium to Establish a Registry for Alzheimer’s Disease Word List; AFT, Animal Fluency Test; DSST, Digit Symbol Substitution Test; PIR, poverty income ratio; PHQ-9, Patient Health Questionnaire-9; SD, standard deviations; Q, Quartile; BBB, blood brain barrier; HPA, hypothalamic–pituitary–adrenal.
Footnotes
References
Ahmadi-Abhari, S., Guzman-Castillo, M., Bandosz, P., Shipley, M. J., Muniz-Terrera, G., Singh-Manoux, A., et al. (2017). Temporal trend in dementia incidence since 2002 and projections for prevalence in England and Wales to 2040: modelling study. BMJ 358:j2856. doi: 10.1136/bmj.j2856
Ali, M., Falkenhain, K., Njiru, B. N., Murtaza-Ali, M., Ruiz-Uribe, N. E., Haft-Javaherian, M., et al. (2022). VEGF signalling causes stalls in brain capillaries and reduces cerebral blood flow in Alzheimer’s mice. Brain 145, 1449–1463. doi: 10.1093/brain/awab387
Anand, S. S., Friedrich, M. G., Lee, D. S., Awadalla, P., Després, J. P., Desai, D., et al. (2022). Evaluation of adiposity and cognitive function in adults. JAMA Netw. Open 5:e2146324. doi: 10.1001/jamanetworkopen.2021.46324
Anstey, K. J., Cherbuin, N., Budge, M., and Young, J. (2011). Body mass index in midlife and late-life as a risk factor for dementia: a meta-analysis of prospective studies. Obes. Rev. 12, e426–e437. doi: 10.1111/j.1467-789X.2010.00825.x
Ardila, A. (2020). A cross-linguistic comparison of category verbal fluency test (ANIMALS): a systematic review. Arch. Clin. Neuropsychol. 35, 213–225. doi: 10.1093/arclin/acz060
Arnold, S. E., Arvanitakis, Z., Macauley-Rambach, S. L., Koenig, A. M., Wang, H. Y., Ahima, R. S., et al. (2018). Brain insulin resistance in type 2 diabetes and Alzheimer disease: concepts and conundrums. Nat. Rev. Neurol. 14, 168–181. doi: 10.1038/nrneurol.2017.185
Beeri, M. S., Tirosh, A., Lin, H. M., Golan, S., Boccara, E., Sano, M., et al. (2022). Stability in BMI over time is associated with a better cognitive trajectory in older adults. Alzheimers Dement. 18, 2131–2139. doi: 10.1002/alz.12525
Bischof, G. N., and Park, D. C. (2015). Obesity and aging: consequences for cognition, brain structure, and brain function. Psychosom. Med. 77, 697–709. doi: 10.1097/PSY.0000000000000212
Buchman, A. S., Schneider, J. A., Wilson, R. S., Bienias, J. L., and Bennett, D. A. (2006). Body mass index in older persons is associated with Alzheimer disease pathology. Neurology 67, 1949–1954. doi: 10.1212/01.wnl.0000247046.90574.0f
Chen, S. P., Bhattacharya, J., and Pershing, S. (2017). Association of Vision Loss with Cognition in older adults. JAMA Ophthalmol. 135, 963–970. doi: 10.1001/jamaophthalmol.2017.2838
Dye, L., Boyle, N. B., Champ, C., and Lawton, C. (2017). The relationship between obesity and cognitive health and decline. Proc. Nutr. Soc. 76, 443–454. doi: 10.1017/S0029665117002014
Espeland, M. A., Carmichael, O., Yasar, S., Hugenschmidt, C., Hazzard, W., Hayden, K. M., et al. (2018). Sex-related differences in the prevalence of cognitive impairment among overweight and obese adults with type 2 diabetes. Alzheimers Dement. 14, 1184–1192. doi: 10.1016/j.jalz.2018.05.015
Feigin, V. L., Vos, T., Alahdab, F., Amit, A. M. L., Bärnighausen, T. W., Beghi, E., et al. (2021). Burden of neurological disorders across the US from 1990-2017: a global burden of disease study. JAMA Neurol. 78, 165–176. doi: 10.1001/jamaneurol.2020.4152
Feinkohl, I., Lachmann, G., Brockhaus, W. R., Borchers, F., Piper, S. K., Ottens, T., et al. (2018). Association of obesity, diabetes and hypertension with cognitive impairment in older age. Clin. Epidemiol. 10, 853–862. doi: 10.2147/CLEP.S164793
Fillenbaum, G. G., and Mohs, R. (2023). CERAD (consortium to establish a registry for Alzheimer’s disease) neuropsychology assessment battery: 35 years and counting. J. Alzheimers Dis. 93, 1–27. doi: 10.3233/JAD-230026
Forny-Germano, L., De Felice, F. G., and Vieira, M. (2018). The role of leptin and adiponectin in obesity-associated cognitive decline and Alzheimer’s disease. Front. Neurosci. 12:1027. doi: 10.3389/fnins.2018.01027
Ge, X., Zheng, M., Hu, M., Fang, X., Geng, D., Liu, S., et al. (2023). Butyrate ameliorates quinolinic acid-induced cognitive decline in obesity models. J. Clin. Invest. 133:4612. doi: 10.1172/JCI154612
Gustafson, D., Lissner, L., Bengtsson, C., Björkelund, C., and Skoog, I. (2004). A 24-year follow-up of body mass index and cerebral atrophy. Neurology 63, 1876–1881. doi: 10.1212/01.WNL.0000141850.47773.5F
Gustafson, D. R., Steen, B., and Skoog, I. (2004). Body mass index and white matter lesions in elderly women. An 18-year longitudinal study. Int. Psychogeriatr. 16, 327–336. doi: 10.1017/S1041610204000353
Hughes, T. F., Borenstein, A. R., Schofield, E., Wu, Y., and Larson, E. B. (2009). Association between late-life body mass index and dementia: the kame project. Neurology 72, 1741–1746. doi: 10.1212/WNL.0b013e3181a60a58
Jaeger, J. (2018). Digit symbol substitution test: the case for sensitivity over specificity in neuropsychological testing. J. Clin. Psychopharmacol. 38, 513–519. doi: 10.1097/JCP.0000000000000941
Jia, W., Wang, H., Li, C., Shi, J., Yong, F., and Jia, H. (2024). Association between dietary vitamin B1 intake and cognitive function among older adults: a cross-sectional study. J. Transl. Med. 22:165. doi: 10.1186/s12967-024-04969-3
Johnson, C. L., Dohrmann, S. M., Burt, V. L., and Mohadjer, L. K. (2014). National health and nutrition examination survey: sample design, 2011-2014. Vital Health Stat 2 162, 1–33.
Kroenke, K., Spitzer, R. L., and Williams, J. B. (2001). The PHQ-9: validity of a brief depression severity measure. J. Gen. Intern. Med. 16, 606–613. doi: 10.1046/j.1525-1497.2001.016009606.x
Li, Z., Fan, C., Huang, J., Chen, Z., Yu, X., and Qian, J. (2024). Non-linear relationship between the body roundness index and metabolic syndrome: data from National Health and nutrition examination survey (NHANES) 1999-2018. Br. J. Nutr. 131, 1852–1859. doi: 10.1017/S0007114524000357
Livingston, G., Huntley, J., Sommerlad, A., Ames, D., Ballard, C., Banerjee, S., et al. (2020). Dementia prevention, intervention, and care: 2020 report of the lancet commission. Lancet 396, 413–446. doi: 10.1016/S0140-6736(20)30367-6
Lotfi, K., Hassanzadeh Keshteli, A., Saneei, P., Afshar, H., Esmaillzadeh, A., and Adibi, P. (2022). A body shape index and body roundness index in relation to anxiety, depression, and psychological distress in adults. Front. Nutr. 9:843155. doi: 10.3389/fnut.2022.843155
Morris, J. C., Heyman, A., Mohs, R. C., Hughes, J. P., van Belle, G., Fillenbaum, G., et al. (1989). The consortium to establish a registry for Alzheimer’s disease (CERAD). Part I. Clinical and neuropsychological assessment of Alzheimer’s disease. Neurology 39, 1159–1165
Naomi, R., Teoh, S. H., Embong, H., Balan, S. S., Othman, F., Bahari, H., et al. (2023). The role of oxidative stress and inflammation in obesity and its impact on cognitive impairments-A narrative review. Antioxidants 12:1071. doi: 10.3390/antiox12051071
Nichols, E., Steinmetz, J. D., Vollset, S. E., Fukutaki, K., Chalek, J., Abd-Allah, F., et al. (2022). Estimation of the global prevalence of dementia in 2019 and forecasted prevalence in 2050: an analysis for the Global Burden of Disease Study 2019. Lancet Public Health 7, e105–e125. doi: 10.1016/S2468-2667(21)00249-8
Noh, H. M., Han, J., Kim, Y. J., Jung, J. H., Roh, Y. K., and Song, H. J. (2019). Sex differences in the relationship between cognitive impairment and overweight or obesity in late life: a 3-year prospective study. Medicine 98:e14736. doi: 10.1097/MD.0000000000014736
Norris, T., Salzmann, A., Henry, A., Garfield, V., and Pinto Pereira, S. M. (2023). The relationship between adiposity and cognitive function: a bidirectional Mendelian randomization study in UK biobank. Int. J. Epidemiol. 52, 1074–1085. doi: 10.1093/ije/dyad043
O’Brien, P. D., Hinder, L. M., Callaghan, B. C., and Feldman, E. L. (2017). Neurological consequences of obesity. Lancet Neurol. 16, 465–477. doi: 10.1016/S1474-4422(17)30084-4
O’Donovan, G., Sarmiento, O. L., Hessel, P., Muniz-Terrera, G., Duran-Aniotz, C., and Ibáñez, A. (2022). Associations of body mass index and sarcopenia with screen-detected mild cognitive impairment in older adults in Colombia. Front. Nutr. 9:1011967. doi: 10.3389/fnut.2022.1011967
Paajanen, T., Hänninen, T., Tunnard, C., Hallikainen, M., Mecocci, P., Sobow, T., et al. (2014). CERAD neuropsychological compound scores are accurate in detecting prodromal Alzheimer’s disease: a prospective AddNeuroMed study. J. Alzheimers Dis. 39, 679–690. doi: 10.3233/JAD-122110
Peykari, N. (2021). Worldwide trends in hypertension prevalence and progress in treatment and control from 1990 to 2019: a pooled analysis of 1201 population-representative studies with 104 million participants. Lancet 398, 957–980. doi: 10.1016/S0140-6736(21)01330-1
Prentice, A. M., and Jebb, S. A. (2001). Beyond body mass index. Obes. Rev. 2, 141–147. doi: 10.1046/j.1467-789x.2001.00031.x
Puzianowska-Kuznicka, M., Kuryłowicz, A., Walkiewicz, D., Borkowska, J., Owczarz, M., Olszanecka-Glinianowicz, M., et al. (2019). Obesity paradox in Caucasian seniors: results of the pol senior study. J. Nutr. Health Aging 23, 796–804. doi: 10.1007/s12603-019-1257-z
Qu, Y., Hu, H. Y., Ou, Y. N., Shen, X. N., Xu, W., Wang, Z. T., et al. (2020). Association of body mass index with risk of cognitive impairment and dementia: a systematic review and meta-analysis of prospective studies. Neurosci. Biobehav. Rev. 115, 189–198. doi: 10.1016/j.neubiorev.2020.05.012
Rico-Martín, S., Calderón-García, J. F., Sánchez-Rey, P., Franco-Antonio, C., Martínez Alvarez, M., and Sánchez Muñoz-Torrero, J. F. (2020). Effectiveness of body roundness index in predicting metabolic syndrome: a systematic review and meta-analysis. Obes. Rev. 21:e13023. doi: 10.1111/obr.13023
Salami, M. (2021). Interplay of good Bacteria and central nervous system: cognitive aspects and mechanistic considerations. Front. Neurosci. 15:613120. doi: 10.3389/fnins.2021.613120
Salas-Venegas, V., Flores-Torres, R. P., Rodríguez-Cortés, Y. M., Rodríguez-Retana, D., Ramírez-Carreto, R. J., Concepción-Carrillo, L. E., et al. (2022). The obese brain: mechanisms of systemic and local inflammation, and interventions to reverse the cognitive deficit. Front. Integr. Neurosci. 16:798995. doi: 10.3389/fnint.2022.798995
Sripetchwandee, J., Chattipakorn, N., and Chattipakorn, S. C. (2018). Links between obesity-induced brain insulin resistance, brain mitochondrial dysfunction, and dementia. Front Endocrinol 9:496. doi: 10.3389/fendo.2018.00496
Summers, S. A. (2006). Ceramides in insulin resistance and lipotoxicity. Prog. Lipid Res. 45, 42–72. doi: 10.1016/j.plipres.2005.11.002
Takahashi, S., Fukushima, H., Yu, Z., Tomita, H., and Kida, S. (2021). Tumor necrosis factor α negatively regulates the retrieval and reconsolidation of hippocampus-dependent memory. Brain Behav. Immun. 94, 79–88. doi: 10.1016/j.bbi.2021.02.033
Talman, W. T., Dragon, D. N., and Ohta, H. (1994). Baroreflexes influence autoregulation of cerebral blood flow during hypertension. Am. J. Phys. 267, H1183–H1189. doi: 10.1152/ajpheart.1994.267.3.H1183
Tang, J., Zhao, S., Yu, S., Chi, C., Ji, H., Xiong, J., et al. (2021). Association between hypertension-mediated organ damage and obesity defined by novel anthropometric indices in community-dwelling elderly individuals. Clin. Nutr. 40, 4473–4480. doi: 10.1016/j.clnu.2020.12.035
Tchkonia, T., Morbeck, D. E., Von Zglinicki, T., et al. (2010). Fat tissue, aging, and cellular senescence. Aging Cell 9, 667–684. doi: 10.1111/j.1474-9726.2010.00608.x
Thomas, D. M., Bredlau, C., Bosy-Westphal, A., Mueller, M., Shen, W., Gallagher, D., et al. (2013). Relationships between body roundness with body fat and visceral adipose tissue emerging from a new geometrical model. Obesity (Silver Spring) 21, 2264–2271. doi: 10.1002/oby.20408
Tong, M., and de la Monte, S. M. (2009). Mechanisms of ceramide-mediated neurodegeneration. J. Alzheimers Dis. 16, 705–714. doi: 10.3233/JAD-2009-0983
Uiterwijk, R., van Oostenbrugge, R. J., Huijts, M., De Leeuw, P. W., Kroon, A. A., and Staals, J. (2016). Total cerebral small vessel disease MRI score is associated with cognitive decline in executive function in patients with hypertension. Front. Aging Neurosci. 8:301. doi: 10.3389/fnagi.2016.00301
Vreeken, D., Seidel, F., Custers, E. M., Olsthoorn, L., Cools, S., Aarts, E. O., et al. (2023). Factors associated with cognitive improvement after bariatric surgery among patients with severe obesity in the Netherlands. JAMA Netw. Open 6:e2315936. doi: 10.1001/jamanetworkopen.2023.15936
Wang, X. L., Feng, H. L., Xu, X. Z., Liu, J., and Han, X. (2024). Relationship between cognitive function and weight-adjusted waist index in people ≥ 60 years old in NHANES 2011-2014. Aging Clin. Exp. Res. 36:30. doi: 10.1007/s40520-023-02649-8
Wang, H., Hai, S., Liu, Y. X., Cao, L., Liu, Y., Liu, P., et al. (2019). Associations between Sarcopenic obesity and cognitive impairment in elderly Chinese community-dwelling individuals. J. Nutr. Health Aging 23, 14–20. doi: 10.1007/s12603-018-1088-3
Ward, M. A., Carlsson, C. M., Trivedi, M. A., Sager, M. A., and Johnson, S. C. (2005). The effect of body mass index on global brain volume in middle-aged adults: a cross sectional study. BMC Neurol. 5:23. doi: 10.1186/1471-2377-5-23
Whiley, L., Chappell, K. E., D’Hondt, E., et al. (2021). Metabolic phenotyping reveals a reduction in the bioavailability of serotonin and kynurenine pathway metabolites in both the urine and serum of individuals living with Alzheimer’s disease. Alzheimers Res. Ther. 13:20. doi: 10.1186/s13195-020-00741-z
Wilcockson, T. D. W., and Roy, S. (2024). Could alcohol-related cognitive decline be the result of Iron-induced Neuroinflammation? Brain Sci. 14:520. doi: 10.3390/brainsci14060520
Wimo, A., Seeher, K., Cataldi, R., Cyhlarova, E., Dielemann, J. L., Frisell, O., et al. (2023). The worldwide costs of dementia in 2019. Alzheimers Dement. 19, 2865–2873. doi: 10.1002/alz.12901
Wong Zhang, D. E., Tran, V., Vinh, A., Dinh, Q. N., Drummond, G. R., Sobey, C. G., et al. (2023). Pathophysiological links between obesity and dementia. NeuroMolecular Med. 25, 451–456. doi: 10.1007/s12017-023-08746-1
Yu, H., Armstrong, N., Pavela, G., and Kaiser, K. (2023). Sex and race differences in obesity-related genetic susceptibility and risk of Cardiometabolic disease in older US adults. JAMA Netw. Open 6:e2347171. doi: 10.1001/jamanetworkopen.2023.47171
Zeng, Z., Huang, K., Cen, Y., Jin, W., Shen, Y., Xiong, L., et al. (2023). Elevated visceral adiposity index linked to improved cognitive function in middle-aged and elderly Chinese: evidence from the China health and retirement longitudinal study. Front. Aging Neurosci. 15:1270239. doi: 10.3389/fnagi.2023.1270239
Zhang, X., Ma, N., Lin, Q., Chen, K., Zheng, F., Wu, J., et al. (2024). Body roundness index and all-cause mortality among US adults. JAMA Netw. Open 7:e2415051. doi: 10.1001/jamanetworkopen.2024.15051
Zhang, L., Yin, J., Sun, H., Dong, W., Liu, Z., Yang, J., et al. (2024). The relationship between body roundness index and depression: a cross-sectional study using data from the National Health and nutrition examination survey (NHANES) 2011-2018. J. Affect. Disord. 361, 17–23. doi: 10.1016/j.jad.2024.05.153
Zhang, Y., Zhang, P., and Yin, D. (2024). Association between a body shape index and cognitive impairment among us older adults from a cross-sectional survey of the NHANES 2011-2014. Lipids Health Dis. 23:169. doi: 10.1186/s12944-024-02165-2
Keywords: NHANES, cognitive function, obesity, older, body roundness index
Citation: Zhang F, Ning Z and Wang C (2024) Body roundness index and cognitive function in older adults: a nationwide perspective. Front. Aging Neurosci. 16:1466464. doi: 10.3389/fnagi.2024.1466464
Edited by:
Maria Basta, University Hospital of Heraklion, GreeceReviewed by:
Ian James Martins, University of Western Australia, AustraliaSepehr Khosravi, Tehran University of Medical Sciences, Iran
Haitao Qu, Jinan Stomatological Hospital, China
Copyright © 2024 Zhang, Ning and Wang. This is an open-access article distributed under the terms of the Creative Commons Attribution License (CC BY). The use, distribution or reproduction in other forums is permitted, provided the original author(s) and the copyright owner(s) are credited and that the original publication in this journal is cited, in accordance with accepted academic practice. No use, distribution or reproduction is permitted which does not comply with these terms.
*Correspondence: Can Wang, emh1YW53YW4tMTIwNDE3QDE2My5jb20=