Abstract
AIM:
Mild cognitive impairment (MCI) includes two distinct subtypes, namely progressive MCI (pMCI) and stable MCI (sMCI). The objective of this study was to identify the topological reorganization of brain functional networks in patients with pMCI and sMCI.
Methods:
Resting-state functional magnetic resonance imaging (rs-fMRI) was applied to patients with pMCI, sMCI and healthy controls. Graph theory was applied to study the topological characteristics of the brain’s functional networks, examining global and nodal metrics, modularity, and rich-club organization. Analysis of covariance and two sample t-tests were applied to assess differences in topological attributes between patient groups, alongside correlation analysis, which examined the value of changing topological attributes in predicting various clinical outcomes.
Results:
Significant differences between each group with regard to network metrics were observed. These included clustering coefficients and small-worldness. At the nodal level, several nodes with an abnormal degree centrality and nodal efficiency were detected. In rich club, pMCI and sMCI patients showed declined connectivity compared with HC. Significant differences were observed in the intra- and inter-module connections among the three groups. Particularly noteworthy was the irreplaceable role of the cerebellar module in network interactions.
Conclusion:
Our study revealed significant differences in network topological properties among sMCI, pMCI and HC patients, which were significantly correlated with cognitive function. Most notably, the cerebellar module played a crucial role in the overall network interactions. In conclusion, these findings could aid in the development of imaging markers used to expedite diagnosis and intervention prior to Alzheimer’s disease onset.
Introduction
Alzheimer’s disease (AD) is a neurodegenerative disorder characterized by progressive cognitive decline and memory impairment (Silva et al., 2019). Amnestic mild cognitive impairment (aMCI) is a largely asymptomatic antecedent of AD. However, given the progressive nature of this cognitive impairment, intervening at this pre-clinical stage is critical in preventing eventual AD onset. Patients with aMCI fall into two categories. Progressive MCI (pMCI) is defined as aMCI, which progressively develops into AD. Meanwhile, stable MCI (sMCI) is defined as aMCI, which either remains stable or improves over time (Chen et al., 2023; Qian et al., 2018). Currently, clinical biomarkers of AD primarily include changes in levels of tau proteins (total tau and phosphorylated tau) and β-amyloid 1–42 peptide in cerebrospinal fluid (Botello-Marabotto et al., 2023). However, due to their invasiveness, obtaining these biomarkers can be burdensome to elderly patients who are already affected by the disease.
In recent years, Resting-state functional magnetic resonance imaging (rs-fMRI) has developed rapidly, offering high temporal and spatial resolution that allows for the detection of spontaneous neuronal activity in brain networks during the resting state (Sun et al., 2023). This technology has become increasingly important in studying brain function, contributing to a more comprehensive understanding of network changes in the brain during the progression of AD (Jiang et al., 2018). At the same time, graph theory has emerged as a popular method for describing the characteristics of brain networks. In this approach, the human brain is considered as a highly intricate network that can be modelled using a collection of nodes representing distinct brain regions and a series of edges representing the connections between these regions (Bertolero et al., 2018). rs-fMRI brain network methods have been widely used to identify important topological features in human brain functional networks through graph theory analysis (Wang et al., 2013; Zdanovskis et al., 2021). In light of the growing evidence that suggested that network connectivity may help predict future Alzheimer’s disease (AD) diagnosis, analyzing differences in brain network connectivity might provide insights into distinguishing between patients with sMCI and pMCI (Delorme and Makeig, 2004; Stevens and Kircher, 1998). Several studies of brain graph theory have confirmed that brain connections are not uniformly distributed. Instead, significantly higher numbers of connections appear in certain nodes of the brain, a phenomenon referred to as “rich club” (van den Heuvel and Sporns, 2011; Yan et al., 2018; Zamora-Lopez et al., 2010). These nodes exert a significant influence on the brain’s network topology and are closely associated with global information integration (Xu et al., 2010; Yan et al., 2018). In addition, a wealth of evidence has shown the brain to be organized into distinct, specialized communities, a phenomenon known as “modularity”. Neurons within each of these communities or “modules” have stronger intra-module connectivity compared to inter-module connectivity, promoting efficient information processing (Bertolero et al., 2015; Bertolero et al., 2017; Meunier et al., 2010). Modularity and rich club, as well as global and nodal connectivity indicators, such as the small-world characteristic and nodal effectivity, play different roles in network communication. Studying these indicators can help reveal distinct and unique patterns in the connectome of the brain.
Rich club nodes have been suggested to have higher metabolic demands compared to other nodes, potentially making them more susceptible to the impact of degenerative diseases (Bullmore and Sporns, 2012). The existing body of research suggests that the global and local network organization of the whole brain is altered in AD and antecedent cognitive decline (Li et al., 2018; Shu et al., 2012). Patients with each stage of AD (from preclinical to late-stage dementia) have distinctive distributions of centrally concentrated lesions (Buckner et al., 2009; Crossley et al., 2014). Recently, researchers have investigated the predictive efficacy of various measures of modularity in assessing MCI and AD progression stage (de Haan et al., 2012). Previous studies using multiparametric graph theoretical analysis revealed altered functional and structural network topology in AD and these different connectivity metrics indicated additional or complementary information of brain networks regarding the topological changes in MCI or AD (Berlot et al., 2016; Jiang et al., 2018). Compared with other methods focusing on functional network connectivity and brain network properties in patients with cognitive impairment, whether differences in multiparametric network may be predictive of a patient having either pMCI or sMCI is unknown. Studying the alterations in brain network properties associated with pMCI and sMCI is crucial for understanding the patterns of changes in their brain networks and elucidating the pathological mechanisms underlying both conditions.
Therefore, in this study, we used rs-fMRI to construct functional networks for sMCI, pMCI, and healthy control (HC) patients. Subsequently, we used graph theory analysis to compare the diversity of the topological properties of the whole-brain functional networks across three groups. Our main goal was to explore the differences in the network topological properties between pMCI and sMCI. Overall, we hypothesized: 1) pMCI and sMCI network topology attributes to be different; 2) differences to potentially be significantly associated with cognitive function; 3) during the progression of AD, alterations in specific brain regions may occur, which might contribute to the diagnosis and prediction of the disease.
Methods
Participants
The applied research data for our study were acquired from the Alzheimer’s disease Neuroimaging Initiative (ADNI) database.1 The details regarding the diagnostic criteria used to categorize patients into either pMCI, sMCI or HC groups are provided in Supplementary Table 1.
MRI data acquisition
We attained all MRI scans on a 3.0T scanner, unifying scanning protocols obtained from various manufacturers, including Philips (Best in the Netherlands), General Electric (Cleveland, OH, USA) and Siemens (Munich, Germany). Detailed information can be obtained from the MRI Training Manual FINAL.pdf2 and the http://adni.loni.usc.edu/wp-content/uploads/2017/07/ADNI3-MRI-protocols.pdf.
Neuropsychological assessment
Participants’ general cognitive abilities were evaluated by the Montreal Cognitive Assessment (MOCA). Meanwhile, episodic memory (EM) was assessed using the composite score derived from the Rey Auditory Verbal Learning Test, the Alzheimer Disease Assessment Scale-Cognitive, Logical Memory and the mini mental state exam (MMSE) and executive function (EF) was assessed using the composite score derived from Category Fluency, WAIS-R Digit Symbol, Trails A & B, DigitSpan Backwards, and clock drawing tests. All neurocognitive assessments are available on the ADNI website.3 The methods for measuring EM and EF are described in the Supplementary Table 1.
Data pre-processing
The preprocessing was conducted in MATLAB (2015b) and Data Processing and Analysis for Brain Imaging (DPABI), which was based on the Statistical Parametric Mapping software package (SPM12). The details regarding image pre-processing are provided in the Supplementary Table 1.
Network construction
Functional connectivity networks were analysed using the Graph Theoretical Network Analysis (GRETNA) toolbox (Wang et al., 2015). The details regarding network construction are provided in the Supplementary Table 1.
Network properties
Recent researches have suggested that small-world topology exists in functional brain networks (Xue et al., 2020). To research the topological attributes of each network, the study assessed the following graph metrics (see Supplementary Table 1): characteristic path length (Lp), normalized characteristic path length (λ), clustering coefficient (Cp), normalized clustering coefficient (γ), small-world parameters (σ), global efficiency (Eg), local efficiency (Eloc), betweenness centrality (BC), degree centrality (DC), nodal efficiency (NE), and nodal local efficiency (NLE). Additionally, for each property, we calculated the area under the curve, providing a scalar, which was independent of threshold selection. This allowed better characterization of the topological characteristics of the brain network.
Modular organization
Based on previous research (Suo et al., 2022), the AAL116 template divided the 116 regions of interest (ROIs) into six modules, namely the sensorimotor network (SMN), default mode network (DMN), frontoparietal network (FPN), visual network (VN), subcortical network (SN), and cerebral network (CN). A modularity metric, Q, was calculated to assess the degree of subdivision within each network into specific modules, which were defined by having more intra-modular connections than inter-modular connections (Newman, 2006). The GRETNA software utilized a modified greedy optimization algorithm to identify the optimal modular architecture by averaging the functional networks of all participants. For each subject, the mean intra-modular strength was defined as the average number of connections to other regions of the selected module, whilst the mean inter-modular strength was defined as the average number of connections between the selected module and other modules.
Rich-club organization
Rich-club regions were defined as the top 13 regions with the highest average nodal degree of all regions in HC patients, accounting for 12% of the total number of regions (Daianu et al., 2015; Yan et al., 2018). Regions other than the rich-club regions were classified as peripheral nodes. The edges in the network were categorized into three types of connections: rich-club connections, which linked two rich-club nodes; feeder connections, which connected one rich node and one peripheral node; and local connections, which connected two peripheral nodes (van den Heuvel et al., 2013). The connectivity strength was a summary measure of connectivity, which was calculated using the sum of the edge weights for each connection type (Yan et al., 2018).
Statistical analysis
Analysis of covariance (ANCOVA) and chi-squared tests were used to compare the demographic and neurocognitive data across the three groups, containing pMCI, sMCI and HC patients. Bonferroni’s correction with a p < 0.05 was used for post hoc analysis when test parameters were met.
Furthermore, two-sample t-tests (age- and sex-corrected) were performed to compare the AUC values of network metrics, including between the three groups (p < 0.05, FDR-corrected).
Lastly, correlation analysis was conducted to explore the relationship between altered network metrics and various types of cognitive function, including EM and EF. The correlation between network metrics and age, gender, years of education and volume of grey matter was also assessed (Bonferroni-corrected, p < 0.05).
All statistical tests and comparisons were conducted using the Statistical Package for the Social Sciences (SPSS; version 22.0; IBM, Armonk, NY, USA).
Results
Demographic and clinical variables
Table 1 presents the demographic and neurocognitive characteristics of all participants, including 31 pMCI, 41 sMCI, and 82 HC participants. SPSS revealed that the HC group exhibited a significant difference in years of education compared to the pMCI and sMCI groups and significant differences in cognitive performance were noted between all groups. SPSS revealed that the pMCI and sMCI groups exhibited significantly lower EM, EF, and MOCA test scores compared to the HC group (Bonferroni’s post hoc correction, p < 0.05). Detailed neuropsychological test results are provided in Supplementary Table 1.
TABLE 1
| pMCI (31) | sMCI (40) | HC (80) | F-values (χ 2) | P-values | |
| Age (years) | 72.99 (7.06) | 71.46 (7.68) | 72.68 (6.02) | 0.593 | 0.554 |
| Gender (F/M) | 15/16 | 19/21 | 46/34 | 0.863 | 0.650 |
| PTEDUCAT | 15.60* | 15.71* | 17.04 | 5.594 | 0.005ac |
| MMSE | 26.93 (1.78)***/* | 27.90 (1.54)*** | 29.06 (1.39) | 23.874 | <0.001abc |
| MOCA | 21.50 (3.79)***/* | 23.76 (3.30)*** | 26.23 (2.72) | 27.347 | <0.001abc |
| EM | −0.11***/*** | 0.43*** | 1.07 | 54.720 | <0.001abc |
| EF | −0.08***/** | 0.57** | 1.16 | 27.259 | <0.001abc |
Demographics and clinical measures of three groups, including pMCI, sMCI, and HC.
Numbers are given as means (standard deviation, SD) unless stated otherwise. Scores reflect the number of correct items unless stated otherwise. Values for age derived from ANOVA; gender from chi-square test; all clinical measures from ANOVA with age and gender as covariates. MMSE, Mini-Mental State Examination; MOCA, Montreal Cognitive Assessment; EM, episodic memory; EF, executive function; a, post-hoc analyses showed a significantly group difference between pMCI and HC; b, post-hoc analyses showed a significantly group difference between pMCI and sMCI; c, post-hoc analyses showed a significantly group difference between sMCI and HC;
*p < 0.05;
**p < 0.01;
***p < 0.001; pMCI, progressive mild cognitive impairment; sMCI, stable mild cognitive impairment; HC, healthy controls; Detailed neuropsychological test results are provided in SI results.
Group differences in global network organization
In this experiment, HC, pMCI and sMCI patients all showed small-worldness (γ > 1, λ ≈ 1, σ > 1.1). Cp Eloc and Eglob for all three groups increased with higher thresholds, while the values of Lp, γ, λ, and σ decreased (Figure 1). Interestingly, as shown in Figure 1, compared with pMCI patients, those with sMCI or who were HCs had significantly lower values of γ and σ (FDR < 0.05).
FIGURE 1

The differences in global metrics of the brain functional networks among progressive mild cognitive impairment, stable mild cognitive impairment, and healthy controls. pMCI, progressive mild cognitive impairment; sMCI, stable mild cognitive impairment; HC, healthy controls; Cp, clustering coefficient; Lp, shortest path length; sigma (δ), small-world characteristic; gamma (γ), normalized clustering coefficient; lambda (λ), normalized characteristic path length; aCp, AUC in Cp; aGambda, AUC in Gambda; aLambda, AUC in Lambda; aLp, AUC in Lp; aSigma, AUC in Sigma. *p < 0.05.
Group differences in nodal network metrics
As shown in Figure 2, for nodal metrics, compared with HC patients, pMCI showed significantly increased Dc in the right superior parietal gyrus (SPG.R) and decreased Dc and Ne in the left inferior cerebellum (CRBLCrus2.L). Meanwhile, sMCI patients showed significantly increased Dc in the right gyrus rectus (REC.R) and decreased Dc in right (CRBLCrus2.R) and the left inferior cerebellum, and left superior cerebellum (CRBLCrus1.L) compared with HC patients. No significant differences in these metrics were observed between patients in the pMCI and sMCI groups.
FIGURE 2

The bar graphs show the post hoc pairwise comparisons with significant differences in nodal efficiency and nodal degree. The y-axes are the area under the curve of the two network parameters and the three groups are color coded as in the key. The x-axis shows the brain regions. pMCI, progressive mild cognitive impairment; sMCI, stable mild cognitive impairment; HC, healthy controls; REC.R, right gyrus rectus; SPG.R, right superior parietal gyrus; CRBLCrus1.L, left superior cerebellum; CRBLCrus2.L, left inferior cerebellum; CRBLCrus2.R, right inferior cerebellum; *p < 0.05.
Group differences in intra-and inter-modular connections
As shown in Figure 3, for inter-modular connections, pMCI patients showed increased connectivity between the SN and CN, the DMN and VN, the FPN and VN, and the FPN and CN when compared with HC patients. Meanwhile, sMCI patients showed increased connectivity between the CN and SMN, the FPN and DMN and the SMN and DMN when compared with HC patients. Importantly, compared with pMCI patients, sMCI showed decreased connectivity between the FPN and VN. For intra-modular connectivity, compared with HC patients, both sMCI and pMCI patients showed decreased connectivity within the SMN, DMN and CN. Although there was no significance between pMCI and sMCI patients with regard to intra-modular connectivity, pMCI patients did display a non-significant downward trend.
FIGURE 3

Progressive mild cognitive impairment, stable mild cognitive impairment, and healthy controls have significant differences in intra- and inter-modular connections. pMCI, progressive mild cognitive impairment; sMCI, stable mild cognitive impairment; HC, healthy controls; SMN, sensorimotor network; DMN, default mode network; FPN, frontoparietal network, VN, visual network; SN, subcortical network; CN, cerebral network.
Group differences in rich-club organization
As shown in Figure 4, based on the group-averaged functional network, the rich-club nodes were defined as the top 13 (12%) brain regions with the highest average nodal degree of all regions in HC patients. For rich-club connection, there was a significant difference between HC patients and both pMCI and sMCI patients (p < 0.05). For local connection, there are significant differences between sMCI and HC. However, there was no significant difference for feeder connection.
FIGURE 4

Boxplots exhibit connectivity strengths for rich club, feeder and local. pMCI, progressive mild cognitive impairment; sMCI, stable mild cognitive impairment; HC, healthy controls; *p < 0.05, ***p < 0.001.
Correlation analysis
Figure 5 demonstrates a significant correlation between network topology attributes and neurocognitive test scores for patients with pMCI and HC. The intramodular connectivity in SMN was positively correlated with EM (p = 0.0152, r = 0.4622).
FIGURE 5
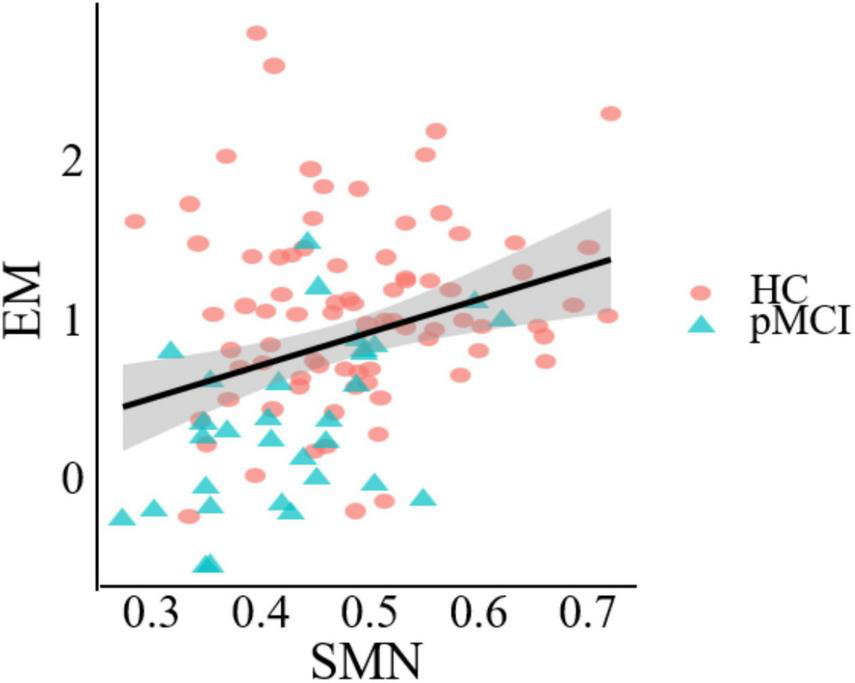
Significant associations between altered network metric and cognitive function in groups between pMCI and HC. Age, the volume of gray matter and sex were used as covariates of results (Bonferroni-corrected, p < 0.05). EM, episodic memory; SMN, sensorimotor network.
Discussion
We employed graph theory analysis in the study with rs-fMRI data to explore if they exist in differences of the network topology across pMCI, sMCI, and cognitive health. Meanwhile, whether the whole-brain functional network could serve as predictors of the three patient groups. Consistent with our hypotheses, our research found in the following: first, there were significant differences among the pMCI, sMCI, and HC patient groups in terms of global properties, local properties, rich club organization, and modularity. Moreover, these differences were significantly associated with cognitive function. Lastly, our findings indicated that these network topological properties were most strongly associated with the CN. Understanding the value of the CN in AD severity may provide valuable information for analyzing pathology mechanisms and predicting the prognosis of MCI patients.
Global and local properties are related to the small-world property, which is measured by the degree to which networks exhibit high clustering coefficients and short path lengths (Sun et al., 2014). Networks with such properties were thought to possess higher network and local efficiency, resulting in faster information transmission (van den Heuvel et al., 2008). The previous studies revealed the pMCI and sMCI patient groups exhibited some special small-world topology (Sun et al., 2018). In our study, compared with both HC and sMCI patients, pMCI patients showed significantly lower small-world parameters (σ), and normalized clustering coefficient (γ). γ was defined as the probability of connections between adjacent regions, and its reduction in pMCI patients may suggest disruptions in brain networks, leading to restricted information flow (Pereira et al., 2016). Based on a previous study, this limitation may impact memory, cognition and other cognitive functions that may be linked to the progression to dementia in AD (Li et al., 2012). At the same time, networks with a high small-world parameter (σ) have most nodes tightly connected, while maintaining a short average path length between any two nodes, enabling efficient local information processing and rapid global communication (Guo et al., 2022). A decrease in σ may indicate that the integration and allocation of the pMCI networks have been affected. These reduced global network attributes indicated the functional network of pMCI patients to be abnormal with reduced efficiency of specialized and integrated processing (van den Heuvel et al., 2008; Wang et al., 2013). Moreover, in comparison to pMCI patients, our findings indicated sMCI patients to not exhibit a significant decline in global properties. This could be attributed to the actions of compensatory mechanisms in these individuals, which might effectively offset impaired brain function. Ultimately, similar to previous studies, our results showed that various small-world topological properties change with the progression of AD, and the differing degrees of change between pMCI and sMCI may help distinguish between them (Sanz-Arigita et al., 2010; Xue et al., 2020).
Nodal network metrics may contribute to distinguish from the three groups in this study, and we found that compared with HC patients, pMCI and sMCI patients exhibited significantly lower degree centrality (Dc) and nodal efficiency (Ne) at CRBLCrus1.L, CRBLCrus2.L, CRBLCrus2.R, while the opposite was at SPG.R, REC.R. Degree centrality is an important attribute measuring the number of connections a node has with other nodes its own network, while nodal efficiency is an index to evaluate the efficiency of information transmission (Itahashi et al., 2014; Liao et al., 2017). Our results implied higher hub connectivity to be associated with increased vulnerability to pathology, likely because such connectivity would have been more energy intensive to maintain (Griffa and Van den Heuvel, 2018). Alteration in the network properties of these nodes may affect the connectivity and efficiency of communication with other areas more. Therefore, early prevention of the decline of these hub nodes connections may delay the course of AD.
The rich club refers to a trend in brain networks where high-degree nodes are more tightly connected than low-degree nodes, with these hub nodes (rich club nodes) connections playing a crucial role in global information transmission (Albert et al., 2000; Xue et al., 2019). In our study, compared with HC patients, there were significantly decreased rich-club connections in both pMCI and sMCI patients. Additionally, as mentioned above, we found that reduced node attributes in the disease group were mainly within the rich club nodes, while increased attributes were primarily located outside these nodes. In a previous study, it had been demonstrated that AD spectrum rich-club connection is preferentially attacked (Shu et al., 2018), which was consilient with our findings. Besides, although there was no significant difference between sMCI and pMCI patients with regard to the number of feeder and local connections, we found that connections tended to be higher in pMCI than in sMCI patients. This elevation of non-richclub connections may compensate for some of the impaired brain function caused by reduced rich-club connections. However, the rich-club connections were a leading factor in facilitating the comprehensive integration of neural information across diverse brain regions, explaining why global information processing function in pMCI and sMCI patients was still reduced.
In contrast to the high-degree nodes of the rich club, modularity refers to groups of nodes within a network that are densely connected internally but sparsely connected externally (Liang et al., 2015). These modular groups achieve a complex balance between energy costs and communication efficiency, and changes in their structure can impact system efficiency and performance (Andric and Hasson, 2015; Sporns and Betzel, 2016). In our study, both pMCI and sMCI patients had widespread alterations compared with HC patients at the modular level. They showed decreased intra-modular connectivity within the DMN, SMN and CN. The DMN is considered to be a key network in several neurodegenerative diseases, including AD (Buckner et al., 2008; Turner and Spreng, 2012). A decline in intra-modular connectivity within the DMN in disease groups may lead to reduced efficiency in information transmission within the network. Moreover, recent studies have also shown certain regions of the SMN to play an important role in the regulation of memory (Liang et al., 2013). Consistent with this, the results of this study indicated a significant correlation between intra-module connectivity of the SMN and EM test scores, revealing the important role of this network in perceptual cognition, motor learning, and other aspects of MCI disease progression (Figure 5). Interestingly, both pMCI and sMCI patients showed an upward trend in inter-modular connectivity compared to HC patients, possibly to counter the cognitive decline caused by the decline in intra-modular connectivity. At the same time, we found pMCI patients to have a significantly higher number of connections between the FPN and VN compared to sMCI patients. This is consistent with previous studies showing that cognitive decline in aMCI patients is related to disrupted connectivity between the FPN and VN and that this disruption accelerates progression to AD (Chen et al., 2022). Patients with pMCI may compensate for their declining cognitive function by increasing connectivity.
Most importantly, our experiment revealed that changes in both intra-modular and inter-modular connectivity were predominantly associated with CN, suggesting that CN may play an indispensable role in the progression of AD. In the past, most researches on AD focuses on the interaction of cerebral networks, the thought of an effect of cerebellar networks on AD may be a new perspective. Previous studies have shown that cognitive dysfunction after CN injury involves multiple cognitive domains (Yao et al., 2022). Additionally, changes in the modular structure in aMCI were primarily observed in the CN (Zhang et al., 2020). In fact, in our study, we observed that nodes with significantly different attribute values at the nodal level and hub nodes within the rich club predominantly reside within the CN. Additionally, in terms of modularity, the CN exhibited the highest degree of interaction with other network modules. Damage to cerebellar networks can lead to extensive disconnection of whole brain networks (Wang et al., 2022). Our study has contributed to new evidence indicating abnormalities in CN connectivity among individuals with MCI. Furthermore, our research highlights the importance of understanding the relationship between CN connectivity and MCI, given the potential for this knowledge to potentially help delay the progression of the disease. By gaining a deeper understanding of these connections, we can develop more effective interventions and treatments to improve outcomes for individuals with early-stage cognitive decline.
Limitations
There were several limitations to the current study. First, the patient sample size was small, perhaps making the results less generalizable. However, to avoid this problem, we applied a non-parametric permutation test to improve the accuracy and will continue to increase our sample size as the ADNI database is updated. Second, the HC showed significant differences according to years of education in the pMCI and sMCI groups. Thus, years of education were treated as a covariable in all the analyses.
Conclusion
Our study revealed significant differences in network topological properties among the three groups of participants, which were significantly correlated with cognitive function. Furthermore, distinct patterns of connectivity were observed within and between modules. Most notably, the cerebellar module played a crucial role in overall network interactions. This suggested that exploring the progression of Alzheimer’s disease with a focus on cerebellar networks to be a potentially viable strategy. In conclusion, these findings may be used as imaging markers for early diagnosis and intervention of AD.
Statements
Data availability statement
The original contributions presented in the study are included in the article/Supplementary material, further inquiries can be directed to the corresponding authors.
Ethics statement
The studies involving humans were approved by Alzheimer’s disease neuroimaging initiative. The studies were conducted in accordance with the local legislation and institutional requirements. The participants provided their written informed consent to participate in this study.
Author contributions
CX: Conceptualization, Data curation, Formal analysis, Funding acquisition, Investigation, Project administration, Resources, Supervision, Validation, Writing – original draft, Writing – review and editing. DZ: Conceptualization, Data curation, Formal analysis, Investigation, Methodology, Project administration, Resources, Software, Supervision, Validation, Visualization, Writing – original draft, Writing – review and editing. YR: Conceptualization, Data curation, Investigation, Methodology, Project administration, Resources, Validation, Writing – review and editing. XC: Formal analysis, Methodology, Project administration, Resources, Supervision, Validation, Writing – review and editing. XZ: Conceptualization, Formal analysis, Investigation, Methodology, Validation, Visualization, Writing – review and editing. WQ: Conceptualization, Data curation, Methodology, Project administration, Resources, Validation, Visualization, Writing – review and editing. QY: Conceptualization, Formal analysis, Investigation, Methodology, Project administration, Supervision, Validation, Writing – review and editing. XL: Formal analysis, Methodology, Project administration, Supervision, Validation, Writing – original draft. QH: Data curation, Formal analysis, Funding acquisition, Investigation, Methodology, Project administration, Supervision, Validation, Writing – original draft, Writing – review and editing.
Funding
The author(s) declare that no financial support was received for the research, authorship, and/or publication of this article.
Acknowledgments
Data collection and sharing for this project was funded by the Alzheimer’s Disease Neuroimaging Initiative (ADNI; National Institutes of Health Grant U01 AG024904) and DOD ADNI (Department of Defense award number W81XWH-12-2-0012). ADNI is funded by the National Institute on Aging, the National Institute of Biomedical Imaging and Bioengineering, and through generous contributions from the following: AbbVie; Alzheimer’s Association; Alzheimer’s Drug Discovery Foundation; Araclon Biotech; BioClinica, Inc.; Biogen; Bristol-Myers Squibb Company; CereSpir, Inc.; Cogstate; Eisai Inc.; Elan Pharmaceuticals, Inc.; Eli Lilly and Company; EuroImmun; F. Hoffmann-La Roche Ltd. and its affiliated company Genentech, Inc.; Fujirebio; GE Healthcare; IXICO Ltd.; Janssen Alzheimer Immunotherapy Research & Development, LLC.; Johnson & Johnson Pharmaceutical Research & Development LLC.; Lumosity; Lundbeck; Merck & Co., Inc.; Meso Scale Diagnostics, LLC.; NeuroRx Research; Neurotrack Technologies; Novartis Pharmaceuticals Corporation; Pfizer Inc.; Piramal Imaging; Servier; Takeda Pharmaceutical Company; and Transition Therapeutics. The Canadian Institutes of Health Research is providing funds to support ADNI clinical sites in Canada. Private sector contributions are facilitated by the Foundation for the National Institutes of Health (www.fnih.org). The grantee organization is the Northern California Institute for Research and Education, and the study is coordinated by the Alzheimer’s Therapeutic Research Institute at the University of Southern California. ADNI data are disseminated by the Laboratory for NeuroImaging at the University of Southern California.
Conflict of interest
The authors declare that the research was conducted in the absence of any commercial or financial relationships that could be construed as a potential conflict of interest.
Publisher’s note
All claims expressed in this article are solely those of the authors and do not necessarily represent those of their affiliated organizations, or those of the publisher, the editors and the reviewers. Any product that may be evaluated in this article, or claim that may be made by its manufacturer, is not guaranteed or endorsed by the publisher.
Supplementary material
The Supplementary Material for this article can be found online at: https://www.frontiersin.org/articles/10.3389/fnagi.2024.1467054/full#supplementary-material
References
1
Albert R. Jeong H. Barabasi A. L. (2000). Error and attack tolerance of complex networks.Nature406378–382. 10.1038/35019019
2
Andric M. Hasson U. (2015). Global features of functional brain networks change with contextual disorder.Neuroimage117103–113. 10.1016/j.neuroimage.2015.05.025
3
Berlot R. Metzler-Baddeley C. Ikram M. A. Jones D. K. O’Sullivan M. J. (2016). Global efficiency of structural networks mediates cognitive control in mild cognitive impairment.Front. Aging Neurosci.8:292. 10.3389/fnagi.2016.00292
4
Bertolero M. A. Yeo B. T. T. D’Esposito M. (2017). The diverse club.Nat. Commun.8:1277. 10.1038/s41467-017-01189-w
5
Bertolero M. A. Yeo B. T. T. Bassett D. S. D’Esposito M. (2018). A mechanistic model of connector hubs, modularity and cognition.Nat. Hum. Behav.2765–777. 10.1038/s41562-018-0420-6
6
Bertolero M. A. Yeo B. T. D’Esposito M. (2015). The modular and integrative functional architecture of the human brain.Proc. Natl. Acad. Sci. U.S.A.112E6798–E6807. 10.1073/pnas.1510619112
7
Botello-Marabotto M. Martinez-Bisbal M. C. Calero M. Bernardos A. Pastor A. B. Medina M. et al (2023). Non-invasive biomarkers for mild cognitive impairment and Alzheimer’s disease.Neurobiol. Dis.187106312. 10.1016/j.nbd.2023.106312
8
Buckner R. L. Andrews-Hanna J. R. Schacter D. L. (2008). The brain’s default network: Anatomy, function, and relevance to disease.Ann. N. Y. Acad. Sci.11241–38. 10.1196/annals.1440.011
9
Buckner R. L. Sepulcre J. Talukdar T. Krienen F. M. Liu H. Hedden T. et al (2009). Cortical hubs revealed by intrinsic functional connectivity: Mapping, assessment of stability, and relation to Alzheimer’s disease.J. Neurosci.291860–1873. 10.1523/JNEUROSCI.5062-08.2009
10
Bullmore E. Sporns O. (2012). The economy of brain network organization.Nat. Rev. Neurosci.13336–349. 10.1038/nrn3214
11
Chen S. Song Y. Wu H. Ge H. Qi W. Xi Y. et al (2022). Hyperconnectivity associated with anosognosia accelerating clinical progression in amnestic mild cognitive impairment.ACS Chem. Neurosci.13120–133. 10.1021/acschemneuro.1c00595
12
Chen S. Wu H. Song Y. Ge H. Yan Z. Xue C. et al (2023). Altered structural and functional homotopic connectivity associated with the progression from mild cognitive impairment to Alzheimer’s disease.Psychiatry Res.319:115000. 10.1016/j.psychres.2022.115000
13
Crossley N. A. Mechelli A. Scott J. Carletti F. Fox P. T. McGuire P. et al (2014). The hubs of the human connectome are generally implicated in the anatomy of brain disorders.Brain1372382–2395. 10.1093/brain/awu132
14
Daianu M. Jahanshad N. Nir T. M. Jack C. R. Jr. Weiner M. W. Bernstein M. A. et al (2015). Rich club analysis in the Alzheimer’s disease connectome reveals a relatively undisturbed structural core network.Hum. Brain Mapp.363087–3103. 10.1002/hbm.22830
15
de Haan W. van der Flier W. M. Koene T. Smits L. L. Scheltens P. Stam C. J. (2012). Disrupted modular brain dynamics reflect cognitive dysfunction in Alzheimer’s disease.Neuroimage593085–3093. 10.1016/j.neuroimage.2011.11.055
16
Delorme A. Makeig S. (2004). EEGLAB: An open source toolbox for analysis of single-trial EEG dynamics including independent component analysis.J. Neurosci. Methods1349–21. 10.1016/j.jneumeth.2003.10.009
17
Griffa A. Van den Heuvel M. P. (2018). Rich-club neurocircuitry: Function, evolution, and vulnerability.Dialogues Clin. Neurosci.20121–132. 10.31887/DCNS.2018.20.2/agriffa
18
Guo Z. Liu K. Li J. Zhu H. Chen B. Liu X. (2022). Disrupted topological organization of functional brain networks in Alzheimer’s disease patients with depressive symptoms.BMC Psychiatry22:810. 10.1186/s12888-022-04450-9
19
Itahashi T. Yamada T. Watanabe H. Nakamura M. Jimbo D. Shioda S. et al (2014). Altered network topologies and hub organization in adults with autism: A resting-state fMRI study.PLoS One9:e94115. 10.1371/journal.pone.0094115
20
Jiang L. W. Qian R. B. Fu X. M. Zhang D. Peng N. Niu C. S. et al (2018). Altered attention networks and DMN in refractory epilepsy: A resting-state functional and causal connectivity study.Epilepsy Behav.8881–86. 10.1016/j.yebeh.2018.06.045
21
Li K. Luo X. Zeng Q. Jiaerken Y. Xu X. Huang P. et al (2018). Aberrant functional connectivity network in subjective memory complaint individuals relates to pathological biomarkers.Transl. Neurodegener.7:27. 10.1186/s40035-018-0130-z
22
Li Y. Wang Y. Wu G. Shi F. Zhou L. Lin W. et al (2012). Discriminant analysis of longitudinal cortical thickness changes in Alzheimer’s disease using dynamic and network features.Neurobiol. Aging33:427.e415–e430. 10.1016/j.neurobiolaging.2010.11.008
23
Liang F. Jia J. Wang S. Qin W. Liu G. (2013). Decreased plasma levels of soluble low density lipoprotein receptor-related protein-1 (sLRP) and the soluble form of the receptor for advanced glycation end products (sRAGE) in the clinical diagnosis of Alzheimer’s disease.J. Clin. Neurosci.20357–361. 10.1016/j.jocn.2012.06.005
24
Liang X. He Y. Salmeron B. J. Gu H. Stein E. A. Yang Y. (2015). Interactions between the salience and default-mode networks are disrupted in cocaine addiction.J. Neurosci.358081–8090. 10.1523/JNEUROSCI.3188-14.2015
25
Liao X. Vasilakos A. V. He Y. (2017). Small-world human brain networks: Perspectives and challenges.Neurosci. Biobehav. Rev.77286–300. 10.1016/j.neubiorev.2017.03.018
26
Meunier D. Lambiotte R. Bullmore E. T. (2010). Modular and hierarchically modular organization of brain networks.Front. Neurosci.4:200. 10.3389/fnins.2010.00200
27
Newman M. E. (2006). Modularity and community structure in networks.Proc. Natl. Acad. Sci. U.S.A.1038577–8582. 10.1073/pnas.0601602103
28
Pereira J. B. Mijalkov M. Kakaei E. Mecocci P. Vellas B. Tsolaki M. et al (2016). Disrupted network topology in patients with stable and progressive mild cognitive impairment and Alzheimer’s disease.Cereb. Cortex263476–3493. 10.1093/cercor/bhw128
29
Qian L. Liu R. Qin R. Zhao H. Xu Y. (2018). The associated volumes of sub-cortical structures and cognitive domain in patients of mild cognitive impairment.J. Clin. Neurosci.5656–62. 10.1016/j.jocn.2018.07.010
30
Sanz-Arigita E. J. Schoonheim M. M. Damoiseaux J. S. Rombouts S. A. Maris E. Barkhof F. et al (2010). Loss of ‘small-world’ networks in Alzheimer’s disease: Graph analysis of FMRI resting-state functional connectivity.PLoS One5:e13788. 10.1371/journal.pone.0013788
31
Shu N. Liang Y. Li H. Zhang J. Li X. Wang L. et al (2012). Disrupted topological organization in white matter structural networks in amnestic mild cognitive impairment: Relationship to subtype.Radiology265518–527. 10.1148/radiol.12112361
32
Shu N. Wang X. Bi Q. Zhao T. Han Y. (2018). Disrupted topologic efficiency of white matter structural connectome in individuals with subjective cognitive decline.Radiology286229–238. 10.1148/radiol.2017162696
33
Silva M. V. F. Loures C. M. G. Alves L. C. V. de Souza L. C. Borges K. B. G. Carvalho M. D. G. (2019). Alzheimer’s disease: Risk factors and potentially protective measures.J. Biomed. Sci.26:33. 10.1186/s12929-019-0524-y
34
Sporns O. Betzel R. F. (2016). Modular brain networks.Annu. Rev. Psychol.67613–640. 10.1146/annurev-psych-122414-033634
35
Stevens A. Kircher T. (1998). Cognitive decline unlike normal aging is associated with alterations of EEG temporo-spatial characteristics.Eur. Arch. Psychiatry Clin. Neurosci.248259–266. 10.1007/s004060050047
36
Sun Y. Bi Q. Wang X. Hu X. Li H. Li X. et al (2018). Prediction of conversion from amnestic mild cognitive impairment to Alzheimer’s disease based on the brain structural connectome.Front. Neurol.9:1178. 10.3389/fneur.2018.01178
37
Sun Y. Shi Q. Ye M. Miao A. (2023). Topological properties and connectivity patterns in brain networks of patients with refractory epilepsy combined with intracranial electrical stimulation.Front. Neurosci.17:1282232. 10.3389/fnins.2023.1282232
38
Sun Y. Yin Q. Fang R. Yan X. Wang Y. Bezerianos A. et al (2014). Disrupted functional brain connectivity and its association to structural connectivity in amnestic mild cognitive impairment and Alzheimer’s disease.PLoS One9:e96505. 10.1371/journal.pone.0096505
39
Suo X. Lei D. Li N. Peng J. Chen C. Li W. et al (2022). Brain functional network abnormalities in parkinson’s disease with mild cognitive impairment.Cereb. Cortex324857–4868. 10.1093/cercor/bhab520
40
Turner G. R. Spreng R. N. (2012). Executive functions and neurocognitive aging: Dissociable patterns of brain activity.Neurobiol. Aging33826.e821–e813. 10.1016/j.neurobiolaging.2011.06.005
41
van den Heuvel M. P. Sporns O. (2011). Rich-club organization of the human connectome.J. Neurosci.3115775–15786. 10.1523/JNEUROSCI.3539-11.2011
42
van den Heuvel M. P. Sporns O. Collin G. Scheewe T. Mandl R. C. Cahn W. et al (2013). Abnormal rich club organization and functional brain dynamics in schizophrenia.JAMA Psychiatry70783–792. 10.1001/jamapsychiatry.2013.1328
43
van den Heuvel M. P. Stam C. J. Boersma M. Hulshoff Pol H. E. (2008). Small-world and scale-free organization of voxel-based resting-state functional connectivity in the human brain.Neuroimage43528–539. 10.1016/j.neuroimage.2008.08.010
44
Wang D. Yao Q. Lin X. Hu J. Shi J. (2022). Disrupted topological properties of the structural brain network in patients with cerebellar infarction on different sides are associated with cognitive impairment.Front. Neurol.13:982630. 10.3389/fneur.2022.982630
45
Wang J. Wang X. Xia M. Liao X. Evans A. He Y. (2015). GRETNA: A graph theoretical network analysis toolbox for imaging connectomics.Front. Hum. Neurosci.9:386. 10.3389/fnhum.2015.00386
46
Wang J. Zuo X. Dai Z. Xia M. Zhao Z. Zhao X. et al (2013). Disrupted functional brain connectome in individuals at risk for Alzheimer’s disease.Biol. Psychiatry73472–481. 10.1016/j.biopsych.2012.03.026
47
Xu X. K. Zhang J. Small M. (2010). Rich-club connectivity dominates assortativity and transitivity of complex networks.Phys. Rev. E Stat. Nonlin Soft. Matter. Phys.82:046117. 10.1103/PhysRevE.82.046117
48
Xue C. Sun H. Hu G. Qi W. Yue Y. Rao J. et al (2020). Disrupted patterns of rich-club and diverse-club organizations in subjective cognitive decline and amnestic mild cognitive impairment.Front. Neurosci.14:575652. 10.3389/fnins.2020.575652
49
Xue C. Yuan B. Yue Y. Xu J. Wang S. Wu M. et al (2019). Distinct disruptive patterns of default mode subnetwork connectivity across the spectrum of preclinical Alzheimer’s disease.Front. Aging Neurosci.11:307. 10.3389/fnagi.2019.00307
50
Yan T. Wang W. Yang L. Chen K. Chen R. Han Y. (2018). Rich club disturbances of the human connectome from subjective cognitive decline to Alzheimer’s disease.Theranostics83237–3255. 10.7150/thno.23772
51
Yao Q. Tang F. Wang Y. Yan Y. Dong L. Wang T. et al (2022). Effect of cerebellum stimulation on cognitive recovery in patients with Alzheimer disease: A randomized clinical trial.Brain Stimul.15910–920. 10.1016/j.brs.2022.06.004
52
Zamora-Lopez G. Zhou C. Kurths J. (2010). Cortical hubs form a module for multisensory integration on top of the hierarchy of cortical networks.Front. Neuroinform.4:1. 10.3389/neuro.11.001.2010
53
Zdanovskis N. Platkajis A. Kostiks A. Karelis G. Grigorjeva O. (2021). Brain structural connectivity differences in patients with normal cognition and cognitive impairment.Brain Sci.11:943. 10.3390/brainsci11070943
54
Zhang L. Ni H. Yu Z. Wang J. Qin J. Hou F. et al (2020). Investigation on the alteration of brain functional network and its role in the identification of mild cognitive impairment.Front. Neurosci.14:558434. 10.3389/fnins.2020.558434
Summary
Keywords
progressive mild cognitive impairment, stable mild cognitive impairment, rich club, module, graph theory
Citation
Xue C, Zheng D, Ruan Y, Cao X, Zhang X, Qi W, Yuan Q, Liang X and Huang Q (2024) Reorganized brain functional network topology in stable and progressive mild cognitive impairment. Front. Aging Neurosci. 16:1467054. doi: 10.3389/fnagi.2024.1467054
Received
19 July 2024
Accepted
25 October 2024
Published
18 November 2024
Volume
16 - 2024
Edited by
Tiratha Raj Singh, Jaypee University of Information Technology, India
Reviewed by
Pritish Kumar Varadwaj, Indian Institute of Information Technology, India
Hemraj Saini, DIT University, India
Updates
Copyright
© 2024 Xue, Zheng, Ruan, Cao, Zhang, Qi, Yuan, Liang and Huang.
This is an open-access article distributed under the terms of the Creative Commons Attribution License (CC BY). The use, distribution or reproduction in other forums is permitted, provided the original author(s) and the copyright owner(s) are credited and that the original publication in this journal is cited, in accordance with accepted academic practice. No use, distribution or reproduction is permitted which does not comply with these terms.
*Correspondence: Qingling Huang, hql_nju@163.com
†These authors have contributed equally to this work and share first authorship
‡ Data used in preparation of this article were obtained from the Alzheimer’s disease Neuroimaging Initiative (ADNI) database (adni.loni.usc.edu/). As such, the investigators within the ADNI contributed to the design and implementation of ADNI and/or provided data but did not participate in analysis or writing of this report. A complete listing of ADNI investigators can be found at: http://adni.loni.usc.edu/wp-content/uploads/how_to_apply/ADNI_Acknowledgement_List.pdf
Disclaimer
All claims expressed in this article are solely those of the authors and do not necessarily represent those of their affiliated organizations, or those of the publisher, the editors and the reviewers. Any product that may be evaluated in this article or claim that may be made by its manufacturer is not guaranteed or endorsed by the publisher.