 Chan Zhao
 Xintian Xu
 Chunyan Hao
- 1First Hospital of Shanxi Medical University, Taiyuan, Shanxi, China
- 2Yuncheng First Hospital, Yuncheng, China
Background: Obesity exerts a significant detrimental impact on cognitive function. The weight-adjusted waist index (WWI) serves as a more precise indicator of visceral obesity that is independent of weight, in contrast to body mass index (BMI). Still, little research has been conducted on the interrelation between WWI and cognitive abilities. This investigation explored the link between WWI and older Americans’ cognitive function.
Methods: Utilizing data from the 2011–2014 National Health and Nutrition Examination Cross-Sectional Survey, multiple linear regression analysis was used to assess the influence of WWI on cognitive abilities in those over 60. Three cognitive assessments were administered: the Animal Fluency Test (AFT), the Digit Symbol Substitution Test (DSST), and the Word Learning and Recall Module from the Coalition to Establish a Registry for Alzheimer’s Disease (CERAD). We implemented threshold effects analysis and smoothed curve fitting to elucidate the nonlinear relationship. Additionally, we analyzed subgroups to check for variability.
Results: There were 2,762 participants, including1,504 (54.45%) females and 1,258 (45.55%) males. 53.77% of them had completed high school or above, and their average age was 69.05 ± 6.62. After controlling for confounding variables, the improved model predicted a negative connection between WWI and CERAD-Total, AFT, and DSST scores (all p < 0.05). Furthermore, we performed a smoothenable curve fitting between WWI and cognitive function scores, resulting in a nonlinear connection and a threshold saturation effect. We also executed subgroup analyses and interaction tests based on gender, race, educational background, marital status, diabetes, body mass index, alcohol consumption, hypertension, smoking habits, stroke, depression, and sleep quality to assess whether the relationship between WWI and cognitive function was affected by heterogeneity across different population segments. The subgroup analysis found no significant differences in cognitive performance associated with WWI across the various subgroups.
Conclusion: Higher WWI levels are associated with impaired cognitive function in Americans aged 60 and older.
1 Introduction
Cognitive decline is increasingly prevalent among the older adult demographic. Neurofibrillary tangles and amyloid plaques are recognized as the primary pathological hallmarks of Alzheimer’s disease (AD), a neurodegenerative disorder marked by increasing cognitive impairment, behavioral problems, and psychiatric problems (De-Paula et al., 2012). Currently, approximately 50 million individuals globally are affected by dementia, with projections indicating an increase to 80 million by 2030 (Cummings et al., 2016; Alzheimer’s Association., 2023). Some researchers predict that by 2050, the number of dementia patients will triple (Scheltens et al., 2021). Furthermore, the annual financial burden of caregiving for individuals with dementia is projected to reach $1 trillion worldwide (Breijyeh and Karaman, 2020). The disease has a growing socio-economic cost that increases in proportion to its prevalence, having an impact on families, society, and people to differing degrees and causing loss (Alzheimer’s Association., 2021). However, the condition cannot be prevented or its progression stopped; present treatments only alleviate its symptoms (Livingston et al., 2020; Yiannopoulou and Papageorgiou, 2020).
Obesity, a modifiable lifestyle determinant, has recently been associated with an elevated risk of cognitive decline and Alzheimer’s disease, particularly among middle-aged individuals with obesity. Early-stage lifestyle interventions, including weight reduction, enhanced nutritional practices, and increased physical activity, may mitigate disease risk and support the preservation of long-term cognitive function. Currently, obesity represents one of the most pressing global health challenges, with its prevalence escalating annually. The aetiology of obesity is multifactorial, involving a combination of genetic predispositions and behavioral as well as environmental influences (Heymsfield and Wadden, 2017). By 2030, projections indicate that over 50% of the global population will be overweight (Stecker and Sparks, 2006; Ward et al., 2019). We must thus address the obesity problem. Obesity and cognitive deterioration have been linked (Flores-Cordero et al., 2022). Numerous studies have demonstrated a relationship between body mass index (BMI) and cognitive deterioration (Nordestgaard et al., 2022; Costache et al., 2023). One investigation revealed a significant U-shaped association between BMI and dementia, indicating that both obesity and underweight status are linked to an increased likelihood of developing dementia (Beydoun et al., 2008). Traditionally, obesity has been assessed using body mass index (BMI). This metric focuses on the weight-to-height ratio but does not distinguish between muscle and fat composition or account for centripetal obesity, in which fat accumulates mainly in the stomach area (Hainer and Aldhoon-Hainerová, 2013; Javed et al., 2015). In contrast, the weight-adjusted waist index (WWI) incorporates waist circumference and body weight, effectively capturing changes in waist circumference attributable to variations in muscle or fat. Research has indicated that visceral fat is a more accurate indicator of the body’s metabolic status than BMI (Thomas et al., 2012). As a result, the weight-adjusted waist circumference index (WWI), a novel metric for assessing obesity, was proposed (Park et al., 2018).
WWI provides a more accurate representation of central obesity independent of body weight and better captures the extent of visceral obesity. It does this by normalizing body weight to waist circumference (WC), addressing the shortcomings of BMI, and incorporating the benefits of WC (Kim et al., 2021; Qin et al., 2022). Also, WWI has been linked to several health issues, including diabetes, high blood pressure, atherosclerosis, and coronary artery disease, according to a recent study (Li et al., 2020; Liu et al., 2021). Consequently, WWI provides a more nuanced analysis of body composition and serves as a more accurate metric for obesity, particularly about abdominal fat distribution. Nevertheless, there is a paucity of research exploring the association between WWI and cognitive function. To address this gap, we conducted cross-sectional studies utilizing data from the National Health and Nutrition Examination Survey (NHANES) spanning 2011 to 2014.
2 Methods
2.1 NHANES
This cross-sectional data was obtained through the National Health Statistics (NCHS), a division of the Centers for Disease Control and Prevention (CDC), which oversaw the design and implementation of the national survey known as NHANES (Johnson et al., 2014). The research adhered to the ethical principles established in the Helsinki Declaration of 1975. Each participant provided informed consent, and the project received approval from the NCHS Research Ethics Review Board. A variety of methodologies were employed, including laboratory analyses, in-person health assessments, surveys, and interviews, to evaluate the overall health, nutritional status, familial health history, and socioeconomic data of U.S. citizens. The participant cohort was representative, ensuring the reliability of the data across multiple health-related domains (Curtin et al., 2013). All information on the NHANES research design and data may be found at www.cdc.gov/nchs/nhanes. The observational research followed the STROBE principles for reporting cross-sectional studies (von Elm et al., 2007).
2.2 Study population
Only 2011–2014 were used to produce cognitive function ratings in the NHANES research. As a result, we conducted our studies using this period. Given that the NHANES database primarily assesses cognitive performance in individuals aged 60 and older, our research specifically targeted this demographic. Our analyses included participants whose complete assessments of cognitive function and WWI data were available. In the NHANES database from 2011 to 2014, there were 19,931 participants, including 9,859 males (49.47%) and 10,072 females (50.53%).In the end, our analysis revealed 2,762 suitable adults in subsequent analyses after removing participants under 60 years old (n = 16,299), lacking any data about cognitive function (n = 698), and WWI (n = 172) (Figure 1). These 2,762 participants showed no statistical differences in gender, race, and education level compared to the 19,931participants above.
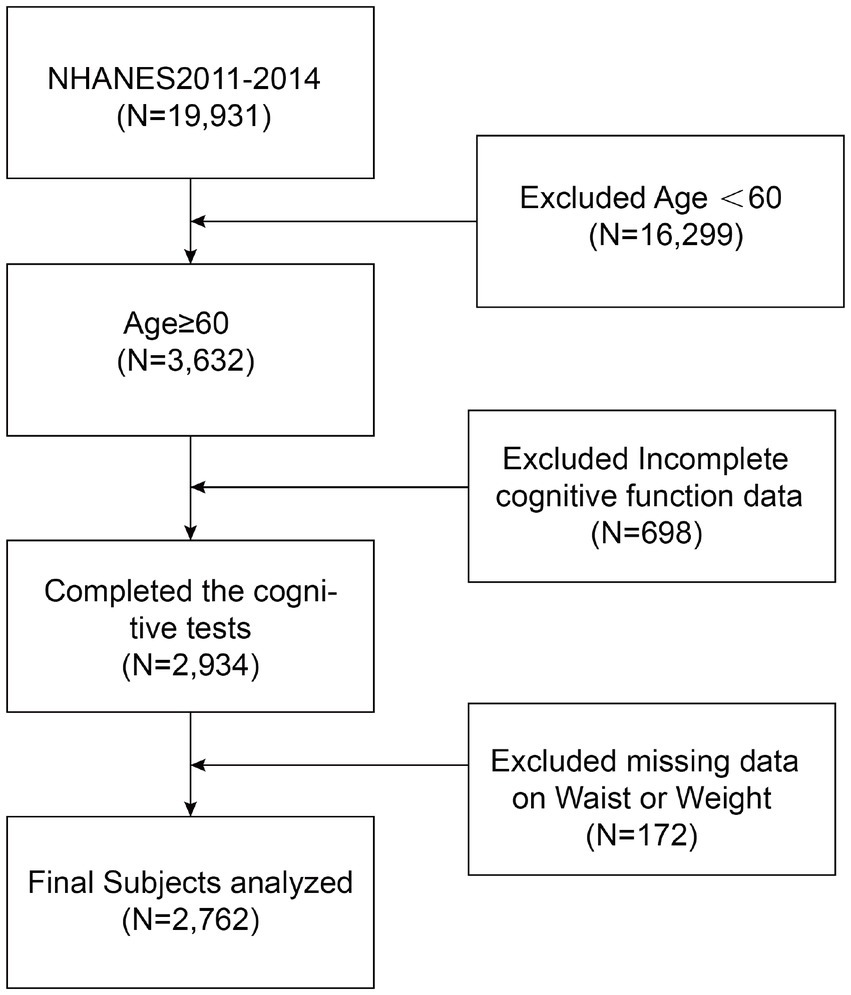
Figure 1. Flow chart of participants selection. NHANES, National Health and Nutrition Examination Survey.
2.3 Weight-adjusted-waist index (WWI)
WWI is a distinct metric that outperforms BMI in assessing central obesity (Kim et al., 2021). It calculates using two variables: waist circumference and weight. Physical body weight and waist circumference measurements were taken in a mobile examination center by technicians who had received standard training. The WWI is calculated as the waist circumference (in centimeters) divided by square root of body weight (in kilograms) (Park et al., 2018). The resulting value is rounded to five decimal places. WWI was incorporated into this study as an exposure variable meriting further exploration. Given that WWI is a continuous variable, we categorized it into quartiles for subsequent analysis. The defined ranges for the WWI quartile groups are 9.02–11.00, 11.00–11.48, 11.48–11.94, and 11.94–14.79.
2.4 Assessment of cognitive functions
In the NHANES study, cognitive function was only measured during the 2011–2012 and 2013–2014 periods. Three cognitive assessments were used in the study: the Animal Fluency Test (AFT), the Digit Symbol Substitution Test (DSST), and the Word Learning and Recall Module from the Coalition to Establish a Registry for Alzheimer’s Disease (CERAD). Regarding the CERAD assessment, each component is designed to evaluate the participant’s capacity for rapid word acquisition and subsequent recall (Morris et al., 1989). The CERAD protocol consists of three word learning tasks followed by a single delayed recall assessment. NHANES personnel were instructed to audibly present 10 words to each participant. Following the presentation, participants endeavored to memorize and reproduce as many words as possible. The 10 words were administered in three different sequences. Each trial was scored from 0 to 10 points, and the cumulative scores from the three trials were aggregated to yield the immediate word learning total (CERAD-Total score ranging from 0 to 30). Furthermore, two additional cognitive tasks (AFT and DSST) were completed before administering the Delayed Recall Test (CERAD-delayed) (Fillenbaum et al., 2008). The Delayed Recall Test score is determined by the number of words recalled (CERAD-Delayed score 0–10). The Animal Fluency Test (AFT), which examines executive functions, focuses on categorical verbal fluency (Long et al., 2015). The sole requirement of the exam is that the test taker consciously speaks out the animal’s name; no prior educational background is necessary (Prince et al., 2003). The participant has 1 min to list as many animals as possible; they will receive one point for each species they can name (Wei et al., 2022). The Wechsler Adult Intelligence Scale (WAIS-III), which assesses memory, sustained focus, and response time, includes the Digit Symbol Substitution Test (DSST). Examinees have 1 min to accurately match each of the 133 boxes next to the numbers with the corresponding symbol. The score is the number of accurate matches (Jaeger, 2018).
2.5 Covariates
Possible confounding variables that could affect the relationship between WWI and cognitive performance were considered in the research. These variables encompassed sex, age, ethnicity, marital status, educational background, body mass index (BMI, kg/m2), PIR, creatinine concentration in serum (mg/dl), total cholesterol level in serum (mg/dl), high blood pressure, diabetes, smoking, alcohol intake, stroke, depression, and sleep disorder. Individuals were classified as smokers if they had smoked 100 or more cigarettes in their lifetime, and as drinkers if they had consumed 12 or more alcoholic beverages per year. The racial categories utilized comprised non-Hispanic whites, non-Hispanic blacks, Mexican Americans, other Hispanics, and additional racial groups, including multiracial individuals. Marital status was categorized based on whether individuals lived alone or cohabited. The four categories of educational achievement were beyond high school, high school diploma, ninth to eleventh grade, and lower than ninth grade. For further details on the subjects covered, check to www.cdc.gov/nchs/nhanes/.
2.6 Statistical analyses
All statistical analyses in this study obeyed CDC recommendations, and NHANES sample weights were used appropriately (Johnson et al., 2013). Categorical data were presented as percentages, while continuous variables were reported as means accompanied by standard deviations. Weighted Student’s t-tests (for continuous data) or weighted chi-square tests (for categorical data) assessed differences between groups divided into WWI quartiles. Meanwhile, we evaluated the following three models individually. Model 1 did not account for variables. Model 2 was only calibrated considering gender, age, and race. In contrast, Model 3 considered additional factors such as marital status, education, PIR, smoking habits, alcohol consumption, BMI, serum total cholesterol levels, serum creatinine levels, hypertension, diabetes, stroke, depression, and sleep disorder. Multiple linear regression analyses were utilized to explore the associations between WWI and cognitive outcomes, specifically CERAD-Total, CERAD-Delayed, AFT, and DSST across the three models. Participants’ BMI was categorized into quartiles. The relationships between WWI and cognitive abilities were further examined within subgroups defined by sex, ethnicity, educational attainment, marital status, BMI quartile classification, presence of diabetes or hypertension, smoking, alcohol intake, stroke, depression, and sleep disorder. To assess the heterogeneity of these relationships among subgroups, we incorporated additional interaction terms. Considering the interactions and connections between subgroups, we used R version 4.1.3 to conduct False Discovery Rate (FDR) Benjamini-Hochberg correction on the p-values for interactions. As nonlinear correlations were identified, a threshold analysis of effects was conducted with a log-likelihood ratio test to determine whether a threshold existed. To assure the study’s accuracy, all variables associated with the exposure variable WWI and the outcome variable cognitive function scores: weight, waist circumference, CERAD score, DSST score, and AFT score were removed if they were absent from the original data. Missing values for the other covariates were calculated using the median for continuous variables and the mode for categorical variables based on existing instances. Further, we used the VIF (Variance Inflation Factor) calculation to clarify potential multicollinearity issues among covariates. Conventionally, a variance inflation value (VIF) of less than 5 is acceptable. We calculated that all the relevant covariates mentioned in this study have VIF values less than 5, excluding potential multicollinearity issues among covariates. All statistical evaluations were conducted utilizing R version 4.1.31 (R Foundation) and the Empower software2 (X&Y Solutions, Inc., Boston, MA).
3 Results
3.1 Baseline characteristics
The study comprised 2,762 participants, including 1,504 (54.45%)females and 1,258 (45.55%) males. Among these individuals, non-Hispanic white people make up 79.29%. 65.39% are cohabitation, and 53.77% have more education than a high school diploma. The average age of the participants was 69.05, with a standard deviation of 6.62. The individuals’ average cognitive function scores on the CERAD-Total, CERAD-Delayed, AFT, and DDST were 19.84 ± 4.43, 6.30 ± 2.26, 18.26 ± 5.67, 52.63 ± 16.52. Furthermore, we quartile WWI and the number of participants in each of its four groups is 691, 690, 690, and 691. As the quartiles of WWI increased, there was a decline in the scores of CERAD-Total, CERAD-delayed, AFT, and DDST from the four groups (p < 0.05). The four WWI quartile divisions demonstrated significant differences (all p < 0.05) in terms of age, sex, race, educational attainment, marital status, PIR, BMI, diabetes, alcohol consumption, hypertension, smoking, sleep disorder, stroke, cholesterol, CERAD-Total scores, CERAD-Delayed scores, AFT scores, and DDST scores (Table 1).
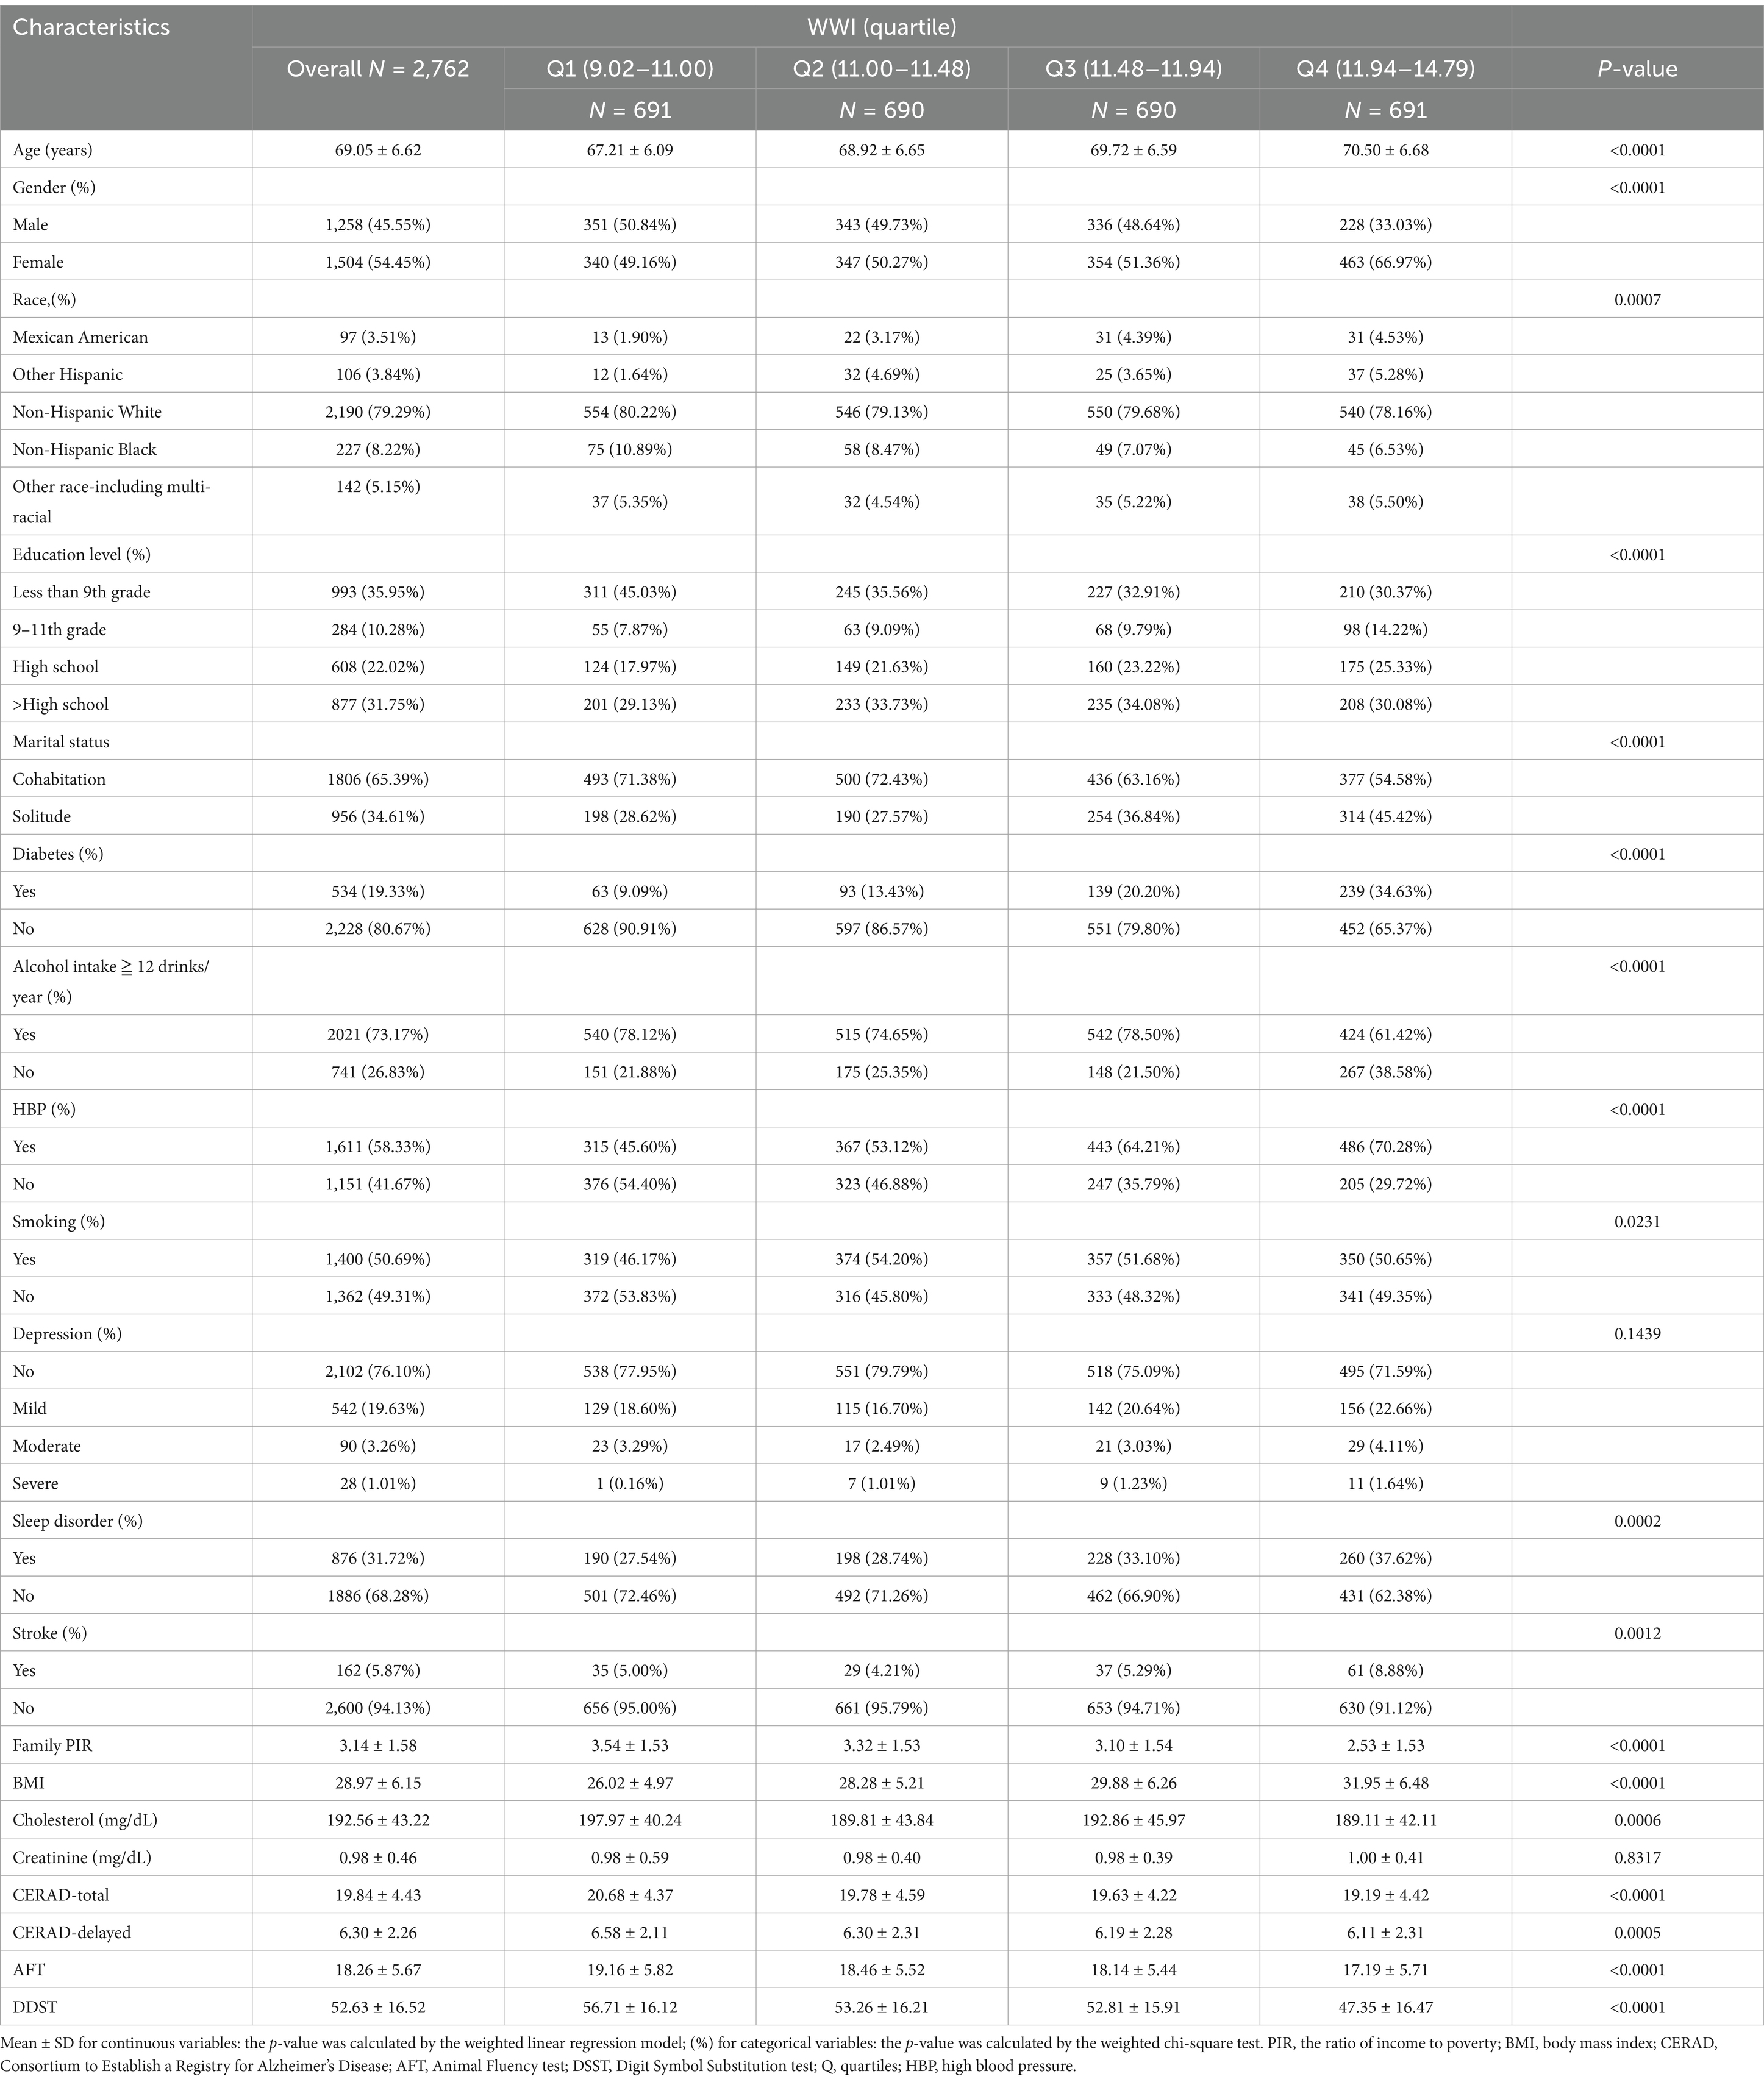
Table 1. Basic characteristics of participants by weight-adjusted-waist index quartiles among U.S. older adults.
3.2 Correlation between WWI and cognition test results
Table 2 compellingly illustrates the relationship between WWI and cognitive performance. The fully modified model revealed that the three cognitive function scores (CERAD-Total, AFT, and DDST) dropped by 0.48, 0.50, and 1.71 units for each unit of increase in the WWI score. After that, the WWI data was divided into quartiles to conduct additional sensitivity testing. Furthermore, in Model 1 (the original model) and Model 2 (the model with moderate adjustments), the β-values for the CERAD-Total scores of participants in the highest quartile (Q4) compared to those in the lowest quartile (Q1) were-1.49 and-0.98, respectively. The 95% confidence intervals were-1.95 to-1.02 and-1.42 to-0.54, and their p-values for the trend were less than 0.0001. This implies that the linked CERAD-Total scores fell as the WWI quartile groupings rose in Models 1 and 2, with a significant trend. In Model 1, compared to the lowest WWI quartile (Q1), the β-values for the CERAD-Delayed scores of individuals in the highest WWI quartile (Q4) was –0.47. The 95% confidence interval was –0.71 to –0.23, and the p-values for the trend were less than 0.0001. This suggests that CERAD-Delayed scores had a declining and statistically significant negative trend as the WWI quartile groups kept rising in Model 1. In both Model 1 and Model 2, people in the highest quartile of WWI (Q4) demonstrated lower AFT scores than those in the lowest quartile of WWI (Q1). Their β-values were –1.97 and –1.03, respectively, with 95% CIs of –2.56 to –1.38, −1.59 to –0.46, and the p-values for the trend were less than 0.0001 and 0.0004. This suggests that their associated AFT scores in Models 1 and 2 fall steadily and significantly as the WWI quartile groups grow. Regarding DDST scores, Model 1 and Model 2 showed significant trend testing. The β-values for DSST scores of participants in the highest WWI quartile (Q4) were –9.63 and –6.51, respectively, with 95% confidence intervals of –11.07 to –7.66 and –7.98 to –5.04. Their p-value for the trend was less than 0.0001. Overall, the four cognitive function scores reflect a consistent decrease as WWI increases, suggesting that lower cognitive function scores may be associated with higher WWI.
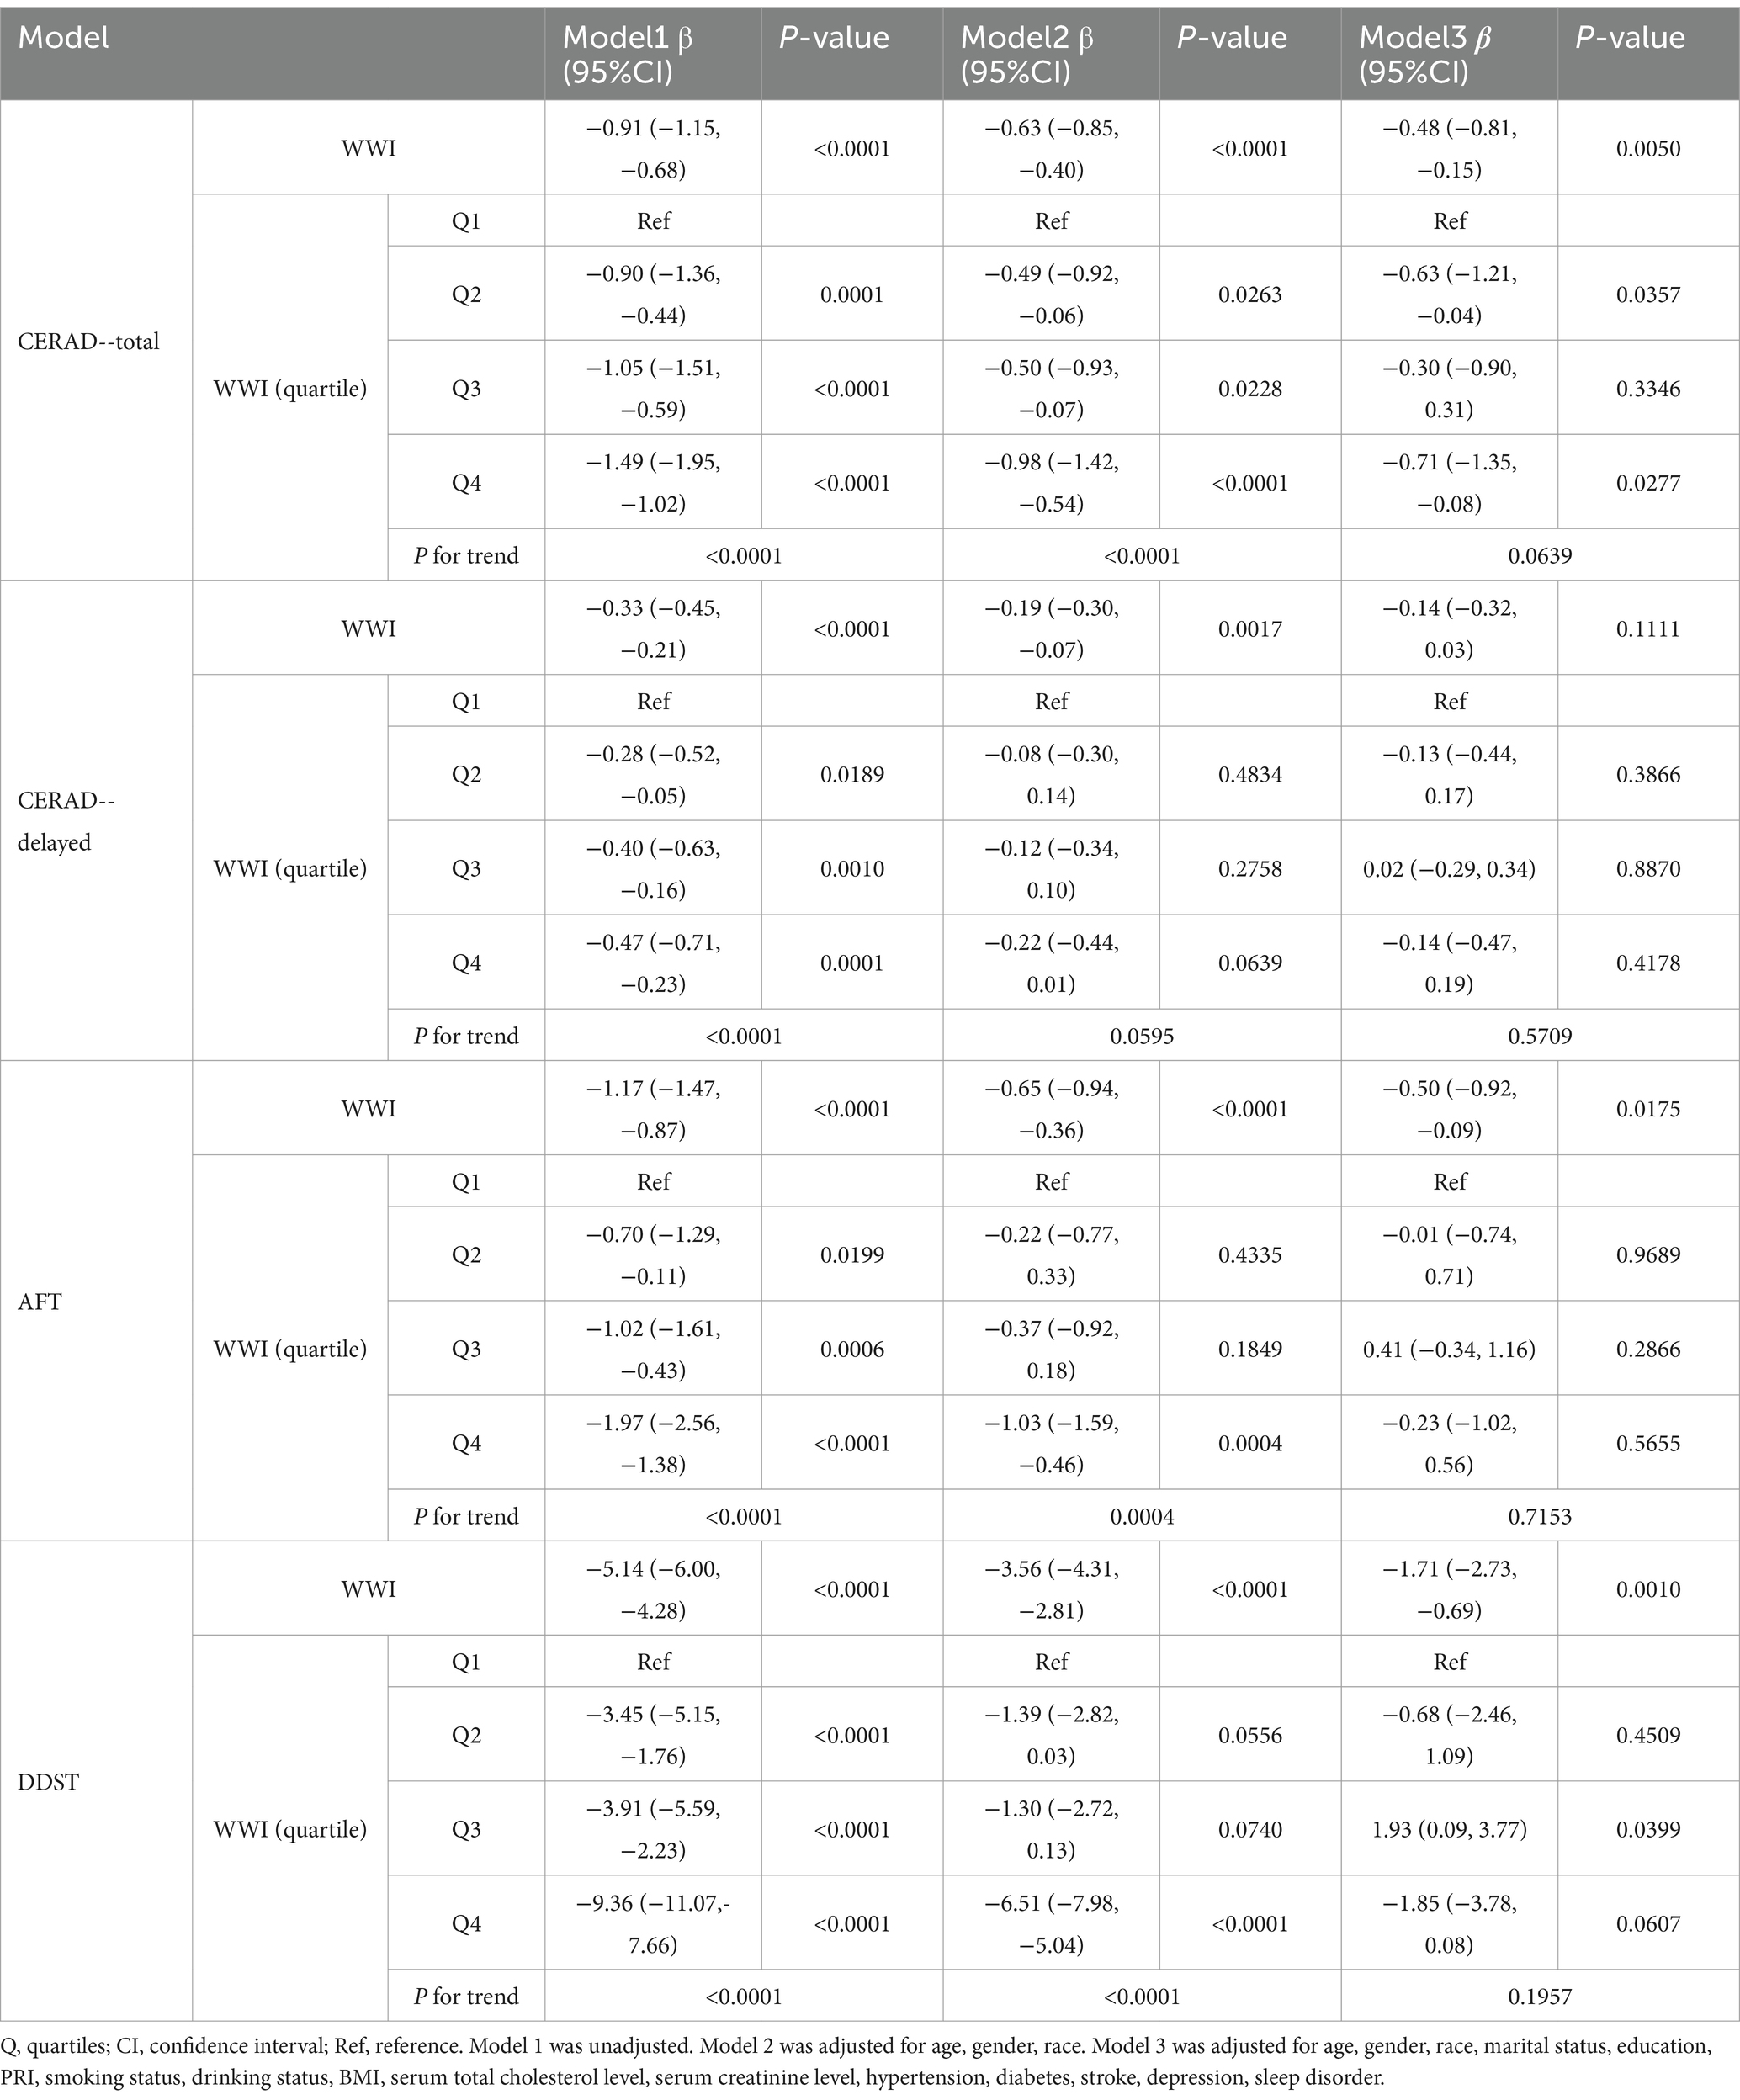
Table 2. Association between WWI and cognitive function scores.
3.3 Relationship between WWI and cognitive function scores
Smoothed curve fitting was used to represent the association between WWI and cognitive function scores graphically. Figure 2 demonstrates that the four cognition scores, CERAD-Total scores, CERAD-Delayed scores, AFT scores, and DDST scores have a nonlinear correlation to WWI. Additional threshold effect analysis revealed breakpoints in the association between the two cognitive function scores (AFT and DDST) and WWI. The predicted breakpoint (K) in the nonlinear correlation between AFT scores and WWI is 12.67. There was no significant statistical association between WWI and AFT scores on the left side of the breakpoint, with the β value of –0.44, the 95% confidence interval of –0.89 to 0.02, and the p-value of 0.0587. A negative connection was observed between WWI and AFT scores on the right side of the breakpoint (β = −3.27, 95% CI –6.08 to –0.47; p-value = 0.0224), with a log-likelihood ratio test of 0.021. The nonlinear correlation between WWI and DDST scores demonstrates a breakpoint (K) of 11.81. A negative connection was observed between WWI and DSST scores on both sides of the breakpoint (The left side: β = −5.79, 95% CI –8.07 to –3.51, p-value < 0.0001; The right side: β = −6.36, 95% CI –9.50 to −3.22, p-value<0.0001), with a log-likelihood ratio test less than 0.001 (Table 3). The smoothed curve fitting of the WWI to the four categories of cognitive function scores revealed that the DSST was the most stable regarding WWI, with a consistent decreasing trend of acquisition at both the right and left ends of the inflexion point of 11.81. The DDST may represent the most sensitive indicator of cognitive performance within the NHANES dataset.
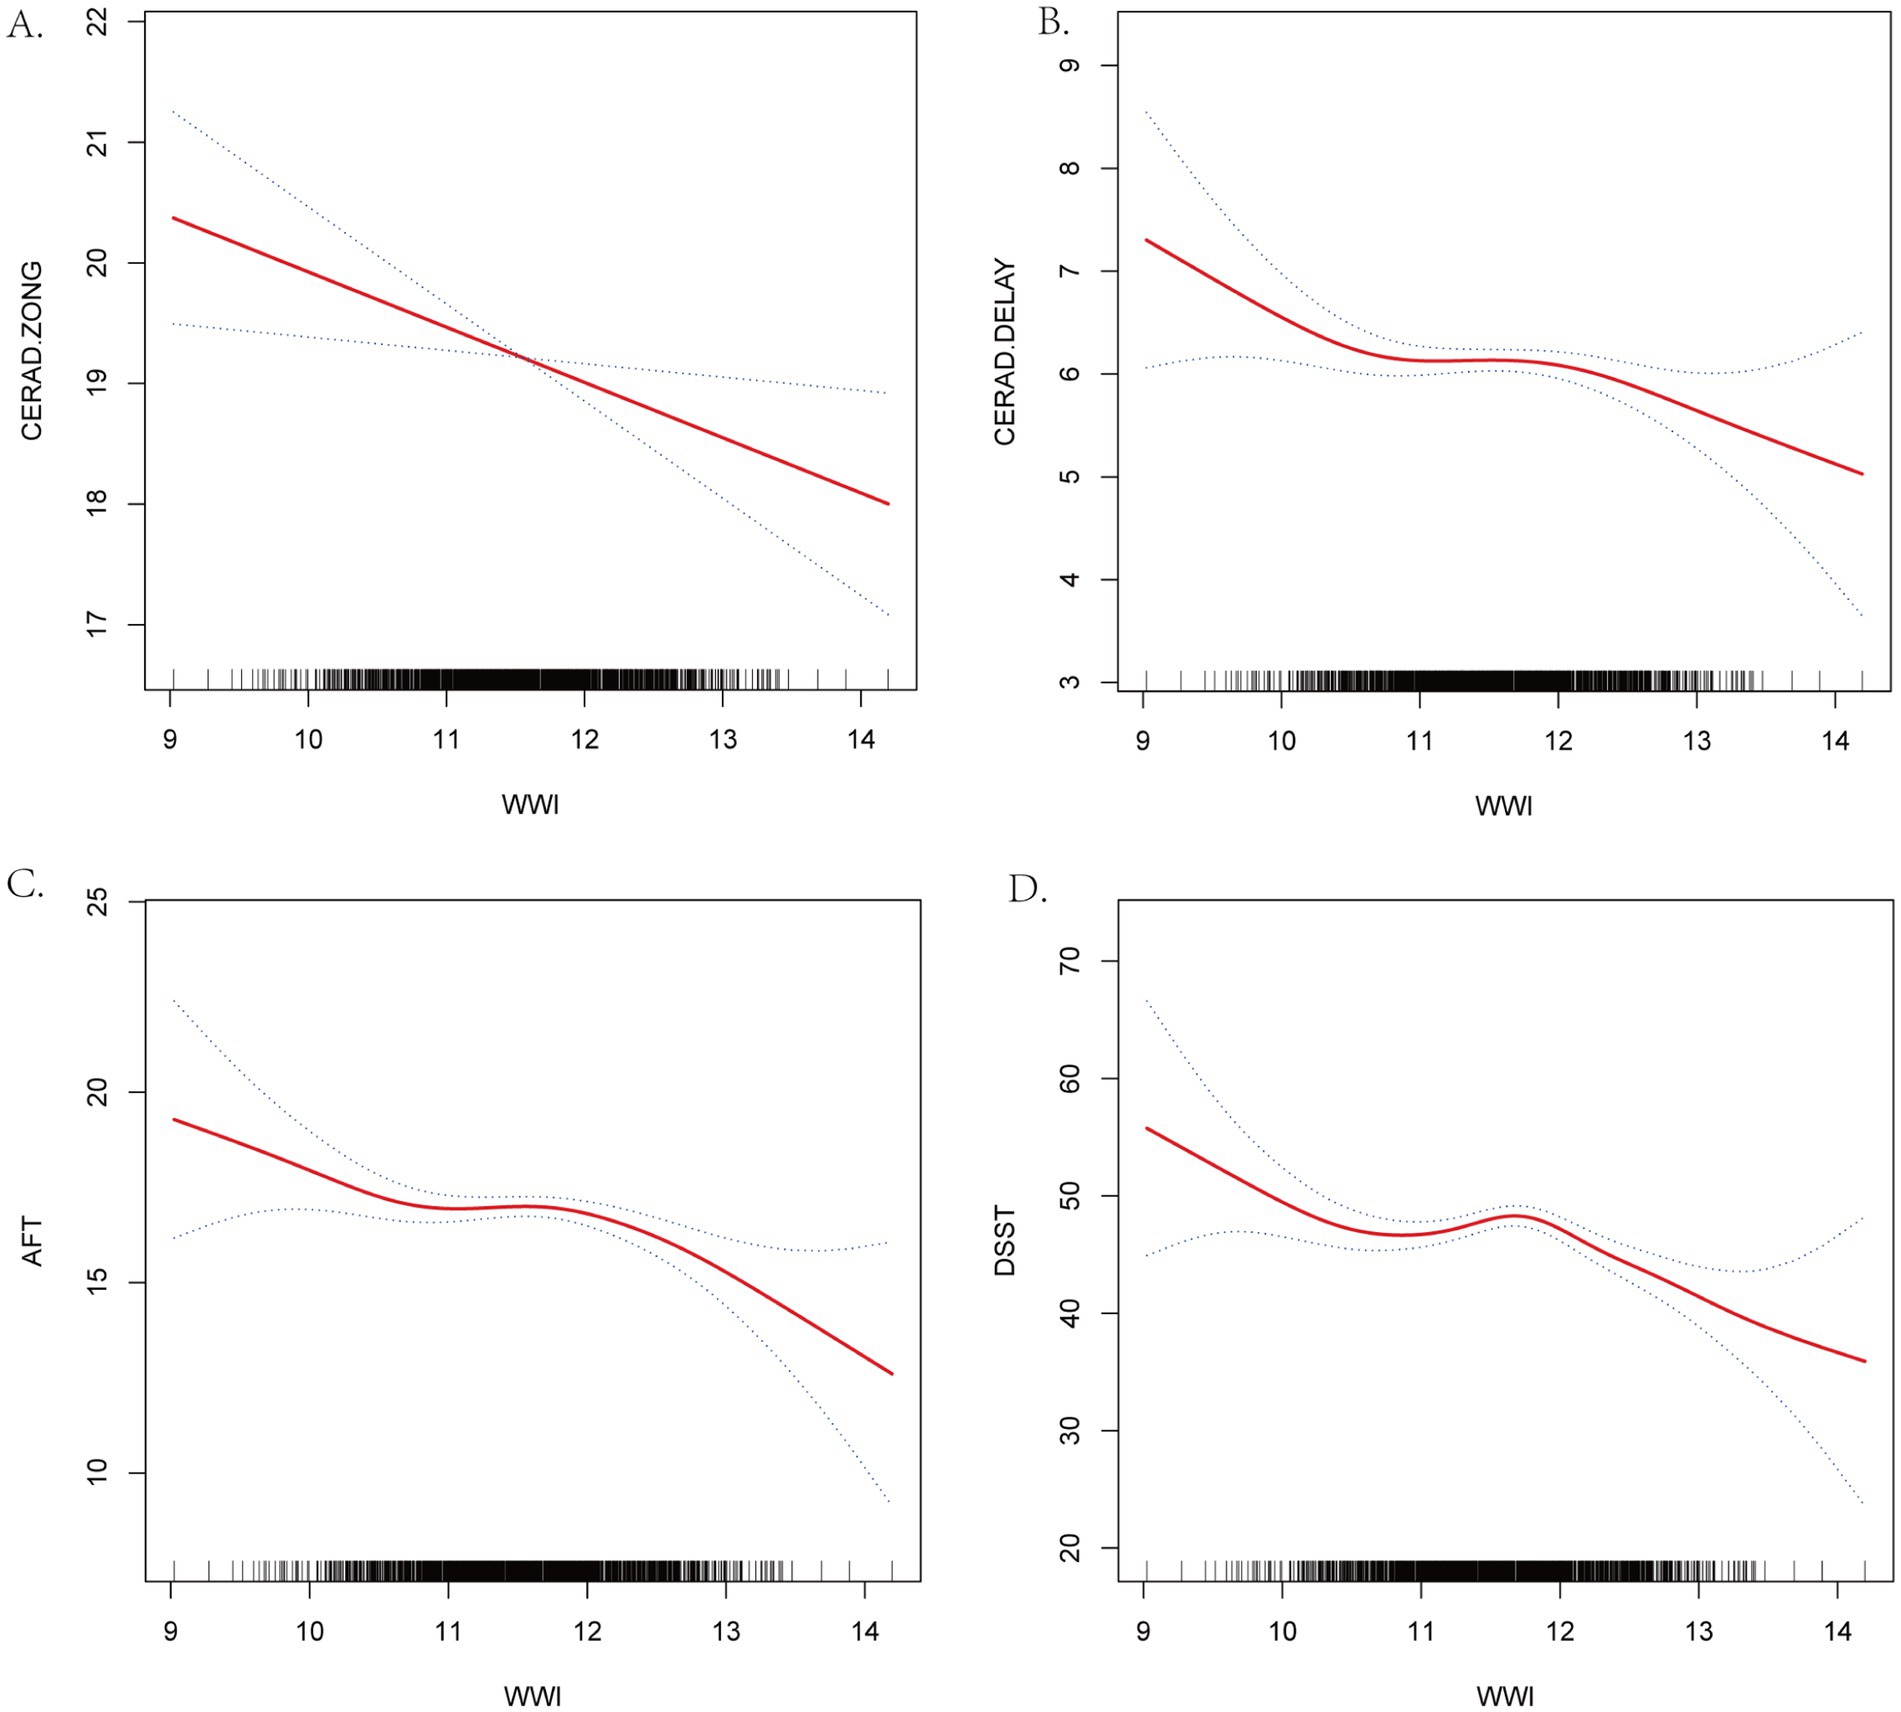
Figure 2. Smooth Curve Fitting Detected the nonlinear relationship between WWI and cognitive function scores. (A) CERAD-Total scores. (B) CERAD-Delayed scores. (C) AFT. (D) DSST. Adjusted for age, gender, race, marital status, education, PRI, smoking status. Drinking status, BMI, serum total cholesterol level, serum creatinine level, hyper-tension, diabetes, stroke, depression and sleep disorder.
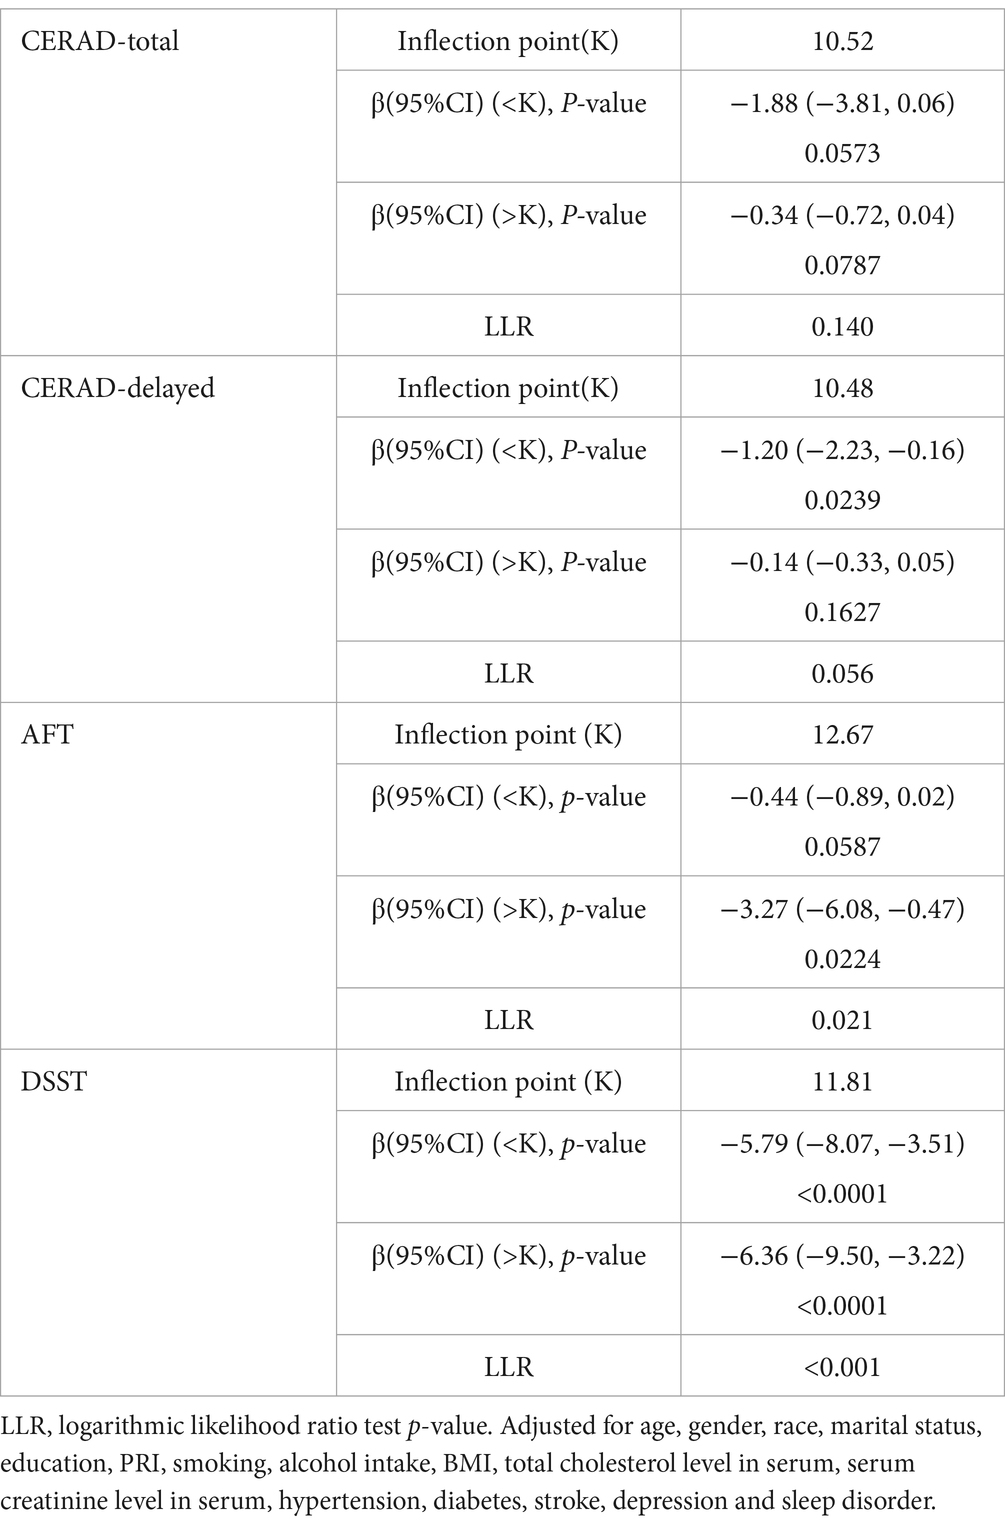
Table 3. Threshold effect analysis for correlations between the WWI and cognitive function scores.
3.4 Subgroup analyses
To identify potentially heterogeneous populations and determine whether the associations between WWI and the four cognitive function scores—CERAD-Total, CERAD-Delayed, AFT, and DDST—were consistent across the population, we conducted analyses stratified by the following subgroups: gender, race, educational background, marital status, diabetes, BMI, alcohol intake, hypertension, smoking habits, stroke, depression, and sleep disorder. In the subgroup analysis, the FDR-adjusted p-values for interaction show that there was no interaction between WWI and cognitive function across subgroups (Table 4). This suggests that the negative relationship between WWI and cognitive function remains unaffected by the interactions of these subgroups. The negative association is both independent and robust.

Table 4. Subgroup analysis of the association between WWI and cognitive function scores.
4 Discussion
This research aimed to explore the relationship between the cognitive abilities of US citizens and their assessments of WWI. In this cross-sectional investigation, which included 2,762 participants, we observed an extent link between WWI and these four cognitive function scores. This suggests a pertinence between lower cognitive function scores and increased WWI. However, a non-linear accordance emerged between WWI and the four cognitive function scores. In summary, the WWI index may serve as a valuable metric for assessing cognitive capacity.
Previous research has indicated a potential association between obesity and cognitive functioning (Sturman et al., 2008; Smith et al., 2014; Gunathilake et al., 2016). Notably, our analysis of substantial population-based samples revealed that childhood obesity adversely affects cognitive abilities in adulthood (Zhou et al., 2020). The Eastern Finland Cardiovascular Risk Factors, Aging, and Dementia (CAIDE) project examined the relationship between body mass index (BMI) in midlife and late life and the subsequent onset of dementia. This extensive longitudinal study tracked 1,304 participants over a span of 26 years. Findings suggest that an elevated BMI during midlife significantly increases the risk of developing dementia (Tolppanen et al., 2014; Zhang et al., 2021; den Brok et al., 2022). A cohort study involving elderly African Americans in the Chicago area established a link between cognitive decline and elevated BMI, indicating that greater fluctuations in BMI correlate with accelerated cognitive impairment. Consequently, it is imperative to focus on the impact of stable BMI on cognitive function (Aiken-Morgan et al., 2020). In addition to prior investigations into the causal relationship between BMI and cognitive abilities, a U.S. cohort study also assessed waist circumference. The results demonstrated a significant association between increased waist circumference and a more rapid cognitive decline, whereas no substantial link was found between BMI and cognitive deterioration (West et al., 2017). Evidence suggests that individuals with moderate obesity may have a more favorable prognosis than those with a normal BMI concerning heart failure, acute coronary syndromes, and coronary artery disease (Elagizi et al., 2018; Park et al., 2018; Ding et al., 2022). Numerous studies have reported inconsistent relationships between cognitive function and BMI. One investigation identified a negative correlation between BMI and cognitive capacity, indicating that higher BMI is associated with poorer cognitive performance (Benito-León et al., 2013). Conversely, another study revealed a significant U-shaped relationship between BMI and dementia, with both obesity and underweight status linked to an elevated risk of dementia (Beydoun et al., 2008). This phenomenon is often referred to as the “obesity paradox” concerning BMI. Thus, investigations linking WWI to cognition were warranted, given these inconsistent BMI-cognition findings. The WWI, which essentially indicates the presence of visceral fat, was found to have a negative connection with cognitive abilities in older adults in another cohort investigation (Rodríguez-Fernández et al., 2017; Kim et al., 2022). In this investigation, we utilized BMI as a covariate to account for the possible confounding factor of weight and height on the link between visceral obesity and cognitive performance.
It is essential to explore the various pathways that connect visceral obesity to cognitive decline. Insulin resistance and metabolic syndrome can be caused by various factors, including obesity (Sędzikowska and Szablewski, 2021). Insulin drives changes in hippocampus synaptic plasticity, affecting catecholamine neurotransmitter synthesis and absorption, maintaining neuronal cell proliferation, and balancing the body’s glucose levels (Schrijvers et al., 2010; Gratuze et al., 2018). Insulin may easily permeate the blood–brain barrier. However, the body’s insulin resistance causes insulin signaling pathway disruptions, speeding up neurons’ degeneration and lowering cognitive performance (van der Heide et al., 2006; Nelson et al., 2008; Arnold et al., 2018). Fat tissue emits inflammatory substances like IL-1β, IL-6, MCP1, and C-reactive protein (Dermitzaki et al., 2014). These inflammatory mediators can cause a low-grade, chronic inflammatory state, impairing cognitive function and promoting dementia. Additionally, obesity often leads to leptin resistance, disrupting signalling and regulatory mechanisms and negatively affecting cognitive function (Poulos et al., 2010; Forny-Germano et al., 2018; Flores-Cordero et al., 2022; Nozari et al., 2023).
This research elucidates the relationship between WWI and the risk of cognitive decline in the elderly, offering fresh insights into the early detection and prevention of cognitive deterioration. The nonlinear relationship between WWI and cognitive function found in the study, especially the increased risk of cognitive decline at high WWI values, provides new possibilities for exploring the threshold point for the effect of obesity on cognitive function. These findings are instructive for public health policymakers, emphasizing the importance of reducing obesity and improving cognitive health to help develop effective public health strategies. The study’s particular focus on the elderly population suggests that future research could target this population to create specific nutritional and lifestyle interventions to slow cognitive decline. WWI is a novel metric for measuring obesity that allows for more exact measurements of muscle and fat mass. This conclusion recommends that future research investigate the implications of various body composition measures on cognitive performance and ways to prevent or halt cognitive decline by increasing these metrics. When combined with WWI’s superiority, DEXA (Dual Energy X-ray Absorptiometry) is a beneficial tool for assessing older persons’ body composition and cognitive function. DEXA makes it possible to measure and distribute body fat and lean tissue and accurately evaluate bone mineral density and other aspects of body composition. DEXA measures offer a more accurate evaluation of lean tissue (such as muscle mass) and fat distribution than other techniques since muscle mass is often lower in older persons. This is especially crucial when examining the connection between body composition and cognitive performance. The association between body fat and muscle mass, as well as their distribution and cognitive function in older persons, may be examined using data from DEXA.
The current research offers several benefits. First, WWI is relatively new and innovative compared to earlier studies and more accurately responds to visceral obesity. It is supported by better research and offers new insights into the correlation between fat and the assessment of cognition. Secondly, 2,417 nationally representative persons selected by normative sampling participated in our study. The large enough sample size enables additional subgroup analyses to explore the association between WWI and cognition in various demographic and subgroup contexts. This improves the statistical validity and stability of the study. However, this study has limitations. Initially, this analysis was conducted based on the NHANES public records. Due to its cross-sectional design, it is limited in examining the causal connection and can only evaluate the degree of the relationship between WWI and cognitive function. A large sample size and a prospective investigation will be needed to confirm this causal association. Secondly, some confounding variables such as diet quality and physical activity could still impact the study’s findings, even though we adjusted for most covariates that might affect the results. Additionally, the NHANES database originates from the United States, and all research participants are American citizens; therefore, additional validation of our findings is required for other nations.
5 Conclusion
Our investigation came to the following conclusion: the cognitive function scores decreased with increasing WWI. Meanwhile, their interaction was nonlinear. In addition, WWI may be used as a reference index for evaluating cognitive function in people over 60.
Data availability statement
The datasets presented in this study can be found in online repositories. The names of the repository/repositories and accession number(s) can be found at: https://wwwn.cdc.gov/nchs/nhanes.
Ethics statement
The studies involving humans were approved by Institutional Review Board of National Center for Health Statistics. The studies were conducted in accordance with the local legislation and institutional requirements. The participants provided their written informed consent to participate in this study. Written informed consent was obtained from the individual(s) for the publication of any potentially identifiable images or data included in this article.
Author contributions
CZ: Conceptualization, Data curation, Formal analysis, Funding acquisition, Investigation, Methodology, Project administration, Software, Supervision, Validation, Visualization, Writing – original draft, Resources, Writing – review & editing. XX: Conceptualization, Data curation, Investigation, Methodology, Project administration, Writing – original draft. CH: Conceptualization, Methodology, Project administration, Resources, Validation, Writing – review & editing, Funding acquisition.
Funding
The author(s) declare that financial support was received for the research, authorship, and/or publication of this article. This study received support from the Shanxi Province large health industry high quality development research project (DJKZXKT2023044) and Lvliang City to introduce high-level scientific and technological talents key research and development projects (2024RC19).
Conflict of interest
The authors declare that the research was conducted in the absence of any commercial or financial relationships that could be construed as a potential conflict of interest.
Publisher’s note
All claims expressed in this article are solely those of the authors and do not necessarily represent those of their affiliated organizations, or those of the publisher, the editors and the reviewers. Any product that may be evaluated in this article, or claim that may be made by its manufacturer, is not guaranteed or endorsed by the publisher.
Footnotes
References
Aiken-Morgan, A. T., Capuano, A. W., Arvanitakis, Z., and Barnes, L. L. (2020). Changes in body mass index are related to faster cognitive decline among African American older adults. J. Am. Geriatr. Soc. 68, 2662–2667. doi: 10.1111/jgs.16814
Alzheimer's Association (2021). Alzheimer's disease facts and figures. Alzheimer Dementia 17, 327–406. doi: 10.1002/alz.12328
Alzheimer's Association (2023). Alzheimer's disease facts and figures. Alzheimer Dementia 19, 1598–1695. doi: 10.1002/alz.13016
Arnold, S. E., Arvanitakis, Z., Macauley-Rambach, S. L., Koenig, A. M., Wang, H. Y., Ahima, R. S., et al. (2018). Brain insulin resistance in type 2 diabetes and Alzheimer disease: concepts and conundrums. Nat. Rev. Neurol. 14, 168–181. doi: 10.1038/nrneurol.2017.185
Benito-León, J., Mitchell, A. J., Hernández-Gallego, J., and Bermejo-Pareja, F. (2013). Obesity and impaired cognitive functioning in the elderly: a population-based cross-sectional study (NEDICES). Eur. J. Neurol. 20, 899–906. doi: 10.1111/ene.12083
Beydoun, M. A., Beydoun, H. A., and Wang, Y. (2008). Obesity and central obesity as risk factors for incident dementia and its subtypes: a systematic review and meta-analysis. Obesity 9, 204–218. doi: 10.1111/j.1467-789X.2008.00473.x
Breijyeh, Z., and Karaman, R. (2020). Comprehensive review on Alzheimer's disease: Causes and treatment. Molecules 25:24. doi: 10.3390/molecules25245789
Costache, A. D., Ignat, B. E., Grosu, C., Mastaleru, A., Abdulan, I., Oancea, A., et al. (2023). Inflammatory pathways in overweight and obese persons as a potential mechanism for cognitive impairment and earlier onset Alzeihmer's dementia in the general population: a narrative review. Biomedicines 11:12. doi: 10.3390/biomedicines11123233
Cummings, J., Aisen, P. S., DuBois, B., Frölich, L., Jack, C. R. Jr., Jones, R. W., et al. (2016). Drug development in Alzheimer's disease: the path to 2025. Alzheimers Res. Ther. 8:39. doi: 10.1186/s13195-016-0207-9
Curtin, L. R., Mohadjer, L. K., Dohrmann, S. M., Kruszon-Moran, D., Mirel, L. B., Carroll, M. D., et al. (2013). National Health and nutrition examination survey: sample design, 2007-2010. Vital and health statistics series 2. Data Eval. Methods Res. 160, 1–23.
den Brok, M., Eggink, E., Hoevenaar-Blom, M. P., van, W., Moll, E., Richard, E., et al. (2022). Low values for blood pressure, BMI, and non-HDL cholesterol and the risk of late-life dementia. Neurology 99, e1630–e1639. doi: 10.1212/wnl.0000000000200954
De-Paula, V. J., Radanovic, M., Diniz, B. S., and Forlenza, O. V. (2012). Alzheimer's disease. Subcell. Biochem. 65, 329–352. doi: 10.1007/978-94-007-5416-4_14
Dermitzaki, E., Liapakis, G., Androulidaki, A., Venihaki, M., Melissas, J., Tsatsanis, C., et al. (2014). Corticotrophin-releasing factor (CRF) and the urocortins are potent regulators of the inflammatory phenotype of human and mouse white adipocytes and the differentiation of mouse 3T3L1 pre-adipocytes. PLoS One 9:e97060. doi: 10.1371/journal.pone.0097060
Ding, C., Shi, Y., Li, J., Li, M., Hu, L., Rao, J., et al. (2022). Association of weight-adjusted-waist index with all-cause and cardiovascular mortality in China: A prospective cohort study. Nutr. Metab. Cardiovasc. Diseases 32, 1210–1217. doi: 10.1016/j.numecd.2022.01.033
Elagizi, A., Kachur, S., Lavie, C. J., Carbone, S., Pandey, A., Ortega, F. B., et al. (2018). An overview and update on obesity and the obesity paradox in cardiovascular diseases. Prog. Cardiovasc. Dis. 61, 142–150. doi: 10.1016/j.pcad.2018.07.003
Fillenbaum, G. G., van Belle, G., Morris, J. C., Mohs, R. C., Mirra, S. S., Davis, P. C., et al. (2008). Consortium to establish a registry for Alzheimer's disease (CERAD): the first twenty years. Alzheimers Dement. 4, 96–109. doi: 10.1016/j.jalz.2007.08.005
Flores-Cordero, J. A., Pérez-Pérez, A., Jiménez-Cortegana, C., Alba, G., Flores-Barragán, A., and Sánchez-Margalet, V. (2022). Obesity as a risk factor for dementia and Alzheimer's disease: the role of leptin. Int. J. Mol. Sci. 23:39. doi: 10.3390/ijms23095202
Forny-Germano, L., De Felice, F. G., and Vieira, M. (2018). The role of leptin and adiponectin in obesity-associated cognitive decline and Alzheimer's disease. Front. Neurosci. 12:1027. doi: 10.3389/fnins.2018.01027
Gratuze, M., Joly-Amado, A., Vieau, D., Buée, L., and Blum, D. (2018). Mutual relationship between tau and central insulin Signalling: consequences for AD and Tauopathies? Neuroendocrinology 107, 181–195. doi: 10.1159/000487641
Gunathilake, R., Oldmeadow, C., McEvoy, M., Inder, K. J., Schofield, P. W., Nair, B. R., et al. (2016). The association between obesity and cognitive function in older persons: how much is mediated by inflammation, fasting plasma glucose, and hypertriglyceridemia? J. Gerontol. A Biol. Sci. Med. Sci. 71, 1603–1608. doi: 10.1093/gerona/glw070
Hainer, V., and Aldhoon-Hainerová, I. (2013). Obesity paradox does exist. Diabetes Care 36, S276–S281. doi: 10.2337/dcS13-2023
Heymsfield, S. B., and Wadden, T. A. (2017). Mechanisms, pathophysiology, and Management of Obesity. N. Engl. J. Med. 376, 254–266. doi: 10.1056/NEJMra1514009
Jaeger, J. (2018). Digit symbol substitution test: the case for sensitivity over specificity in neuropsychological testing. J. Clin. 38:513–519. doi: 10.1097/jcp.0000000000000941
Javed, A., Jumean, M., Murad, M. H., Okorodudu, D., Kumar, S., Somers, V. K., et al. (2015). Diagnostic performance of body mass index to identify obesity as defined by body adiposity in children and adolescents: a systematic review and meta-analysis. Pediatr. Obes. 10, 234–244. doi: 10.1111/ijpo.242
Johnson, C. L., Dohrmann, S. M., Burt, V. L., and Mohadjer, L. K. (2014). National health and nutrition examination survey: sample design, 2011-2014. Vital and health statistics series 2. Data Eval. Methods Res. 162, 1–33.
Johnson, C. L., Paulose-Ram, R., Ogden, C. L., Carroll, M. D., Kruszon-Moran, D., Dohrmann, S. M., et al. (2013). National health and nutrition examination survey: analytic guidelines, 1999-2010. Vital and health statistics series 2. Data Eval. Methods Res. 161, 1–24.
Kim, J. Y., Choi, J., Vella, C. A., Criqui, M. H., Allison, M. A., and Kim, N. H. (2022). Associations between weight-adjusted waist index and abdominal fat and muscle mass: multi-ethnic study of atherosclerosis. Diabetes Metab. J. 46, 747–755. doi: 10.4093/dmj.2021.0294
Kim, N. H., Park, Y., Kim, N. H., and Kim, S. G. (2021). Weight-adjusted waist index reflects fat and muscle mass in the opposite direction in older adults. Age 50, 780–786. doi: 10.1093/ageing/afaa208
Li, Q., Qie, R., Qin, P., Zhang, D., Guo, C., Zhou, Q., et al. (2020). Association of weight-adjusted-waist index with incident hypertension: The rural Chinese Cohor t study. Nutr. Metab. Cardiovasc. Diseases 30, 1732–1741. doi: 10.1016/j.numecd.2020.05.033
Liu, Y., Liu, X., Zhang, S., Zhu, Q., Fu, X., Chen, H., et al. (2021). Association of Anthropometric Indices with the development of diabetes among hypertensive patients in China: a cohort study. Front. Endocrinol. 12:736077. doi: 10.3389/fendo.2021.736077
Livingston, G., Huntley, J., Sommerlad, A., Ames, D., Ballard, C., Banerjee, S., et al. (2020). Dementia prevention, intervention, and care: 2020 report of the lancet commission. Lancet 396, 413–446. doi: 10.1016/s0140-6736(20)30367-6
Long, L. S., Wolpaw, J. T., and Leung, J. M. (2015). Sensitivity and specificity of the animal fluency test for predicting postoperative delirium. Can. J. Anaesth. 603:62. doi: 10.1007/s12630-014-0306-7
Morris, J. C., Heyman, A., Mohs, R. C., Hughes, J. P., van Belle, G., Fillenbaum, G., et al. (1989). The consortium to establish a registry for Alzheimer's disease (CERAD). Part I. Clinical and neuropsychological assessment of Alzheimer's disease. Neurology 39, 1159–1165. doi: 10.1212/wnl.39.9.1159
Nelson, T. J., Sun, M. K., Hongpaisan, J., and Alkon, D. L. (2008). Insulin, PKC signaling pathways and synaptic remodeling during memory storage and neuronal repair. Eur. J. Pharmacol. 585, 76–87. doi: 10.1016/j.ejphar.2008.01.051
Nordestgaard, L. T., Christoffersen, M., and Frikke-Schmidt, R. (2022). Shared risk factors between dementia and atherosclerotic cardiovascular disease. Int. J. Molec. 23:17. doi: 10.3390/ijms23179777
Nozari, Y., Park, C., Brietzke, E., Iacobucci, M., Gill, H., and McIntyre, R. S. (2023). Correlation between improved leptin signaling and cognitive function post bariatric surgery. J. Affect. Disord. 326, 225–231. doi: 10.1016/j.jad.2023.01.100
Park, Y., Kim, N. H., Kwon, T. Y., and Kim, S. G. (2018). A novel adiposity index as an integrated predictor of cardiometabolic disease morbidity and mortality. Sci. Rep. 8:16753. doi: 10.1038/s41598-018-35073-4
Poulos, S. P., Hausman, D. B., and Hausman, G. J. (2010). The development and endocrine functions of adipose tissue. Mol. Cell. Endocrinol. 323, 20–34. doi: 10.1016/j.mce.2009.12.011
Prince, M., Acosta, D., Chiu, H., Scazufca, M., and Varghese, M. (2003). Dementia diagnosis in developing countries: A cross-cultural validation study. Lancet 361, 909–917. doi: 10.1016/s0140-6736(03)12772-9
Qin, Z., Chang, K., Yang, Q., Yu, Q., Liao, R., and Su, B. (2022). The association between weight-adjusted-waist index and increased urinary albumin excretion in adults: a population-based study. Front. Nutr. 9:941926. doi: 10.3389/fnut.2022.941926
Rodríguez-Fernández, J. M., Danies, E., Martínez-Ortega, J., and Chen, W. C. (2017). Cognitive decline, body mass index, and waist circumference in community-dwelling elderly participants. J. Geriatr. Psychiatry Neurol. 30, 67–76. doi: 10.1177/0891988716686832
Scheltens, P., De Strooper, B., Kivipelto, M., Holstege, H., Chételat, G., Teunissen, C. E., et al. (2021). Alzheimer's disease. Lancet 397, 1577–1590. doi: 10.1016/s0140-6736(20)32205-4
Schrijvers, E. M., Witteman, J. C., Sijbrands, E. J., Hofman, A., Koudstaal, P. J., and Breteler, M. M. (2010). Insulin metabolism and the risk of Alzheimer disease: the Rotterdam study. Neurology 75, 1982–1987. doi: 10.1212/WNL.0b013e3181ffe4f6
Sędzikowska, A., and Szablewski, L. (2021). Insulin and insulin resistance in Alzheimer's disease. Int. J. Molecular 22:18. doi: 10.3390/ijms22189987
Smith, E., Bailey, P. E., Crawford, J., Samaras, K., Baune, B. T., Campbell, L., et al. (2014). Adiposity estimated using dual energy X-ray absorptiometry and body mass index and its association with cognition in elderly adults. J. Am. Geriatr. Soc. 62, 2311–2318. doi: 10.1111/jgs.13157
Stecker, T., and Sparks, S. (2006). Prevalence of obese patients in a primary care setting. Obesity 14, 373–376. doi: 10.1038/oby.2006.49
Sturman, M. T., de Leon, C. F., Bienias, J. L., Morris, M. C., Wilson, R. S., and Evans, D. A. (2008). Body mass index and cognitive decline in a biracial community population. Neurology 70, 360–367. doi: 10.1212/01.wnl.0000285081.04409.bb
Thomas, E. L., Frost, G., Taylor-Robinson, S. D., and Bell, J. D. (2012). Excess body fat in obese and normal-weight subjects. Nutr. Res. Rev. 25, 150–161. doi: 10.1017/s0954422412000054
Tolppanen, A. M., Ngandu, T., Kåreholt, I., Laatikainen, T., Rusanen, M., Soininen, H., et al. (2014). Midlife and late-life body mass index and late-life dementia: results from a prospective population-based cohort. J. Alzheimer Disease 38, 201–209. doi: 10.3233/jad-130698
van der Heide, L. P., Ramakers, G. M., and Smidt, M. P. (2006). Insulin signaling in the central nervous system: learning to survive. Prog. Neurobiol. 79, 205–221. doi: 10.1016/j.pneurobio.2006.06.003
Von Elm, E., Altman, D. G., Egger, M., Pocock, S. J., Gøtzsche, P. C., and Vandenbroucke, J. P. (2007). The strengthening the reporting of observational studies in epidemiology (STROBE) statement: Guidelines for reporting observational studies. Lancet 370, 1453–1457. doi: 10.1016/s0140-6736(07)61602-x
Ward, Z. J., Bleich, S. N., Cradock, A. L., Barrett, J. L., Giles, C. M., Flax, C., et al. (2019). Projected U.S. state-level prevalence of adult obesity and severe obesity. N. Engl. J. Med. 381, 2440–2450. doi: 10.1056/NEJMsa1909301
Wei, J., Wang, L., Kulshreshtha, A., and Xu, H. (2022). Adherence to Life's simple 7 and cognitive function among older adults: the National Health and nutrition examination survey 2011 to 2014. J. Am. Heart Assoc. 11:e022959. doi: 10.1161/jaha.121.022959
West, N. A., Lirette, S. T., Cannon, V. A., Turner, S. T., Mosley, T. H. Jr., and Windham, B. G. (2017). Adiposity, change in adiposity, and cognitive decline in mid- and late life. J. Am. Geriatr. Soc. 65, 1282–1288. doi: 10.1111/jgs.14786
Yiannopoulou, K. G., and Papageorgiou, S. G. (2020). Current and future treatments in Alzheimer disease: an update. J. Central Nervous System Disease. 12:1179573520907397. doi: 10.1177/1179573520907397
Zhang, Y., Yang, H., Li, S., Li, W. D., and Wang, Y. (2021). Consumption of coffee and tea and risk of developing stroke, dementia, and poststroke dementia: a cohort study in the UK biobank. PLoS Med. 18:e1003830. doi: 10.1371/journal.pmed.1003830
Keywords: National Health and Nutrition Examination Survey (NHANES), cognitive ability, weight-adjusted-waist index (WWI), obesity, Alzheimer’s disease (AD), body mass index (BMI)
Citation: Zhao C, Xu X and Hao C (2025) Evidence from NHANES 2011–2014: a correlation between the weight-adjusted-waist index and cognitive abilities in the United States. Front. Aging Neurosci. 17:1480609. doi: 10.3389/fnagi.2025.1480609
Edited by:
Xudong Zhao, Institute of Biophysics of Chinese Academy of Sciences, ChinaReviewed by:
Bernadette A. Fausto, Rutgers University, Newark, United StatesArmin Ezzati, University of Florida, United States
Copyright © 2025 Zhao, Xu and Hao. This is an open-access article distributed under the terms of the Creative Commons Attribution License (CC BY). The use, distribution or reproduction in other forums is permitted, provided the original author(s) and the copyright owner(s) are credited and that the original publication in this journal is cited, in accordance with accepted academic practice. No use, distribution or reproduction is permitted which does not comply with these terms.
*Correspondence: Chunyan Hao, aGFvY2h1bnlhbjY4QDEyNi5jb20=