 Xiaoting Li
 Zhaohao Zeng
- 1Department of Neurology, Panyu Hexian Memorial Affiliated Hospital of Guangzhou, Guangzhou, China
- 2Department of Neurology, Shenzhen People’s Hospital (The First Affiliated Hospital, Southern University of Science and Technology, The Second Clinical Medical College, Jinan University), Shenzhen, Guangdong, China
- 3Guangdong Provincial Clinical Research Center for Geriatrics, Shenzhen Clinical Research Center for Geriatrics, Shenzhen People’s Hospital (The Second Clinical Medical College, Jinan University, The First Affiliated Hospital, Southern University of Science and Technology), Shenzhen, China
Objectives: To investigate the association between estimated glucose disposal rate (eGDR), a surrogate marker of insulin resistance, and Parkinson’s disease (PD) risk, and to examine the relationship between eGDR and all-cause mortality among PD patients.
Methods: Using data from the National Health and Nutrition Examination Survey (NHANES) 2003–2016, we conducted a cross-sectional study of 20,767 participants aged ≥40 years. eGDR was calculated using waist circumference, hypertension status, and HbA1c levels. PD cases were identified through anti-parkinsonian medication use. The association between eGDR and PD was examined using weighted logistic regression models with progressive adjustment for potential confounders. Survival analysis was performed in 255 PD patients to assess the relationship between eGDR and all-cause mortality.
Results: Among participants, 256 had PD (weighted prevalence: 1.23%). Higher eGDR was associated with lower odds of PD in crude analysis (OR: 0.906, 95% CI: 0.856–0.960, P < 0.001). After full adjustment, the highest eGDR tertile showed significantly lower odds of PD compared to the lowest tertile (OR: 0.574, 95% CI: 0.337–0.976, P = 0.040). Restricted cubic spline analysis revealed a significant M-shaped non-linear relationship between eGDR and PD risk (P for non-linearity < 0.001). In survival analysis, higher eGDR was associated with lower mortality risk (adjusted HR: 0.875, 95% CI: 0.775–0.987, P = 0.030), with an inverted U-shaped relationship observed (P for non-linearity = 0.0352).
Conclusion: Higher eGDR levels are associated with lower PD risk and better survival in PD patients, suggesting that insulin sensitivity might play a role in PD pathogenesis and progression. These findings highlight the potential importance of metabolic health in PD.
1 Introduction
Parkinson’s disease (PD) is one of the most common neurodegenerative disorders, characterized by motor and non-motor symptoms, affecting approximately 1% of individuals aged over 60 years worldwide (Shtilbans and Henchcliffe, 2012; Maciotta et al., 2013). Emerging research suggests that metabolic dysfunction may contribute to PD development and progression (Dai et al., 2023; Ye et al., 2023; Zhong et al., 2024). Among various metabolic factors, insulin resistance has emerged as a significant area of interest in PD research (Athauda and Foltynie, 2016).
Insulin resistance, traditionally associated with type 2 diabetes and cardiovascular disease, has been implicated in various neurodegenerative processes (Athauda and Foltynie, 2016; Hölscher, 2020). Studies have shown that insulin signaling plays crucial roles in neuronal survival, synaptic plasticity, and brain glucose metabolism (Kullmann et al., 2016; Kellar and Craft, 2020). Disruption of insulin signaling in the central nervous system has been linked to increased neurodegeneration and cognitive decline (Kullmann et al., 2016). Several epidemiological studies have reported associations between type 2 diabetes, insulin resistance, and increased risk of PD (Yue et al., 2016; Cheong et al., 2020; Aune et al., 2023), although the results have been inconsistent (Simon et al., 2007; Palacios et al., 2011).
The estimated glucose disposal rate (eGDR), originally developed to assess insulin sensitivity in type 1 diabetes (Williams et al., 2000), has emerged as a valuable surrogate marker for insulin resistance. This index, calculated from routinely measured clinical parameters (waist circumference, hypertension, and HbA1c), serves as a practical and scalable tool for assessing insulin sensitivity in large-scale epidemiological studies, circumventing the need for complex laboratory procedures like hyperinsulinemic-euglycemic clamps, and extending its relevance beyond diabetes research to fields such as neurodegenerative disease investigations (Guo et al., 2024; He et al., 2024; Peng et al., 2024). While eGDR has been extensively studied in diabetes and cardiovascular diseases (Williams et al., 2000; Guo et al., 2024; Peng et al., 2024), its relationship with neurodegenerative disorders, particularly PD, remains largely unexplored.
Previous studies on insulin resistance and PD risk have yielded conflicting results, potentially due to variations in study design, insulin sensitivity metrics, and population characteristics. By using eGDR, a validated measure of insulin resistance, this study aims to clarify the metabolic contributions to PD. Understanding the association between eGDR and PD could provide valuable insights into the role of insulin resistance in PD pathogenesis and potentially identify new therapeutic targets. Moreover, given the increasing evidence linking metabolic health to neurodegenerative diseases (Camandola and Mattson, 2017; Dai et al., 2023; Ye et al., 2023; Zhong et al., 2024), investigating whether eGDR could serve as a marker for PD risk or progression has important clinical implications.
Therefore, using data from the National Health and Nutrition Examination Survey (NHANES) 2003–2016, we aimed to: (1) examine the cross-sectional association between eGDR and PD risk; (2) investigate the relationship between eGDR and all-cause mortality in PD patients; and (3) explore potential non-linear relationships in these associations. Given the role of insulin resistance in neurodegeneration, we hypothesize that lower eGDR levels, reflecting greater insulin resistance, will be associated with higher PD risk and mortality.
2 Materials and methods
2.1 Study design and participants
This analysis utilized data from the National Health and Nutrition Examination Survey (NHANES), a comprehensive national surveillance system implemented biennially since 1999. Conducted by the National Center for Health Statistics (NCHS), NHANES provides nationally representative data on the health and nutritional status of the United States population through standardized interviews and physical examinations. All study protocols received approval from the NCHS Ethics Review Board, and participants provided written informed consent prior to enrollment. The data are publicly accessible through the CDC website1.
For this study, we included data from seven consecutive NHANES cycles, spanning the years 2003 to 2016. The selection of the study population is depicted in Figure 1. Starting with an initial population of 71,058 participants, we applied the following exclusion criteria: 45,359 subjects younger than 40 years of age and 4,932 subjects with missing data. The final analytic cohort comprised 20,767 participants, including 256 cases with PD and 20,511 non-PD controls. For the survival analysis, one subject was excluded due to missing vital status data, resulting in 255 PD patients (161 alive and 94 deceased at the end of follow-up).
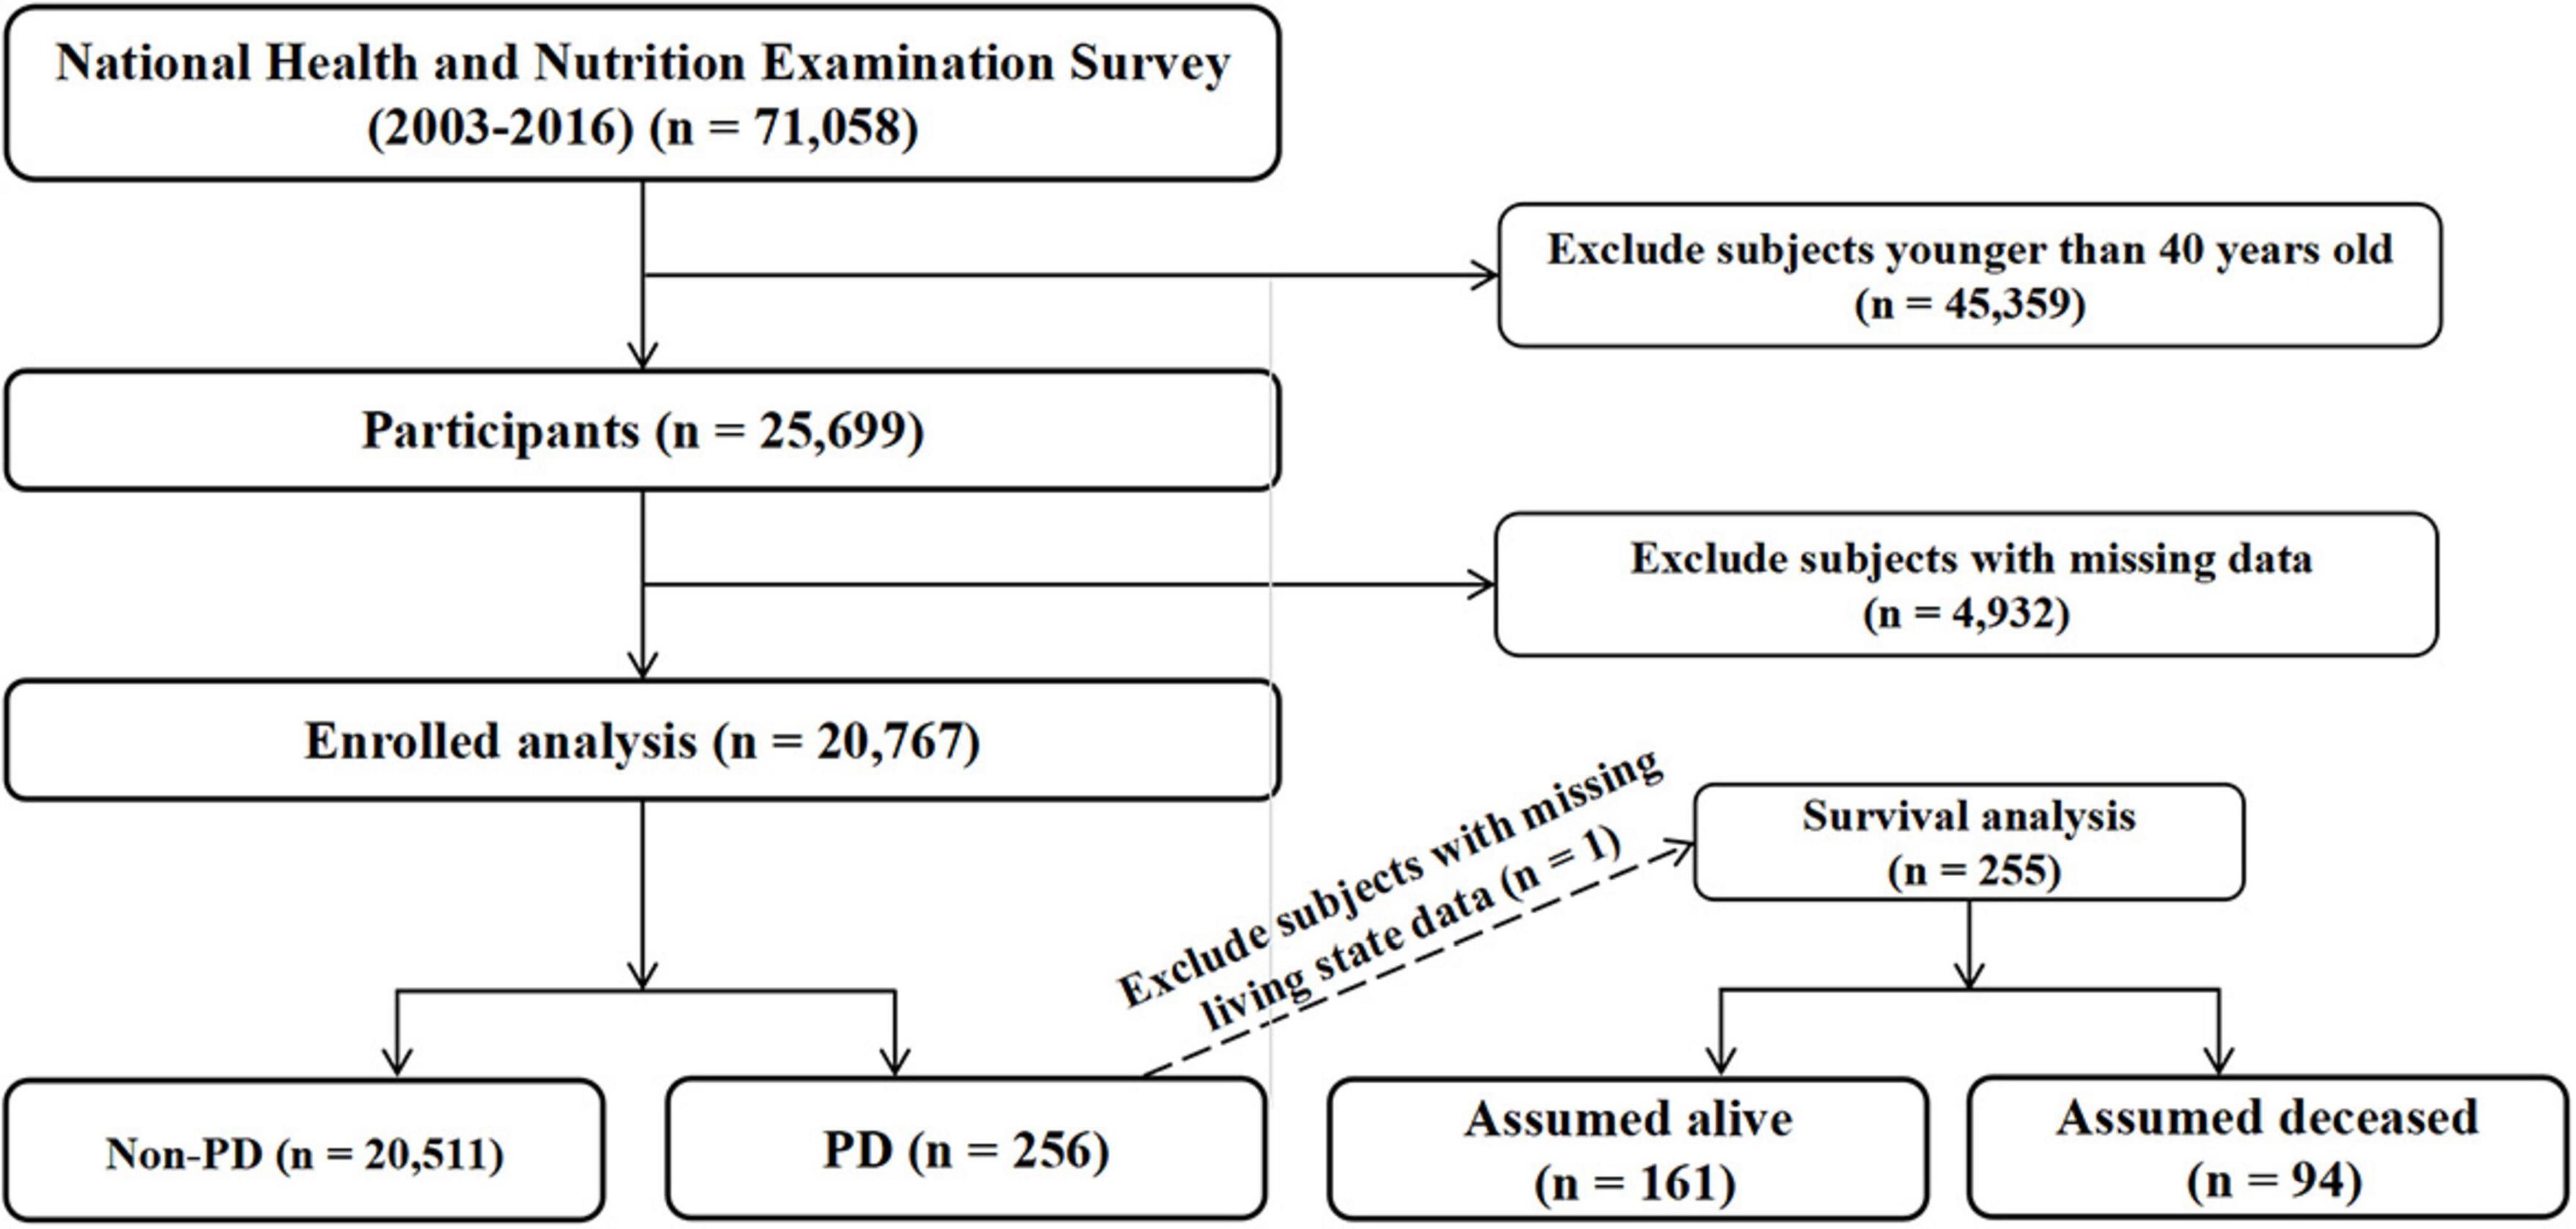
Figure 1. Flow chart of study population selection. Flow chart showing the selection process of study participants from the National Health and Nutrition Examination Survey (NHANES) 2003–2016.
2.2 Calculation of eGDR
As previously mentioned, the estimated glucose disposal rate (eGDR) was calculated according to the following equation: eGDR (mg/kg/min) = 21.158 - (0.09 × WC) - (3.407 × HT) - (0.551 × HbA1c) (Epstein et al., 2013). Where WC is waist circumference (cm), HT is hypertension (yes = 1/no = 0), and HbA1c is glycated hemoglobin (%DCCT). Hypertension was defined according to the International Classification of Diseases, 10th Revision (ICD-10) with codes I10, or systolic blood pressure ≥140 mmHg and diastolic blood pressure ≥90 mmHg, or use of antihypertensive medication, or based on general practitioner diagnosis, medication reimbursement, or self-reported information. HbA1c was measured using the High-Performance Liquid Chromatography method. The eGDR values were divided into tertiles: T1 (≥−3.9773 to ≤5.485), T2 (>5.485 to ≤8.408), and T3 (>8.408 to <12.9593). These cut-off values were determined based on the distribution of the data to facilitate the comparison of groups with different eGDR levels in subsequent analyses.
2.3 Identification of PD cases
Following established methodologies from previous studies (Liu et al., 2023; Zeng et al., 2023, 2024), we identified PD cases through participants’ medication use data in NHANES. Case classification was based on reported use of anti-parkinsonian medications: individuals reporting the use of these medications were designated as suspected PD cases, while those without documented anti-parkinsonian medication use were classified as non-PD controls.
2.4 Assessment of mortality
The primary endpoint of this cohort study was all-cause mortality, encompassing deaths attributed to any cause. Vital status of participants and duration of follow-up were ascertained through linkage to the National Death Index, with surveillance extending through 31 December 2019.1 Follow-up time was calculated from each participant’s initial enrollment in the NHANES program until either their date of death or the end of the study period (31 December 2019), whichever occurred first.
2.5 Assessment of other variables
Data on demographic and lifestyle characteristics were collected through standardized questionnaires. Body mass index (BMI) was calculated as weight in kilograms divided by height in meters squared (kg/m2). Education level was categorized as below high school, high school, and above high school. Marital status was classified as never married, married/living with partner, and widowed/divorced/separated. Smoking status (yes/no) and alcohol consumption (yes/no) were self-reported. For comorbidities assessment, diabetes was defined by meeting any of the following criteria: self-reported physician diagnosis, glycohemoglobin (HbA1c) ≥6.5%, 2 h oral glucose tolerance test (OGTT) blood glucose ≥11.1 mmol/L, or use of diabetes medication or insulin. Hypertension was diagnosed by self-reported questionnaire data, antihypertensive medication use, or a systolic or diastolic blood pressure reading of ≥140/90 mmHg. Stroke and coronary heart disease were assessed based on self-reported physician diagnosis or relevant medication use.
2.6 Statistical analysis
Baseline characteristics were presented as mean (standard error) for continuous variables and frequency (weighted percentage) for categorical variables. Differences between groups were compared using weighted t-tests for continuous variables and weighted chi-square tests for categorical variables. The association between eGDR and PD was first examined using weighted univariate logistic regression analysis. Socioeconomic status indicators, such as education level and marital status, may influence individuals’ lifestyles and health conditions, thereby potentially confounding the risk of PD. These variables have been included as confounders for adjustment in previous epidemiological studies on PD (Liu et al., 2023; Zeng et al., 2023, 2024). Weighted multivariate logistic regression analyses were then conducted with four progressive adjustment models: Crude model: no adjustment for any confounding factors; Model 1: adjusted for age, gender, race, BMI, and height; Model 2: adjusted for Model 1 variables plus education, marital status, alcohol use, and smoking status; Model 3: adjusted for Model 2 variables plus stroke, coronary heart disease, and diabetes mellitus. Stratified analyses were performed to assess potential effect modifications by age, gender, race, and comorbidities. For survival analysis, weighted Cox proportional hazards models were employed using the same adjustment strategy. Kaplan-Meier curves were generated to visualize survival probabilities across eGDR tertiles, with differences assessed using the log-rank test. Restricted cubic spline analyses were conducted to examine potential non-linear relationships between eGDR and both PD risk and mortality. All statistical analyses were performed using R software version 4.2.2. A two-sided P-value < 0.05 was considered statistically significant.
3 Results
3.1 Baseline characteristics of study participants according to Parkinson’s disease status
As shown in Table 1, a total of 20,741 participants were included in this analysis, among whom 255 participants had PD. PD patients were significantly older than non-PD participants (60.644 ± 1.178 vs 57.304 ± 0.162 years, P = 0.005). There was a significant gender difference in PD distribution, with females accounting for a higher proportion of PD cases (62.481% vs 52.201%, P = 0.011). Race distribution also varied significantly between groups (P = 0.004), with Non-Hispanic Whites comprising the majority of PD cases (83.101%). The mean eGDR was significantly lower in PD patients compared to non-PD participants (6.476 ± 0.205 vs 7.174 ± 0.035, P = 0.001). When categorized into tertiles, there was a significant difference in eGDR distribution (P < 0.001), with a higher proportion of PD cases in the lower tertiles (T1: 38.264%, T2: 37.892%) compared to the highest tertile (T3: 23.844%). Regarding comorbidities, PD patients had a significantly higher prevalence of stroke (12.356% vs 3.924%, P < 0.0001) and diabetes (24.634% vs 18.040%, P = 0.016). Other characteristics, including BMI, height, marital status, education level, alcohol use, smoking status, and coronary heart disease, showed no significant differences between groups.
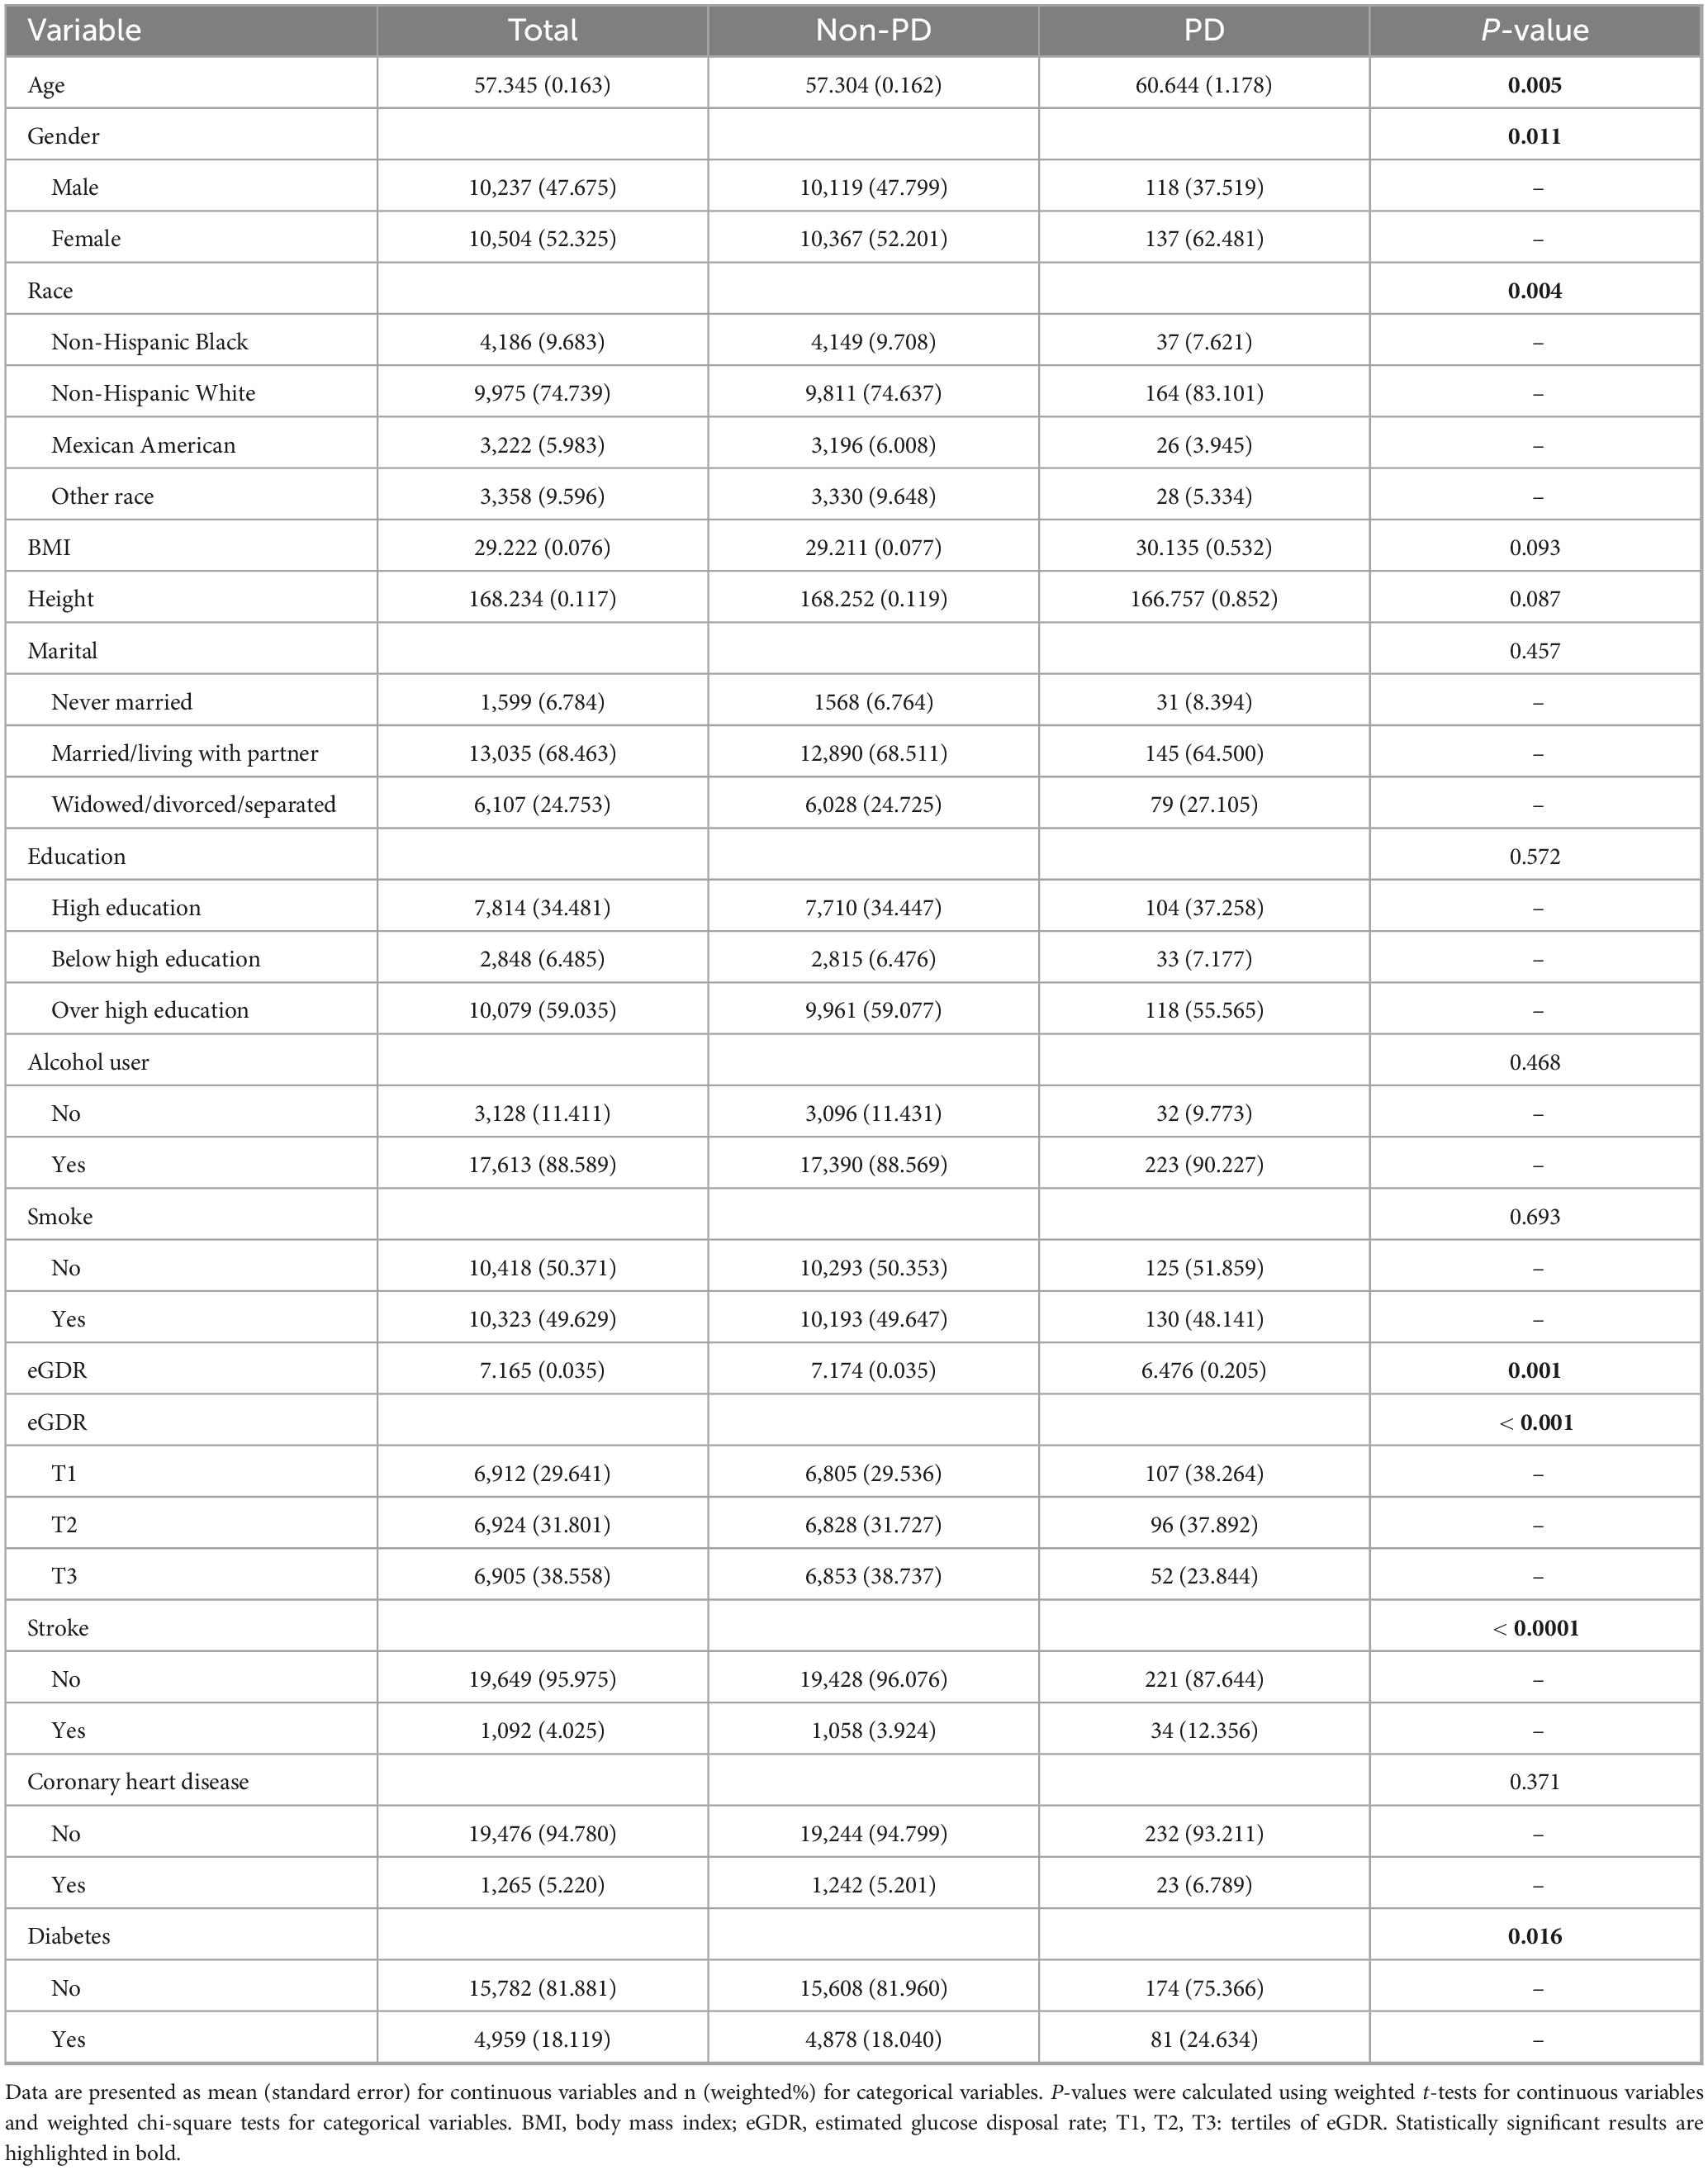
Table 1. Baseline characteristics of study participants according to Parkinson’s disease status.
3.2 Univariate logistic regression analysis of factors associated with Parkinson’s disease
In the univariate logistic regression analysis, several factors were significantly associated with PD. As shown in Table 2, age showed a positive association with PD (OR: 1.023, 95% CI: 1.008–1.039, P = 0.003). In lay terms, this means that for every additional year of age, the odds of having PD increase by approximately 2.3%. Female gender was associated with higher odds of PD compared to males (OR: 1.525, 95% CI: 1.102–2.110, P = 0.011). The analysis of eGDR revealed a significant inverse association with PD, both as a continuous variable (OR: 0.907, 95% CI: 0.856–0.960, P = 0.001) and when categorized into tertiles. Compared to the lowest tertile (T1), the highest tertile (T3) showed significantly lower odds of PD (OR: 0.475, 95% CI: 0.311–0.726, P < 0.001), meaning that individuals in the highest eGDR tertile had about 52.5% lower odds of having PD compared to those in the lowest tertile, while the middle tertile (T2) showed no significant difference (OR: 0.922, 95% CI: 0.643–1.321, P = 0.655). Regarding comorbidities, stroke showed the strongest association with PD, with stroke patients having more than three times the odds of having PD (OR: 3.452, 95% CI: 2.150–5.541, P < 0.0001). Diabetes was also significantly associated with increased odds of PD (OR: 1.485, 95% CI: 1.077–2.048, P = 0.016). Other variables, including race, BMI, height, marital status, education level, alcohol use, smoking status, and coronary heart disease, did not show statistically significant associations with PD in the univariate analysis.
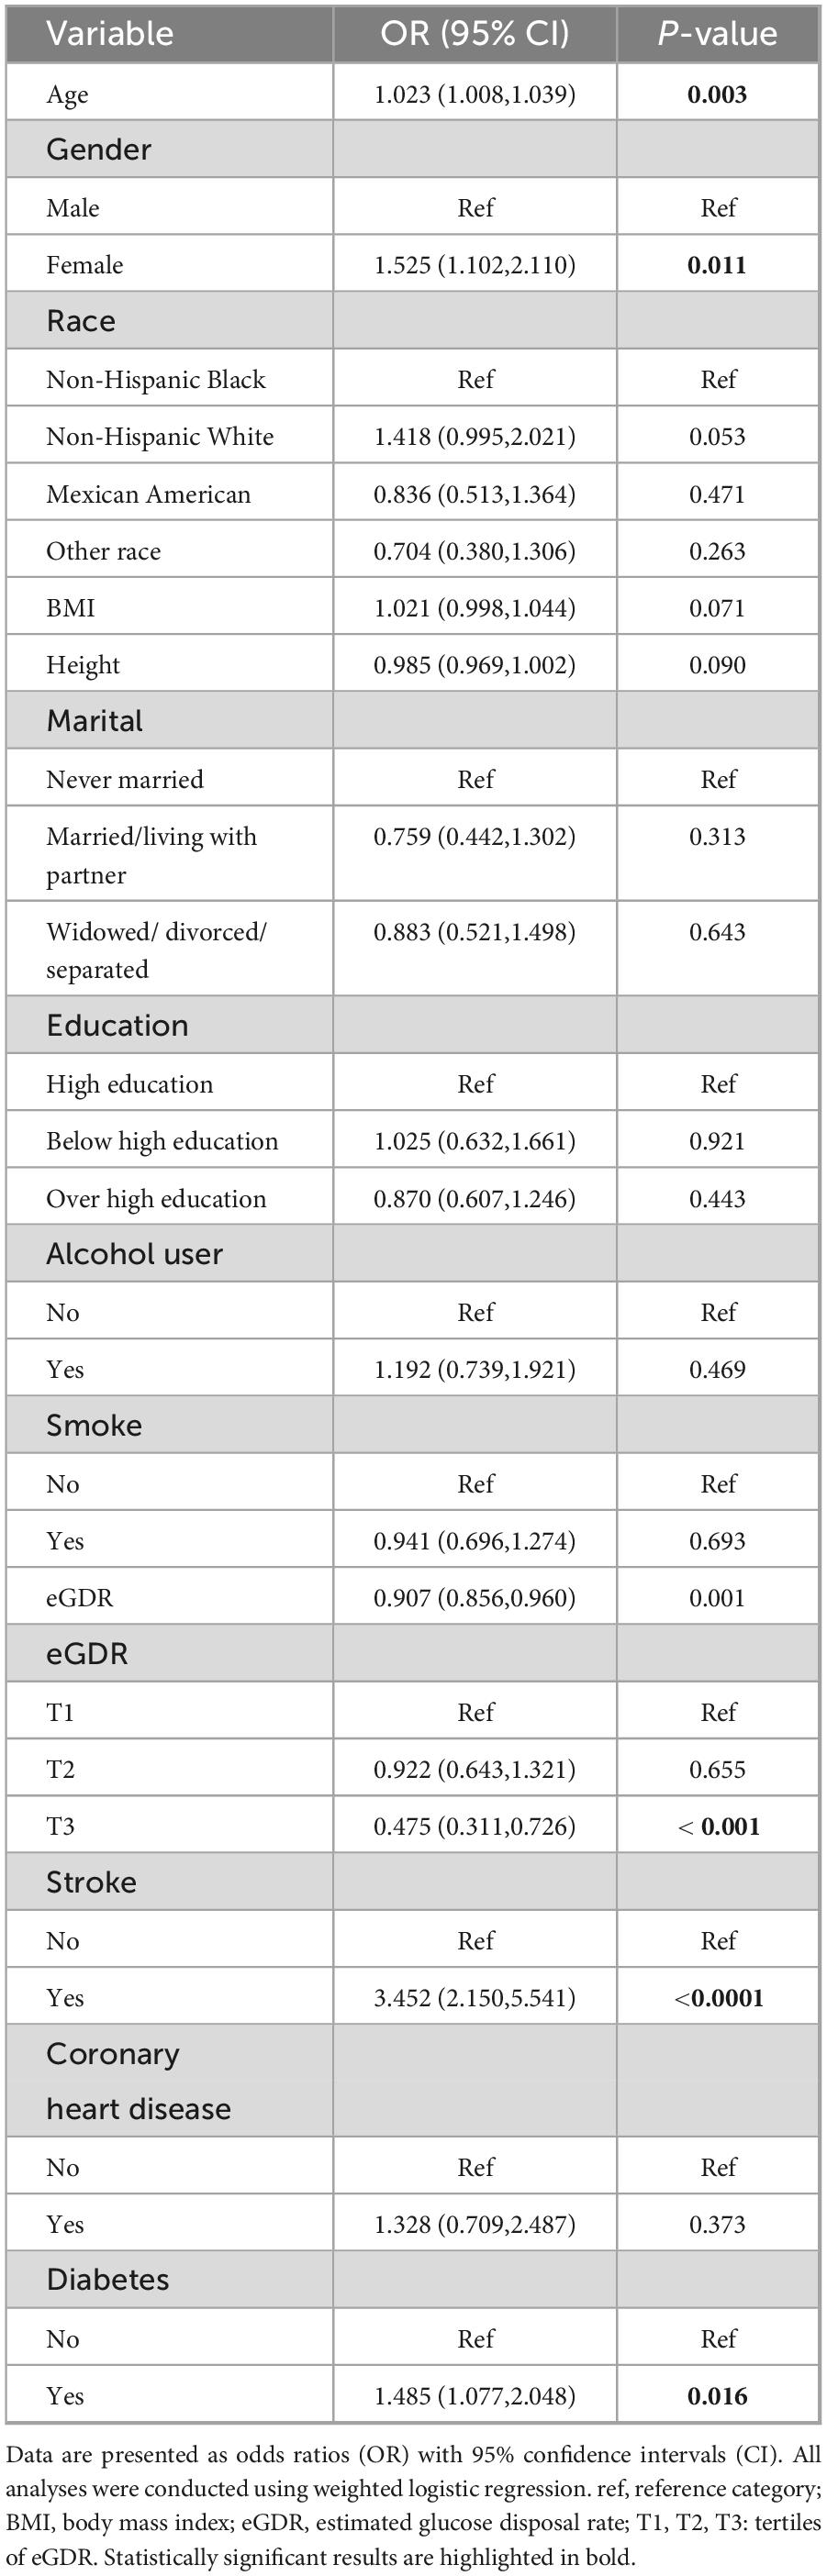
Table 2. Univariate logistic regression analysis of factors associated with Parkinson’s disease.
3.3 Association between eGDR and Parkinson’s disease in different adjustment models
The association between eGDR and PD was examined using four progressive adjustment models in Table 3. In the crude model, eGDR showed a significant inverse association with PD risk (OR: 0.906, 95% CI: 0.856–0.960, P < 0.001). This association remained significant after adjusting for demographic and anthropometric factors in Model 1 (OR: 0.906, 95% CI: 0.830–0.988, P = 0.027) and further adjustment for lifestyle factors in Model 2 (OR: 0.905, 95% CI: 0.829–0.989, P = 0.028). However, after additional adjustment for comorbidities in Model 3, the association was attenuated and became non-significant (OR: 0.926, 95% CI: 0.840–1.020, P = 0.117). When analyzing eGDR in tertiles, compared to the lowest tertile (T1), the highest tertile (T3) consistently showed lower odds of PD across all models. The association remained significant even in the fully adjusted Model 3 (OR: 0.574, 95% CI: 0.337–0.976, P = 0.040), indicating that individuals in the highest tertile had about 42.6% lower odds of having PD compared to those in the lowest tertile. The middle tertile (T2) showed no significant difference from T1 in any model. The trend analysis across tertiles demonstrated a significant linear trend in all models (P for trend = 0.033 in Model 3), suggesting a dose-response relationship between eGDR levels and PD risk.
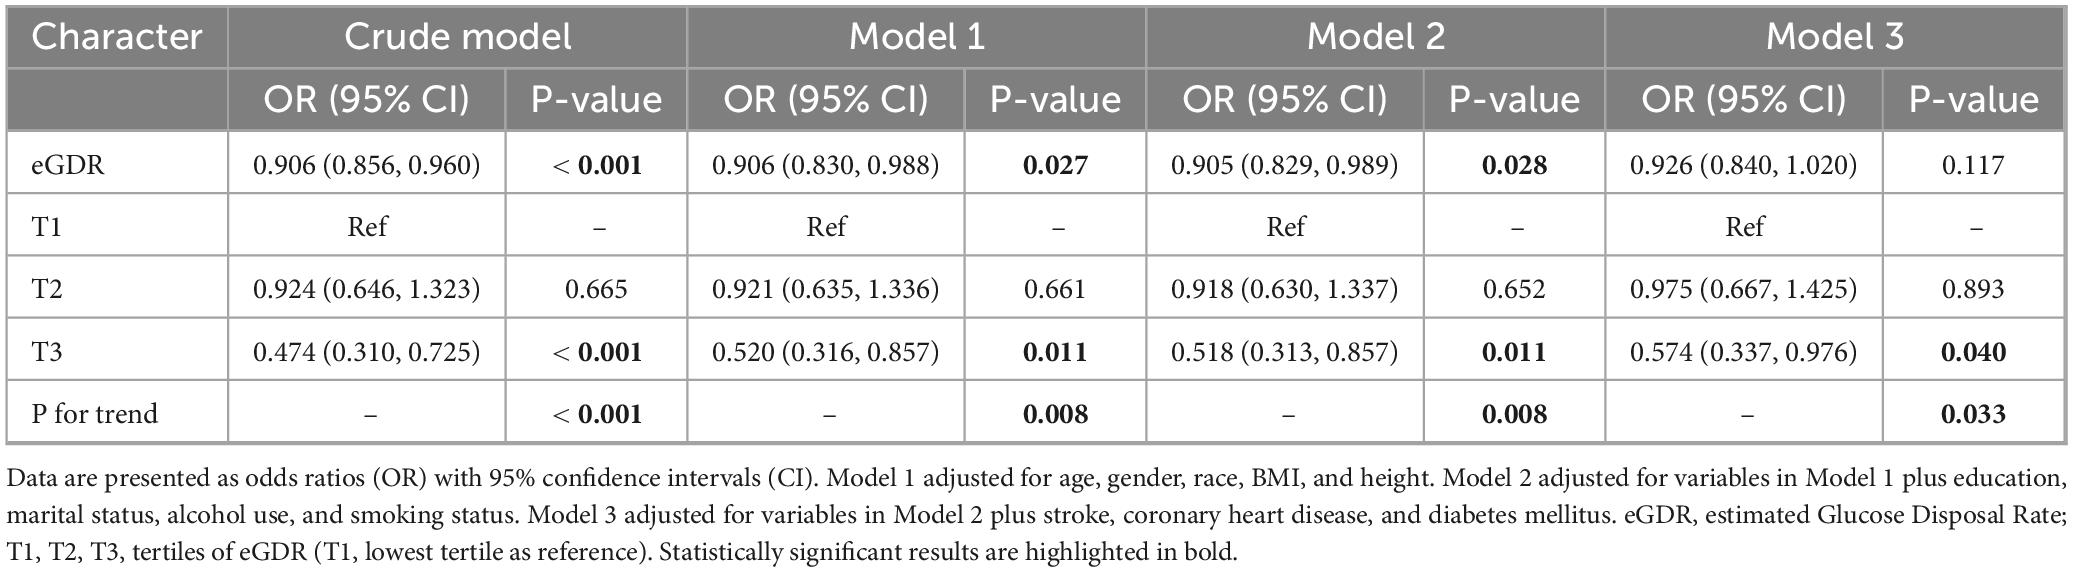
Table 3. Association between eGDR and Parkinson’s disease in different adjustment models.
3.4 Stratified analysis of the association between eGDR and Parkinson’s disease
Stratified analyses were performed to examine whether the association between eGDR and PD varied across different subgroups. The analyses revealed several notable patterns while adjusting for marital status, education, height, and BMI. As shown in Table 4, age-stratified analysis showed a stronger association in the 40–60 years age group (OR: 0.860, 95% CI: 0.756–0.978, P = 0.022) compared to those over 60 years (OR: 0.940, 95% CI: 0.837–1.056, P = 0.295), although the interaction was not significant (P for interaction = 0.139). The association was significant in both males (OR: 0.840, 95% CI: 0.722–0.978, P = 0.025) and females (OR: 0.889, 95% CI: 0.800–0.989, P = 0.031), with no significant gender interaction (P for interaction = 0.312). In race-stratified analyses, significant associations were observed among Non-Hispanic Whites (OR: 0.884, 95% CI: 0.795–0.982, P = 0.023) and Mexican Americans (OR: 0.790, 95% CI: 0.652–0.958, P = 0.017), but not among Non-Hispanic Blacks (OR: 0.962, 95% CI: 0.779–1.187, P = 0.715) or Other Races (OR: 0.905, 95% CI: 0.755–1.085, P = 0.279). However, the interaction by race was not significant (P for interaction = 0.339). When stratified by comorbidities, the association was significant among non-diabetic participants (OR: 0.879, 95% CI: 0.783–0.986, P = 0.029) but not among diabetic participants (OR: 0.928, 95% CI: 0.816–1.055, P = 0.251). Similar patterns were observed for other comorbidities, with stronger associations generally observed in participants without the respective conditions, although none of the interaction tests reached statistical significance.
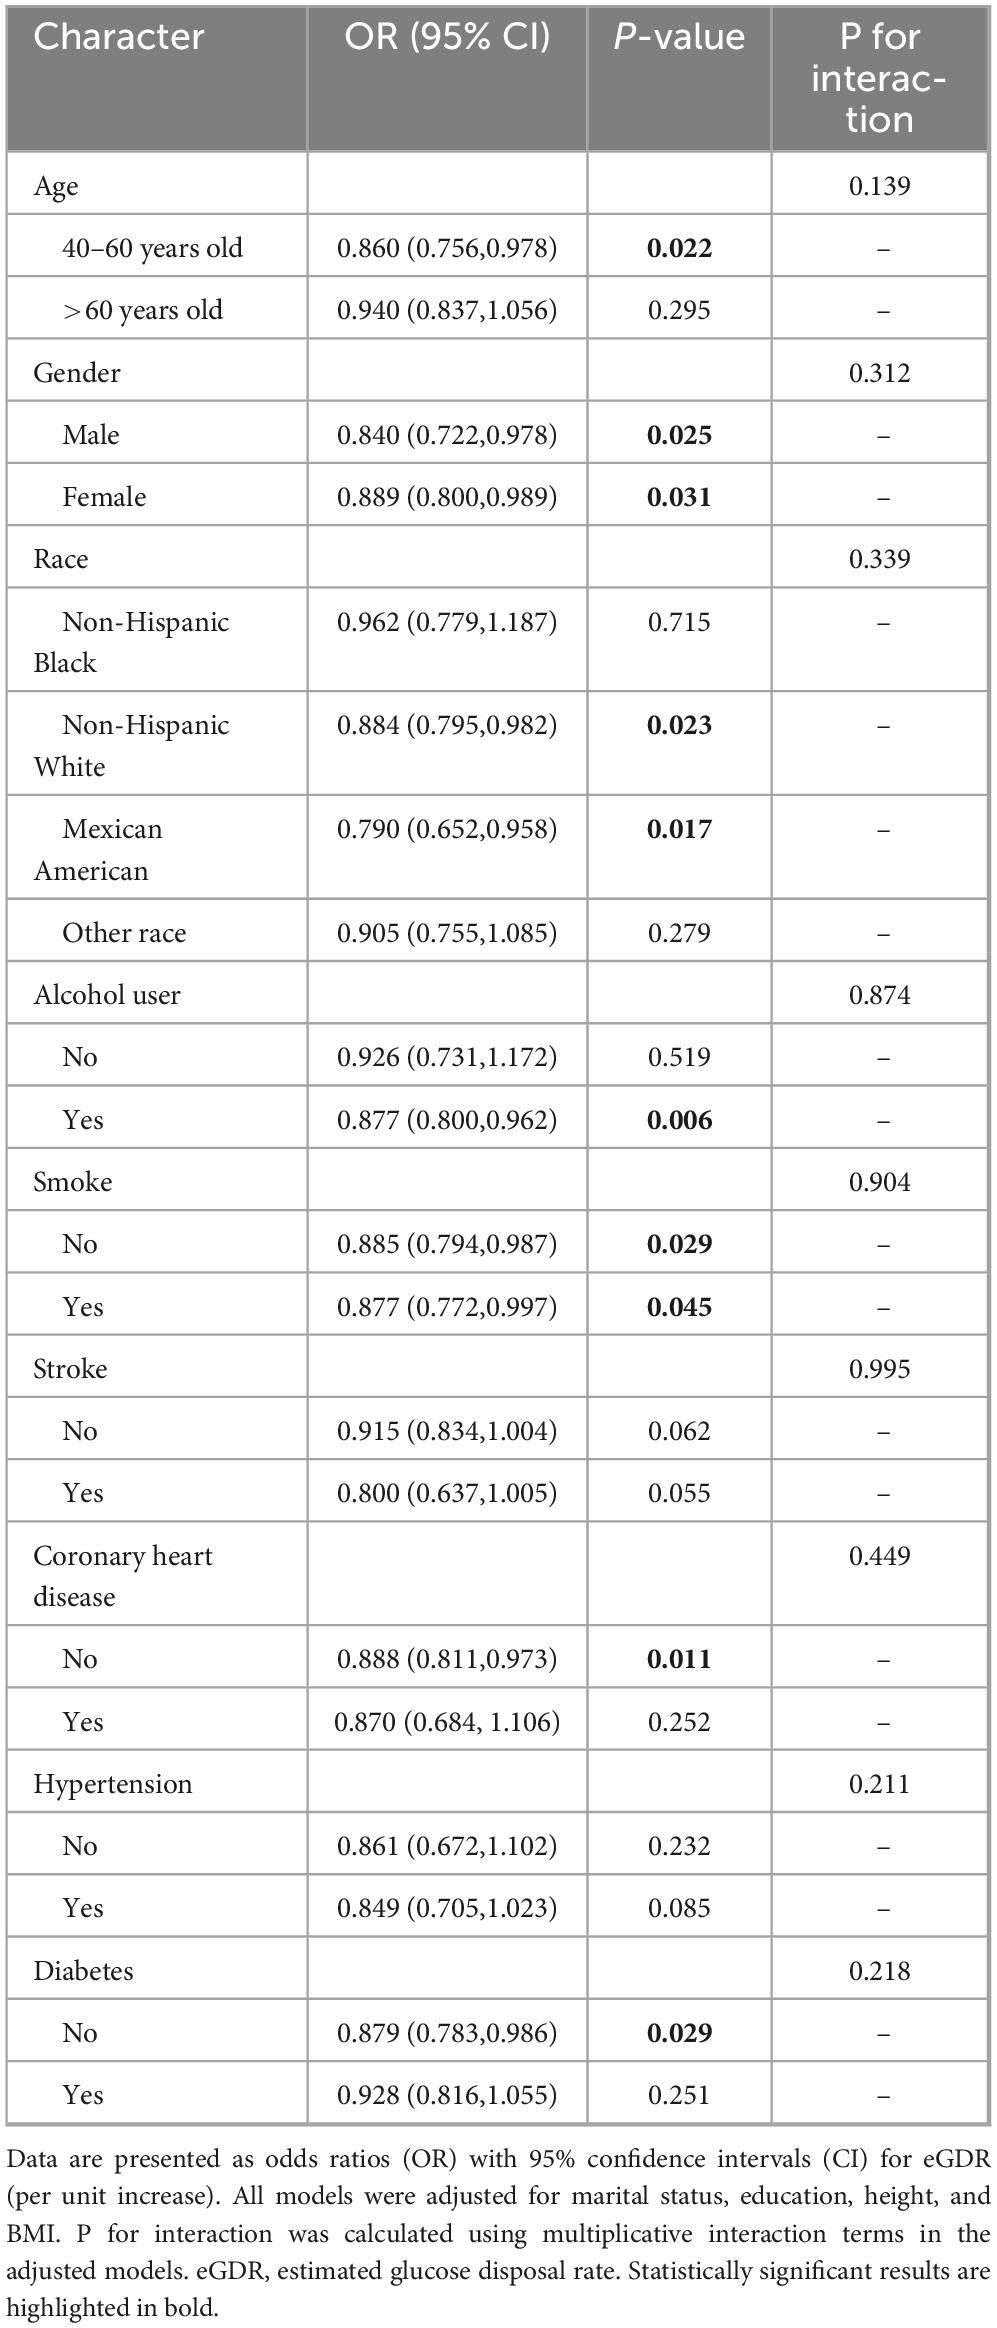
Table 4. Stratified analysis of the association between eGDR and Parkinson’s disease.
3.5 Association between eGDR and all-cause mortality among Parkinson’s disease patients in cox regression models
The association between eGDR and all-cause mortality among PD patients was evaluated using four progressive Cox regression models. As shown in Table 5, in the crude model, higher eGDR was significantly associated with lower mortality risk (HR: 0.876, 95% CI: 0.806–0.953, P = 0.002). This means that for every unit increase in eGDR, the risk of mortality decreased by about 12.4%. This protective association remained robust and even strengthened after adjusting for demographic and anthropometric factors in Model 1 (HR: 0.835, 95% CI: 0.746–0.934, P = 0.002) and after further adjustment for lifestyle factors in Model 2 (HR: 0.845, 95% CI: 0.756–0.944, P = 0.003). The association persisted, though slightly attenuated, in the fully adjusted Model 3, which included additional adjustment for comorbidities (HR: 0.875, 95% CI: 0.775–0.987, P = 0.030). When analyzing eGDR in tertiles, compared to the lowest tertile (T1), participants in the highest tertile (T3) consistently showed significantly lower mortality risk across all models. The association remained strong in the fully adjusted Model 3 (HR: 0.330, 95% CI: 0.141–0.768, P = 0.010), suggesting that individuals in the highest tertile had a 67% lower risk of all-cause mortality compared to those in the lowest tertile. The middle tertile (T2) showed no significant difference from the reference group across all models (Model 3 HR: 1.185, 95% CI: 0.635–2.210, P = 0.594), indicating a potential threshold effect in the association between eGDR and mortality risk.
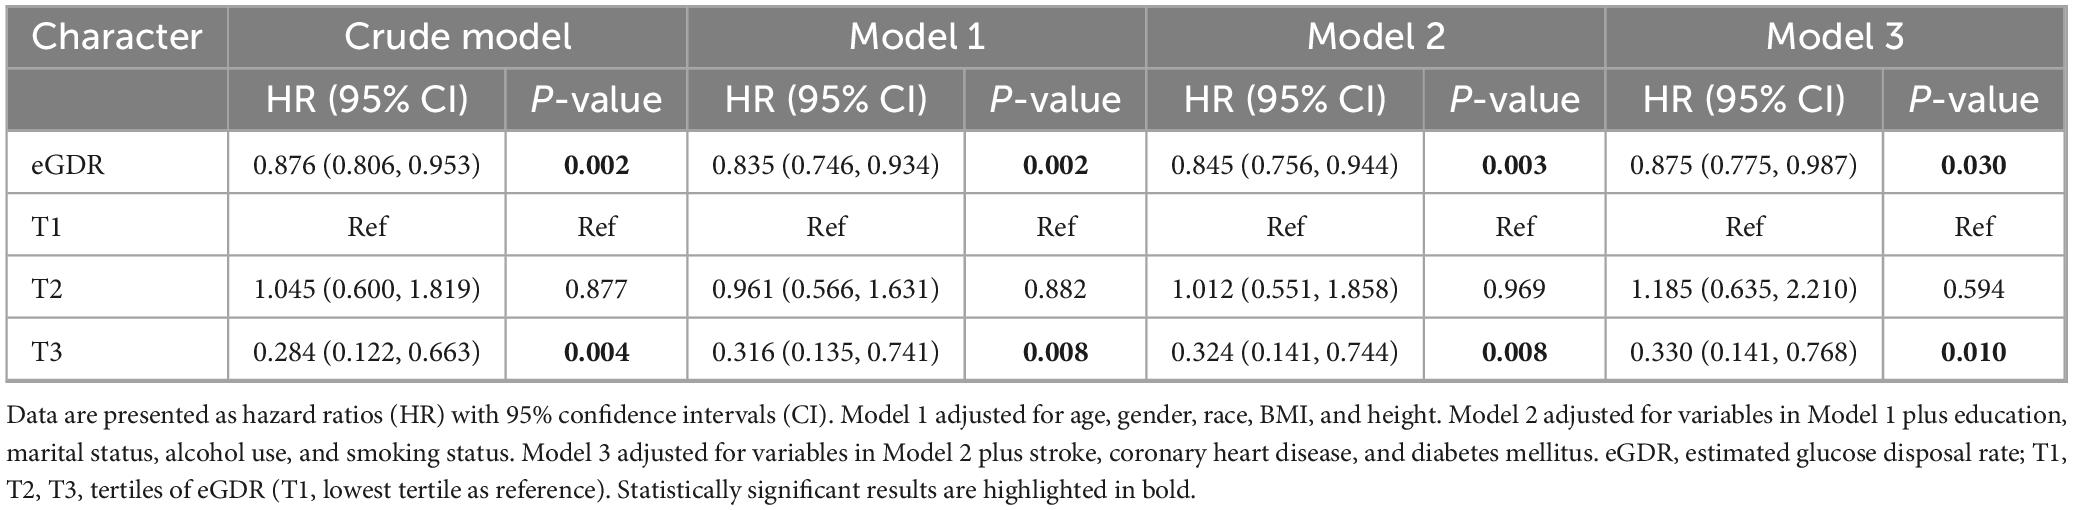
Table 5. Association between eGDR and all-cause mortality among Parkinson’s disease patients in cox regression models.
3.6 Kaplan-Meier survival curves for all-cause mortality stratified by eGDR tertiles
Figure 2 demonstrates the Kaplan-Meier survival curves for all-cause mortality among PD patients stratified by eGDR tertiles, with a significant difference observed between groups (log-rank P = 0.008). The highest tertile (T3, blue line) showed consistently better survival throughout the follow-up period compared to the middle (T2, green line) and lowest tertiles (T1, red line). The survival probability at different time points can be tracked through the risk table: At baseline (0 months): T1 started with 107 patients, T2 with 96 patients, and T3 with 52 patients (all with 100% survival); At 50 months: T1 retained 86 patients (88.119% survival), T2 retained 71 patients (91.403% survival), and T3 retained 42 patients (93.360% survival); At 100 months: T1 had 46 patients (69.940% survival), T2 had 27 patients (68.410% survival), and T3 had 21 patients (88.658% survival); At 150 months: T1 had 8 patients (45.610% survival), T2 had five patients (44.690% survival), and T3 had eight patients (87.754% survival). The survival curves demonstrated a clear separation, with T3 maintaining the highest survival probability throughout the follow-up period, while T1 and T2 showed similar but lower survival probabilities, particularly after 100 months of follow-up.
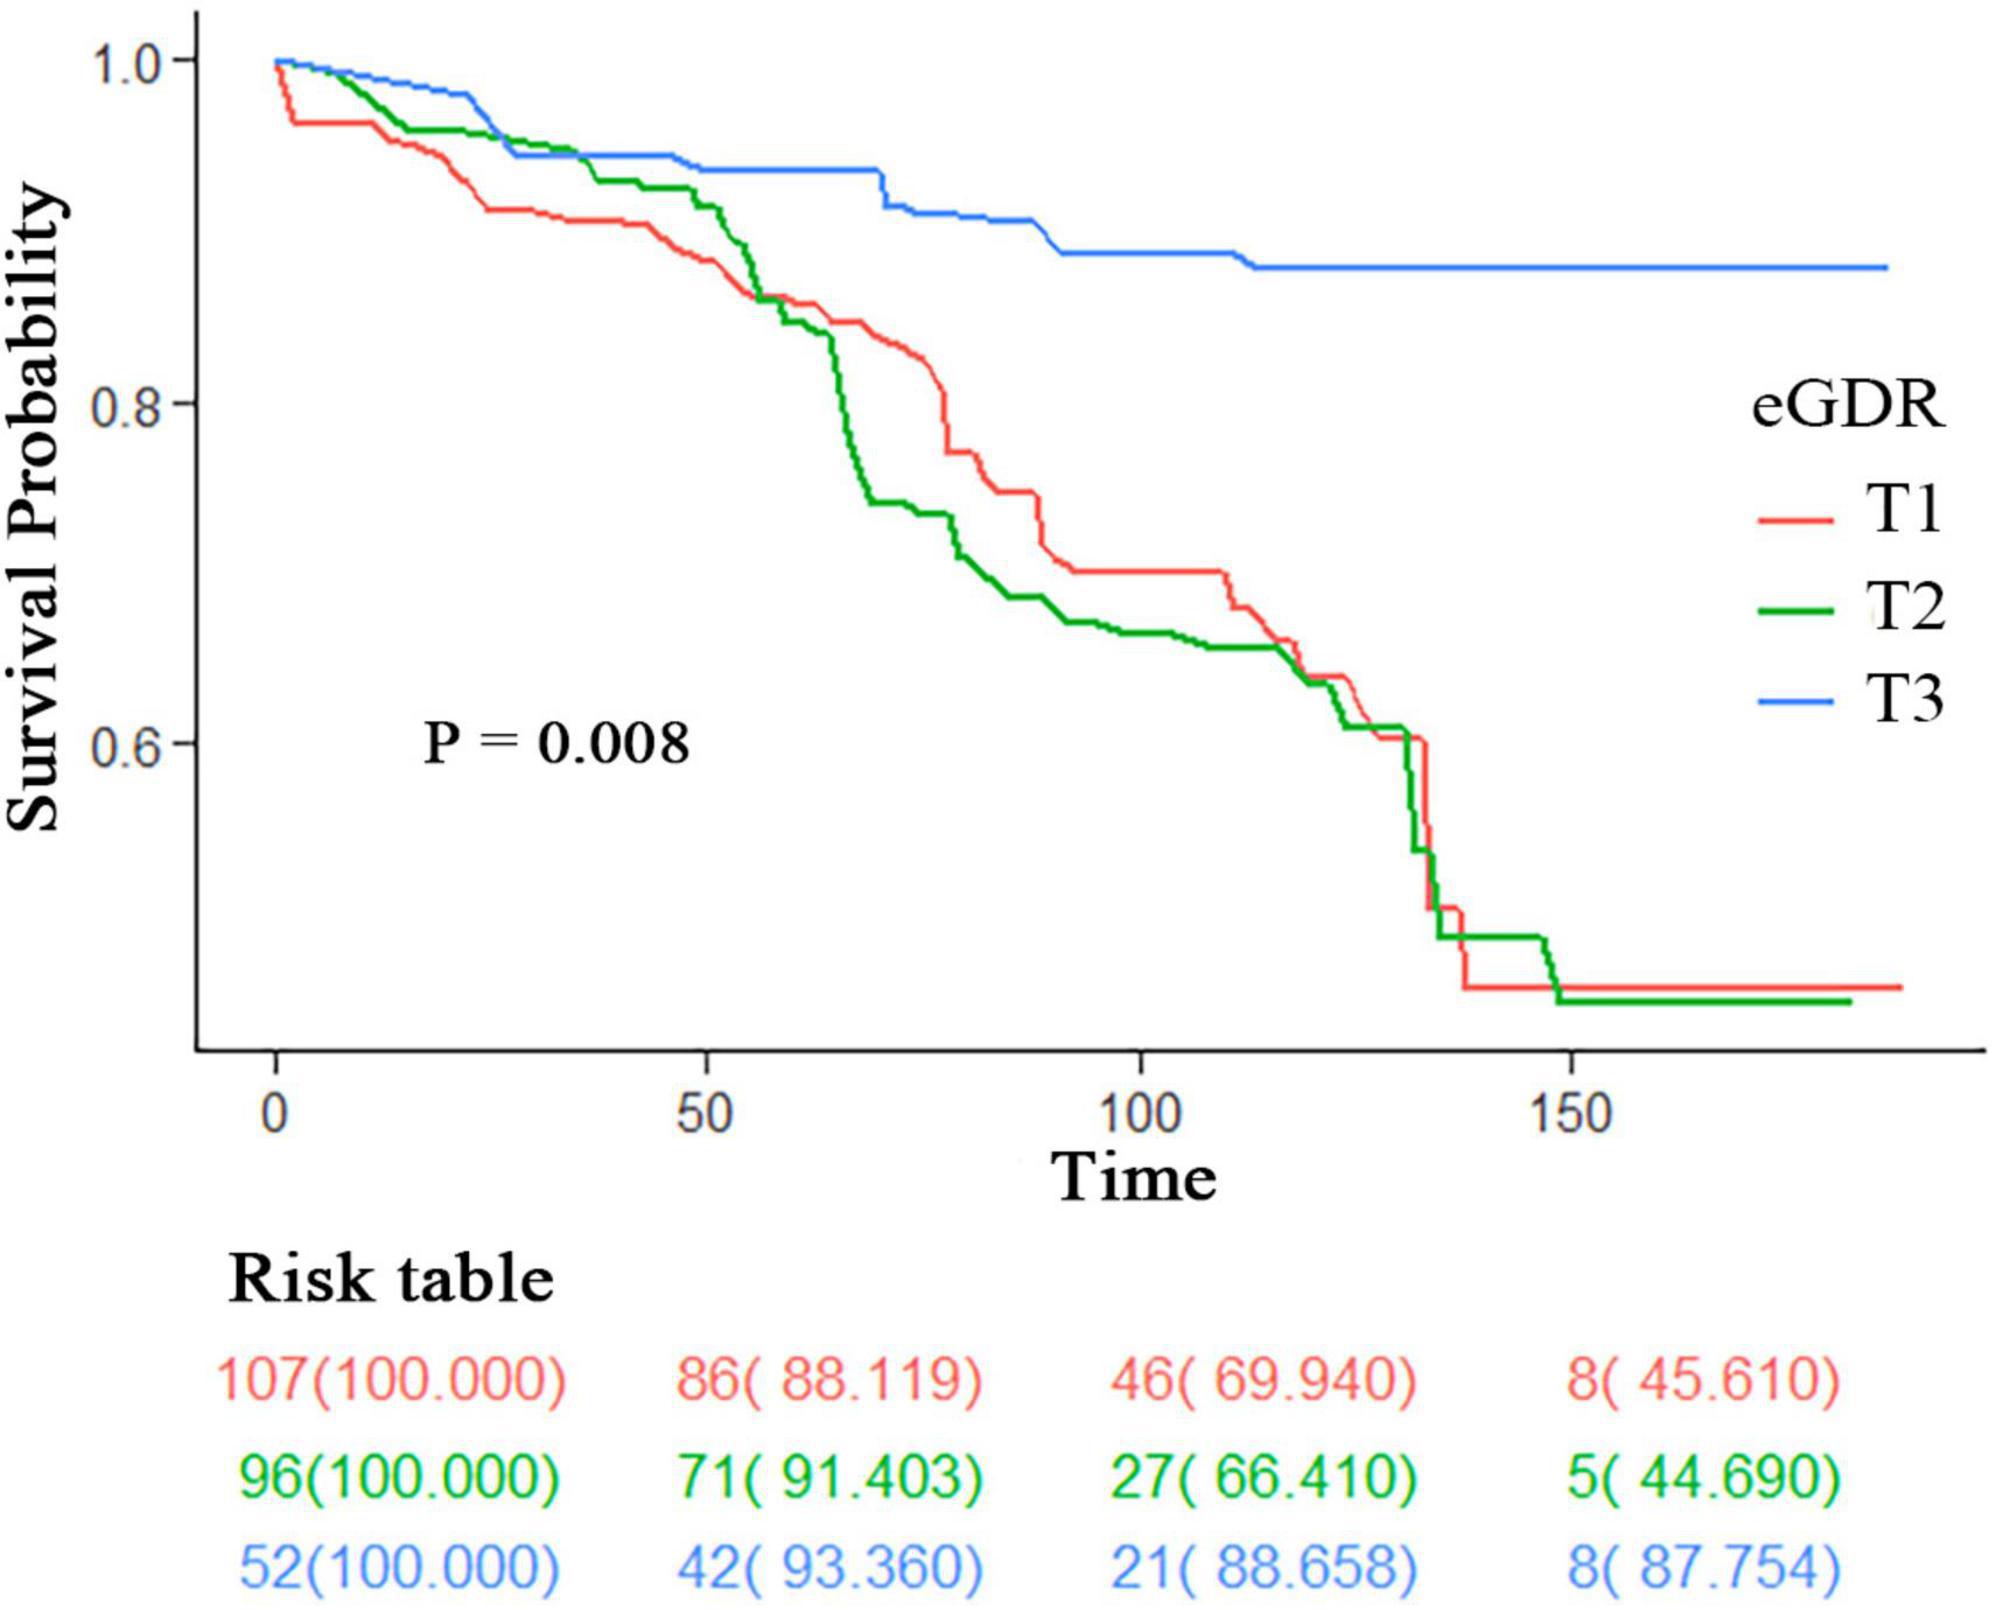
Figure 2. Kaplan-Meier survival curves for all-cause mortality stratified by eGDR tertiles. Survival curves are stratified by eGDR tertiles (T1: lowest tertile; T2: middle tertile; T3: highest tertile). The risk table shows the number of participants at risk (survival probability %) at 0, 50, 100, and 150 months. P-value was calculated using the log-rank test. eGDR, estimated glucose disposal rate.
3.7 Non-linear association of eGDR with Parkinson’s disease risk and all-cause mortality
Figure 3 illustrates the complex non-linear relationships between eGDR and PD outcomes through restricted cubic spline analyses. Panel A demonstrates a significant M-shaped non-linear association between eGDR and PD risk (P for non-linearity < 0.001). The relationship curve shows two distinct peaks: one occurring around an eGDR value of four, and another at approximately 7–8. After these peaks, the risk of PD gradually decreases with increasing eGDR values. The 95% confidence intervals (shown in green shading) become wider at the extremes of eGDR values, indicating increased uncertainty in these regions. Panel B reveals an inverted U-shaped relationship between eGDR and all-cause mortality risk among PD patients (P for non-linearity = 0.0352). The HR curve shows an initial increase in mortality risk up to an eGDR value of approximately 5–6, followed by a steady decline in risk at higher eGDR values. The mortality risk appears lowest at the highest eGDR values (> 8), suggesting a potentially protective effect of higher eGDR levels against mortality in PD patients. The confidence intervals also widen at the extremes, particularly at lower eGDR values.

Figure 3. Non-linear association of eGDR with Parkinson’s disease risk and all-cause mortality. The relationship between eGDR and outcomes was assessed using restricted cubic spline analyses with adjustment for potential confounders. The solid green lines represent the estimated odds ratios (OR) or hazard ratios (HR), and the shaded areas represent the 95% confidence intervals. The reference line (OR/HR = 1.0) is indicated by the dashed horizontal line. (A) Non-linear Association of eGDR with PD Risk (OR). (B) Non-linear Association of eGDR with All-cause Mortality (HR). P-value < 0.05 for non-linearity indicates a statistically significant non-linear relationship. eGDR, estimated glucose disposal rate.
4 Discussion
4.1 Epidemiological implications
Our study demonstrated a significant association between eGDR and both PD risk and mortality outcomes using NHANES 2003–2016 data. Several important findings emerged from this analysis. First, we found that higher eGDR levels were associated with lower odds of PD, with the highest tertile showing significantly reduced risk compared to the lowest tertile. Second, we observed a complex M-shaped non-linear relationship between eGDR and PD risk. Third, among PD patients, higher eGDR levels were associated with better survival outcomes, displaying an inverted U-shaped relationship with mortality risk.
4.2 Potential mechanistic insights
Parkinson’s disease is currently considered a disease influenced by both environmental and genetic factors. In fact, pathological degeneration in PD patients’ brains begins 10–20 years before clinical diagnosis (Hilker et al., 2005). By the time patients show obvious motor symptoms, about 50% of dopaminergic neurons in the substantia nigra are already lost (Reeve et al., 2014). Some early potential pathophysiological mechanisms play important roles in the early clinical stages, and overlapping disease mechanisms can be found between diabetes and PD. Diabetes is a metabolic disease primarily characterized by elevated peripheral blood glucose (American Diabetes Association, 2011). Similar to PD, T2DM is an age-related disease showing a trend toward younger onset (Kwak et al., 2010). Epidemiological studies both domestically and internationally have noted potential connections between diabetes and PD, with diabetes being a potential risk factor for PD (Cheong et al., 2020).
Sandyk first noticed the relationship between diabetes and PD in 1993, observing that PD patients with diabetes more commonly experienced worsening motor symptoms and responded poorly to treatment (Xu et al., 2011). Subsequently, numerous epidemiological studies confirmed a positive correlation between PD and diabetes. For example, a Finnish study of 51,552 people showed that T2DM patients had an 85% higher risk of developing PD compared to the general population. While other studies reported different figures, they confirmed that diabetes could increase PD risk by 28%–40% (Xu et al., 2011). In the past decade, two meta-analyses provided evidence in this field. The first meta-analysis in 2011 identified diabetes as a risk factor for PD (Cereda et al., 2011). The second study in 2016, which included seven cohort studies involving over 1.7 million people, concluded that diabetes patients had approximately 38% increased risk of PD (Yue et al., 2016). Recent Mendelian randomization studies have also revealed a causal relationship between diabetes and PD at the genetic level, confirming diabetes as a risk factor for PD development (Chohan et al., 2021). Additionally, studies have shown that diabetes itself can worsen both motor and non-motor symptoms of PD (Cereda et al., 2012; Kotagal et al., 2013), such as gait and posture abnormalities or severe cognitive impairment (Bohnen et al., 2014; Bosco et al., 2012; Giuntini et al., 2014), with diabetes advancing the onset of PD motor complications by nearly 1 year (Mohamed Ibrahim et al., 2018). Recent research has also found that pre-diabetes or mild blood glucose elevation in non-diabetic populations may increase PD risk (Rhee et al., 2020; Sánchez-Gómez et al., 2021). Our research similarly observed a higher proportion of diabetes in the PD group compared to the non-PD group, with univariate logistic regression analysis indicating diabetes as one of the potential risk factors for PD. These epidemiological studies reveal a close relationship between diabetes and PD, suggesting that diabetes may play a role in early PD or that there are commonalities in their pathophysiological mechanisms.
IR is the core characteristic of T2DM, a concept first proposed by Himsworth (2011) in 1936, defined as “decreased sensitivity and responsiveness of insulin target organs or tissues to insulin, or impaired insulin signal transduction.” The occurrence of IR is related to both genetic and environmental factors, with obesity being the main environmental risk factor. As the global obese population continues to expand, the prevalence of IR is steadily rising (Kahn et al., 2006). From a microscopic perspective, IR primarily results from abnormal insulin signaling pathway transduction. The serine residues at positions 616 and 312 of insulin receptor substrate IRS-1 protein are two key phosphorylation sites. Phosphorylation at position 616 inhibits the AKT signaling pathway, reducing insulin signal transduction, while phosphorylation at position 312 causes IRS-1 to escape cytoplasmic degradation, reducing IRS-1 expression. Changes in these key proteins or phosphorylation levels related to insulin signal transduction pathways can lead to IR (Demir et al., 2021). Some studies have found connections between IR-related indicator abnormalities and PD, such as elevated blood glucose levels (Rhee et al., 2020; Sánchez-Gómez et al., 2021). Earlier research showed that 50%–80% of PD patients have abnormal glucose tolerance (Sandyk, 1993). Additionally, some epidemiological studies indicate that high BMI is associated with increased PD risk (Abbott et al., 2002; Jeong et al., 2020), and increased waist circumference also raises PD risk (Park et al., 2022; Riso et al., 2019). IR is also associated with more severe PD phenotypes, accelerated disease progression, and increased risk of PD dementia (Cereda et al., 2012; Kotagal et al., 2013). At the molecular level, brain IR mainly manifests as impaired downstream signal transduction after insulin receptor activation (Arnold et al., 2018), with evidence of insulin receptor loss in the substantia nigra of PD patients found early on Moroo et al. (1994), Takahashi et al. (1996). In PD patients’ substantia nigra pathological samples, significant loss of IRS-1 mRNA and increased IR were detected (Takahashi et al., 1996). Elevated phosphorylation levels of serine residues (which inactivate insulin signal transduction) (IRS-312) were found in the basal ganglia and substantia nigra, with these changes occurring before dopaminergic neuron damage (Moroo et al., 1994). In PD patients and animal models’ brain tissue, the ratio of phosphorylated AKT to total AKT was significantly reduced (Malagelada et al., 2008; Selvakumar et al., 2020). GSK-3β is one of AKT’s activation targets; reduced GSK3β after AKT activation increases cellular autophagy to clear abnormally aggregated α-synuclein, potentially reducing dopaminergic neuron apoptosis, however, increased GSK3β expression was found in PD patients and animal models (Hernandez-Baltazar et al., 2013). Additionally, basic research has demonstrated that mice with brain IR show impaired dopamine transport function (Sharma and Taliyan, 2018), and MPTP-modeled mice show impaired insulin signaling in the substantia nigra (Bousquet et al., 2012; Kao et al., 2019), with diabetes and PD sharing common pathway damage (Labandeira et al., 2022). Furthermore, mice fed high-fat diets to induce insulin signaling impairment and diabetic mice showed increased sensitivity to 6-OHDA and MPTP, leading to significantly increased nigrostriatal degeneration and reduced dopaminergic signaling (Labandeira et al., 2022; Morris et al., 2010; Morris et al., 2011a; Morris et al., 2011b; Wang et al., 2014). In fact, the insulin signaling pathway balances normal dopaminergic neuron function, with mTOR being the main downstream substrate of the IRS-1/AKT pathway. In PD patients and animal models, blockage of this pathway leads to reduced autophagy function and α-syn aggregation (Heras-Sandoval et al., 2014). Using the mTORC1 inhibitor rapamycin can reduce α-syn aggregation in PD animal models (Stoica et al., 2011). Experimental model results indicate that inhibiting AKT signal transduction leads to dopaminergic cell death (Xu et al., 2014). We found that higher eGDR levels are associated with lower PD probability, with the highest quartile showing significantly reduced risk compared to the lowest quartile. This finding suggests that better insulin sensitivity may have a protective effect against PD. This association is consistent with previous studies indicating that insulin resistance and related metabolic dysfunction may lead to neurodegeneration.
Considering the above evidence, these signs reveal that IR participates in PD’s pathogenesis process, or IR serves as a susceptible background for PD, with IR’s role in neurodegeneration acting not only as a contributing factor to disease onset but also as a modifier of motor and non-motor symptoms. We observed a complex M-shaped non-linear relationship between eGDR and PD risk. This new finding suggests that the relationship between insulin sensitivity and Parkinson’s disease is more complex than previously thought. The observed pattern may reflect different pathophysiological mechanisms operating at different levels of insulin sensitivity. In PD patients, higher eGDR levels are associated with better survival outcomes, showing an inverted U-shaped relationship with mortality risk. This finding extends previous research on diabetes and PD progression. The observed relationship suggests an optimal range of insulin sensitivity for PD patient survival, with both very low and very high levels potentially associated with poorer outcomes. This pattern may reflect complex interactions between metabolism, aging, and neurodegeneration.
In our study, we adjusted for several potential confounding variables, including age, gender, BMI, and comorbidities such as diabetes, stroke, and coronary heart disease, to better isolate the association between eGDR and PD risk. Age is a known risk factor for PD, and obesity, measured by BMI, is linked to insulin resistance and PD risk. By adjusting for these factors, we were able to demonstrate that the association between eGDR and PD risk remained significant, suggesting that eGDR may be an independent risk factor for PD. However, we did not directly measure genetic predisposition in this study, and we acknowledge that it may play a role in the development of PD and its association with metabolic factors. Future studies should aim to include genetic data to better understand the complex interplay between genetics, metabolism, and PD risk.
4.3 Strengths and limitations
The strengths of our study include its large, nationally representative sample, comprehensive adjustment for potential confounders, and the novel investigation of both cross-sectional and longitudinal relationships between eGDR and PD. The use of restricted cubic spline analysis allowed us to detect important non-linear relationships that might have been missed using traditional analytical approaches. However, several limitations should be considered when interpreting our results. First, the cross-sectional nature of the primary analysis limits our ability to establish causality between eGDR and PD risk. Second, PD cases were identified through medication use, which might have led to misclassification of some cases. Third, in our study, we identified age, gender, diabetes, and stroke as significant factors associated with PD risk in univariate analyses. Despite adjusting for these factors in our multivariate models, eGDR remained significantly associated with PD, highlighting its potential as an independent risk factor. Additionally, stratified analyses revealed no significant interactions between these factors and eGDR, further supporting its independent association. However, we acknowledge that residual confounding or the influence of unmeasured variables cannot be entirely ruled out. For instance, lifestyle factors such as diet, physical activity, and socioeconomic status, which were not fully captured in our analysis, could independently influence both insulin resistance and PD risk. Additionally, genetic factors and inflammatory markers, which were not assessed in this study, may also play a role in the observed association. Future research should aim to incorporate these factors to provide a more nuanced understanding of the relationship between eGDR and PD. While our findings suggest that eGDR is an independent risk factor for PD, further investigation is needed to elucidate the potential influence of residual confounders and unmeasured variables. Fourth, the formula for eGDR was originally developed in type 1 diabetes patients, and its validity in the general population requires further validation.
4.4 Clinical implications
In clinical practice, the significant associations between eGDR and both PD risk and all-cause mortality highlight its potential utility as a biomarker and risk stratification tool. For example, eGDR could be incorporated into existing PD screening protocols to identify individuals at higher risk of developing PD. Clinicians could use eGDR to prioritize patients for more frequent monitoring or early interventions, such as lifestyle modifications (e.g., dietary changes, increased physical activity) or targeted therapies aimed at improving insulin sensitivity. Additionally, eGDR could be used to tailor prevention strategies or treatment plans based on an individual’s glucose metabolism status. For instance, patients with low eGDR values might benefit from interventions to improve insulin resistance, which could potentially reduce their risk of PD progression or all-cause mortality. Furthermore, eGDR could be included in risk assessment models to provide a more comprehensive evaluation of PD risk and inform clinical decision-making. Future studies should explore the feasibility and effectiveness of integrating eGDR into clinical practice to validate its role in PD risk prediction and management. Additionally, research is needed to understand the biological mechanisms underlying the observed associations, particularly the non-linear relationships identified in our analysis. While higher eGDR levels were associated with better survival outcomes in PD patients, it is unclear whether this reflects slower disease progression or simply lower mortality. Future longitudinal studies with detailed clinical assessments of PD progression are needed to determine whether eGDR affects the rate of PD progression. If eGDR is found to be associated with slower disease progression, this would make the findings more clinically meaningful and suggest that interventions targeting insulin sensitivity could potentially slow the progression of PD. In the meantime, the observed association between higher eGDR levels and lower mortality risk suggests that eGDR may be a useful marker for predicting outcomes in PD patients. Further research is needed to explore the underlying mechanisms and potential clinical applications of these findings.
5 Conclusion
In this large, nationally representative study, we found that higher eGDR levels were associated with lower PD risk and better survival among PD patients, suggesting a potential role for insulin sensitivity in PD pathogenesis and progression. The complex non-linear relationships observed between eGDR and both PD risk and mortality highlight the intricate nature of metabolic factors in neurodegenerative diseases. These findings suggest that maintaining metabolic health might be important in PD prevention and management, though further research is needed to confirm these associations and explore potential therapeutic implications.
Data availability statement
Publicly available datasets were analyzed in this study. This data can be found here: https://www.cdc.gov/nchs/nhanes/index.htm.
Ethics statement
The studies involving humans were approved by NCHS Research Ethics Review Board. The studies were conducted in accordance with the local legislation and institutional requirements. The participants provided their written informed consent to participate in this study.
Author contributions
XL: Formal Analysis, Validation, Writing – original draft. ZZ: Formal Analysis, Supervision, Validation, Visualization, Writing – review and editing.
Funding
The author(s) declare that no financial support was received for the research and/or publication of this article.
Acknowledgments
We thank the staff and the participants of the NHANES study for their valuable contributions.
Conflict of interest
The authors declare that the research was conducted in the absence of any commercial or financial relationships that could be construed as a potential conflict of interest.
Generative AI statement
The authors declare that no Generative AI was used in the creation of this manuscript.
Publisher’s note
All claims expressed in this article are solely those of the authors and do not necessarily represent those of their affiliated organizations, or those of the publisher, the editors and the reviewers. Any product that may be evaluated in this article, or claim that may be made by its manufacturer, is not guaranteed or endorsed by the publisher.
Abbreviations
AKT, protein kinase B; BMI, body mass index; CDC, Centers for Disease Control and Prevention; CI, confidence interval; eGDR, estimated glucose disposal rate; ERB, Ethics Review Board; GSK-3β, glycogen synthase kinase 3 beta; HbA1c, glycated hemoglobin A1c; HR, hazard ratio; ICD-10, International Classification of Diseases, 10th Revision; IR, insulin resistance; IRS-1, insulin receptor substrate 1; MPTP, 1-methyl-4-phenyl-1,2,3,6-tetrahydropyridine; mTOR, mammalian target of rapamycin; mTORC1, mammalian target of rapamycin complex 1; NCHS, National Center for Health Statistics; NHANES, National Health and Nutrition Examination Survey; OGTT, oral glucose tolerance test; OR, odds ratio; PD, Parkinson’s disease; T1, tertile 1; T2, tertile 2; T3, tertile 3; T2DM, type 2 diabetes mellitus; WC, waist circumference; 6-OHDA, 6-hydroxydopamine.
Footnotes
References
Abbott, R., Ross, G., White, L., Nelson, J., Masaki, K., Tanner, C., et al. (2002). Midlife adiposity and the future risk of Parkinson’s disease. Neurology 59, 1051–1057. doi: 10.1212/wnl.59.7.1051
American Diabetes Association. (2011). Diagnosis and classification of diabetes mellitus. Diabetes Care 34, S62–S69. doi: 10.2337/dc11-S062
Arnold, S., Arvanitakis, Z., Macauley-Rambach, S., Koenig, A., Wang, H., Ahima, R., et al. (2018). Brain insulin resistance in type 2 diabetes and Alzheimer disease: Concepts and conundrums. Nat. Rev. Neurol. 14, 168–181. doi: 10.1038/nrneurol.2017.185
Athauda, D., and Foltynie, T. (2016). Insulin resistance and Parkinson’s disease: A new target for disease modification. Prog. Neurobiol. 145-146, 98–120. doi: 10.1016/j.pneurobio.2016.10.001
Aune, D., Schlesinger, S., Mahamat-Saleh, Y., Zheng, B., Udeh-Momoh, C., and Middleton, L. (2023). Diabetes mellitus, prediabetes and the risk of Parkinson’s disease: A systematic review and meta-analysis of 15 cohort studies with 29.9 million participants and 86,345 cases. Eur. J. Epidemiol. 38, 591–604. doi: 10.1007/s10654-023-00970-0
Bohnen, N., Kotagal, V., Müller, M., Koeppe, R., Scott, P., Albin, R., et al. (2014). Diabetes mellitus is independently associated with more severe cognitive impairment in Parkinson disease. Parkinsonism Relat. Disord. 20, 1394–1398. doi: 10.1016/j.parkreldis.2014.10.008
Bosco, D., Plastino, M., Cristiano, D., Colica, C., Ermio, C., De Bartolo, M., et al. (2012). Dementia is associated with insulin resistance in patients with Parkinson’s disease. J. Neurol. Sci. 315, 39–43. doi: 10.1016/j.jns.2011.12.008
Bousquet, M., St-Amour, I., Vandal, M., Julien, P., Cicchetti, F., and Calon, F. (2012). High-fat diet exacerbates MPTP-induced dopaminergic degeneration in mice. Neurobiol. Dis. 45, 529–538. doi: 10.1016/j.nbd.2011.09.009
Camandola, S., and Mattson, M. (2017). Brain metabolism in health, aging, and neurodegeneration. EMBO J. 36, 1474–1492. doi: 10.15252/embj.201695810
Cereda, E., Barichella, M., Cassani, E., Caccialanza, R., and Pezzoli, G. (2012). Clinical features of Parkinson disease when onset of diabetes came first: A case-control study. Neurology 78, 1507–1511. doi: 10.1212/WNL.0b013e3182553cc9
Cereda, E., Barichella, M., Pedrolli, C., Klersy, C., Cassani, E., Caccialanza, R., et al. (2011). Diabetes and risk of Parkinson’s disease: A systematic review and meta-analysis. Diabetes Care 34, 2614–2623. doi: 10.2337/dc11-1584
Cheong, J., de Pablo-Fernandez, E., Foltynie, T., and Noyce, A. (2020). The association between Type 2 diabetes mellitus and Parkinson’s disease. J. Parkinsons Dis. 10, 775–789. doi: 10.3233/JPD-191900
Chohan, H., Senkevich, K., Patel, R., Bestwick, J., Jacobs, B., Bandres Ciga, S., et al. (2021). Type 2 diabetes as a determinant of Parkinson’s disease risk and progression. Mov. Disord. 36, 1420–1429. doi: 10.1002/mds.28551
Dai, C., Tan, C., Zhao, L., Liang, Y., Liu, G., Liu, H., et al. (2023). Glucose metabolism impairment in Parkinson’s disease. Brain Res. Bull. 199:110672. doi: 10.1016/j.brainresbull.2023.110672
Demir, S., Nawroth, P., Herzig, S., and Ekim Üstünel, B. (2021). Emerging targets in type 2 diabetes and diabetic complications. Adv. Sci. 8:e2100275. doi: 10.1002/advs.202100275
Epstein, E., Osman, J., Cohen, H., Rajpathak, S., Lewis, O., and Crandall, J. (2013). Use of the estimated glucose disposal rate as a measure of insulin resistance in an urban multiethnic population with type 1 diabetes. Diabetes Care 36, 2280–2285. doi: 10.2337/dc12-1693
Giuntini, M., Baldacci, F., Del Prete, E., Bonuccelli, U., and Ceravolo, R. (2014). Diabetes is associated with postural and cognitive domains in Parkinson’s disease. Results from a single-center study. Parkinsonism Relat. Disord. 20, 671–672. doi: 10.1016/j.parkreldis.2014.02.016
Guo, R., Tong, J., Cao, Y., and Zhao, W. (2024). Association between estimated glucose disposal rate and cardiovascular mortality across the spectrum of glucose tolerance in the US population. Diabetes Obes. Metab. 26, 5827–5835. doi: 10.1111/dom.15954
He, H., Xie, Y., Chen, Q., Li, Y., Li, X., Mu, Y., et al. (2024). The additive effect of the triglyceride-glucose index and estimated glucose disposal rate on long-term mortality among individuals with and without diabetes: A population-based study. Cardiovasc. Diabetol. 23:307. doi: 10.1186/s12933-024-02396-8
Heras-Sandoval, D., Pérez-Rojas, J., Hernández-Damián, J., and Pedraza-Chaverri, J. (2014). The role of PI3K/AKT/mTOR pathway in the modulation of autophagy and the clearance of protein aggregates in neurodegeneration. Cell. Signal. 26, 2694–2701. doi: 10.1016/j.cellsig.2014.08.019
Hernandez-Baltazar, D., Mendoza-Garrido, M., and Martinez-Fong, D. (2013). Activation of GSK-3β and caspase-3 occurs in Nigral dopamine neurons during the development of apoptosis activated by a striatal injection of 6-hydroxydopamine. PLoS One 8:e70951. doi: 10.1371/journal.pone.0070951
Hilker, R., Schweitzer, K., Coburger, S., Ghaemi, M., Weisenbach, S., Jacobs, A., et al. (2005). Nonlinear progression of Parkinson disease as determined by serial positron emission tomographic imaging of striatal fluorodopa F 18 activity. Arch. Neurol. 62, 378–382. doi: 10.1001/archneur.62.3.378
Himsworth, H. (2011). Diabetes mellitus: Its differentiation into insulin-sensitive and insulin-insensitive types. Diabet. Med. 28, 1440–1444. doi: 10.1111/j.1464-5491.2011.3508.x
Hölscher, C. (2020). Brain insulin resistance: Role in neurodegenerative disease and potential for targeting. Expert Opin. Investig. Drugs 29, 333–348. doi: 10.1080/13543784.2020.1738383
Jeong, S., Han, K., Kim, D., Rhee, S., Jang, W., and Shin, D. (2020). Body mass index, diabetes, and the risk of Parkinson’s disease. Mov. Disord. 35, 236–244. doi: 10.1002/mds.27922
Kahn, S., Hull, R., and Utzschneider, K. (2006). Mechanisms linking obesity to insulin resistance and type 2 diabetes. Nature 444, 840–846. doi: 10.1038/nature05482
Kao, Y., Wei, W., Tsai, K., and Wang, L. (2019). High fat diet suppresses peroxisome proliferator-activated receptors and reduces dopaminergic neurons in the substantia nigra. Int. J. Mol. Sci. 21:207. doi: 10.3390/ijms21010207
Kellar, D., and Craft, S. (2020). Brain insulin resistance in Alzheimer’s disease and related disorders: Mechanisms and therapeutic approaches. Lancet Neurol. 19, 758–766. doi: 10.1016/S1474-4422(20)30231-3
Kotagal, V., Albin, R., Müller, M., Koeppe, R., Frey, K., and Bohnen, N. (2013). Diabetes is associated with postural instability and gait difficulty in Parkinson disease. Parkinsonism Relat. Disord. 19, 522–526. doi: 10.1016/j.parkreldis.2013.01.016
Kullmann, S., Heni, M., Hallschmid, M., Fritsche, A., Preissl, H., and Häring, H. (2016). Brain insulin resistance at the crossroads of metabolic and cognitive disorders in humans. Physiol. Rev. 96, 1169–1209. doi: 10.1152/physrev.00032.2015
Kwak, S., Park, K., Lee, K., and Lee, H. (2010). Mitochondrial metabolism and diabetes. J. Diabetes Investig. 1, 161–169. doi: 10.1111/j.2040-1124.2010.00047.x
Labandeira, C., Fraga-Bau, A., Arias Ron, D., Alvarez-Rodriguez, E., Vicente-Alba, P., Lago-Garma, J., et al. (2022). Parkinson’s disease and diabetes mellitus: Common mechanisms and treatment repurposing. Neural Regen. Res. 17, 1652–1658. doi: 10.4103/1673-5374.332122
Liu, L., Shen, Q., Bao, Y., Xu, F., Zhang, D., Huang, H., et al. (2023). Association between dietary intake and risk of Parkinson’s disease: Cross-sectional analysis of survey data from NHANES 2007-2016. Front. Nutr. 10:1278128. doi: 10.3389/fnut.2023.1278128
Maciotta, S., Meregalli, M., and Torrente, Y. (2013). The involvement of microRNAs in neurodegenerative diseases. Front. Cell. Neurosci. 7:265. doi: 10.3389/fncel.2013.00265
Malagelada, C., Jin, Z., and Greene, L. (2008). RTP801 is induced in Parkinson’s disease and mediates neuron death by inhibiting Akt phosphorylation/activation. J. Neurosci. 28, 14363–14371. doi: 10.1523/JNEUROSCI.3928-08.2008
Mohamed Ibrahim, N., Ramli, R., Koya Kutty, S., and Shah, S. (2018). Earlier onset of motor complications in Parkinson’s patients with comorbid diabetes mellitus. Mov. Disord. 33, 1967–1968. doi: 10.1002/mds.27526
Moroo, I., Yamada, T., Makino, H., Tooyama, I., McGeer, P., McGeer, E., et al. (1994). Loss of insulin receptor immunoreactivity from the substantia nigra pars compacta neurons in Parkinson’s disease. Acta Neuropathol. 87, 343–348. doi: 10.1007/BF00313602
Morris, J., Bomhoff, G., Gorres, B., Davis, V., Kim, J., Lee, P., et al. (2011a). Insulin resistance impairs nigrostriatal dopamine function. Exp. Neurol. 231, 171–180. doi: 10.1016/j.expneurol.2011.06.005
Morris, J., Bomhoff, G., Stanford, J., and Geiger, P. (2010). Neurodegeneration in an animal model of Parkinson’s disease is exacerbated by a high-fat diet. Am. J. Physiol. Regul. Integr. Comp. Physiol. 299, R1082–R1090. doi: 10.1152/ajpregu.00449.2010
Morris, J., Seim, N., Bomhoff, G., Geiger, P., and Stanford, J. (2011b). Effects of unilateral nigrostriatal dopamine depletion on peripheral glucose tolerance and insulin signaling in middle aged rats. Neurosci. Lett. 504, 219–222. doi: 10.1016/j.neulet.2011.09.027
Palacios, N., Gao, X., McCullough, M., Jacobs, E., Patel, A., Mayo, T., et al. (2011). Obesity, diabetes, and risk of Parkinson’s disease. Mov. Disord. 26, 2253–2259. doi: 10.1002/mds.23855
Park, K., Nam, G., Han, K., Park, H., and Hwang, H. (2022). Waist circumference and risk of Parkinson’s disease. NPJ Parkinsons Dis. 8:89. doi: 10.1038/s41531-022-00353-4
Peng, J., Zhang, Y., Zhu, Y., Chen, W., Chen, L., Ma, F., et al. (2024). Estimated glucose disposal rate for predicting cardiovascular events and mortality in patients with non-diabetic chronic kidney disease: A prospective cohort study. BMC Med. 22:411. doi: 10.1186/s12916-024-03582-x
Reeve, A., Simcox, E., and Turnbull, D. (2014). Ageing and Parkinson’s disease: Why is advancing age the biggest risk factor. Ageing Res. Rev. 14, 19–30. doi: 10.1016/j.arr.2014.01.004
Rhee, S., Han, K., Kwon, H., Park, S., Park, Y., Kim, Y., et al. (2020). Association between glycemic status and the risk of Parkinson disease: A nationwide population-based study. Diabetes Care 43, 2169–2175. doi: 10.2337/dc19-0760
Riso, L., Kaaks, R., Kühn, T., Sookthai, D., Forsgren, L., Trupp, M., et al. (2019). General and abdominal adiposity and the risk of Parkinson’s disease: A prospective cohort study. Parkinsonism Relat. Disord. 62, 98–104. doi: 10.1016/j.parkreldis.2019.01.019
Sánchez-Gómez, A., Díaz, Y., Duarte-Salles, T., Compta, Y., and Martí, M. (2021). Prediabetes, type 2 diabetes mellitus and risk of Parkinson’s disease: A population-based cohort study. Parkinsonism Relat. Disord. 89, 22–27. doi: 10.1016/j.parkreldis.2021.06.002
Sandyk, R. (1993). The relationship between diabetes mellitus and Parkinson’s disease. Int J. Neurosci. 69, 125–130. doi: 10.3109/00207459309003322
Selvakumar, G., Ahmed, M., Thangavel, R., Kempuraj, D., Dubova, I., Raikwar, S., et al. (2020). A role for glia maturation factor dependent activation of mast cells and microglia in MPTP induced dopamine loss and behavioural deficits in mice. Brain Behav. Immun. 87, 429–443. doi: 10.1016/j.bbi.2020.01.013
Sharma, S., and Taliyan, R. (2018). High fat diet feeding induced insulin resistance exacerbates 6-OHDA mediated neurotoxicity and behavioral abnormalities in rats. Behav. Brain Res. 351, 17–23. doi: 10.1016/j.bbr.2018.05.025
Shtilbans, A., and Henchcliffe, C. (2012). Biomarkers in Parkinson’s disease: An update. Curr. Opin. Neurol. 25, 460–465. doi: 10.1097/WCO.0b013e3283550c0d
Simon, K., Chen, H., Schwarzschild, M., and Ascherio, A. (2007). Hypertension, hypercholesterolemia, diabetes, and risk of Parkinson disease. Neurology 69, 1688–1695. doi: 10.1212/01.wnl.0000271883.45010.8a
Stoica, L., Zhu, P., Huang, W., Zhou, H., Kozma, S., and Costa-Mattioli, M. (2011). Selective pharmacogenetic inhibition of mammalian target of Rapamycin complex I (mTORC1) blocks long-term synaptic plasticity and memory storage. Proc. Natl. Acad. Sci. U S A. 108, 3791–3796. doi: 10.1073/pnas.1014715108
Takahashi, M., Yamada, T., Tooyama, I., Moroo, I., Kimura, H., Yamamoto, T., et al. (1996). Insulin receptor mRNA in the substantia nigra in Parkinson’s disease. Neurosci. Lett. 204, 201–204. doi: 10.1016/0304-3940(96)12357-0
Wang, L., Zhai, Y., Xu, L., Qiao, C., Sun, X., Ding, J., et al. (2014). Metabolic inflammation exacerbates dopaminergic neuronal degeneration in response to acute MPTP challenge in type 2 diabetes mice. Exp. Neurol. 251, 22–29. doi: 10.1016/j.expneurol.2013.11.001
Williams, K., Erbey, J., Becker, D., Arslanian, S., and Orchard, T. (2000). Can clinical factors estimate insulin resistance in type 1 diabetes. Diabetes 49, 626–632. doi: 10.2337/diabetes.49.4.626
Xu, Q., Park, Y., Huang, X., Hollenbeck, A., Blair, A., Schatzkin, A., et al. (2011). Diabetes and risk of Parkinson’s disease. Diabetes Care 34, 910–915. doi: 10.2337/dc10-1922
Xu, Y., Liu, C., Chen, S., Ye, Y., Guo, M., Ren, Q., et al. (2014). Activation of AMPK and inactivation of Akt result in suppression of mTOR-mediated S6K1 and 4E-BP1 pathways leading to neuronal cell death in in vitro models of Parkinson’s disease. Cell. Signal. 26, 1680–1689. doi: 10.1016/j.cellsig.2014.04.009
Ye, H., Robak, L., Yu, M., Cykowski, M., and Shulman, J. (2023). Genetics and pathogenesis of Parkinson’s syndrome. Annu. Rev. Pathol. 18, 95–121. doi: 10.1146/annurev-pathmechdis-031521-034145
Yue, X., Li, H., Yan, H., Zhang, P., Chang, L., and Li, T. (2016). Risk of Parkinson disease in diabetes mellitus: An updated meta-analysis of population-based cohort studies. Medicine 95:e3549. doi: 10.1097/MD.0000000000003549
Zeng, Z., Cen, Y., Wang, L., and Luo, X. (2023). Association between dietary inflammatory index and Parkinson’s disease from National Health and Nutrition Examination Survey (2003-2018): A cross-sectional study. Front. Neurosci. 17:1203979. doi: 10.3389/fnins.2023.1203979
Zeng, Z., Cen, Y., Xiong, L., Hong, G., Luo, Y., and Luo, X. (2024). Dietary copper intake and risk of Parkinson’s disease: A cross-sectional study. Biol. Trace Elem. Res. 202, 955–964. doi: 10.1007/s12011-023-03750-9
Keywords: Parkinson’s disease, estimated glucose disposal rate, insulin resistance, NHANES, all-cause mortality
Citation: Li X and Zeng Z (2025) Exploring the link between estimated glucose disposal rate and Parkinson’s disease: cross-sectional and mortality analysis of NHANES 2003–2016. Front. Aging Neurosci. 17:1548020. doi: 10.3389/fnagi.2025.1548020
Received: 19 December 2024; Accepted: 14 March 2025;
Published: 04 April 2025.
Edited by:
Robert Petersen, Central Michigan University, United StatesReviewed by:
Arun Kumar Yadawa, Texas A&M University, United StatesArshiya Parveen, Houston Methodist Research Institute, United States
Copyright © 2025 Li and Zeng. This is an open-access article distributed under the terms of the Creative Commons Attribution License (CC BY). The use, distribution or reproduction in other forums is permitted, provided the original author(s) and the copyright owner(s) are credited and that the original publication in this journal is cited, in accordance with accepted academic practice. No use, distribution or reproduction is permitted which does not comply with these terms.
*Correspondence: Zhaohao Zeng, enpoX2JyaWFuQHllYWgubmV0