 Olivier Heller1
 Delwendé I. Kiba2,3,4
 Kalifa Wend-Doléa Zida4Kim Schneider5
 Hgazat Kouassi Valérie Kouame6
 Ouakoltio Y. A. Traoré3
 Michael Siegrist7
 Emmanuel Frossard2*
- 1Group for Soil Quality and Soil Use, Agroscope, Zürich, Switzerland
- 2Group for Plant Nutrition, ETH Zürich, Lindau, Switzerland
- 3Institut de l'Environnement et de Recherches Agricoles, Ouagadougou, Burkina Faso
- 4Ministère de l'Agriculture, des Ressources Animales et Halieutiques, Ouagadougou, Burkina Faso
- 5Antenna Foundation, Géneve, Switzerland
- 6Centre Suisse de Recherche Scientifique en Côte d'Ivoire, Abidjan, Côte d'Ivoire
- 7Group for Consumer Behavior, ETH Zürich, Zürich, Switzerland
Yam (Discorea spp.) is a staple food crop in Africa that requires fertile soils and an annual rainfall of about 1,500 mm. However, in the semi-arid North-West of Burkina Faso, farmers produce yam in continuous rotation on degraded soils with annual rainfall of 610–960 mm. Understanding this local know-how can help improve yam cultivation in other regions and cropping systems in Africa. This study evaluated the productivity of this yam farming system in an interdisciplinary manner involving agronomic and economic analyses. We studied the cropping practices and socio-economic conditions of 67 households in 12 villages. We questioned farmers about their yam management schedule and inputs and we measured the yam fresh tuber yields in their fields. We sampled soils, manure and yam tubers for chemical analyses. Then, we calculated soil surface nutrient balances for N, P, and K. We found that the cropping system was characterized by densely planted ridges and relatively small size of harvested tubers. The farmers coped with degrading soils and increasing market demand by applying in average 16.2 t ha−1 of manure. About 31% of the farmers applied an average of 435 kg ha−1 of NPK fertilizer and another 24% applied an average of 300 kg ha−1 of urea. The average yam yield was 16.2 t ha−1, well above the West African average yield of 10.7 t ha−1.The yam had high value (0.59 USD kg−1) at relatively low production expenditure (0.04 USD kg−1), providing farmers the opportunity to increase and diversify incomes. Our results suggest that the development of this intensified yam production may be limited by farmer's low purchasing power of yam seed tubers, fertilizers and labor.
Introduction
Yam (Discorea spp.) is an important staple tuber crop for about 155 million people in the tropics (Cornet et al., 2014; Frossard et al., 2017). Besides being a staple food crop, yam is a source of income for rural communities, has medicinal uses and cultural value (Frossard et al., 2017; Lebot, 2020). The yam production in Western Africa increased from 10.1 Mt in 1986 to 69.0 Mt in 2019 (FAOSTAT, 2020). An increase of the cropped surface from 1.5 million to 8.2 million ha for the same period was recorded. Since 2000, yam yields are stagnating at 10.7 t ha−1, far below the potential yield of 50 t ha−1 achieved in optimal growing conditions (Diby et al., 2011) and well below realistic on-farm yield expectancies of 20–25 t ha−1. The reasons for stagnating yam yields are manifold. The high soil fertility requirement of yam is often not met (Diby et al., 2009; Kassi et al., 2017). Successful yam production requires a soil organic carbon content of about 12–15 gC/kg (Carsky et al., 2010) and rainfall of about 1,500 mm distributed throughout 180–210 days growing season (Sonder et al., 2010; Lebot, 2020). Other reasons for low yam yields are the application of inappropriate cropping practices like the use of poor quality seed tubers, low planting density, lack of fertilization or inappropriate rate of fertilization (Ekanayake and Asiedu, 2003; Abdoulaye et al., 2015; Kiba et al., 2020). In addition, there are considerable gaps in the availability of organic amendments, market information, and low commitment of policy makers in the yam sector. Discussions with yam farmers in Burkina Faso and Côte d'Ivoire highlighted that the most important bottlenecks to yam production are the land scarcity, followed by declining soil fertility and low and erratic rainfall (Kiba et al., 2020). Furthermore, climate change may cause yam yield reduction of up to 48% by 2050 due to the combined effects of water stress and drought-induced low nitrogen mineralization and availability (Srivastava et al., 2012). Existing yam cropping practices that cope with declining soil fertility and low rainfall can provide valuable lessons for improving the productivity and sustainability of yam systems. Such yam cropping practices that work under constraining environmental conditions can be found for example in Benin (Dumont, 1977), in Cameroon (Dumont et al., 1994) and in Burkina Faso (Dumont and Hamon, 1985; Tiama et al., 2016a,b).
To our knowledge, Dumont and Hamon (1985) were the first to report on the yam cropping system in the constraining environmental conditions of Passoré, a Province in the North-West of Burkina Faso. They reported that farmers grow a local yam morphotype on hydromorphic soils to cope with low precipitation rates. Later, yam production in Passoré was studied by Tiama et al. (2016b), who characterized the morphology of imported yam morphotypes Boussa (D. rotundata) and Waogo (D. alata), as well as local yams called Nyù (D. abyssinica, D. lecardii, D. sagittifolia and/or D. semperflorens). The highest yields of 40 t ha−1 were achieved for the imported morphotype Boussa while the local morphotype yielded 25 t ha−1. In another study, Tiama et al. (2016a) stated that in Passoré, yam is grown by a small group of elderly farmers and is well appreciated by consumers. The study also reported that farmers use farmyard manure (FYM) and mineral fertilizers (MIN), namely a complex NPK and Urea.
Although studies were conducted on yam cultivation under constraining environmental conditions, they did not thoroughly describe the soil properties, the soil fertility management practices and the resulting nutrient balances. In addition, these studies rarely incorporated agronomic and socio-economic investigations in order to understand farmers' decisions and to assess the social and economic impact of these particular yam cropping practices. In this study, we use an interdisciplinary approach to understand how farmers in Passoré are able to produce yam despite unfavorable environmental conditions, and to what extent their practices affect yam yields, nutrient balances and income. We hypothesized, that (1) there are differences in farmers' practices, particularly with regard to fertilization rates and types, due to income variability; (2) whatever the cropping practice, farmers are able to make their investments profitable; (3) yam fresh tuber yields and nutrient balances are determined by the type and rate of fertilization and finally (4) there are possibilities for improved cropping practices.
Materials and Methods
Study Area
The climate in Passoré is hot and semi-arid with an unimodal rainy season from June to September (Climate-data, 2019). Annual potential evapotranspiration is ranged between 2,550 and 2,700 mm (Trabucco and Zomer, 2019). The rainfall patterns have high temporal and spatial variability leading to years with severe droughts that limit agricultural production (Nicholson, 2013). During the study season of 2017 rainfall was 682 mm in 42 days, a value below the annual average of 775 mm recorded between 2007 and 2016 (MAAH, 2019). Rains were heavier in 2017 early in the season, but became more erratic and ended earlier than other years (AGRHYMET, 2018). Plateaus areas are dominated by red soils with exposed petroplintic horizons and shallow soils over petroplintic horizons. In the low lands, deep, occasionally hydromorphic soils are found (Sib and Sinkondo, 2002). The population of Passoré practices mainly rain fed cereal production. Some households raise livestock for sale, or grow vegetables on irrigated fields. In addition to agriculture, the population derives revenue from handicrafts, seasonal labor migration, trade, and artisanal gold mining. Due to the food deficit in Passoré, many people have to rely on buying food to supplement their dietary needs. In years with low precipitation, agricultural production decreases and food prices increase. As a result, a significant portion of the population depend on food aid (Hien et al., 2012). Livelihoods are further endangered by the increasing insecurity in the Sahel, spilling over into neighboring Passorés regions (Eizenga, 2019).
Participant Selection
Participants were selected through a four-step process. First, we explained to the development council in each village the objectives of the study and expressed the need to work with yam farmers. Second, the development council in each village held a meeting with its yam farmers to explain the objectives of the study. Third, we met with interested yam farmers after their discussions with their development councils. Finally, the fourth step was to select volunteers from among interested farmers who met the study criteria and were willing to collaborate until the end of the work. The process resulted in working with 67 yam farmers who are also heads of household (HH) in 12 villages (Figure 1). We considered a household to be a group of people living on the same farm and sharing common resources (Hien et al., 2012). Participants ranged in age from 27 to 80 years, with an average age of 52.6 years, and only 5 participants were literate.
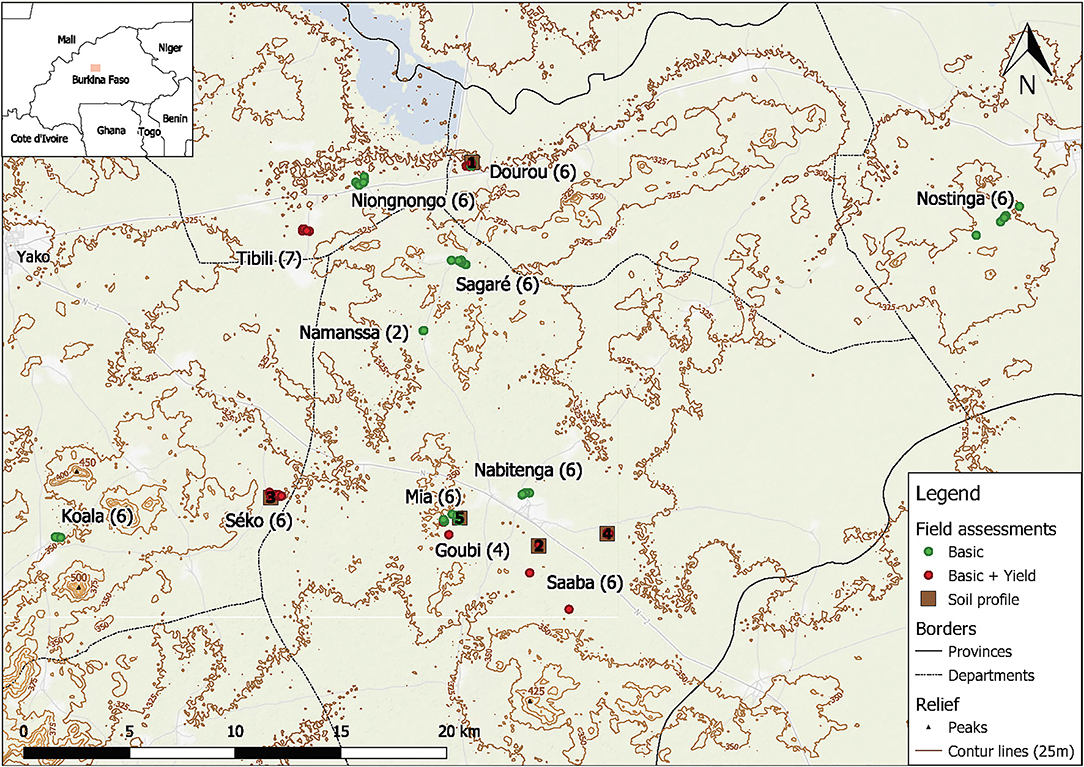
Figure 1. The map of the study area depicts the location of the 67 yam fields and the 5 soil profiles. The villages and the numbers of participants per village are noted on the map.
Household Survey and Categorization
We held three workshops with the 67 selected farmers to discuss and collect information about their HH, farming activities, and yam production. The meetings were short and concise and we used the local language (Mooré), then translated the results into French for documentation. This approach allowed for friendly discussions with the farmers. The workshops and field visits took place from February to December 2017. Survey questions and materials are available in Supplementary Material 1.
During the workshops, participants were asked about their HH and farm conditions, such as number of people per age group, area cultivated, type and area of crops, livestock, types and amount of income and expenses. We used Wilde and SEAGA's (2001) marble method to facilitate responses to questions that elicited estimates of quantities in numbers and percentages. For example, participants were asked to divide 20 marbles according to the relative importance of different HH expenditures.
The HH were divided into three socio-economic groups (SEG), namely poor, middle and better-off as described by the FEWSNET-report on livelihoods in Passoré by Hien et al. (2012). Size of livestock holdings was chosen as an indicator for socio-economic status as rural communities often invest their economic surplus into this sector (Reardon et al., 1992; Silvestri et al., 2012). We calculated livestock units (LSU) per HH to compare different kind of livestock holdings. The LSU-factors per animal were 1.00 for cattle, horses or donkeys, 0.25 for sheep, 0.20 for goats, 0.17 for pigs and 0.01 for poultry (adapted from LBV, 1998). The thresholds for the middle and the better-off SEG were 8.47 and 21.04 LSU (Hien et al., 2012).
Farm Surveys and Calculations of Farming Expenditures
The participants were asked to provide information on inputs (e.g., seed-tubers, MIN, and FYM) and yam-related activities. Additionally, questions about the motivation to grow yam and the economics of yam production (e.g., expenditures, workload, and revenue) were asked. Cards with pictograms that reflect possible motivations were given to the participants and they were asked to choose a subset three cards and to sort the cards in order of relevance.
We considered a yam production expenditure relevant if the category was reported by at least four farmers. Expenditures were reported in West African CFA franc and converted into US Dollars (USD) by 2017s average exchange rate of 582 CFA per 1 USD (Exchange Rates, 2021).
The participants were invited to a group discussion about perceived changes in the environment as well as in yam production and marketing. During the discussion, the farmers answered open questions about reactions and adaptations to the perceived changes.
Sampling, Soil Characterization, and Yield Assessment
We conducted three visits on each farm. During these visits, we recorded yam field size, planting density, germination rate, date of tuber bulking, associated crops, staking, and pest and disease symptoms and weed abundance. The pest and disease symptoms were visually identified according to Reddy (2015). On each yam fields we established in a representative micro plot of 20 m2 (4 m * 5 m) where we recorded, plant densities and took composite soil samples made from 5 points at a depth of 0–30 cm. The soil samples were analyzed for pH (H2O), total carbon (Ctot) and nitrogen (Ntot), resin available phosphorus (Presin) and exchangeable potassium (Kexch). Details on the soil sampling, processing and analyses are described in the Supplementary Material 2.
Site-specific soil information was derived from a 1:100,000 soil map (Sib and Sinkondo, 2002) and five soil profiles description (Figure 1). The soil profiles were documented and classified according to WRB (2015). The soil profile descriptions are provided in the Supplementary Material 3.
We selected 25 micro plots from five villages (Tibli, Saaba, Seko, Goubi, Dourou) where the local yam morphotype (Nyù) was predominantly grown and where no crop was associated to yam. In addition, the willingness of the HH to cooperate and security risk (i.e., remoteness) was considered. The selected fields were made up of 14 poor, 5 middle and 6 better-off HH. On the 25 selected micro plots, we assessed the yam fresh tuber yields at the end of November 2017. The number of tubers and the average tuber weight were recorded, and yam tuber samples were taken for dry matter and nutrient content analyses. Furthermore, we took 13 FYM samples across all villages to estimate N, P, and K inputs. Details on the tuber and FYM sampling, processing and analyses are available in the Supplementary Material 2.
Nutrient Balance Calculation
We calculated 25 soil surface nutrient balances for N, P, and K as well as nutrient use efficiencies (NUE) based on the reported inputs, the achieved yields and the nutrient uptakes (FAO, 2003). Furthermore, nutrient inputs by seed tubers and atmospheric deposition by rain and Harmattan dust were estimated. Nutrient inputs from mulch were not considered, because mulching material was usually removed before complete mineralization at the end of the growing season. The soil surface nutrient balances were calculated for the i-th plot and j-th nutrient according to the following equations:
C: concentration; D: Harmattan dust; Dep.: Deposition; DMC: dry matter content; FYM: manure; M: mass per area; MIN: mineral fertilizer; NPK: complex fertilizer; NUE: nutrient use efficiency; PD: planting density; Rain: rainfall; ST: seed tuber; U: urea; H: harvest; W: mass per unit.
Plot specific data was available for planting densities (PDi), yield and tubers (CHi, MHi, DMCHi) as well as fertilizer rates (MFYMi, MUi, MNPKi). Other values, if not declared otherwise, were chosen based on the mean results of this study. The weight of seed tubers (WST) was assumed to be 85 g with a DMCST of 30%. The DMCFYM was 94%. The nutrient concentrations (C) of dry compounds (i.e., FYM, Harmattan dust and fertilizers) are provided in Table 4. The deposition rate of Harmattan dust (MD) was estimated to be 300 kg ha−1 and the nutrient input by rain water (CPrec(j)) was considered to be 4.9 g of N, 0.6 g of P, and 2.6 g of K per ha and mm of Rain (Lesschen et al., 2007). Rainfall was assumed to be 682 mm for all fields (MAAH, 2019). The mean nutrient concentrations of the mineral fertilizers known as NPK 17-17-17 and NPK 14-17-14+6S were calculated (Table 5) and used for the nutrient balance calculations as no detailed information on the applied NPK fertilizer was available.
Statistical Analysis
Statistical analyses, namely calculations of means (M), standard deviations (SD), standard errors (SE), t-tests, pairwise comparisons of means of grouped data as well as correlation and regression analyses, were performed with Stata 12 (StataCorp LLC, USA). The analyses applied to a specific subset of the data were mentioned alongside the results in the next section. We only discuss differences with a level of significance equal or lower than 5%.
Results
Characteristics of Yam Producing Households
The socio-economic data grouped by SEG are shown in Table 1. In total, 34 HH were qualified as poor, 19 as middle and 14 as better-off. Yam was the most important source of income for all HH, with an insignificant decrease of importance toward the more prosperous HH. In general, more prosperous HH had significantly higher income, more livestock and more arable land. Although statistically insignificant, more prosperous HH tended to have more members and more diversified sources of income.
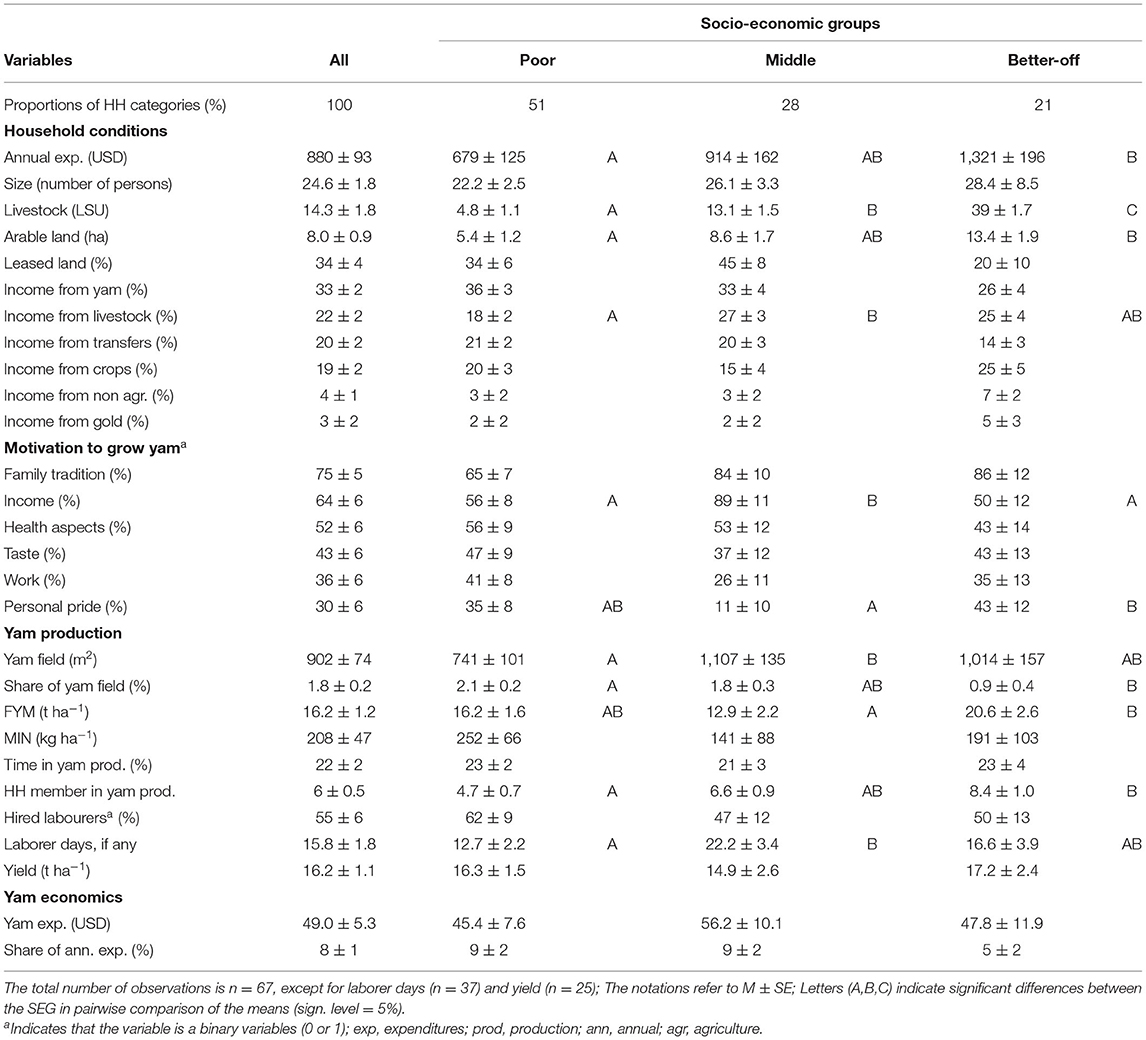
Table 1. Socio-economic and yam production variables by socio-economic groups.
Characteristics of Yam Producing Farms
Eleven farmers attested to have learned yam production from relatives. The average time in yam production was about 22 years. The motivations to produce yam were (in order of decreasing relevance): Family tradition, income generation, health aspects, the good taste of yam, the work connected to yam production, and the pride to be a yam producer (Table 1). HH in the middle SEG mentioned income generation significantly more often than other HH. Better-off farmers mentioned personal pride significantly more often than middle farmers did. The mean surface of yam field was 902 m2. The fields of poor households were significantly smaller with an average area of 741 m2 and accounted for a larger share of household arable land than the fields of the more prosperous SEGs whose fields averaged 1,014 m2. The large majority (50 participants) spent below 25% of their working time in the yam fields and only three participants spent more than 50% of their working time in the yam fields. Up to 20 HH members supported the participants in their yam-related work. Additionally, 55% of all HH hired laborers for tillage (52% of HH), ridging (31% of HH), planting (7% of HH), staking (10% of HH) and harvesting (2% of HH). Poor farmers had the lowest support of HH members and hired laborers more often than more prosperous HH. The mean workload (in days) outsourced to paid laborers was highest for the middle SEG (Table 1).
The participants attested that 29.2% of the produced tubers are used as seed tuber, 25.2% sold directly at the field, 24.5% consumed by the HH, 17% given away as gifts and 3.9% kept for other purposes, such as medicinal and ritual use.
The yam production expenditures were 0.003–0.141 USD kg−1 and averaged 0.040 USD kg−1. The mean expenses per cost category are displayed in Table 2. The most frequently mentioned expenditures were tools for field work, mainly Dabas (hoes, also used for tillage) of different sizes. The expenditures for yam production comprised in average 8% of the total expenditures of the HH (Table 1).

Table 2. Annual expenditures (USD) for yam production per hectare.
Soil Properties in Yam Fields
Farmers attested to select sites for yam cultivation based on soil color, infiltration capacity, moisture and absence of gravel on the surface. Darker soils were preferred to lighter ones. Furthermore, suitable soils should have a rooting depth of at least 0.5 m. However, yam fields were found on various soils along the catena (Figure 2A; Table 3) and not all soil profiles revealed a rooting depth of at least 0.5 m. In the low lands, fields were on eutric Gleysols and gleyic Cambisols with large rooting depth. On the plateaus, the fields were on petric and epipetric Plinthosols with shallow rooting depth (Table 3; Supplementary Material 3). The mean chemical properties of top soils were: pH: 5.7, Ctot: 7.4 g , Ntot: 0.6 g , Presin: 3.44 mg and Kexch: 163.4 mg . The Ctot tended to be lower in top soils of the low lands than in top soils of the plateaus (Figure 2A).
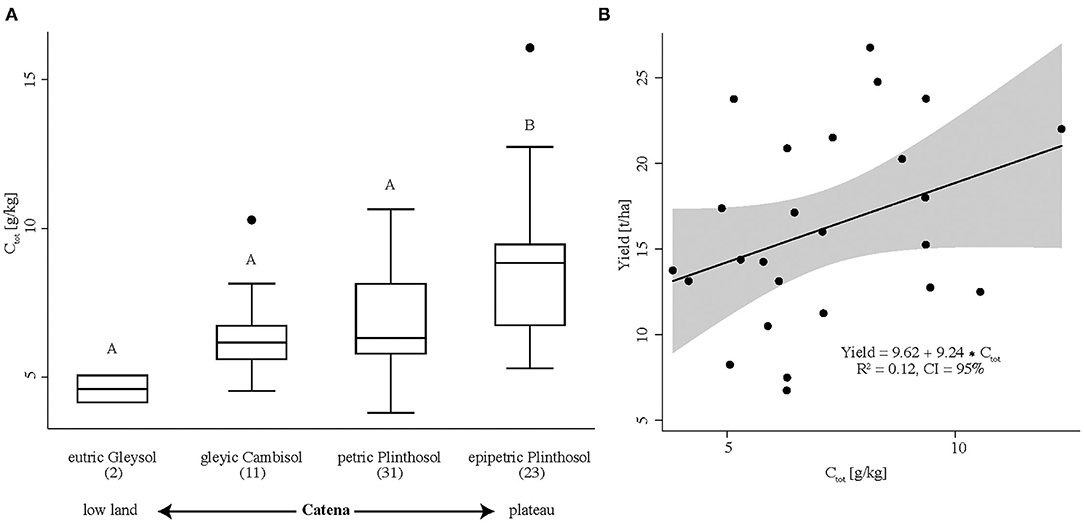
Figure 2. (A) Top soil (0–30 cm) carbon of yam fields grouped by soil type according to the soil map of Sib and Sinkondo (2002). The letters (A, B) indicate the Tukey groups of a pairwise comparison of the means (level of significance: 5%). (B) Yam yield vs. top soil (0–30 cm) organic carbon. The gray area indicates the 95% confidence interval of the linear regression.
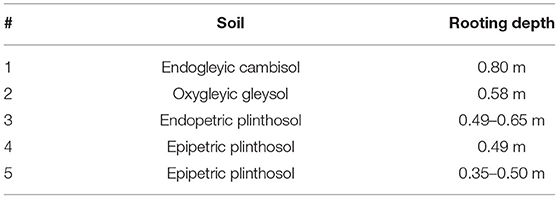
Table 3. Soil type and rooting depth of soil profiles.
Yam Cropping Practices
The management of the 67 yam fields was relatively similar. In the subsequent paragraph, we synthetize the phases recorded in the yam cropping calendar as depicted in Figure 3. The numbers (1–7) relate to those phases in yam cropping.
(1) The activities start after the harvest of the preceding crop [i.e., maize (Zea mays, 29 farmers), sorghum (Sorghum bicolor, 24 farmers), rice (Oryza sativa or O. glaberrima, 9 farmers), yam (3 farmers) and ground nut (Arachis hypogaea, 2 farmers), or sweet potato (Ipomoea batatas, 2 farmers)].
(2) The fields are tilled with large hand-held hoes (Dabas). All left-overs of the preceding crops are removed from the field and large soil aggregates are broken into smaller ones. Then, ridges of 0.3–0.5 m in height are made. The distance between two ridges ranges from 1 to 1.2 m.
(3) Tubers pieces of 70–100 g are placed within 20 cm from each other. Then, stems from maize or sorghum or dried grasses are applied as mulch. The planting density recorded in the studied fields was 32,500–57,500 tubers ha−1 and averaged 42,700 tubers ha−1. The cultivated yam morphotypes registered were the local Nyù (D. abyssinica, D. lecardii, D. sagittifolia and/or D. semperflorens, 67 farmers), Boussa (D. rotundata, 40 farmers), Waogo (D. alata, 18 farmers) and Rôguin (Discorea spp., 6 farmers).
(4) Wooden stakes of ~1.6 m are placed to support each yam vine separately when they start to emerge. We recorded 18 farmers who established associated crops between the ridges at the beginning of the rains. The associated crops were ground nut (12 farmers), fabirama (Plectranthus rotundifolius, 3 farmers), maize (2 farmers) and rice (1 farmer).
(5) Throughout the rainy season, weeds are removed about twice a month.
(6) The senescence of the yam leaves and the harvest of the associated crops begins after the rains.
(7) Yam harvest starts in November or later, depending on the season and the HH needs for income or food. Remaining mulch was removed and used off-site as animal feed. The ridges are dug from one side to remove the tubers horizontally and prevent the tubers from breaking.
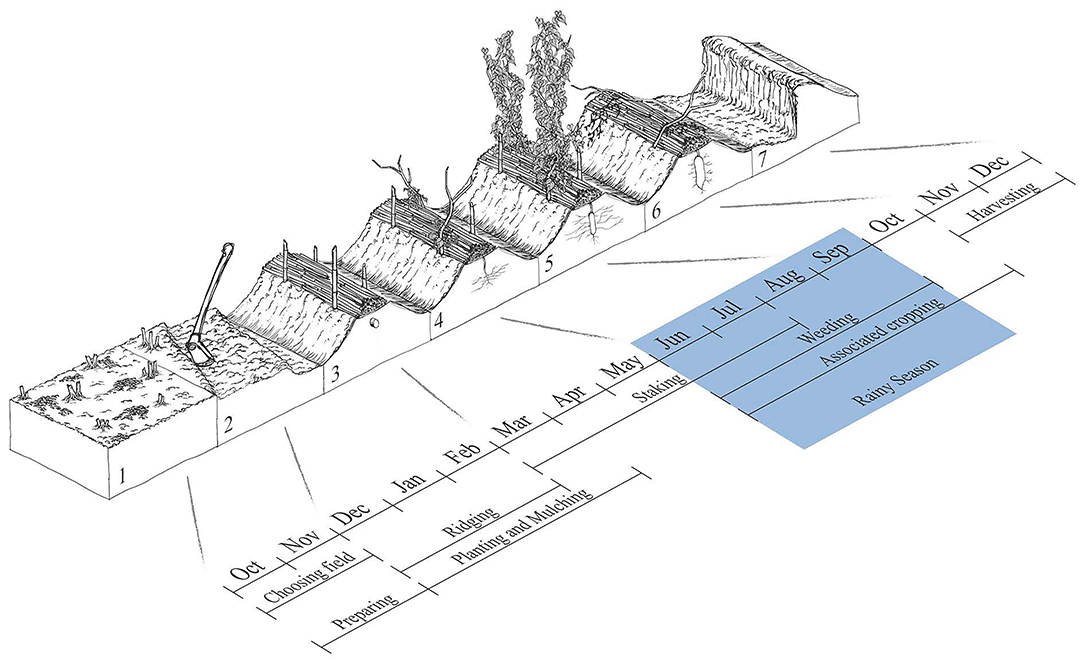
Figure 3. The yam management schedule depicts the state of the yam fields throughout the year and at what time of the year what tasks and activities are done.
Fertilizers are applied during ridging or planting (Table 4). All participants applied FYM, while a minority (21 farmers) applied MIN. We recorded an average of 16.2 t ha−1 FYM from cattle, sheep, goats or poultry applied in the center of the ridges. The 21 farmers added an average of 435 kg ha−1 NPK fertilizer (17-17-17 or 14-23-14+6S) during the planting of the yam. About 76% of farmers added an average of 300 kg ha−1 of urea (46%N) at tuber bulking in August. Better-off HH added more FYM per area (20.1 tha−1) than poor (16.2 tha−1) and middle HH (12.9 tha−1), but no significant difference in MIN fertilizer application was found between the SEG (Table 1). The FYM-application corresponds to an average input of 5.1 t C ha−1. However, there was no correlation found between fertilization and soil parameters: C input by FYM and Ctot (p-value: 0.38); fertilizer N input and Ntot (p-value: 0.15); fertilizer P input and Presin (p-value: 0.68); fertilizer K input and Kexch (p-value: 0.45).
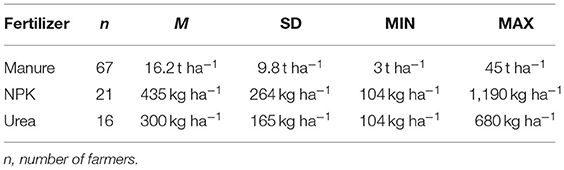
Table 4. Quantities of applied fertilizer as reported by famers.
Yam Yields and Tuber Quality
In the 25 micro plots, where yam tubers were harvested, we recorded a germination rate between 80 and 95%. The yields ranged from 6.75 to 26.8 t ha−1 and averaged 16.2 t ha−1. No significant correlation was observed between yam fresh tuber yields and soil Ctot (p-value: 0.08; Figure 2B). The 17 fields fertilized only with FYM had an average yield of 15.2 t ha−1, while the eight fields with additional MIN fertilization yielded in average 18.4 t ha−1. However, the yield difference between the fertilization practices (FYM vs. FYM+MIN) was not significant as the p-value of the one–sided t-test with unequal variance within the groups was 0.094 [t(16.1) = −1.44]. Most plants produced only one tuber, except for a few plants that produced multiple small tubers. The tuber weights ranged from 40 to 1,790 g with a field average of 450 g per tuber and 34,440 ha−1 of harvested tubers. Correlation analysis revealed a positive correlation between yield and number of tubers ha−1 (p-value: 0.002).
The average nutrient concentrations of the tubers are reported in Table 5. Correlation between soil available nutrient and the tuber nutrient concentration was only weakly significant for K (p-value: 0.07). For N (p-value: 0.48) and P (p-value: 0.19) there was no correlation.
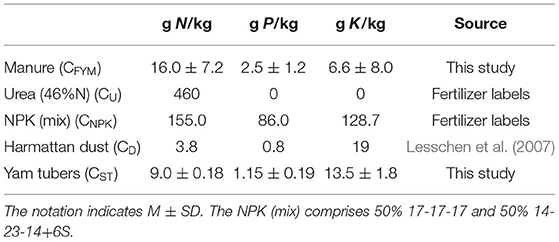
Table 5. Elemental concentrations of tubers and inputs.
In 25 of 67 fields, symptoms of anthracnose were observed. Symptoms of neck rot (4 cases), leaf spots (4 cases) and unspecified viral infections, probably caused by yam mosaic virus (4 cases) were also observed. When asked about the reasons of plant losses between planting and harvest, 96% of farmers named damage by stray animals, 42% drought, 22% termites, 8% diseases and 6% poor seed tuber quality.
Lastly, no correlations were observed between yam yields and management dependent factors, such as weed abundance, staking height, mulch type and mulch quantity.
Change Perception by Yam Farmers
During the workshops, farmers in all 12 villages reported that they had observed a decline in soil fertility in their lifetime. Furthermore, farmers in 2 villages mentioned that soils became lighter in color. The soil fertility decline was attributed to more severe droughts (8 villages), reduced vegetation coverage (4 villages), lack of fallows (3 villages), soil erosion by wind (1 village), and increased population (1 village).
Farmers in all villages applied FYM to increase soil fertility. Farmers started to apply FYM prior to 1990 in 3 villages, whereas in 4 villages they started in the 2000s. Overall, farmers noticed that FYM application lead to darker and more humid soil that are better suitable for yam production. In all 6 villages where the topic was discussed, farmers stated, that yam yields and the need for labor increased with FYM application. In 5 villages, farmers started to apply MIN since 2000 to increase the weight and yield of tubers to meet the demand of consumers. Farmers in 4 villages believe that yam production will persist in the future. In one village, the farmers said that yam production would be discontinued, while in 7 villages the farmers were not sure or were split in their opinion about the future of yam production. Notably, the 4 optimistic farmer groups came from villages (Séko, Mia, Goubi and Namanssa) relatively close to Arbollé, a local market center. Arguments in favor of yam production were that yam is an economically viable crop. Further, it was argued that the increasing demand may motivate more farmers to grow yam. Additionally, they hoped that investments and innovations will make yam production more efficient and less labor intensive. Pessimistic farmers said that a lack of means and available labor will lead to a decline in yam production while some believe that yam production is not profitable. Some further noticed a declining motivation of the younger population to work in the yam fields. In many cases the declining motivation was attributed to the laborious and hard tasks in yam production and increasing economic opportunities provided by other activities.
Nutrient Balances
The mean nutrient inputs and outputs, as well as overall nutrient balances and NUE per fertilization practice are shown in Table 6. The K balances were negative and averaged −15 kg K ha−1 in 68% of the fields, whether MIN was applied or not. The N balances were positive in 92% of the fields and averaged 185 kg N ha−1. The highest N surpluses were observed for fields with additional MIN fertilization and averaged 235 kg N ha−1. P balances were positive for all fields and averaged 37 kg P ha−1, regardless of the fertilization practice. No significant differences between the nutrient balances of different SEG were observed.
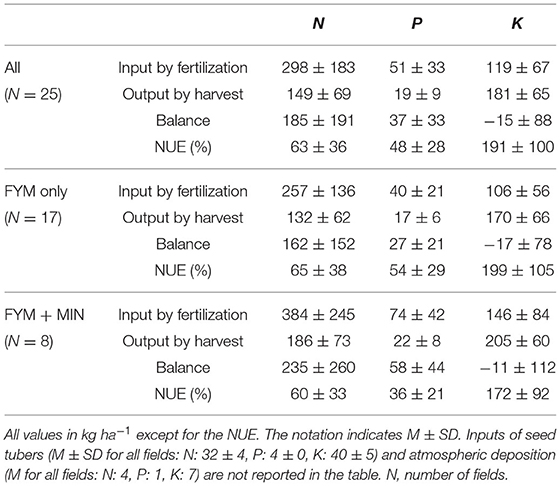
Table 6. Nutrient soil surface balance and nutrient use efficiency (NUE).
Discussion
Differences in Farmers' Practices
Surprisingly, it was not the better-off HH that had the largest yam fields and invested the most (including wages for laborers) into yam production, but the middle HH. It was also the middle SEG that was most motivated to grow yam for revenue. This might be explained by the observation, that the better-off HH tended to have more diversified income and were less reliant on yam production. Nevertheless, the better-off HH were able to apply more FYM per area than the other SEGs, reflecting their economic capacity, which includes larger livestock holdings and therefore higher availability of FYM. However, some of the discussed trends are ambiguous and we found no direct link between the socio-economic status of the HHs and the achieved yam yields. This indicates that other factors, such as personal skills and abilities, the quality of available land and the erratic nature of the regions precipitation are important factors that our study was not fully able to address.
Regardless of the applied practices and the achieved yields, the views on the future of yam production in Passoré seemed to be linked to the economic and demographic perspective of the famers. In tendency, younger and more prosperous farmers closer to the main road network were more optimistic. The more optimistic view maybe due to positively perceived changes, such as new farmers that started to grow yam and increasing yam demand and yam prices. Older and poorer farmers, further away from the main road network, were more pessimistic, most likely because they perceived more negatively attributed facts, such as lack of means and labor. However, our study design, in particular the self-selection in participant recruitment and focus group discussions, may lead to a biased participant selection and socially accepted responses and does not fully identify the socio-economic drivers of yam production and the related views.
Yam Profitability
Our results suggest that HH can generate considerable income from yam production. Indeed, the HH invested on average 8% of their expenditures for yam and received 33% of their income from it. Notably, the income from yam production outranks all other sources of income, including mean income from livestock (22%) and other crops (19%). The difference in expenditures for production and the price on the market reflects the high potential of cultivating yams. We calculated the average expenditure for yam production was 0.04 USD kg−1. Discussions in Saaba revealed a mean yam price of 0.59 USD kg−1. Merchant woman at the roadside in Arbollé added a margin of about 0.34 USD kg−1, resulting in a yam price for the consumers of about 0.93 USD kg−1. Additionally, we did not find very poor HH among the investigated yam farmers although this category is mentioned in the study of Hien et al. (2012) to be 37% of the HH for the whole of Passoré. This finding supports that yam is an important source of income for some HH.
Furthermore, the necessary expenditures for yam production can be relatively low if a HH can provide the necessary resources (e.g., seeds, FYM, and labor) by itself. On the other hand, the high expenditures that apply if yam seeds, fertilizers or laborer need to be paid, can limit the entry into and the expansion of yam production. These limitations can affect poorer HH in two ways: (1) because they have fewer access to FYM and HH labor and need to replace it by buying fertilizers and hiring laborer, and (2) because they have little financial means to pay for the necessary replacements.
Overall, farmers in Passoré produce yam for its cultural and economic value. The cultural value is reflected by the strong family traditions of growing yam as well as the nutritional, traditional medicinal and ritual use of the yam (Tiama et al., 2016a). The motivation to grow yam may have been further encouraged by the reported doubling of yam prices over the last 20 years. The HH invest a significant proportion of their available resources (money, manure, labor, land) into yam production to generate income. Thus, yam production in Passoré has some features of a market-oriented horticultural production system, rather than a staple crop production system.
Soils, Fertilization, Yields and Nutrient Balances
Soils
The low soil organic matter (SOM) content and low inherent soil fertility is a challenge in yam cropping system in Passoré. The soil profiles and the soil map (Sib and Sinkondo, 2002) show decreasing soil rooting depth with increasing position in the catena. Surprisingly, SOM of yam fields tended to increase with increasing position in the catena and decreasing soil rooting depth. Yam is known to be a organic matter demanding crop and its high nitrogen requirements induce high mineralization of SOM (Frossard et al., 2017). It is likely that this long-established yam crop has helped depleting organic matter content on the lower slopes. Finally, more intensive grazing with fewer and shorter fallows in these areas (Bationo et al., 2007) may also have influenced the tendency for organic matter depletion on the lower slopes. Indeed, on the shallow and gravelly plateau soils the cultivation was less intensive in the past (Prudencio, 1993). Thus, the relatively higher SOM levels of the plateau soils may be a remnant of the past fallow-based soil fertility management.
Other authors (Dumont et al., 2005; Tiama et al., 2016a) assert that the area of yam cultivation in Passor has shifted and probably decreased. For example, no yams were found in the Pilimpikou region, a former high yam production area, where yams were produced until the late 1970s exclusively on lowlands with gleyic or stagnant properties (Dumont and Hamon, 1985). Dumont and Hamon (1985) state that the low land sites were chosen due to increased water-availability to compensate for low rainfall. Maybe the yam cultivation area in Passoré has gradually shifted from low land to plateau soils since the 1970s. Reasons for the shift in yam cultivation may have been: (1) a gradient in soil fertility and yam yields as indicated by the Ctot-gradient (Figure 2A), (2) a general shift of yam production toward the main road networks to facilitate logistics and marketing (Ekanayake and Asiedu, 2003), (3) the competing use of the low lands, e.g., for irrigated production of vegetable crops. Alternatively, yam was grown on shallow plateau soils in the past but was not documented. It is surprising that no significant correlation was observed between yam yields and soil Ctot. This could be explained by the low differences in soil Ctot between the studied fields because most of the farmers applied FYM are similar rates. In addition, there are other differences between fields that we were unable to capture that may have diluted the influence of organic matter on yields. These include soil clay content, rainfall, pests and diseases, roaming animals and farmer skills.
Fertilization
Farmers adapted fertilization practices to counteract the perceived decline in SOM content and soil fertility. In the current study, farmers apply on average twice the FYM rate of 8.3 t ha−1 documented in the 1980s (Prudencio, 1993). The high and increasing FYM rates most likely are responses to the low levels of SOM that limit yam yields. Indeed, current average amount of C applied trough FYM corresponds to about 17% of the estimated C stocks in the top 30 cm of the soil (Kaur et al., 2002). In recent years, some farmers adopted MIN fertilization to meet the increasing demand for yam in Passoré. The adoptation of MIN application is partial, as some farmers lack the purchasing power to buy MIN or are skeptic about the quality of MIN-fertilized tubers (Tiama et al., 2018). Farmers try to apply FYM and MIN as effectively and efficiently as possible. Indeed, farmers prioritize FYM application to crops with high expected financial revenue or prestige, such as yam. On field scale, the FYM and MIN are applied next to the planting sets in the middle of the ridges to facilitate plant-uptake of nutrients as much as possible. However, the use efficiency of the applied nutrients remains limited due to the inadequate nutrient application ratios.
Yields
The achieved yam average fresh tuber yield of 16.2 t ha−1 is remarkably high compared to the 10.7 t ha−1 reported average for West Africa (FAOSTAT, 2020). Tiama et al. (2016b) reported yields of up to 25 t ha−1 for the local morphotype, suggesting that yields can be higher in years with adequate rainfall conditions. The low average number of tubers harvested (34,400 ha−1) compared to the number of tubers planted (42,700 ha−1) reflects plant losses of about 19% between planting and harvest, with most plants rarely producing more than one tuber. Farmers attributed these losses to non-germinating tubers and damage caused by stray animals, pests or diseases.
High planting density increase the need for seed tubers and the average tuber weight may decrease due to interplant competition. The reduced average tuber weight may have severe consequences on the marketable yield. For example, Rodriguez-Montero et al. (2001) found that interplant competition due to high planting densities above 22,500 ha−1 reduce the marketable yield. Thus, based on the observed planting densities we expect significant interplant competition in yam fields in Passoré. In fact, the average ratio of yield to seed tuber input in our study is 4.46 and rather low compared to values of 4.04–6.61 found in field trials in Nigeria (Law-Ogbomo and Osaigbovo, 2014). If the marketable tuber weight threshold of 400 g that Rodriguez-Montero et al. (2001) found would apply in Passoré, almost half of the yam tubers were not marketable (M: 450 g). However, this limitation does not apply, because specifically for these yams of Passoré, consumers favor the relatively small, elongated tubers. This is noteworthy, as in general Western African consumers favor large yam tubers well above 1 kg and pay higher prices for larger tubers (Cornet et al., 2014).
Nutrient Balances
There is some evidence that the yam plants in our study were not able to satisfy their high K needs (Frossard et al., 2017). Indeed, the K balances (Table 6) were negative in most fields, regardless if MIN was applied or not. Thus, much of the harvested K is derived from other sources than fertilization, most likely from soil stocks. Soil stocks could have been nurtured by substantial K imports over a long period, e.g., by K-rich Harmattan-dust and rain deposition over many years (~7 kg ha−1 year−1; Lesschen et al., 2007). Furthermore, K tuber concentration is correlated to Kexch in the soil, indicating higher uptake at higher availability. There is some evidence that the lack of K may reduce potato tuber starch content and storage quality as the conversion of sugar to starch could be reduced (Westermann et al., 1994; Marschner, 1995). Indeed, reduced storage quality of MIN-fertilized yam tubers from Passoré is discussed by Tiama et al. (2018). The fact that the reduced storage quality is linked to unmet K plant nutrition needs to be further investigated. The N balances in almost all fields are positive, indicating a general over-fertilization of N, with higher N surplus' for fields with MIN fertilization. We measured an average N-NUE of 63% while study with 15N labeled mineral fertilizer found comparably lower N recovery rates of 23–46% in D. alata (Hgaza et al., 2012). The P balance was positive for all fields, regardless of fertilization practice. This could be explained by the low P requirement of yam. Indeed, Frossard et al. (2017) reported an average P export per ton of tuber fresh matter of 0.3 kg for D alata and 0.5 kg for D rotundata while N and K exports were estimated to be about 3 and 3.5 kg, respectively, for the two yam species. However, it should be noted that the nutrient balances calculated in our study have some limitations. Indeed, nutrient pathways by losses, mulching, weeding, erosion, pests and grazing animals are neglected due to a lack of site-specific data. Furthermore, fields with associated crops were not considered, as they have more complex nutrient pathways (e.g., N fixation by legumes; Nambiar et al., 1983). But overall, the fertilization practices seem to ignore the specific nutrient need of yam because there is no specific fertilization recommendations for from the extension services and no mineral fertilizers with adequate nutrient concentrations for yam are available in the market in Passoré.
Local Adaptation
A recent study by Scarcelli et al. (2019) suggests that during the “green Sahara” period in the early Holocene, the origin and center of yam cultivation was in the basin of the Niger river that lays to the North and East of the study area, before it shifted southward. The yam cropping system in Passoré might have evolved on a separate path, decoupled from other yam cropping systems under different climatic conditions further south, as indicated by the local morphotype, the specific cropping practices and consumer preferences. The predominantly grown local yam morphotype has a relatively short vegetative period of about 185 days or even shorter in dry conditions (Dumont and Hamon, 1985) and is adapted to the short vegetation period of ~110 days (Sib and Sinkondo, 2002). Farmers plant yams early to take advantage of the first rains and make the most of those rare rains. Furthermore, the ditches between the ridges catch run-off water during rain events. The mulching decreases weed growth, increases water conservation and reduces erosion during rain events (Cooper et al., 1987; Lebot, 2020). As suited land for yam cultivation is scarce in Passoré, farmers resort to a labor and input intensive cropping system that produces small, but well appreciated, yam tubers.
Conclusions
The feature-set of the yam cropping system in Passoré allows successful yam cultivation without fallows on low fertility soils under a hot semi-dry climate. The most important features are densely planted ridges, relatively small tubers, the targeted placement of FYM and MIN, as well as the strategies for optimal water-use. In the recent past, the yam cropping system has been adapted to changing conditions to maintaining the productivity of the system. Most important adaptations were increasing FYM rates to counteract the decline of soil fertility due to low SOM levels and the application of MIN to meet increasing consumer demand. Yam can provide substantial income on the locally available resources and for some HH, it is an opportunity to increase and diversify incomes. However, its production is labor intensive and can involve significant expenditures for seed tubers, inputs and labor. Never the less, our results suggest that the productivity of the studied yam fields was limited by various factors, such as the low SOM levels, inadequate fertilization practices (especially K shortage) and lack of purchasing power for inputs. Additionally, yam production can be a risky endeavor due to the low and the erratic rainfall and the high losses due to stray animals, pests and diseases.
Data Availability Statement
The raw data supporting the conclusions of this article will be made available by the authors, without undue reservation.
Ethics Statement
Written informed consent was obtained from the individual(s) for the publication of any potentially identifiable images or data included in this article.
Author Contributions
DK, HV, OT, EF, and MS: conceptualization. DK, EF, and OH: methodology. OH: formal analysis, data curation, writing—original draft preparation, and visualization. OH, KZ, and KS: investigation. EF and DK: resources. DK, EF, MS, HV, OT, KS, and KZ: writing—review and editing. DK, EF, and MS: supervision. All authors have read and agreed to the published version of the manuscript.
Funding
This research has been partly funded by the Food Security Module of the Swiss Program for Research on Global Issues for Development (www.r4d.ch) (SNF Project Numbers: 152017 & 177584) within the YAMSYS Project (www.yamsys.org). Open access funding was provided by ETH Zurich.
Conflict of Interest
The authors declare that the research was conducted in the absence of any commercial or financial relationships that could be construed as a potential conflict of interest.
Publisher's Note
All claims expressed in this article are solely those of the authors and do not necessarily represent those of their affiliated organizations, or those of the publisher, the editors and the reviewers. Any product that may be evaluated in this article, or claim that may be made by its manufacturer, is not guaranteed or endorsed by the publisher.
Acknowledgments
We would like to thank the yam Farmers of Passoré, Dr. Blaise Kienou (FEWSNET) and Dr. Philippe Vernier (CIRAD) for the fruitful discussions. For the lab-support we thank Dr. Laurie Schönholzer (ETH), Monica Maksai (ETH), Dr. Matthias Wiggenhauser (ETH), Philipp Baumann (ETH), Momini Moyenga (INERA), Fulbert Dabilgou (INERA), and Martina Schön. Our special thanks goes to El-Hadj Suleymane Zida, Lassane Zida, and Lacina Bako (MAAH) and their families for their support during our field work as well as to Aurelian Ammon who supported our study with his talent to designing illustrations. Furthermore, we are very grateful to the Walter Hochstrasser Foundation for covering travel costs. The authors thank the three reviewers for their careful reading and insightful comments and suggestions.
Supplementary Material
The Supplementary Material for this article can be found online at: https://www.frontiersin.org/articles/10.3389/fagro.2022.828305/full#supplementary-material
Supplementary Material 1. Survey questionnaires and material.
Supplementary Material 2. Procedures for sample taking and chemical analysis.
Supplementary Material 3. Soil profile descriptions.
References
Abdoulaye, T., Alene, A., Rusike, J., and Adebayo, A. (2015). Results of a Global Online Expert Survey: Major Constraints, Opportunities and Trends for Yam Production and Marketing and Priorities for Future RTB Yam Research. CGIAR Research Program on Roots, Tubers and Bananas (RTB). Available online at: https://hdl.handle.net/10568/83415 (accessed March 28, 2022).
AGRHYMET (2018). Bilan de la situation pastorale en fin de saison des pluies 2017. Bulletin Special. Ouagadougou: Permanent Inter-State Committee for Drought Control in the Sahel.
Bationo, A., Kihara, J., Vanlauwe, B., Waswa, B., and Kimetu, J. (2007). Soil organic carbon dynamics, functions and management in West African agro-ecosystems. Agric. Syst. 94, 13–25. doi: 10.1016/j.agsy.2005.08.011
Carsky, R. J., Asiedu, R., and Cornet, D. (2010). Review of soil fertility management for yam-based systems in West Africa. African J. Root Tuber Crops 8, 1–17. Available online at: https://istrc-ab.org/wp-content/uploads/2014/09/12.pdf
Climate-data (2019). Yako Climate: Average Temperature, Weather by Month, Yako Weather Averages. Available online at: https://en.climate-data.org/africa/burkina-faso/north/yako-52526/ (accessed January 18, 2019).
Cooper, P., Gregory, P., Tully, D., and Harris, H. (1987). Improving water use efficiency of annual crops in the rainfed farming systems of West Asia and North Africa. Exp. Agric. 23, 113–158. doi: 10.1017/S001447970001694X
Cornet, D., Sierra, J., Tournebize, R., and Ney, B. (2014). Yams (Dioscorea spp.) plant size hierarchy and yield variability: emergence time is critical. Eur. J. Agron. 55, 100–107. doi: 10.1016/j.eja.2014.02.002
Diby, L., Hgaza, V., Ti, T., Assa, A., Carsky, R., Girardin, O., et al. (2011). How does soil fertility affect yam growth? Acta Agriculturae Scandinavica. Section B Soil Plant Sci. 61, 448–457. doi: 10.1080/09064710.2010.505578
Diby, L. N., Hgaza, V. K., Tié, T. B., Assa, A., Carsky, R., Girardin, O., et al. (2009). Productivity of yams (Dioscorea spp.) as affected by soil fertility. J. Anim. Plant Sci. 5, 494–506. Available online at: https://www.m.elewa.org/JAPS/2009/5%282%29-December.html
Dumont, R.. (1977). Morpho-botanical study of the yams Dioscorea rotundata and Dioscorea cayenensis grown in northern Benin. Agron. Trop. 32, 225–241.
Dumont, R., Dansi, A., Vernier, P., and Zoundjihkpon, J. (2005). Biodiversit et domestication des ignames en Afrique de l'Ouest: Pratiques traditionnelles conduisant à Dioscorea rotundata. Montpellier: CIRAD.
Dumont, R., and Hamon, P. (1985). Une forme originale parmi les dioscoreacees cultivees en Afrique de l'Ouest l'igname de Pilimpikou. Bouaké: Symposium ISTRC.
Eizenga, D.. (2019). The deteriorating security situation in burkina faso. Bulletin FrancoPaix 4, 1–7. Available online at: https://dandurand.uqam.ca/centre-francopaix/
Ekanayake, I. J., and Asiedu, R. (2003). Problems and perspectives of yam-based cropping systems in Africa. J. Crop Prod. 9, 531–558. doi: 10.1300/J144v09n01_08
Exchange Rates (2021). US Dollar to West African CFA franc Spot Exchange Rates for 2017. Available online at: https://www.exchangerates.org.uk/USD-XOF-spot-exchange-rates-history-2017.html (accessed July 16, 2021).
FAO (2003). Assessment of Soil Nutrient Balance: Approaches and Methodologies. FAO Fertilizer and Plant Bulletin No. 14. Rome: Food and Agriculture Organization of the United Nations (FAO). Available online at: https://www.fao.org/3/y5066e/y5066e.pdf (accessed March 28, 2022).
FAOSTAT (2020). Food and Agriculture Data. Available online at: http://www.fao.org/faostat/en/#home (accessed January 21, 2021).
Frossard, E., Aighewi, B. A., Aké, S., Barjolle, D., Baumann, P., Bernet, T., et al. (2017). The challenge of improving soil fertility in yam cropping systems of West Africa. Front. Plant Sci. 8, 1953. doi: 10.3389/fpls.2017.01953
Hgaza, V. K., Diby, L. N., Oberson, A., Tschannen, A., Tié, B. T., and Sangakkara, U. R. (2012), nitrogen use by yam as affected by mineral fertilizer application. Agron. J. 104, 1558–1568. doi: 10.2134/agronj2011.0387.
Hien, S., Bargo, M., Dahani, M., Gandema, A., Koate, P. S., and Ouedraogo, D. (2012). Burkina Faso - Zone Plateau Central crales et jardinage (ZOME 5) - Province du Passoré. Ouagadougou: Technical report. Famine early warning system network (FEWS NET).
Kassi, S. P. A., Koné, A. W., Tondoh, J. E., and Koffi, B. Y. (2017). Chromoleana odorata fallow-cropping cycles maintain soil carbon stocks and yam yields 40 years after conversion of native-to farmland, implications for forest conservation. Agric. Ecosyst. Environ. 247, 298–307. doi: 10.1016/j.agee.2017.06.044
Kaur, R., Kumar, S., and Gurung, H. P. (2002). A pedo-transfer function (PTF) for estimating soil bulk density from basic soil data and its comparison with existing PTFs. Aust. J. Soil Res. 40, 847–858. doi: 10.1071/SR01023
Kiba, D. I., Hgaza, V. K., Aighewi, B., Aké, S., Barjolle, D., Baumann, P., et al. (2020). A transdisciplinary research for improved yam (Dioscorea sp.) productivity in West Africa. Sustainability. 12, 4016. doi: 10.3390/su12104016
Law-Ogbomo, K., and Osaigbovo, A. (2014). Effects of plant density and NPK application on the growth and yield of white Guinea yam (Dioscorea rotundata Poir) in a forest zone of Nigeria. Afr. J. Food Agric. Nutr. Dev. 14, 2204–2217. doi: 10.18697/ajfand.66.13795
LBV (1998). Verordnung über landwirtschaftliche Begriffe und die Anerkennung von Betriebsformen (LBV). Available online at: https://www.admin.ch/opc/de/classified-compilation/19983381/index.html#app1ahref1 (accessed Decemeber 6, 2017).
Lebot, V.. (2020). Tropical Root and Tuber Crops: Cassava, Sweet Potato, Yams and Aroids, Second Ed. Wellington: CABI.
Lesschen, J., Stoorvogel, J., Smaling, E., Heuvelink, G., and Veldkamp, A. (2007). A spatially explicit methodology to quantify soil nutrient balances and their uncertainties at the national level. Nutr. Cycl. Agroecosyst. 78, 111–131. doi: 10.1007/s10705-006-9078-y
MAAH (2019). Relevés pluviométriques (en mm et le nombre de jours de pluie) du Passoré. Direction Provinciale de l'Agriculture et des Aménagements Hydro-agricoles du Passoré. Unpublished data.
Nambiar, P., Rao, M., Reddy, M., Floyd, C., Dart, P., and Willey, R. (1983). Effect of intercropping on nodulation and N2-fixation by groundnut. Exp. Agric. 19, 79–86. doi: 10.1017/S001447970001053X
Nicholson, S. E.. (2013). The west african sahel: a review of recent studies on the rainfall regime and its interannual variability. ISRN Meteorol. 2013, 1–33. doi: 10.1155/2013/453521
Prudencio, C. Y.. (1993). Ring management of soils and crops in the West African semi-arid tropics: the case of the Mossi farming system in Burkina Faso. Agric. Ecosyst. Environ. 47, 237–264. doi: 10.1016/0167-8809(93)90125-9
Reardon, T., Delgado, C., and Matlon, P. (1992). Determinants and effects of income diversification amongst farm households in Burkina Faso. J. Dev. Stud. 28, 264–296. doi: 10.1080/00220389208422232
Rodriguez-Montero, W., Hilger, T. H., and Leihner, D. E. (2001). Effects of seed rates and plant populations on canopy dynamics and yield in the greater yam (Dioscorea alata L.). Field Crops Res. 70, 15–26. doi: 10.1016/S0378-4290(00)00145-3
Scarcelli, N., Cubry, P., Akakpo, R., Thuillet, A. C., Obidiegwu, J., Baco, M. N., et al. (2019). Yam genomics supports West Africa as a major cradle of crop domestication. Sci. Adv. 5, aaw1947. doi: 10.1126/sciadv.aaw1947
Sib, S., and Sinkondo, N. B. (2002). Etude Morphopdologique de la Province du Passoré. Technical report No. 127. Ouagadougou: Bureau national des sols (Bunasols).
Silvestri, S., Bryan, E., Ringler, C., Herrero, M., and Okoba, B. (2012). Climate change perception and adaptation of agro-pastoral communities in Kenya. Region. Environ. Change 12, 791–802. doi: 10.1007/s10113-012-0293-6
Sonder, K., Okonkwo, C., and Asiedu, R. (2010). Predicted changes in suitability and agro climatic factors due to climate change for yam production in Nigeria. Afr. J. Root Tuber Crops 8, 51. Available online at: https://istrc-ab.org/wp-content/uploads/2014/09/7.pdf
Srivastava, A. K., Gaiser, T., Paeth, H., and Ewert, F. (2012). The impact of climate change on Yam (Dioscorea alata) yield in the savanna zone of West Africa. Agric. Ecosyst. Environ. 153, 57–64. doi: 10.1016/j.agee.2012.03.004
Tiama, D., Zoundjihekpon, J., Sawadogo, N., and Nebie, B. (2016b). Agro-morphological characterization of yams (Dioscorea sp) of Passoré in Burkina Faso. J. Appl. Environ. Biol. Sci. 6.
Tiama, D., Sawadogo, N., Traoré, R. E., Yolou, M., Bationo-Kando, P., Zoundjihekpon, J., et al. (2018). Effect of chemical fertilizers on production of yams (nyù) of passore in farmers' environment. Agron. Afr. 30, 99–105. Available online at: https://www.ajol.info/index.php/aga/article/view/178651
Tiama, D., Zoundjihekpon, J., Kando, P. B., Sawadogo, N., Nebie, B., Nanema, R. K., et al. (2016a). Les ignames, “Yùyà”, de la province du Passoré au Burkina Faso. Int. J. Innov. Applied Stud. 14, 1075. Available online at: http://www.issr-journals.org/links/papers.php?journal=ijias&application=pdf&article=IJIAS-15-291-01
Trabucco, A., and Zomer, R. (2019). Global Aridity Index and Potential Evapotranspiration (ET0) Climate Database v2. Figshare. Fileset. doi: 10.6084/m9.figshare.7504448.v3
Westermann, D. T., James, D. W., Tindall, T. A., and Hurst, R. L. (1994). Nitrogen and potassium fertilization of potatoes: sugars and starch. Am. Potato J. 71, 433–453. doi: 10.1007/BF02849098
Wilde, V., and SEAGA. (2001). Socio-Economic and Gender Analysis Programme Field Level Handbook. Technical report. Rome: Food and Agriculture Organization of the United Nations (FAO). Available online at: https://www.fao.org/3/ak214e/ak214e.pdf (accessed March 28, 2022).
WRB (2015). World Reference Base for Soil Resources 2014, update 2015 - International Soil Classification System for Naming Soils and Creating Legends for Soil Maps. World Soil Resources Report No. 106. Rome: Food and Agriculture Organization of the United Nations (FAO). Available online at: https://www.fao.org/3/i3794en/I3794en.pdf (accessed March 28, 2022).
Keywords: yam cropping system, climate adaptation, soil organic matter depletion, manure application, soil degradation, nutrient balance, West Africa
Citation: Heller O, Kiba DI, Zida KW-D, Schneider K, Valérie Kouame HK, Traoré OYA, Siegrist M and Frossard E (2022) Interdisciplinary Assessment of Market Oriented Yam Cultivation in Semi-arid Burkina Faso. Front. Agron. 4:828305. doi: 10.3389/fagro.2022.828305
Received: 03 December 2021; Accepted: 21 March 2022;
Published: 13 April 2022.
Edited by:
Jaindra Nath Tripathi, International Institute of Tropical Agriculture (IITA), KenyaReviewed by:
Xiaolin Yang, China Agricultural University, ChinaAsrat Asfaw, International Institute of Tropical Agriculture (IITA), Nigeria
Walter Ocimati, Alliance Bioversity International and CIAT, France
Copyright © 2022 Heller, Kiba, Zida, Schneider, Valérie Kouame, Traoré, Siegrist and Frossard. This is an open-access article distributed under the terms of the Creative Commons Attribution License (CC BY). The use, distribution or reproduction in other forums is permitted, provided the original author(s) and the copyright owner(s) are credited and that the original publication in this journal is cited, in accordance with accepted academic practice. No use, distribution or reproduction is permitted which does not comply with these terms.
*Correspondence: Emmanuel Frossard, ZW1tYW51ZWwuZnJvc3NhcmRAdXN5cy5ldGh6LmNo