 Brenden Kelley
 Younsuk Dong
 Martin I. Chilvers3
- 1Extension, Michigan State University, East Lansing, MI, United States
- 2Department of Biosystems and Agricultural Engineering, Michigan State University, East Lansing, MI, United States
- 3Department of Plant, Soil and Microbial Sciences, Michigan State University, East Lansing, MI, United States
- 4Department of Civil and Environmental Engineering, Michigan State University, East Lansing, MI, United States
Irrigation plays a key role in boosting crop yields, supporting crop diversity, and reducing the impact of climate variability, especially in regions like the Great Lakes region where seasonal water availability can be unpredictable. Improving irrigation water use efficiency (WUE) is critical for ensuring long-term water sustainability. This study explores water use efficiency (WUE) in southwest Michigan’s humid climate, focusing on improving irrigation management practices. Several different volumes and frequencies of irrigation (30%, 50%, and 60% Maximum Allowable Depletion) were examined as experimental treatments to better understand their impact on crop productivity. Despite testing an array of different experimental irrigation treatments, we found no statistical differences but noted unequal averages and data spreads. These trends suggest more samples, under typical climatic conditions, are needed to distinguish which irrigation approaches enhance WUE. We also contrasted producers’ methods with experimental treatments, highlighting the challenges of optimizing WUE in the region’s climate and soil conditions even with experience in irrigation management. This study was conducted as a demonstration study for the benefit of producers, with the intention of providing a reference for their irrigation management practices.
1 Introduction
Irrigation is a crucial practice to increase crop yields, diversify crop varieties, and mitigate the risks from climate variability and water scarcity (United States Department of Agriculture, National Agricultural Statistics Service, 2012). Irrigated farms in the U.S. represent a minority in terms of land use and agricultural production but contribute a substantially higher proportion of the country’s agricultural output, highlighting the importance of irrigation in sustaining agricultural productivity and livelihoods (Food and Agriculture Organization, 2002). In the Great Lakes region, the demand for irrigation is increasing since it serves as a vital tool for enhancing crop production and ensuring agricultural resilience (Cheu and Gammans, 2023). Despite being a water-rich region, the Great Lakes states face challenges related to seasonal water availability and variability, particularly during critical growing periods.
Irrigation helps mitigate these challenges by supplementing natural precipitation and providing consistent water supply to crops, thereby maintaining soil moisture levels crucial for plant growth and productivity. In Michigan specifically, where only a small percentage of land is irrigated, the value of irrigated crops exceeds this proportion due to the cultivation of high-value crops under irrigation (Michigan Department of Agriculture and Rural Development, 2020). Government and university-level research institutions recognize the importance of irrigation in sustaining Michigan’s agricultural economy and supporting the production of key crops like vegetables, potatoes, and specialty crops (Michigan Department of Agriculture and Rural Development, 2020). A previous study found that potato yields in Michigan can be reduced by up to 50% without irrigation (Dong et al., 2023). This significant reduction highlights the critical role that supplemental irrigation plays in maintaining optimal crop productivity, particularly during periods of inadequate precipitation.
Moreover, irrigation increases the resilience of Michigan’s agricultural sector by reducing reliance on unpredictable precipitation patterns and adequate soil moisture despite fluctuating environmental conditions. Precipitation data over the last twenty years displays how sporadic precipitation during the growing season can be from year to year (Figure 1). This variation in annual precipitation implies a need for irrigation to ensure a viable cropping season, especially in years with low precipitation volume or inconsistent timing of precipitation events. Amid concerns for water conservation, agricultural irrigation is crucial for global food security and economic stability. It is agreed that recent trends in climatic conditions have not been favorable for corn or soybean production (Intergovernmental Panel on Climate Change (IPCC), 2014). Many producers rely on irrigation to sustain their crop’s water requirements. However, irrigation’s water demand faces scrutiny, especially with rising water scarcity concerns.
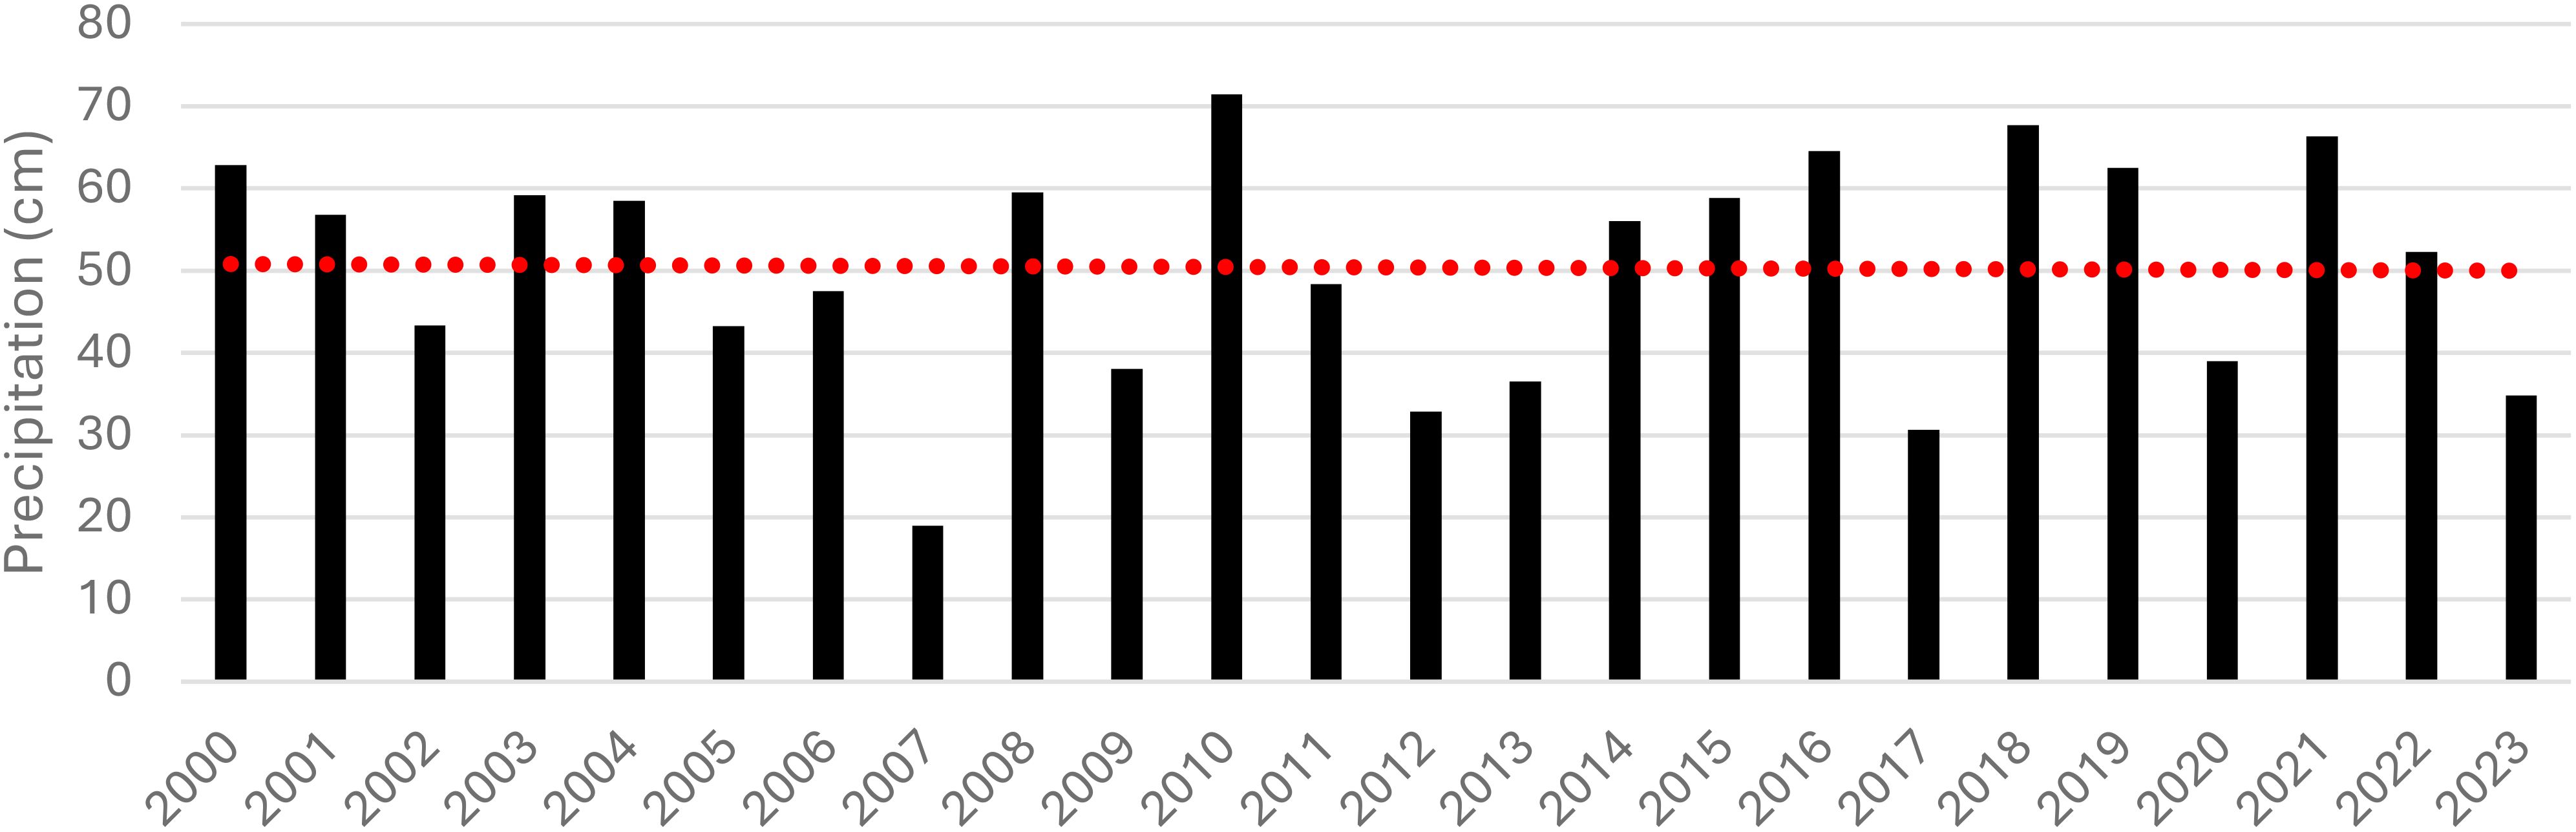
Figure 1. Annual and average (red dashed line) growing season precipitation from Three Rivers, Michigan, from May 1st to September 30th, 2000 to 2023 (National Weather Service, 2024).
Agriculture stands as the leading consumer of freshwater resources in the U.S. and at the global scale. In 2015, irrigation accounted for over 40 percent of freshwater withdrawals in the U.S., this amounted to a staggering 446 billion liters (118 billion gallons) per day or 163 trillion liters over the course of the year (United States Department of Agriculture, National Agricultural Statistics Service, 2017). Even in regions with generally abundant sources of surface and ground water, such as the Great Lakes, the importance of conservation efforts is increasingly recognized with increasingly variable climatic conditions and increasing public awareness. The substantial water usage in agricultural irrigation underscores the need for comprehensive water-saving strategies (Grafton et al., 2018; Hanjra and Qureshi, 2010; Postel, 1999). Effective practices, policies and technologies are essential to mitigate water scarcity challenges and ensure sustainable water management practices for future generations. Implementing innovative irrigation techniques and promoting water-efficient farming practices hold potential to significantly reduce agricultural water consumption (Gleick, 2000). Innovative approaches such as precision agriculture and improved irrigation technologies are being explored to enhance resilience and sustainability in the face of climate variability (Hatfield et al., 2011; Lobell et al., 2009). Research efforts are focusing on developing climate-smart agricultural practices tailored to the specific needs of Michigan’s diverse agricultural landscape.
Effective irrigation scheduling remains crucial despite the presence of abundant precipitation in southern Michigan’s humid climate. This is because humidity levels affect both the moisture content of soils, and the water needs of crops simultaneously. Humid conditions can lead to increased evapotranspiration rates, where moisture is lost from both the soil and plant surfaces, requiring careful monitoring and management of irrigation (Allen et al., 1998). Proper irrigation scheduling helps prevent waterlogging, erosion of soil, leaching of nutrients, optimizes water use efficiency, and ensures that crops receive an appropriate amount of water at the ideal time to support healthy growth and maximize yields (Taghvaeian et al., 2020). Excess soil moisture can also induce drainage and increase the risk of diseases such as root rot and foliar disease caused by fungal and oomycete infections, underscoring the importance of precise irrigation timing (Irmak et al., 2022). Drainage is a natural and critical process in which excess water moves under the force of gravity, allowing the root zone to return to field capacity and continue drying. However, irrigation applications that induce drainage are both harmful and wasteful as drainage water can remove sediment and nutrients from the soil and deposit them in areas that are negatively impacted by these components which can no longer be used by the crop (Gao et al., 2021). The added costs are indirect and may not be observed at the time of the application but are converted to ecological damage from elements and compounds in the leachate and run off, lost nutrients which may have to be replaced with fertilizers, and unnecessary high electrical consumption from pumping water. Furthermore, humid conditions can create challenges in accurately assessing soil moisture levels due to increased evaporation rates and rapidly fluctuating humidity levels (Allen et al., 1998). Understanding the impacts of ET and humidity is crucial for optimizing irrigation scheduling and efficient water use in farming (Tanny et al., 2015).
Advanced irrigation scheduling techniques such as soil moisture sensing, evapotranspiration (ET)-based scheduling models, and crop water requirement calculations are essential for efficient water management in humid climates (Diaz-Perez et al., 2008). These technologies help farmers make informed decisions about irrigation timing and duration based on real-time environmental conditions and calculated crop water needs. Effective irrigation scheduling not only conserves water but also contributes to sustainable agriculture by reducing energy consumption associated with pumping and distributing water (Irmak et al., 2011). Moreover, it helps mitigate the impacts of climate variability and extreme weather events by ensuring crops have access to adequate moisture during periods of drought or excessive heat (Diaz-Perez et al., 2008). Irrigation scheduling plays a crucial role in optimizing water use efficiency and enhancing crop productivity (Dong et al., 2020a). It refers to the process of determining when and how much water to apply to crops based on their specific water needs and prevailing environmental conditions. Several methods including soil moisture monitoring, weather forecasting, and remote sensing, can be utilized in irrigation scheduling, each with its advantages and limitations. ET-based scheduling methods estimate crop water requirements by utilizing climate data such as temperature, humidity, wind speed, and solar radiation along with crop stage. The difference in ETc between corn and soybeans has significant implications for irrigation management, particularly in regions where both crops are grown under similar soil and environmental conditions. Corn’s higher ETc compared to soybean’s ETc indicates that corn requires more water to support its growth and development stages. This disparity underscores the importance of tailoring irrigation schedules to match crop water demands in order to avoid water stress. This is especially necessary during critical growth periods when water demand and the potential for impact are both increased. Soil moisture-based scheduling involves monitoring the moisture content of the soil to determine when irrigation is needed. This method relies on sensors placed in the root zone to provide real-time data on soil moisture levels. Producers can use this information to schedule irrigation based on specific thresholds of soil moisture, ensuring that crops receive water when needed without overwatering (Diaz-Perez et al., 2008). Considerations of soil moisture-based scheduling is the need for accurate placement and calibration of sensors (Dong et al. 2020b), which demands labor and comes at a cost. The placement of the sensors is critical in that each sensor must represent an area within the field and should accurately reflect the conditions of that specific area in order to make management decisions.
Remote sensing-based scheduling leverages satellite imagery and aerial photography to assess crop health and moisture levels across large areas. Remote sensing technologies can provide valuable information on crop water stress, allowing for targeted irrigation management. By analyzing vegetation indices derived from remote sensing data, farmers can identify areas of water stress and adjust irrigation schedules accordingly (Gao, 2009). However, limitations include the cost of acquiring and processing remote sensing data, as well as the need for expertise in interpreting the imagery for irrigation decisions. Overall, irrigation scheduling methods offer valuable tools for farmers to optimize water use and enhance crop performance. Each approach has its strengths and weaknesses, and the choice of method often depends on factors such as crop type, climate, available resources, and technological expertise. Integrating multiple scheduling techniques and leveraging advances in technology can further improve irrigation efficiency and sustainability in agriculture.
Despite the potential benefits in terms of water conservation and crop productivity, many farmers have yet to integrate these technologies into their operations. Several factors contribute to this limited adoption. Firstly, the initial costs associated with implementing irrigation scheduling systems and soil moisture monitoring devices can be prohibitive, especially where profit margins are limited (Huang et al., 2019; Wanyama et al., 2024). Additionally, there is a knowledge gap regarding the practical applications, precision, and benefits of these technologies, leading to skepticism or reluctance to invest (Zhang and Long, 2021). The complexity of data interpretation from soil moisture sensors and the perceived learning curve further deters widespread adoption. In Michigan, despite the state’s significant agricultural sector, many farmers continue to rely on traditional irrigation management methods which are less precise due to entrenched practices and limited access to resources promoting new technologies (United States Department of Agriculture, National Agricultural Statistics Service, 2019). While traditional methods of irrigation scheduling can be effective, the need to improve management practices and conserve resources is undeniable. The variable climate of the Midwest, characterized by unpredictable precipitation patterns, underscores the potential advantages of precise irrigation management but also presents challenges in convincing producers to make the shift. Addressing these barriers will require concerted efforts from agricultural institutions, government agencies, and industry stakeholders to provide targeted education, technical assistance, and financial incentives to encourage adoption (Dibbern et al., 2024). Demonstrating the tangible benefits of irrigation scheduling and soil moisture monitoring through pilot programs and case studies can help build confidence among producers and set an example for broader adoption. As awareness grows and technologies become more accessible and affordable, the potential for widespread adoption of these innovative practices in Michigan’s agriculture sector holds promise for increased sustainability, productivity, and resilience despite changing environmental conditions.
This study demonstrates the impacts of employing sensor-based irrigation scheduling, aiming to showcase its effectiveness in enhancing crop performance and maximizing irrigation water use efficiency in a humid climate such as Michigan. Many studies have been conducted in arid climates on the topic of water use efficiency, however there is a knowledge gap in improving irrigation water use efficiency, particularly on irrigation scheduling in the area of this study. On-farm demonstrations were conducted in local producers’ fields as part of the study, evaluating various irrigation applications to highlight the advantages of sensor technology and irrigation scheduling.
2 Methods and materials
2.1 Site description
Four demonstration fields were selected to evaluate the effects of different irrigation management strategies in corn and soybean production. These locations were selected from southwest Michigan as shown in Figure 2, since the majority of irrigated acreage is located within this region of the state (United States Department of Agriculture, National Agricultural Statistics Service, 2019). These areas possess the largest potential for improvement in water use efficiency using center pivot irrigation. Field locations, size, cropping regime, and soil type for each site are shown in Table 1. In general, the area’s soil is well-drained and contains large proportions of sand.
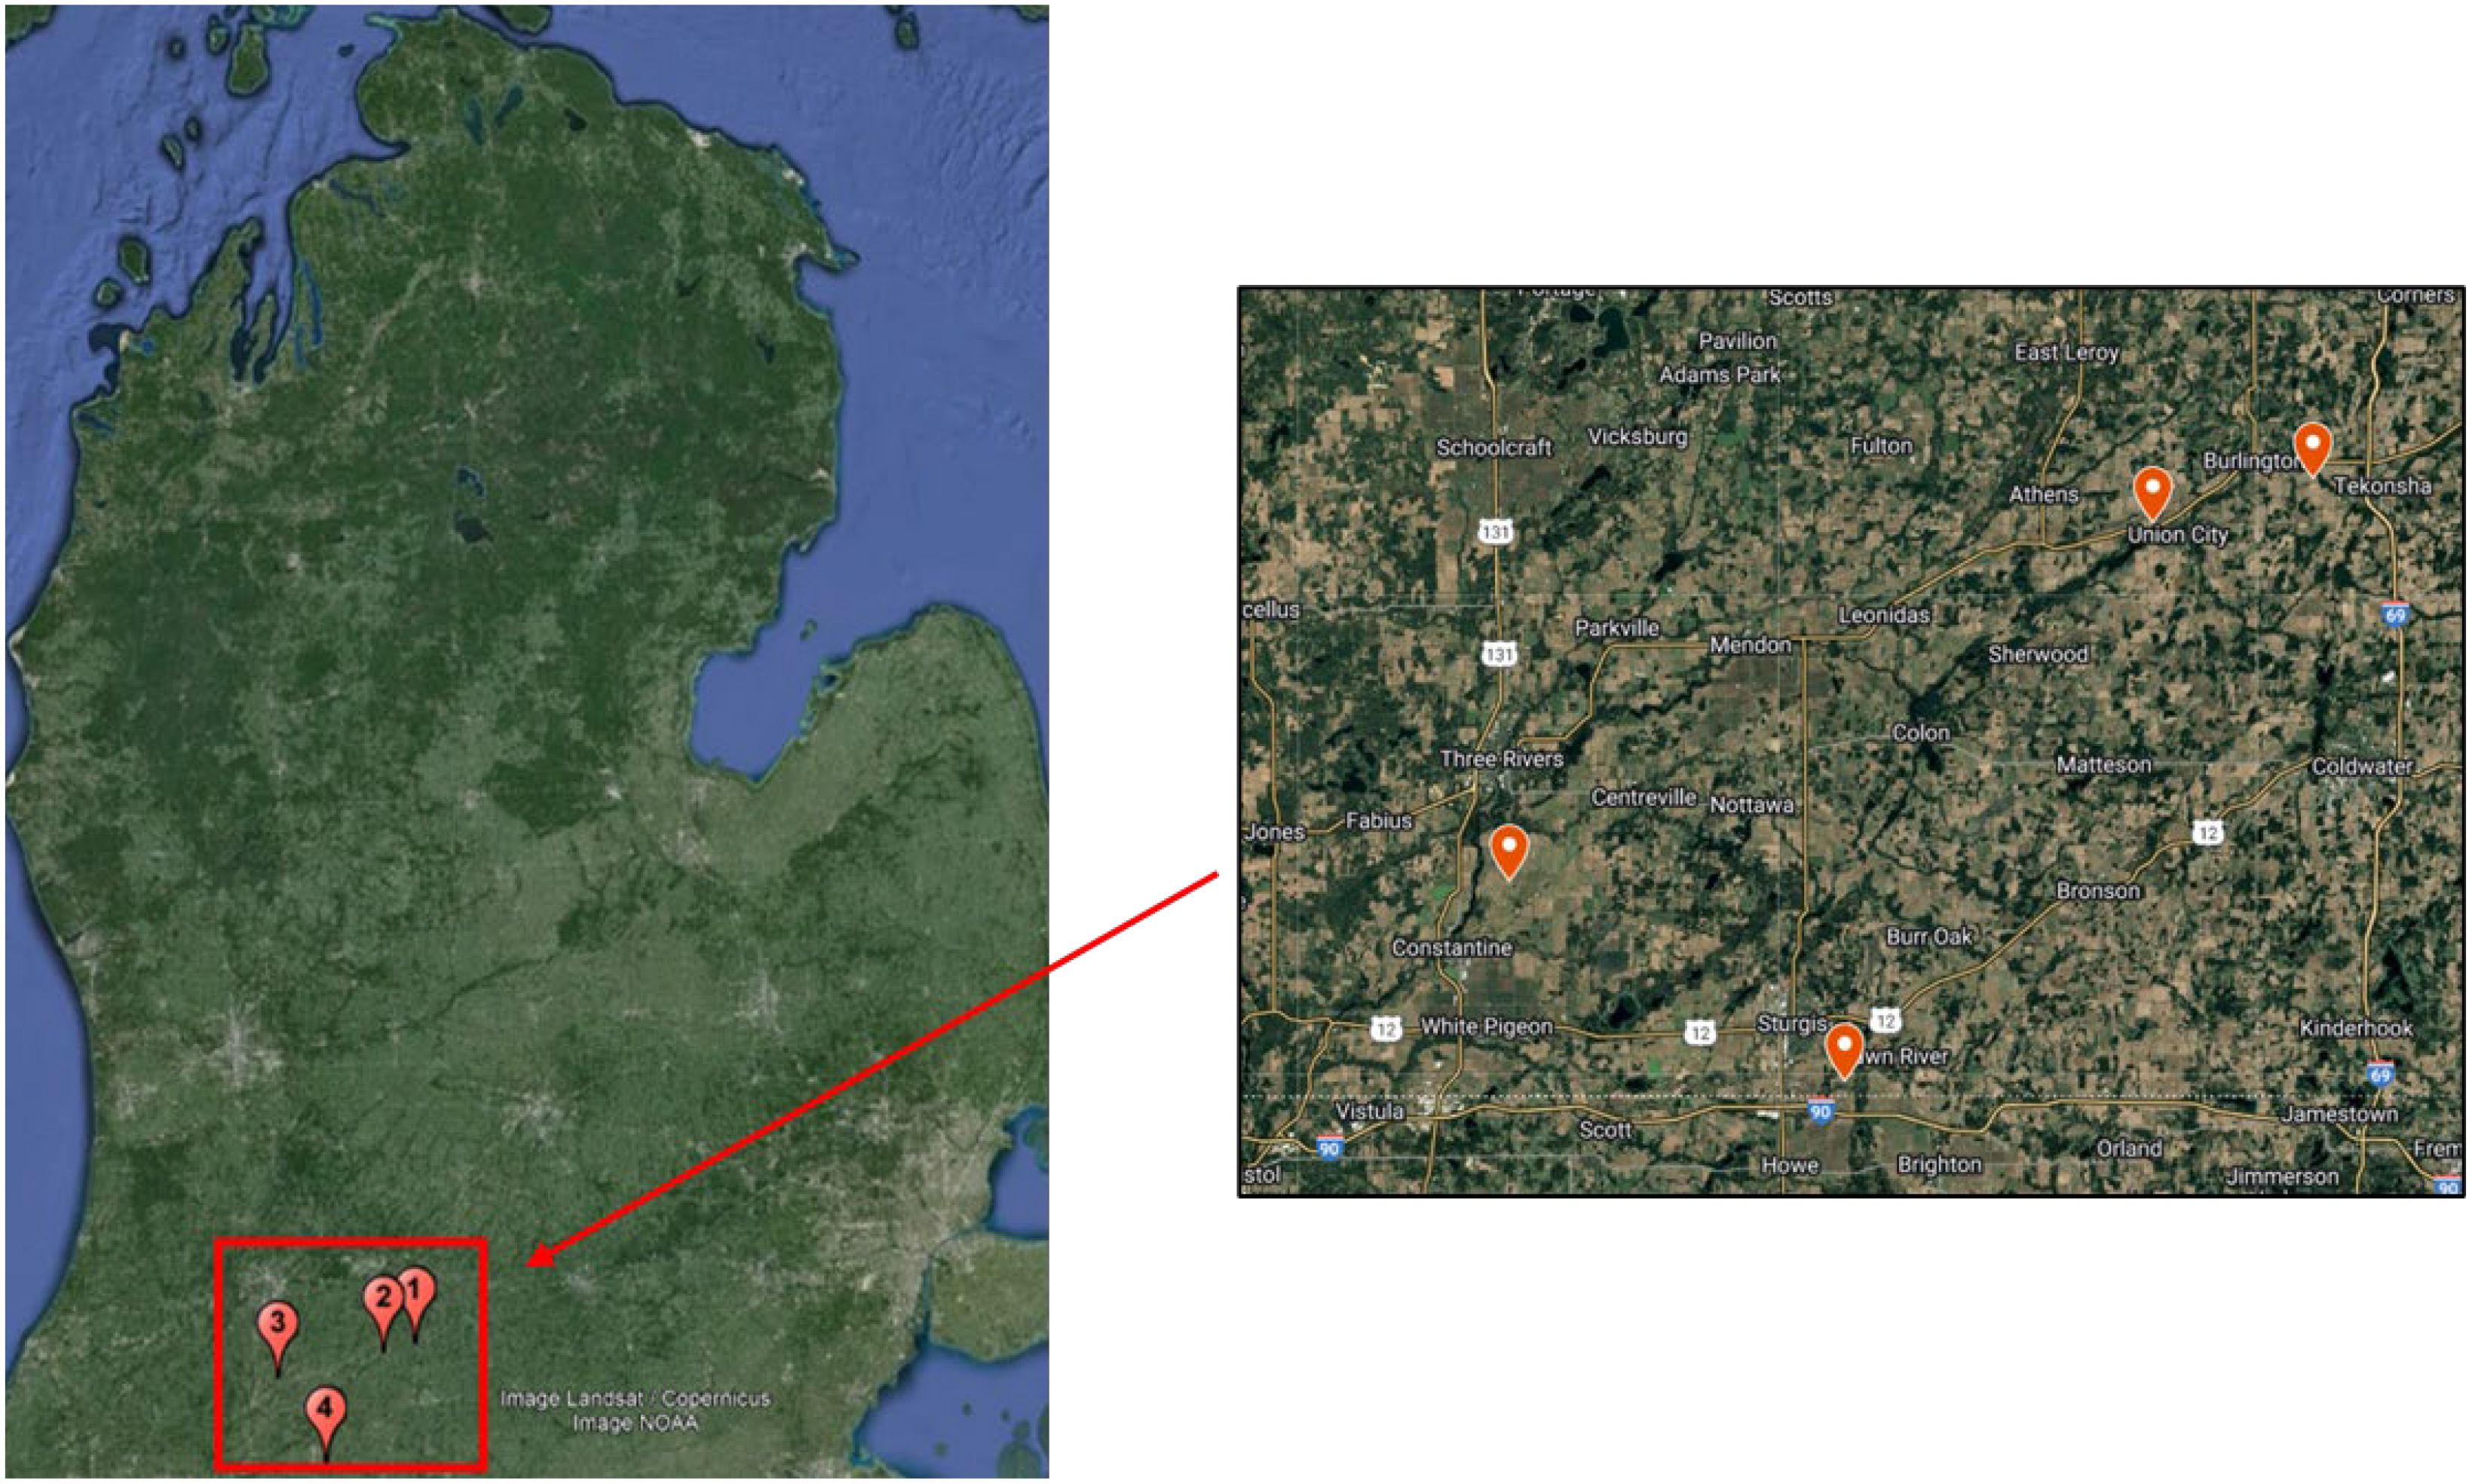
Figure 2. Map of demonstration sites. Site #1: Burlington, Site #2: Union City, Site #3: Mendon, Site #4: Sturgis.

Table 1. Demonstration site locations and features.
Since this study was conducted in fields that were owned by private entities who were gracious enough to allow for manipulation of their irrigation systems, there were some factors which could not be held uniform across all fields. Tillage practices varied by farm and crop as seen in Table 2.

Table 2. Tillage practices listed by farm and year.
2.2 Irrigation treatments
Each field was divided into five plots to demonstrate irrigation prescriptions (Figure 3). Table 3 describes the details on the threshold for Maximum Allowable Depletion (MAD) and irrigation volume for each irrigation treatment and each crop. Both the threshold for MAD and irrigation volume per application were determined based on irrigation simulations using Michigan State University Irrigation Scheduler Software. The irrigation volume for corn was larger than soybeans due to the rooting depth. MAD at 30%, 50%, and 60% were selected to evaluate the effects of MAD on the production and differentiate the total amount of irrigation application among the treatments. Fourth treatment was the producer’s typical irrigation management practice. The dry corner of each site was used as a non-irrigated treatment area for comparison of yields with irrigated areas. These dry corners of the field were outside the pivot’s area of coverage and were managed the same as the other treatment areas but had no irrigation applied.

Figure 3. Establishment of treatment plots for each site, Burlington site (top left) Constantine site (top right), Sturgis site (lower left), Union city site (lower right). Green triangles indicating data logging stations with soil moisture sensors. Shaded overlays indicating experimental irrigation treatment as designated in the figure legend. Non-irrigated treatment areas are designated by the data logging station outside the center-pivot’s radius.
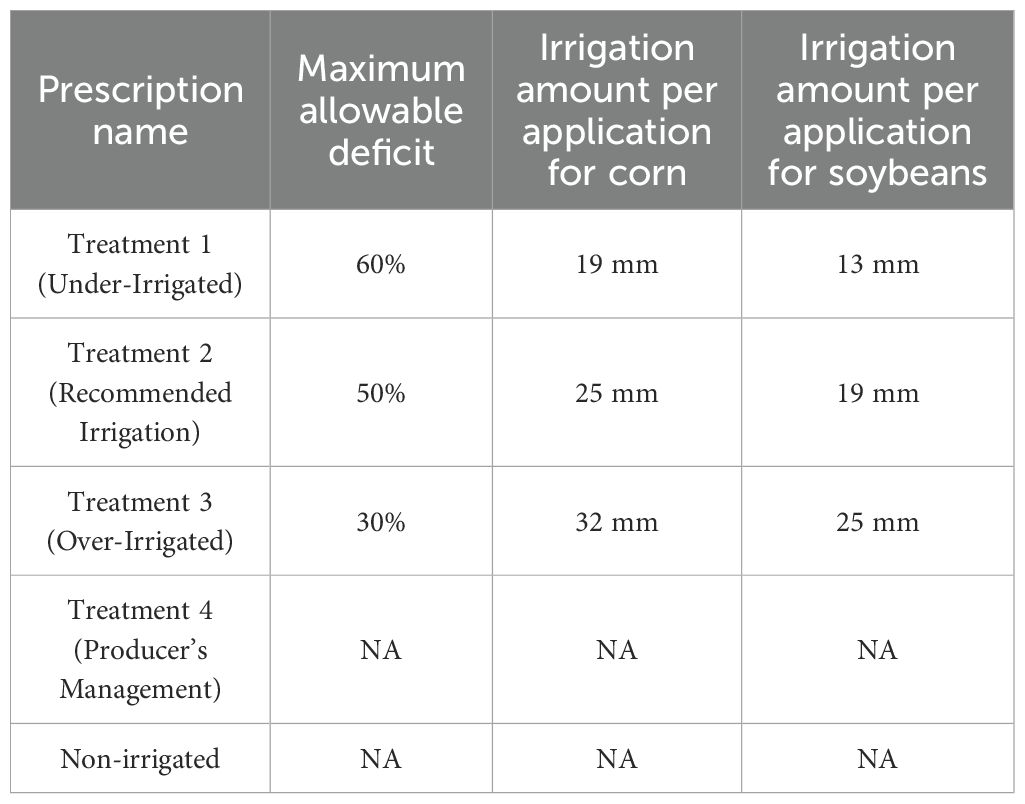
Table 3. Summary of experimental treatments.
2.3 Field monitoring
Within each irrigation management zone, field conditions were monitored using the Low-Cost Sensor Monitoring System (LOCOMOS), which was developed by Michigan State University Irrigation Lab and was accompanied by at least three Soil Watch 10, manufactured by PinoTech (Zachodniopomorskie, Poland) (Holycross, 2023). The Soil Watch 10 sensor is a capacitance-based soil moisture sensor that operates at 75Mhz and has a probe length of 3.8 cm (Pinotech SoilWatch 10 Specifications, 2024). Sensor values were validated by comparing it with taking volumetric water content samples. The Soil Watch 10 calibration is described in Dong et al. (2024).
Sensors were installed at depths in and below the rooting zone to track water movement during and after each precipitation or irrigation event. Figure 4 displays how sensors were horizontally installed at a variety of depths in close proximity to the crop’s roots and not directly under the data logging system. For corn, sensors were placed at depths of 30.5, 61.0, and 91.4 cm. In soybeans, sensors were placed at depths of 15.2, 38.1, and 61.0 cm. LOCOMOS technology was utilized to measure precipitation using a rain gauge, manufactured by Davis Instruments (Hayward, CA, USA). Additionally, PHYTOS 31 leaf wetness sensors, manufactured by METER Group (Pullman, WA, USA) were integrated into the LOCOMOS to monitor the duration of leaf wetting, allowing for the potential correlation with foliar disease pressure. The sensor data were collected on an hourly basis and sent to a cloud website (locomos1.com) through an embedded cell modem.

Figure 4. Equipment setup, an example of soil moisture sensors at incremental depths throughout the rooting zone. (A) Soil pit dug for the installation of the Soil Watch-10 soil moisture sensors. (B) Diagram of sensor installation with sensors placed throughout and below the root zone to capture the effects of different soil horizons and rooting densities. (C) LOCOMOS station in a corn field.
2.4 Data analysis
In addition to sensor data, crop development was assessed on a weekly basis, especially during critical phases, enabling a more thorough analysis of yield impacts. Site scouting allowed for monitoring of any quantitative estimates of differences in disease presence. While related to yield, disease presence required quantification of impact for comparison of water use efficiency and yield across different irrigation management areas. Significant differences in disease presence were not found. Thus, data collected on disease presence was not included in this study and the effects of disease were assumed to be comparable between treatments. Furthermore, to compare crop performance, spatial yield data from the combine’s yield monitor was collected from each field at harvest. This data was then analyzed on an annual basis for each field, independently, to represent the efficiency of each irrigation management prescription. The average non-irrigated yield was subtracted from the average yield of each management area and divided by the volume of water applied to that particular management area to calculate water use efficiency, following Equation 1 (Irmak et al., 2011).
Where, YIrr represents the yield of an irrigated area (kg/ha), YDry represents the yield of an non-irrigated area (kg/ha), and VIrr is the volume of irrigation applied to the irrigated area (mm).
2.5 Statistical analysis
Statistics for this study were calculated using a combination of Microsoft Excel and R Studio. Microsoft Excel was utilized to transfer data over the various stages of this study and hold it for later refinement and analysis. Calculations of significance and power were reserved for R studio version 2023.12.0. Significance was analyzed using a pairwise Tukey’s test for significance at an alpha of 0.05. Once treatments were tested for significance, boxplots of yield and WUE were created to visualize the data.
3 Results
3.1 Weather data
Figure 5 shows weather summary during the growing season in Burlington/Union City, Parkville, and Sturgis, respectively. Data was collected from the National Weather Service starting in May and ending in August each year 2021 through 2023.
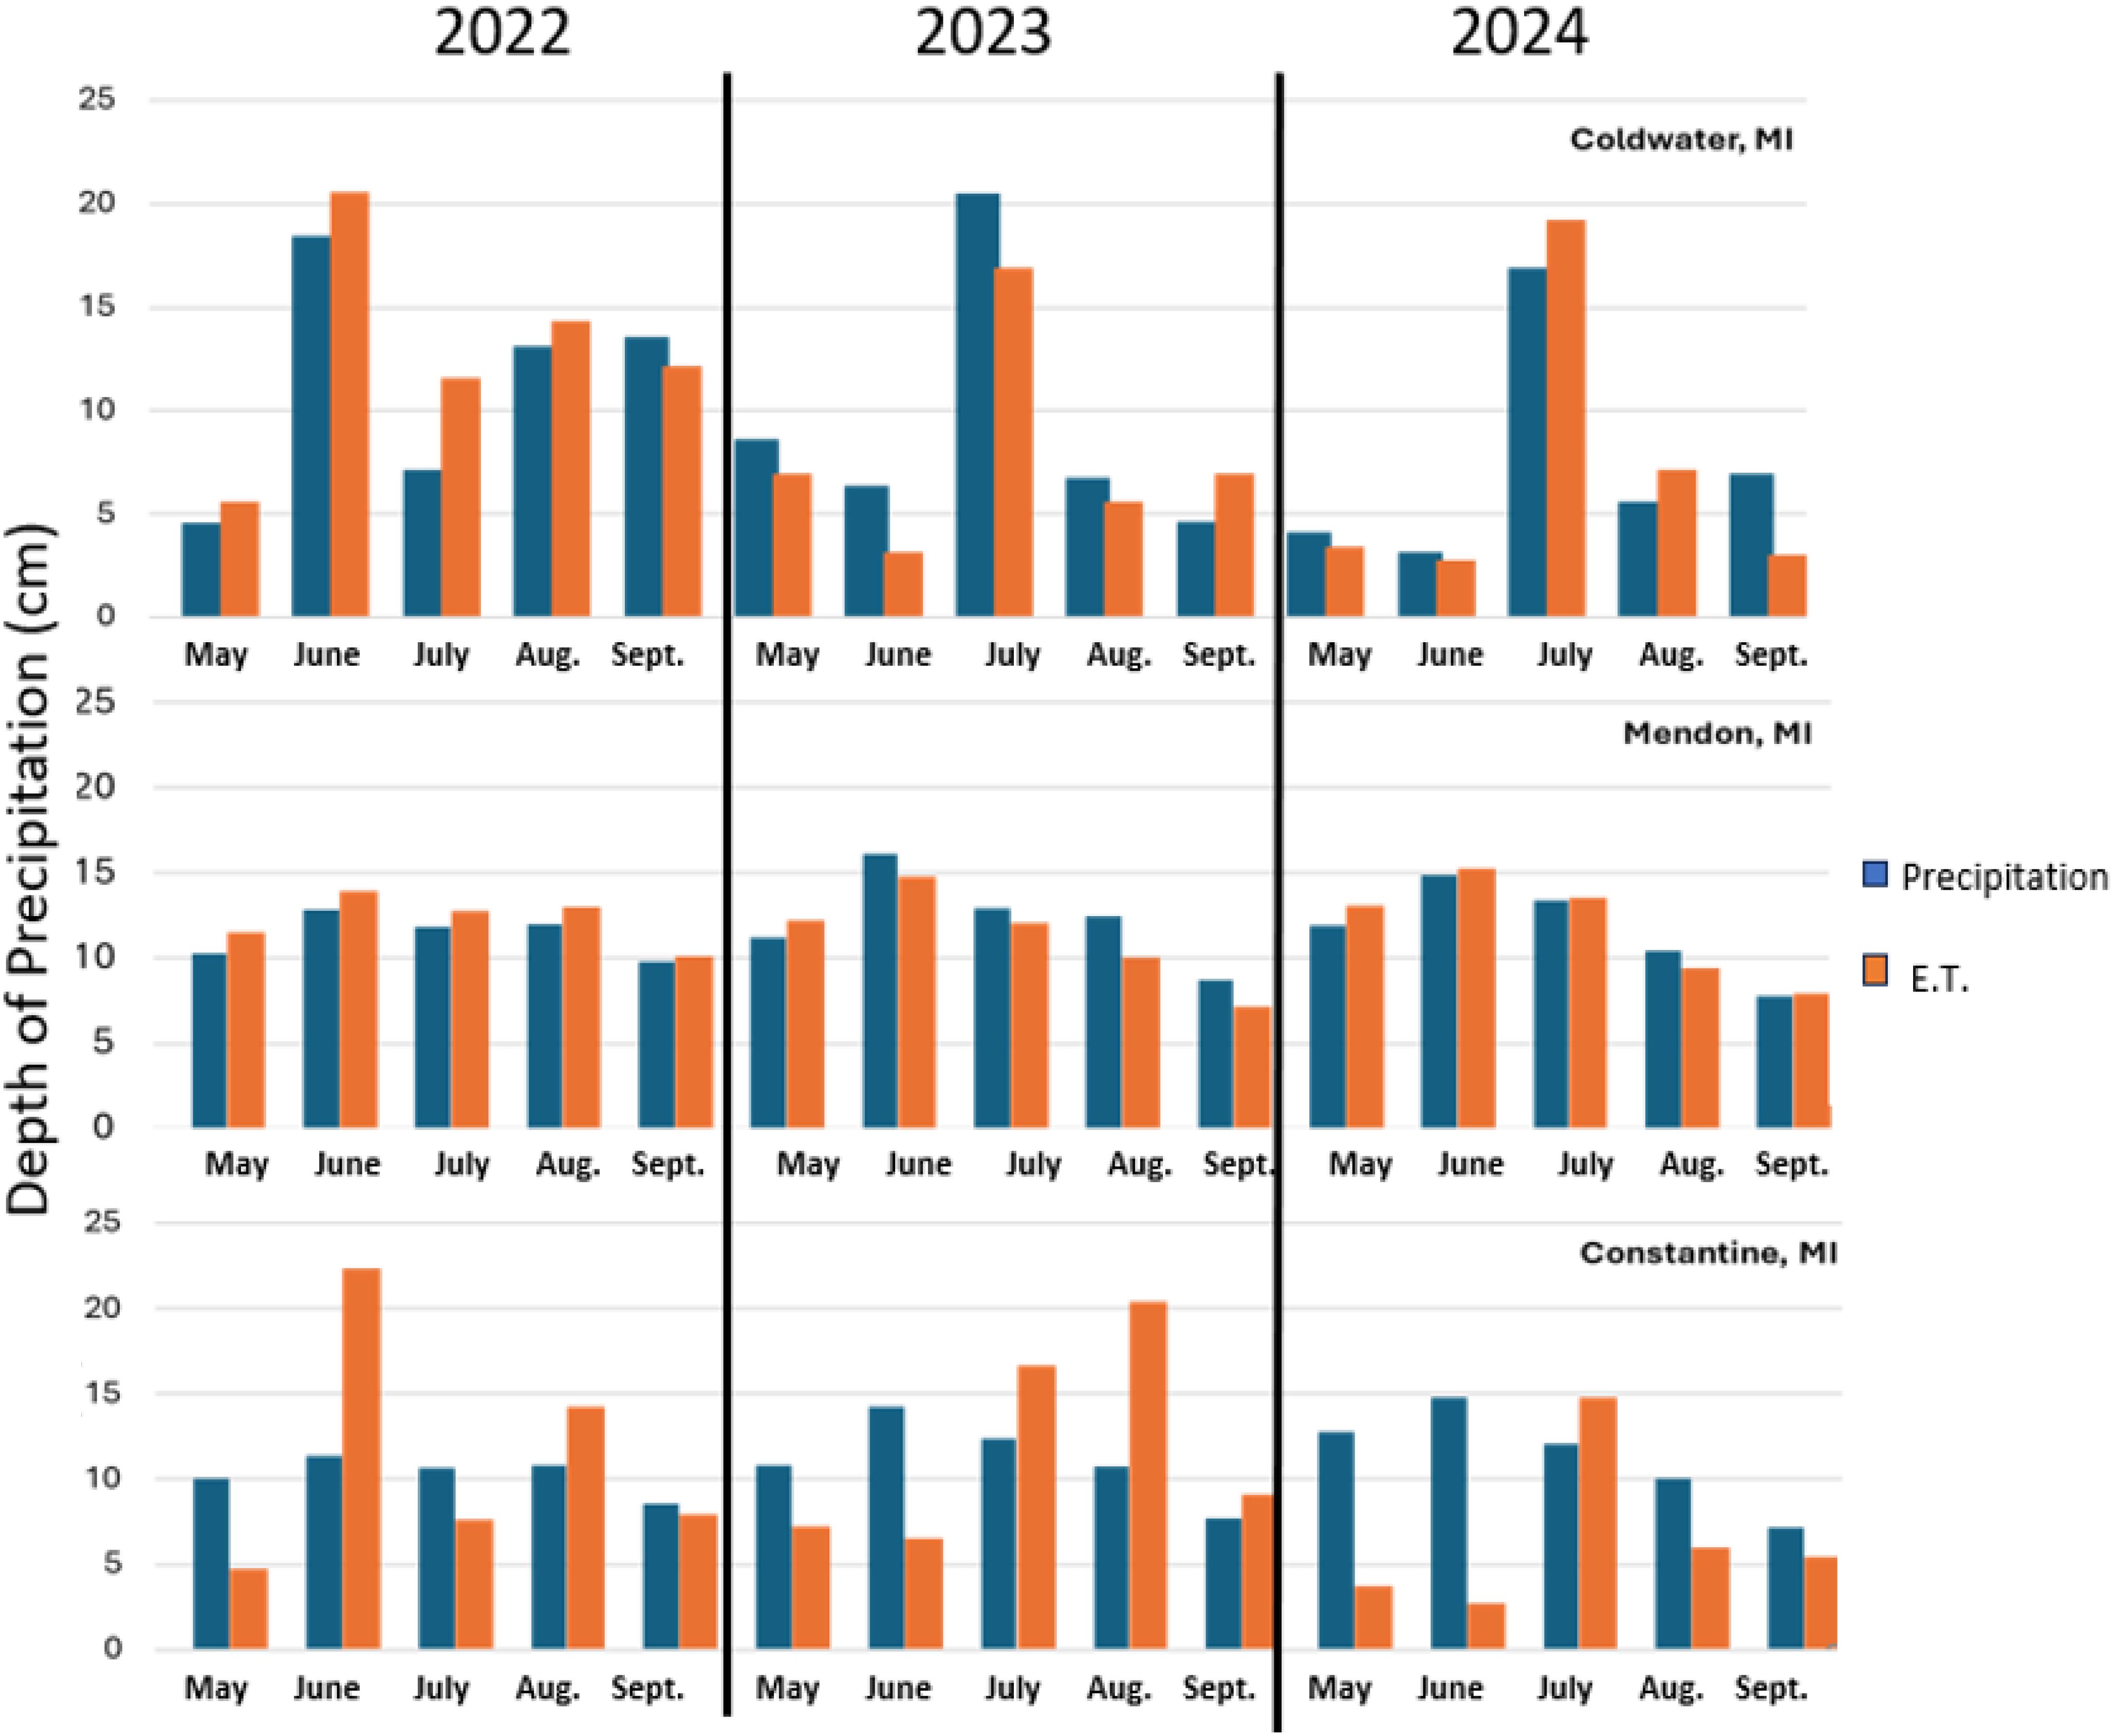
Figure 5. Growing season weather summary for Coldwater (Burlington and Union city sites), Mendon (Parkville site), and Constantine (Sturgis site). Data was collected from National Weather Service (National Weather Service, 2024).
3.2 On farm demonstration: yield and WUE
Comparisons between irrigated and non-irrigated yields are displayed in Figures 6 and 7 for all corn and soybean fields in this study. Corn yield data are summarized for all corn plots included in the study in Figure 6, with a p-value of 0.115. Conversely, when comparing the averages of all irrigated corn areas to those of the non-irrigated corn areas, differences are much weaker than in the soybeans. Figure 7 shows a trend favoring irrigated soybeans that are statistically differentiable at an alpha of 0.1, due to a p-value of 0.0589.
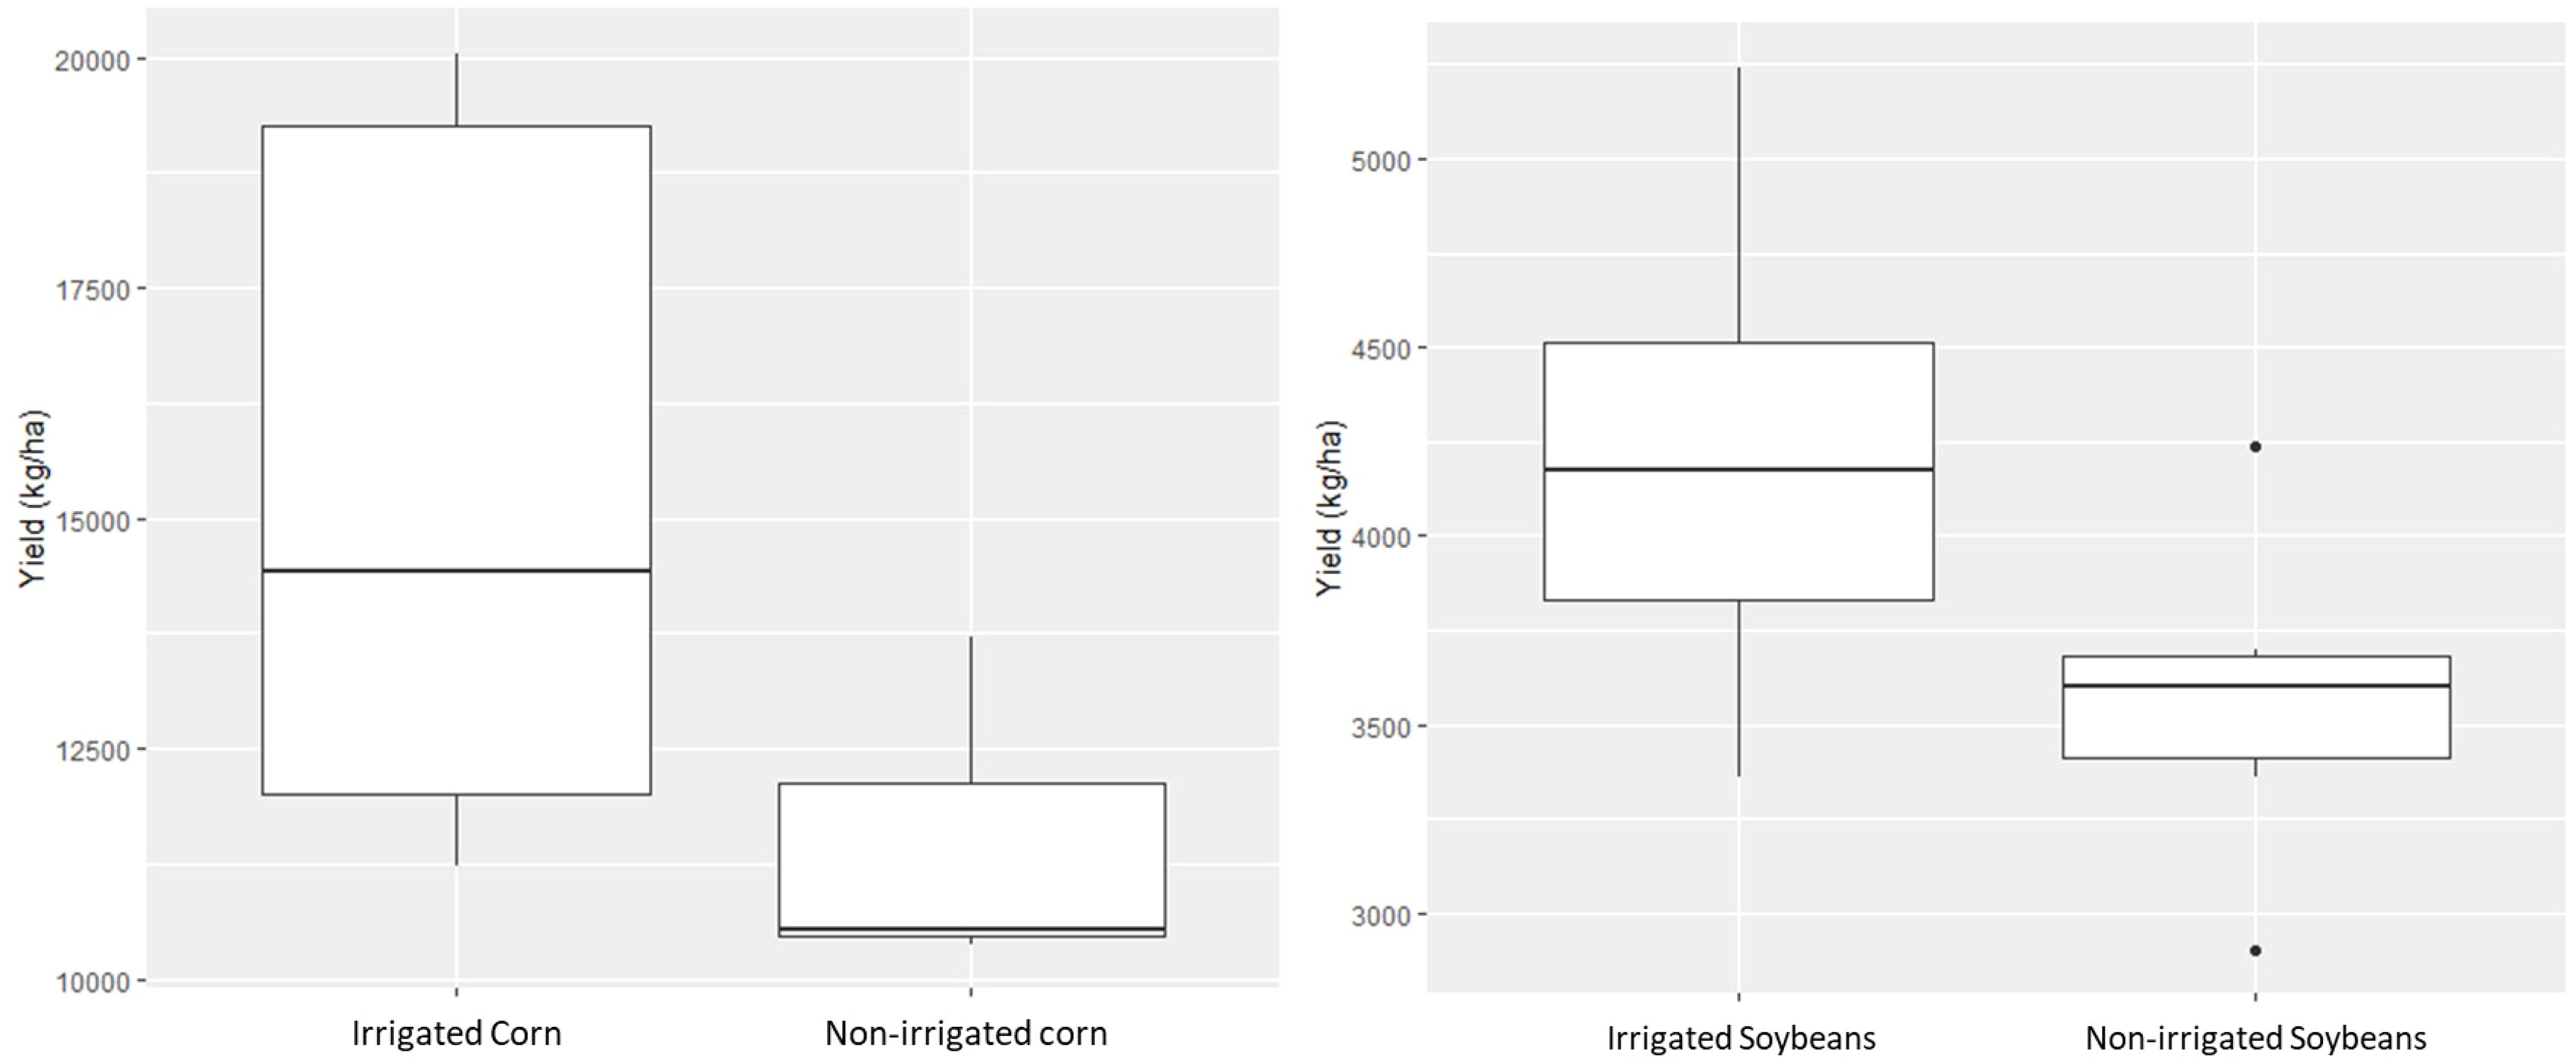
Figure 6. Comparison of yields between irrigated and non-irrigated treatment for corn (left) and soybeans (right) from 2021 to 2023.
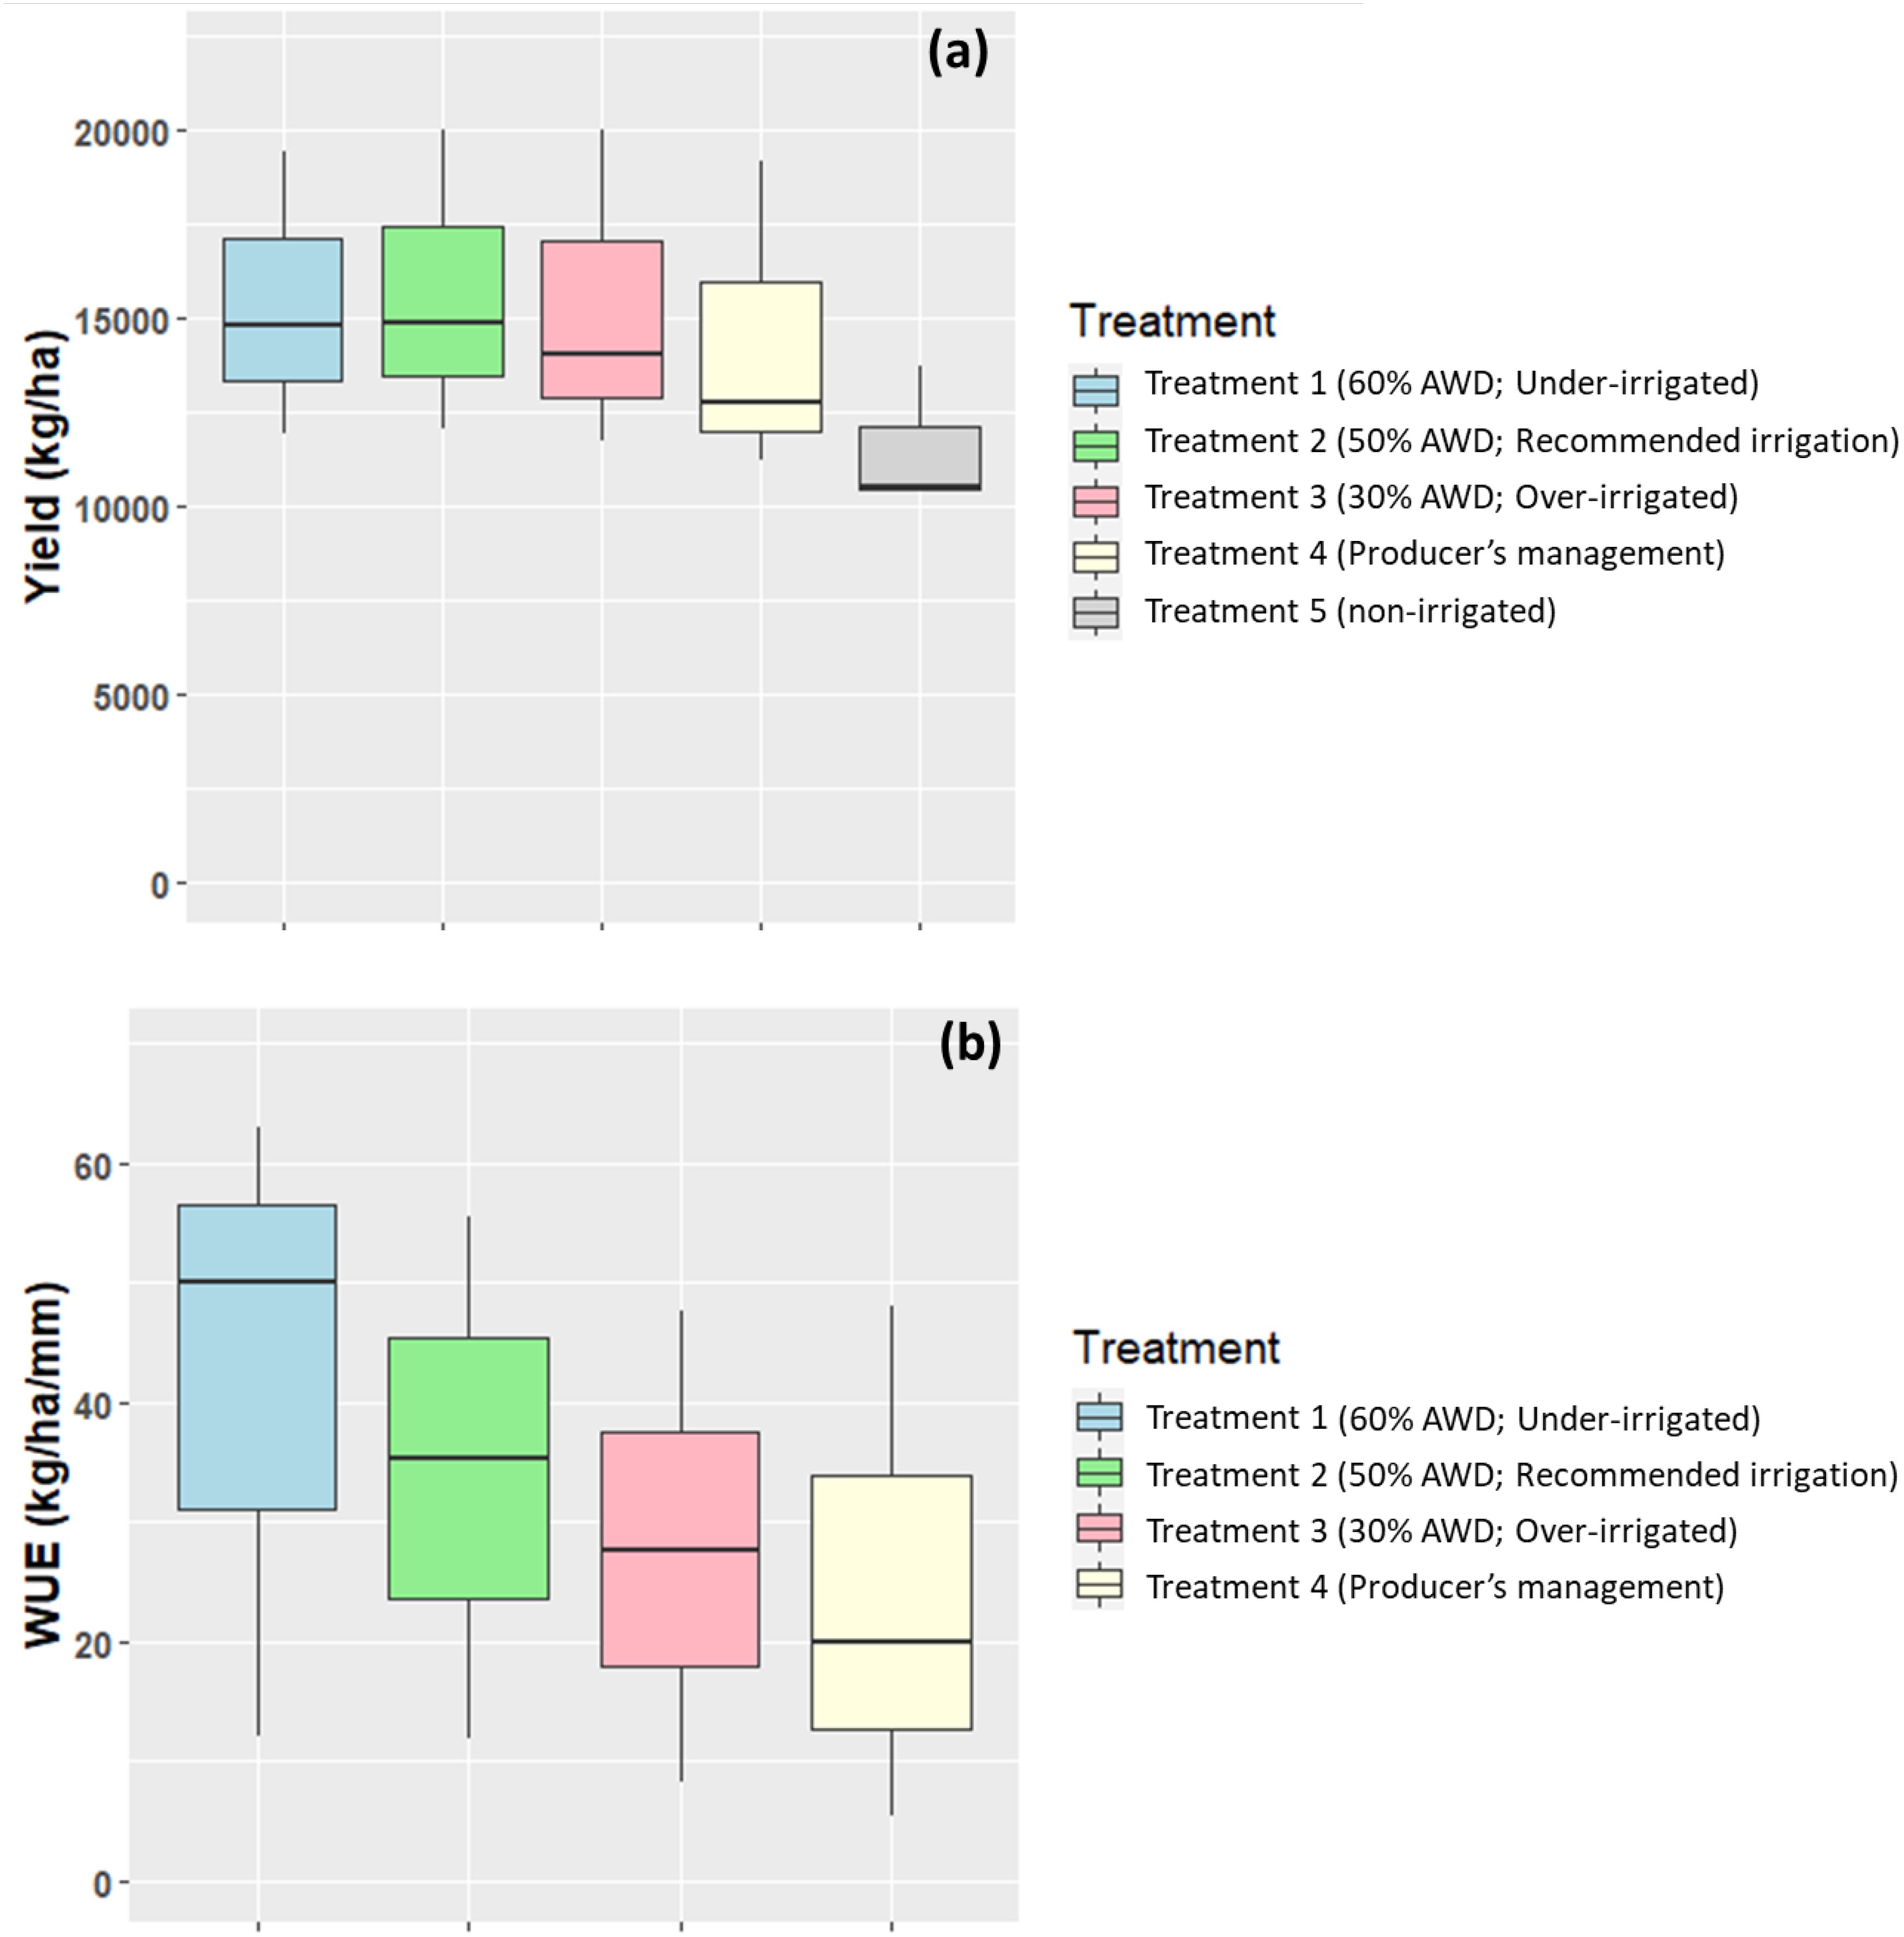
Figure 7. Summarized corn yields (a) and WUE (b) from all four demonstration sites over the three-year duration of the study. Crops were planted in rotation resulting in a total of five replications of the study.
Figure 7 shows the average corn yield and average WUE from all the demonstration fields over the duration of the study. Average corn yield was nearly identical for the under-, recommended, and grower’s treatment areas while the average of non-irrigated areas were lower than other treatments. WUE decreased as irrigation volume and frequency were increased in corn.
Soybean yield and WUE are summarized for all soybean plots included in the study. Figure 8 shows an average soybean yield and average WUE for 2021 to 2023. Yields were similar with the exception of the non-irrigated experimental treatment. WUE results follow a similar trend but include an increase in the upper range for the treatment 1 (60% MAD, under-irrigated) area and a decrease in the upper range for the treatment 3 (30% MAD, over-irrigated).

Figure 8. Summarized Soybean yields (a) and WUE (b) from all four demonstration sites over the three-year duration of the study. Crops were planted in rotation resulting in a total of six replications of the study.
Statistical analysis of average yield for all treatments using Tukey’s pairwise comparison methods were conducted. All of the compared treatment statistics resulted in P-values above the value of alpha (0.05). Statistical analysis showed a p-value of 0.112 for non-irrigated and treatment 2 (50% MAD; recommended irrigation) and a p-value of 0.08 for non-irrigated and treatment 3 (30% MAD; over-irrigated in soybean production.
3.3 Impact of irrigation and precipitation on yields
The relationship between water applications (irrigation and precipitation) on corn and soybean yields was observed. Figure 9 shows a slight upward trend in yield when irrigation and precipitation increase. Conversely, increased irrigation and precipitation in soybean production resulted in decreased soybean yields.
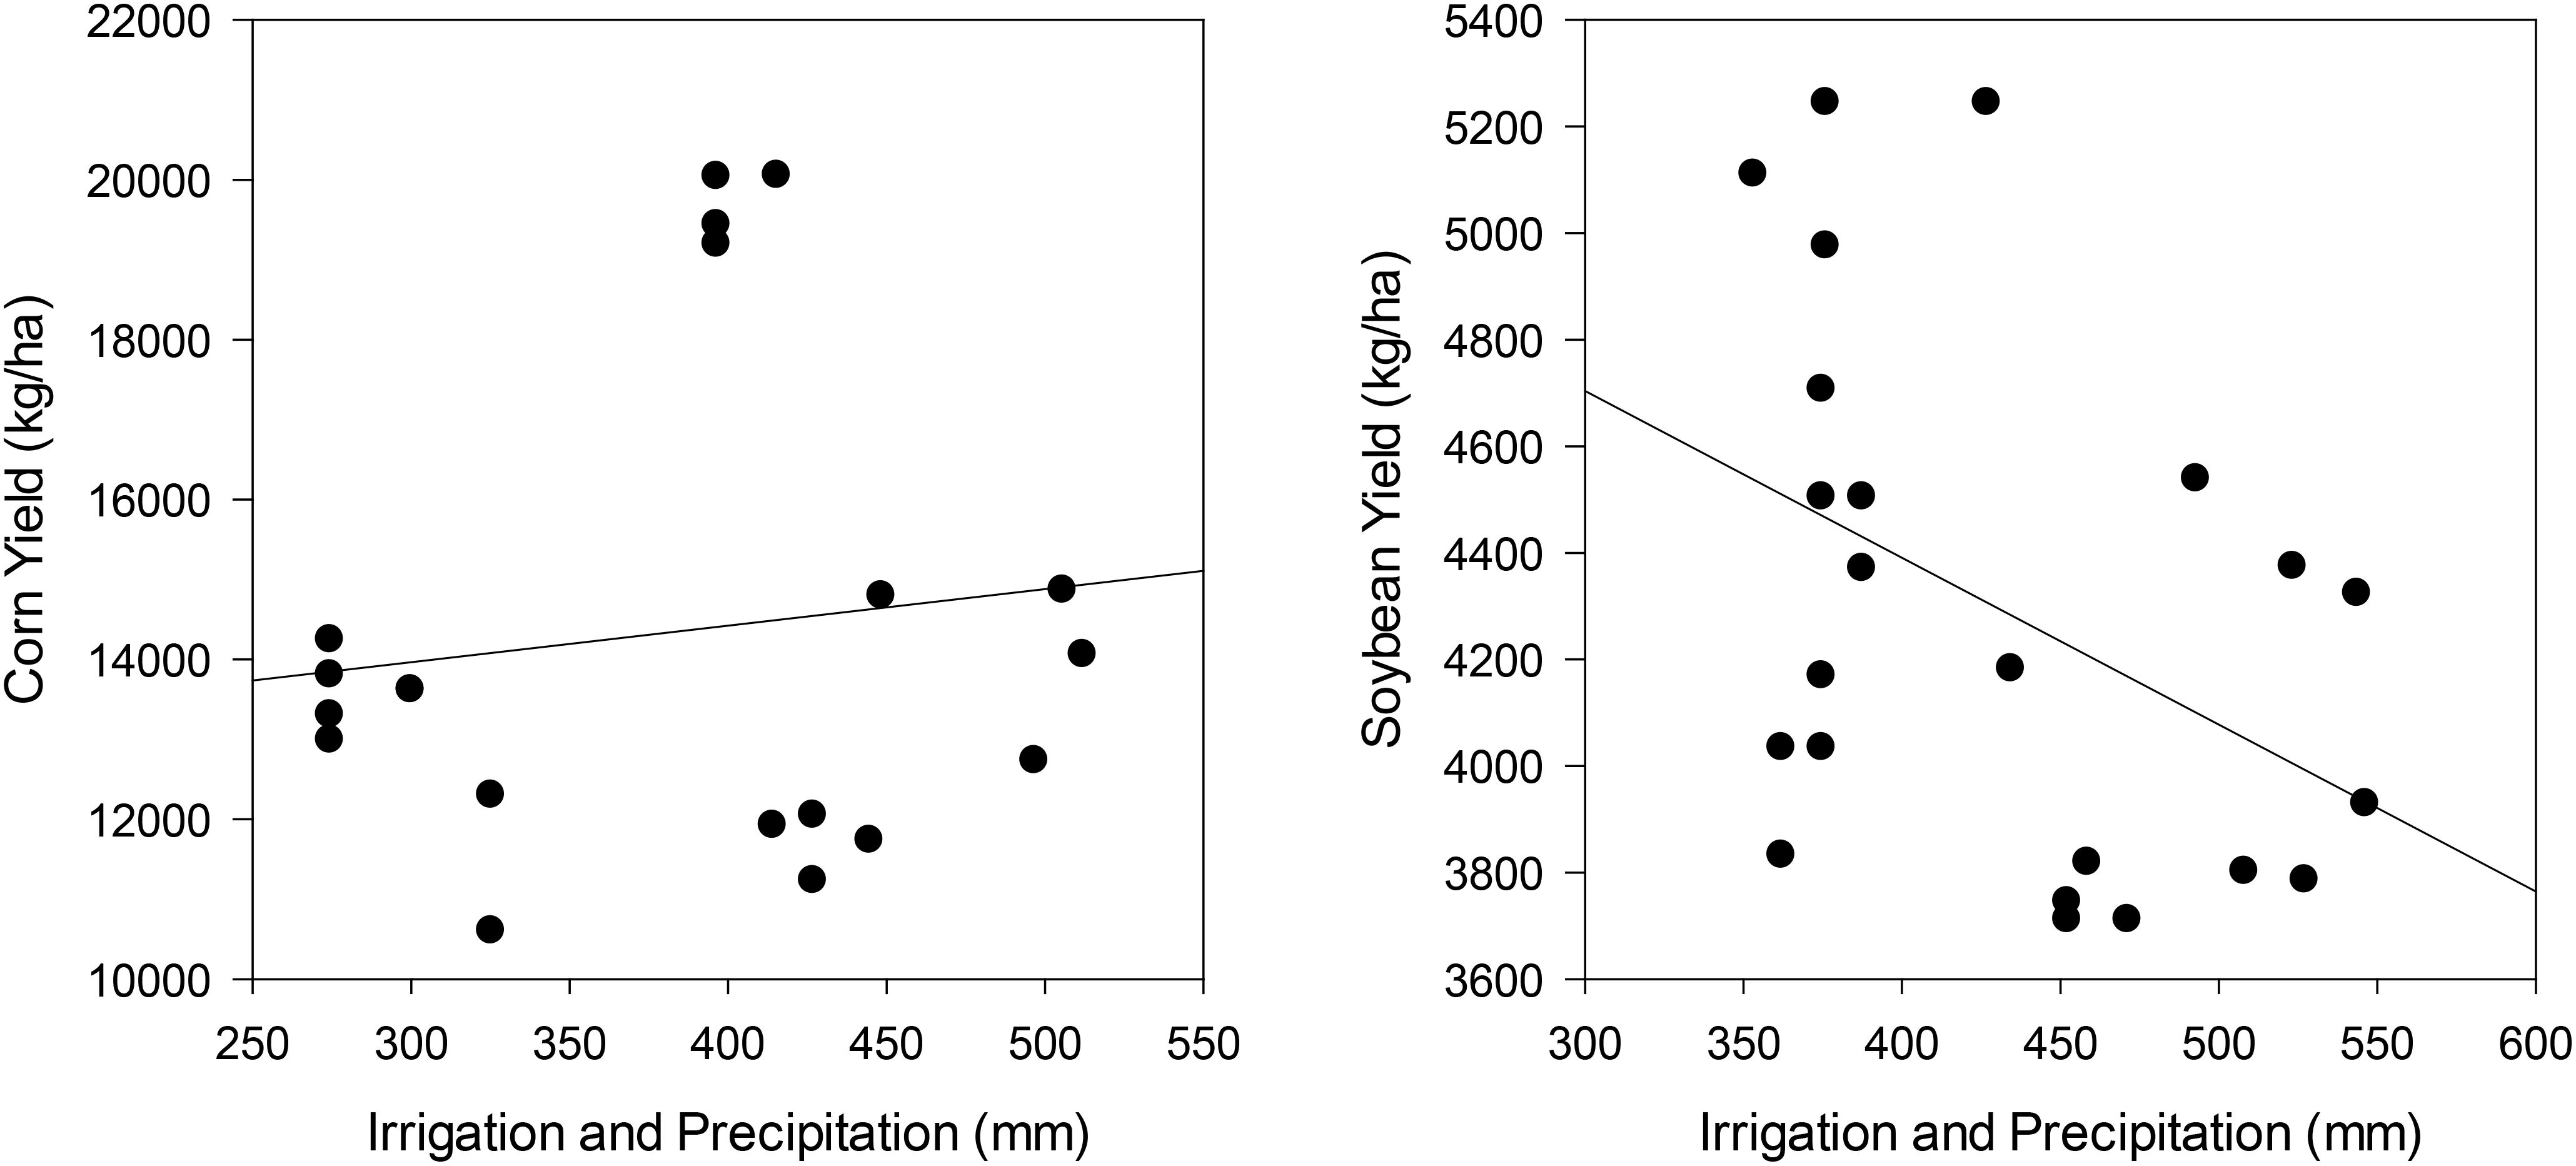
Figure 9. Relationship between water (irrigation and precipitation) and corn and soybean yields.
3.5 Economic analysis
The economics of the applied irrigation treatments are calculated on each treatment’s three-year average for all corn and soybean fields in the study. Tables 4 and 5 shows economics of irrigating corn and soybeans by treatment, respectively. Calculations account for the average corn value in 2023 which was 0.0349 United States Dollars (USD) per kilogram, the average soybean value in 2023 of 0.0985 USD per kg, average yield of each treatment, and either diesel or electric pumping costs (United States Department of Agriculture, National Agricultural Statistics Service, 2024). These calculations assume two different rates for operating wells and center-pivot irrigation systems: an electric rate of 0.36 USD per hectare millimeter and a diesel rate of 1.029 USD per hectare millimeter (United States Department of Agriculture, National Agricultural Statistics Service, 2024). The columns labeled cost (diesel and electric) reflect the expense of pumping and powering the irrigation system per millimeter of irrigation applied to each hectare. Whereas the columns labeled profit (diesel and electric) display the value of the crop produced per millimeter of irrigation applied to each hectare.
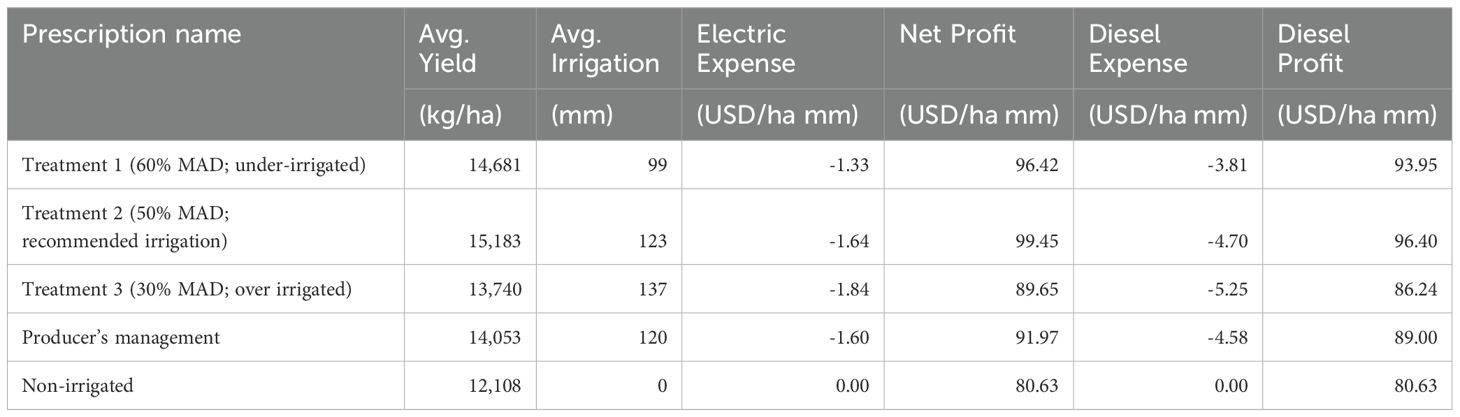
Table 4. Economics of irrigating corn by treatment.
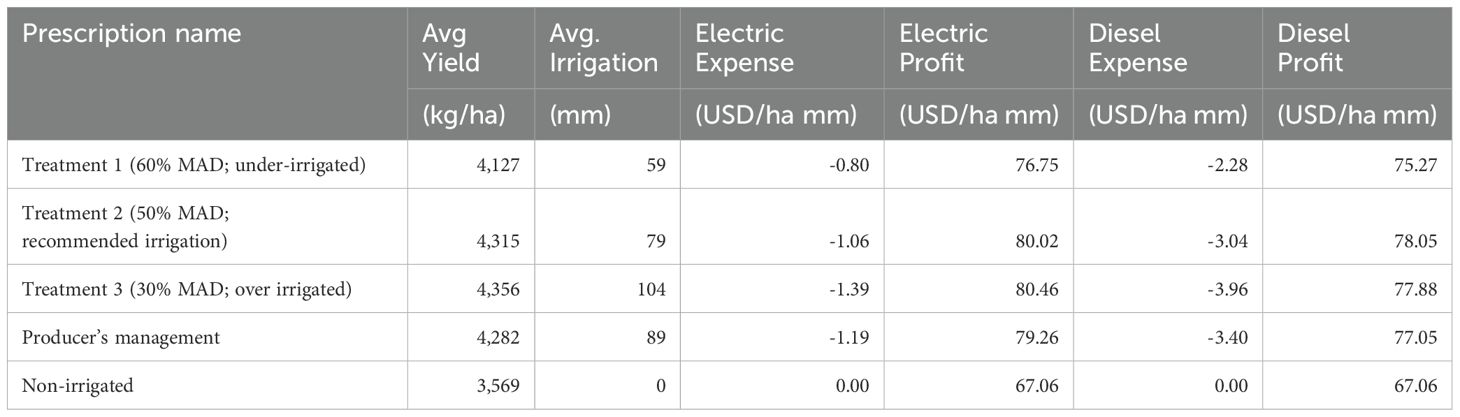
Table 5. Economics of irrigating soybeans by treatment.
4 Discussion
4.1 Effect of irrigation scheduling on WUE and yields
The efficient management of water resources in agriculture is paramount for sustainable crop production and environmental stewardship. The impact of irrigation scheduling on WUE, defined as the improvement in yield divided by the amount of irrigation applied, was investigated in this study. WUE between the treatments from corn (P-value = 0.607) and soybean (P-value = 0.962) fields were not statistically significant different. In theory optimized irrigation scheduling practices, including the timing and amount of water application, have the potential to influence crop water use and performance. By aligning irrigation practices with crop water requirements throughout the growing season, growers should be able to enhance soil moisture availability, promote optimal plant growth, and mitigate the risk of water stress-induced yield losses. The results in the boxplots of Figures 7 and 8 do not display a statistically significant difference between the irrigation application treatments. The low number of samples and relatively high variability of field conditions are suspected to be the causes of insignificance. Therefore, the P-values are not low enough to prove a statistical difference at an alpha value of 0.05.
Although the volume of precipitation Michigan receives is occasionally sufficient in terms of maximizing crop yield, it is rare that the timing of precipitation events aligns with the crop’s demands. Hence the need for irrigation to meet the needs of the crop between precipitation events. However, over the course of this three-year study precipitation supplied enough water to limit the number of irrigation applications that could be made under the experimental design described in Table 3. The relatively small volume applied to the treatment 2 (50% MAD; recommended irrigation) areas can be compared to the sum of each month’s precipitation. In years where more applications are required, there is a potential that results may differ from the trends observed in this study. In the case of the treatment 1 (60% MAD, under-irrigated), crop stress and evaporative losses incurred during the application of irrigation theoretically drive differences in yield and WUE. On the other hand, the treatment 3 (30% MAD, over-irrigated) experimental treatment should theoretically suffer in terms of water use efficiency due to the treatment’s increased total application volume and number of applications made. In both of these treatments, the critical factor driving a difference in water use efficiency is time under which precipitation is not sufficient, and irrigation may need to be applied. Every time a precipitation event fills the soil profile, there is a period in which all treatments are subject to the same conditions, reducing the opportunity for WUE to be impacted under this study’s experimental design. Additionally, the unusually high non-irrigated treatment area yields are also supportive of the idea that the impacts of the treatments were likely masked by frequent precipitation in the years of study. As seen in Figures 6, the non-irrigated areas were unusually similar to the irrigated areas, with the corn fields not displaying a strong statistical difference (P-value=0.115). Total precipitation may have been similar to the thirty-year average precipitation for this region, it can also be seen that this volume comes in consistent intervals during some seasons and sporadically in others. In this study, fields included in the data set had between one and eight irrigation applications as permitted by the methods, creating a large difference in potential for effect to take place.
A more noticeable difference is displayed when the volume of water applied is accounted for in the WUE equation as compared to this study’s yields. While none of the treatments indicate a statistically significant difference in terms of WUE at an alpha of 0.05, it is noticeable that the averages for the different experimental treatments are not as similar as the averages for yield. It may be apparent that the total irrigation volumes applied per treatment have more impact on the resulting WUE than the yields do since yields were quite similar. However, the response observed is not a linear trend, even at reasonable irrigation volumes and thresholds. While frequent and heavy precipitation might be the cause of similar results for the treatment 3 (30% MAD, over-irrigated) and treatment 2 (50% MAD; recommended irrigation) areas, the treatment 1 (60% MAD, under-irrigated) should have been favored by the experimental design. While it’s possible that there was little opportunity for the impact of the treatments to take effect, it is also possible that different treatments may have been more appropriate at different times throughout the growing season. While application volumes were adjusted in the early stages of crop development to better suit the crops needs and rooting depth, it is likely that different experimental treatments may have aligned with certain precipitation events at specific times throughout the growing season. In the ideal scenario, the soil moisture would drop to the irrigation threshold value, then triggering irrigation, and then irrigation would be applied filling the soil profile to field capacity. After irrigation, the soil profile would dry back down to the irrigation threshold at the time of precipitation, completing a full cycle of the process. Conversely other experimental treatments which did not align with precipitation events would likely require an additional irrigation application or loose the impact of remaining soil moisture provided by the initial application that was pushed below the root zone by precipitation. This lends to the concept that a more flexible approach to irrigation scheduling may be required to observe its full potential.
4.2 Challenges of weather on irrigation management in sandy soils
The challenges posed by weather on irrigation management in sandy soils are significant and multifaceted, particularly in the case of more intense and irregular precipitation events. Sandy soils have unique characteristics that influence water retention and drainage, making them especially vulnerable to the impacts of changing weather patterns. One of the key issues with sandy soils is their low water-holding capacity. Unlike clay or loam soils, which can retain moisture for longer periods, sandy soils drain quickly, which can lead to water stress for crops, especially during dry spells. However, when faced with intense or irregular precipitation events, sandy soils can become saturated rapidly, leading to increased runoff and leaching. This creates a challenge for irrigation management, as there is limited capacity to store precipitation. Sandy soil’s relatively low water holding capacity is also a benefit as it increases drainage, reducing the risk of flooding which affords producers more control over their field’s soil moisture than a heavier soil. Maintaining soil moisture at unnecessarily high levels is inefficient due to the soil’s low soil water storage capacity for potential precipitation, which could lead to an increased risk of runoff if storage is rapidly exceeded. Managing this excess water effectively without stressing the crop, wasting resources, and leaching valuable nutrients is a challenge, especially in humid climate regions. In regions experiencing more intense and irregular precipitation events, irrigation strategies must adapt to accommodate fluctuations while maintaining efficiency and practicality. This highlights the importance of selecting an irrigation volume and threshold that accounts for the soil characteristics, crop, and weather conditions. Additionally, these results lead to the implication that a more pliable irrigation scheduling method would be ideal.
Efficient irrigation management requires striking a delicate balance between utilizing precipitation and supplementing it with irrigation when necessary. This balance becomes increasingly difficult to achieve with erratic weather patterns. As seen in Figure 5, the area of this study has received an increasingly inconsistent amount of precipitation in recent years. The irrigation needed to improve yields and water use efficiency is typically infrequent and relatively small in volume as compared to the total demand for corn and soybeans grown in Michigan. This underscores the need for precise timing of each irrigation application and calculation of irrigation volume based on soil, crop, rooting depth, and forecasted precipitation.
Weather forecasting, especially the prediction of precipitation timing and volume, has been a historical challenge. It has been found that the reproductive stages of corn and soybeans are more sensitive to fluctuations in soil moisture, thus, this period contains the highest potential for irrigation to impact yield (Payero, 2009). While this study focused on adhering to the experimental design during the same critical stages, significant differences in WUE were not observed. This is likely due to the availability of soil moisture due to precipitation during critical stages and the smaller differences between experimental treatments utilized in this study. In Figure 9, corn and soybeans reacted differently to increasing combined volumes of irrigation and precipitation. Corn has a positive trendline indicating that increased irrigation and precipitation can increase yield under the right conditions in this area. This suggests that, for corn, additional water through either precipitation or irrigation can contribute positively to productivity, especially during periods of limited natural precipitation. In contrast, the relationship between water input and soybean yields was less straightforward. While some increase in water availability is generally beneficial, the data showed that excessive irrigation and precipitation were associated with reduced soybean yields. This counterintuitive trend may be attributed to waterlogging, overly saturated soil conditions, as well as frequent wetting, which can impair root development, promote plant diseases, and ultimately compromise overall plant health. Although disease presence was minimal or consistent between treatments in this study, it is possible that disease played a role that was not observed. For instance, a study on white mold suggests that soybeans have a disease severity index that increases with increasing total precipitation, when total precipitation in the month of July is between 20 mm and 108 mm (Fall et al., 2018). Overall, these findings underscore the importance of carefully managing irrigation strategies.
In another study where frequent and substantial precipitation took place during the growing season, statistically significant differences were observed between experimental treatments, allegedly due to a more pliable scheduling technique with more sophisticated weather forecasting (Mahdavi and Fujimaki, 2024). As described by methods of supplemental irrigation, efficient irrigation methods in the particular location of this study apply a volume just large enough to maintain soil moisture above the irrigation threshold until the next precipitation event. This may indicate that directly observing available water through the use of in situ soil moisture monitoring could be more advantageous than calculating the current available water as done in ET-based scheduling methods. Utilizing irrigation scheduling with the aid of soil moisture monitoring reduces potential errors in estimating current conditions while maintaining the best approach to forecasting the future conditions of the soil profile and crop’s needs. In a study with more strenuous water constraints, it was found that irrigation scheduling methods that combined multiple techniques were over 50% more effective than fixed interval and frequency applications (De Pascale et al., 2011). This study’s results, although not statistically differentiated, suggest the ideal volume is somewhere between applying just enough to maintain the soil moisture above the irrigation threshold until the time of the next precipitation event and applying a volume that does not exceed the water holding capacity of the profile at the time of the next precipitation event. Similar approaches to improving irrigation application timing and volume have been attempted using mathematical and observational methods for several decades with success (Stegman, 1983). How close one allows the soil moisture to get to the irrigation threshold and field capacity depends on one’s perceived values of water and crops as resources. It is likely that implementing irrigation scheduling methods and utilizing advanced monitoring technologies in conjunction has the potential to mitigate the impacts of weather variability on crop production and improve water use efficiency in sandy soil environments. Comparing the WUE of the grower’s methods in corn (Figure 7) to any of the other experimental treatments shows the potential of irrigation scheduling methods.
4.3 Impact of WUE on economics
As with any practice, the costs of irrigation must be outweighed by the benefits in order to justify making the investment in an irrigation application. One of the biggest obstacles to the adoption of irrigation management practices is a lack of cost effectiveness, even when water use efficiency is high (Koech and Langat, 2018). Tables 4 and 5 show that although the yields favor higher irrigation volume treatments, the average profits for both corn and soybeans support the treatment 2 (50% MAD; recommended irrigation) and treatment 1 (60% MAD, under-irrigated) treatment. In Michigan, 2,306 irrigation systems and wells are still powered by diesel (United States Department of Agriculture, National Agricultural Statistics Service, 2024). The price of operating diesel powered pumps and irrigation systems has increased dramatically in the last decade, for the calculations in this study diesel pumping cost is assumed at about 10 USD per hectare cm. Considering the recent increase in diesel prices, this is a conservative estimate that drives the economic choice to favor applications similar to the treatment 2 (50% MAD; recommended irrigation) or under irrigated treatment, even more so than the economics of electric power. Labor costs were not included in this calculation as all center pivots in this study were operated remotely. Additionally, the labor costs of center pivot irrigation per acre are generally low in comparison to improvements in profit. Likewise, the fixed costs of the center pivot, pump, and accompanying hardware were not included as they are assumed to be constant values across the different treatments. Even while only assessing the impact of pumping the water for irrigation and powering the center pivot itself, a calculation of the profit values from Tables 4 and 5, applied to a sizable field reveals the potential for thousands of dollars of impact between many of the treatments. Although economics are essential to making cost effective irrigation applications, they are far from the only value one should consider. In this study, significant differences in yield and WUE were not observed, thus there is little justification to apply more than what the treatment 2 (50% MAD; recommended irrigation) scheduling suggests. However, there is reasoning to apply more than the treatment 1 (60% MAD, under-irrigated) scheduling suggests, based on the economics and mitigation of risk to plant health. It is logical to buffer the system by applying a slightly larger volume of irrigation and maintain the soil moisture above the crops wilting point due to the unpredictability of climatic conditions, so long as the selected volume does not exceed the soil’s water holding capacity. There were multiple instances in this study where the peak demand of the crop landed on a dry spell, this caused the available water in the under irrigated area to quickly diminish due to the application volume not filling the profile. This led to far more frequent applications, which in a dry growing season could become costly and induce unnecessary stress on the crop.
4.4 Study limitations
This study covers three growing seasons and provides important insights into irrigation management under humid climate conditions, but several limitations should be acknowledged. The research was conducted within a limited geographic region in southwest Michigan, which may constrain the applicability of the findings to other locations with different environmental or agronomic conditions. Although data spanning multiple seasons enhance the temporal relevance of the results, variability in annual weather patterns, soil properties, and other uncontrolled environmental factors may have influenced treatment effectiveness and yield responses. Additionally, the number of replication sites and treatments was limited, reducing the statistical power to detect subtle but potentially meaningful differences among irrigation strategies. Further research with expanded geographic scope, increased replication, and controlled variability is needed to refine these findings and support broader generalization.
5 Conclusion
The efficient management of water resources in agriculture is crucial for ensuring sustainable crop production and environmental stewardship. In this study, the impact of irrigation scheduling and soil moisture monitoring were explored, with a focus on improving crop yields while minimizing water consumption. While statistically significant differences in yield were not observed among irrigation treatments, aside from irrigated as opposed to non-irrigated, the results underscored the importance of aligning irrigation practices with crop water requirements throughout the growing season.
Challenges posed by weather variability, particularly in sandy soil environments, highlighted the need for adaptive irrigation management approaches. The potential for irrigation scheduling and soil moisture monitoring is likely underestimated in this study as the number of irrigation applications was relatively low compared to an average year. The potential response in a drought year could be much more revealing as the effective treatment periods would be longer. Factors such as the volume and frequency of precipitation events, as well as soil characteristics, played significant roles in influencing the effectiveness of irrigation strategies. The economic implications of irrigation management were also examined, balancing the costs of irrigation against the benefits of improved yields and water use efficiency. While higher irrigation volumes tended to increase yields, the treatment 2 (50% MAD; recommended irrigation) and treatment 1 (60% MAD, under-irrigated) produced more favorable economic outcomes. Once again, this effect may be underestimated as the total volume of irrigation required in many instances was low.
This study emphasized the importance of selecting irrigation volumes and thresholds that account for soil characteristics, crop needs, and weather fluctuations, underscoring the necessity of a flexible and data-driven approach to irrigation management. Using a more flexible scheduling approach than the strict volumes and thresholds in this study is likely to further optimize irrigation water use efficiency, creating more observable responses to the irrigation treatments. Despite the lack of statistical differentiation, this study hints at the potential of in situ soil monitoring to prevent drought stress, conserve water and improve yield. Considering the relatively low number of successful replications and low level of opportunity to differentiate the experimental treatments according to the methods and weather, this technology and approach have merit.
6 Recommendations
Future research should extend across multiple growing seasons, particularly during drought years, to better capture the benefits of irrigation scheduling and soil moisture monitoring under stress conditions. Studies should also incorporate a wider range of soil types, crops, and more frequent irrigation treatments to better understand yield responses and water use efficiency. Integrating real-time weather data and predictive models into irrigation decisions could further improve outcomes. Policy efforts should support investment in precision irrigation technologies and expand access to soil moisture monitoring tools. Developing region-specific irrigation guidelines and offering incentives or cost-sharing programs can encourage broader adoption among growers. Strengthening research and extension services is also critical to promote effective water management practices. Adopting irrigation technology and strategies that respond to real-time soil moisture and weather data can reduce overwatering and enhance yields. Expanding access to practical decision-support tools and targeted education will be essential to encourage widespread adoption. Continued innovation in affordable monitoring technologies can also make precision irrigation more accessible for small- and mid-sized farms, promoting more sustainable and efficient water use across the agricultural sector.
Data availability statement
The raw data supporting the conclusions of this article will be made available by the authors, without undue reservation.
Author contributions
BK: Data curation, Formal Analysis, Investigation, Methodology, Visualization, Writing – original draft, Writing – review & editing. YD: Conceptualization, Funding acquisition, Project administration, Supervision, Visualization, Writing – review & editing. MC: Funding acquisition, Supervision, Writing – review & editing. ND: Writing – review & editing.
Funding
The author(s) declare that financial support was received for the research and/or publication of this article. This project was funded by United States Department of Agriculture Natural Resources Conservation Services (Project#NR213A750013G015) and the Michigan Soybean Commission.
Conflict of interest
The authors declare that the research was conducted in the absence of any commercial or financial relationships that could be construed as a potential conflict of interest.
Publisher’s note
All claims expressed in this article are solely those of the authors and do not necessarily represent those of their affiliated organizations, or those of the publisher, the editors and the reviewers. Any product that may be evaluated in this article, or claim that may be made by its manufacturer, is not guaranteed or endorsed by the publisher.
References
Allen R. G., Pereira L. S., Raes D., and Smith M. (1998). “Crop evapotranspiration: guidelines for computing crop water requirements,” in FAO Irrigation and Drainage Paper 56 (Agricultural Water Management). 14, 1, 4–20. doi: 10.1016/j.agwat.2014.07.031
Cheu S. and Gammans M. (2023). Irrigation Trends in Michigan (Michigan State University Department of Agricultural, Food, and Resource Economics).
De Pascale S., Dalla Costa L., Vallone S., Barbieri G., and Maggio A. (2011). Increasing water use efficiency in vegetable crop production: from plant to irrigation systems efficiency. Hort. Technol. 21, 301–308. doi: 10.21273/HORTTECH.21.3.301
Diaz-Perez J. C., Phene C. J., Morgan K. T., Smajstrla A. G., and Haman D. Z. (2008). Influence of irrigation scheduling on water use efficiency and yield of drip-irrigated cabbage. HortScience 43, 345–350.
Dibbern T., Romani L. A. S., and Massruhá S. M. F. S. (2024). Main drivers and barriers to the adoption of digital agriculture technologies. Smart. Agric. Technol. 8, 100459. doi: 10.1016/j.atech.2024.100459. ISSN 2772-3755.
Dong Y., Check J., Willbur J., and Chilvers M. (2023). “Improving irrigation and disease management in irrigated potato fields using ioT-based sensor technology,” in 2023 ASABE Annual International Meeting (American Society of Agricultural and Biological Engineers), 1.
Dong Y., Kelley L., and Miller S. (2020a). “Efficient Irrigation management with center pivot systems,” in Michigan State Extension Article E3439 (East Lansing, Michigan, USA). Available at: https://www.canr.msu.edu/irrigation/uploads/files/E3439_Efficient-Irrigation-Management-with-Center-Pivot-Systems.pdf) (Accessed April 17, 2024).
Dong Y., Kelley L., and Miller S. (2020b). Performance evaluation of soil moisture sensors in coarse- and fine-textured michigan agricultural soils. Agriculture 10, 598. doi: 10.3390/agriculture10120598
Dong Y., Werling B., Cao Z., and Li G. (2024). Implementation of an in-field ioT system for precision irrigation management. Front. Water 6. doi: 10.3389/frwa.2024.1353597
Fall M. L., Boyse J. F., Wang D., Willbur J. F., Smith D. L., and Chilvers M. I. (2018). Case study of an epidemiological approach dissecting historical soybean sclerotinia stem rot observations and identifying environmental predictors of epidemics and yield loss. Phytopathology® 108, 469–478. doi: 10.1094/PHYTO-12-16-0446-R
PubMed Abstract | PubMed Abstract | Crossref Full Text | Google Scholar
Food and Agriculture Organization (2002). The Importance of Irrigation in Agricultural Development. Available online at: http://www.fao.org/3/y4263e/y4263e00.htm (Accessed April 17, 2024).
Gao B. C. (2009). Remote sensing of vegetation health for watershed-scale monitoring. Int. J. Remote Sens. 30, 2275–2291.
Gao J., Zhang Z., Wei S., and Xiong J. (2021). Effects of rainfall intensity on runoff and nutrient loss of gently sloping farmland in a karst area of SW China. PloS One. 16 (3), e0246505. doi: 10.1371/journal.pone.0246505
PubMed Abstract | PubMed Abstract | Crossref Full Text | Google Scholar
Gleick P. H. (2000). The changing water paradigm: A look at twenty-first century water resources development. Water Int. 25, 127–138. doi: 10.1080/02508060008686804
Grafton R. Q., Williams J., Perry C. J., Molle F., Ringler C., Steduto P., et al. (2018). The paradox of irrigation efficiency. Science 361, 748–750. doi: 10.1126/science.aat9314
PubMed Abstract | PubMed Abstract | Crossref Full Text | Google Scholar
Hanjra M. A. and Qureshi M. E. (2010). Global water crisis and future food security in an era of climate change. Food Policy 35, 365–377. doi: 10.1016/j.foodpol.2010.05.006
Hatfield J. L., Boote K. J., Kimball B. A., Ziska L. H., Izaurralde R. C., Ort D., et al. (2011). Climate impacts on agriculture: implications for crop production. Agron. J. 103, 351–370. doi: 10.2134/agronj2010.0303
Holycross H. (2023). Increasing Crop Yield and Reducing Water Consumption with Precision Irrigation (Innovation Center, Michigan State University). Available at: https://innovationcenter.msu.edu/younsuk-dong-increasing-crop-yield-and-reducing-water-consumption-with-precision-irrigation/ (Accessed May 16, 2025).
Huang J., Gómez-Dans J. L., Huang H., Ma H., Wu Q., Lewis P. E., et al. (2019). Assimilation of remote sensing into crop growth models: current status and perspectives. Agric. For. Meteorol. 276–277, 107609. doi: 10.1016/j.agrformet.2019.06.008. ISSN 0168-1923.
Intergovernmental Panel on Climate Change (IPCC) (2014). Climate Change 2014: Impacts, Adaptation, and Vulnerability. Contribution of Working Group II to the Fifth Assessment Report of the Intergovernmental Panel on Climate Change (Chapter 7: Food Security and Food Production Systems, pp. 491-492). Available online at: https://www.ipcc.ch/site/assets/uploads/2018/02/WGIIAR5-Chap7_FINAL.pdf (Accessed April 17, 2024).
Irmak S., Kukal M. S., and Sharma K. (2022). Soil moisture heterogeneity and sensor deployment in uniformly managed field with unitextural soil. Agron. J. 114, 1800–1816. doi: 10.1002/agj2.21064
Irmak S., Odhiambo L. O., Kranz W. L., and Eisenhauer D. E. (2011). Irrigation efficiency and uniformity, and crop water use efficiency (EC732) (University of Nebraska–Lincoln Extension. © 2011, The Board of Regents of the University of Nebraska).
Koech R. and Langat P. (2018). Improving irrigation water use efficiency: A review of advances, challenges and opportunities in the Australian context. Water 10, 1771. doi: 10.3390/w10121771
Lobell D. B., Schlenker W., and Costa-Roberts J. (2009). Climate trends and global crop production since 1980. Science 333, 616–620. doi: 10.1126/science.1204531
PubMed Abstract | PubMed Abstract | Crossref Full Text | Google Scholar
Mahdavi S. M. and Fujimaki H. (2024). Optimization of irrigation depth considering weather forecast and water use efficiency in potato cultivation. Eurasian. Soil Sc. 57, 1261–1267. doi: 10.1134/S1064229324700297
Michigan Department of Agriculture and Rural Development (2020). Michigan agricultural Irrigation Practices. Available online at: https://www.michigan.gov/mdard/0,4610,7-125-1572_28248—,00.html (Accessed April 17, 2024).
National Weather Service (2024). NOAA Online Weather Data: Monthly Total Precipitation for Three Rivers, MI. Available online at: https://www.weather.gov/wrh/Climate?wfo=iwx (Accessed April 17, 2024).
Payero J. O. (2009). Effect of timing of a deficit-irrigation allocation on corn evapotranspiration, yield, water use efficiency and dry mass. Agric. Water Manage. 96, 1387–1397. doi: 10.1016/j.agwat.2009.03.022
Pinotech SoilWatch 10 Specifications. (2024). Available online at: https://www.pinotech.com/specifications (Accessed April 17, 2024).
Stegman E. C. (1983). “Irrigation Scheduling: Applied Timing Criteria,” in Advances in Irrigation, vol. 2 . Ed. Hillel D. (Elsevier) 2, 1–30. doi: 10.1016/B978-0-12-024302-0.50007-2
Taghvaeian S., Andales A. A., Allen L. N., Kisekka I., O’Shaughnessy S. A., Porter D. O., et al. (2020). Irrigation scheduling for agriculture in the United States: The progress made and the path forward. Trans. ASABE. 63, 1603–1618. doi: 10.13031/trans.14110
Tanny J., Harman C. J., and Brady J. (2015). Changing rates of evapotranspiration in response to climate change and land use in the midwestern United States. Hydrol. Earth Syst. Sci. 19, 2943–2961.
United States Department of Agriculture, National Agricultural Statistics Service (2012). Census of Agriculture. Available online at: https://www.nass.usda.gov/Publications/AgCensus/2012/ (Accessed April 17, 2024).
United States Department of Agriculture, National Agricultural Statistics Service (2017). 2017 Census Volume 1, Chapter 2: State Level Data. Available online at: https://www.nass.usda.gov/Publications/AgCensus/2017/Full_Report/Volume_1,_Chapter_2_US_State_Level/ (Accessed April 17, 2024).
United States Department of Agriculture, National Agricultural Statistics Service (2019). 2017 Census of Agriculture – 2018 Irrigation and Water Management Survey. Vol. 3, Special Studies Part 1. AC-17-SS-1.
United States Department of Agriculture, National Agricultural Statistics Service (2024). Agriculture Across Michigan: March 2024. Available online at: https://www.nass.usda.gov/Statistics_by_State/Michigan/Publications/Ag_Across_Michigan/2024/aam2403.pdf (Accessed April 24, 2024).
Wanyama J., Bwambale E., Kiraga S., Katimbo A., Nakawuka P., Kabenge I., et al. (2024). A systematic review of fourth industrial revolution technologies in smart irrigation: Constraints, opportunities, and future prospects for sub-Saharan Africa. Smart. Agric. Technol. 7, 100412. doi: 10.1016/j.atech.2024.100412
Keywords: irrigation, scheduling, humid climate, on-farm demonstration, corn, soybean
Citation: Kelley B, Dong Y, Chilvers MI and Das N (2025) Understanding the impact of irrigation scheduling on water use efficiency in corn and soybean production in humid climates: insights from on-farm demonstration. Front. Agron. 7:1496198. doi: 10.3389/fagro.2025.1496198
Received: 13 September 2024; Accepted: 08 May 2025;
Published: 30 May 2025.
Edited by:
Proloy Deb, International Rice Research Institute, IndiaReviewed by:
Fernando Campos Mendonça, University of São Paulo, BrazilPatrick Nyambo, Agricultural Research Council of South Africa (ARC-SA), South Africa
Abdelazim Negm, Zagazig University, Egypt
Copyright © 2025 Kelley, Dong, Chilvers and Das. This is an open-access article distributed under the terms of the Creative Commons Attribution License (CC BY). The use, distribution or reproduction in other forums is permitted, provided the original author(s) and the copyright owner(s) are credited and that the original publication in this journal is cited, in accordance with accepted academic practice. No use, distribution or reproduction is permitted which does not comply with these terms.
*Correspondence: Younsuk Dong, ZG9uZ3lvdW5AbXN1LmVkdQ==