 Gabriela Quinlan
 Sarah Goslee
- USDA-ARS Pasture Systems and Watershed Management Research Unit University Park, University Park, PA, United States
Introduction: Climate change is expected to alter environmental suitability for crops. In the United States, the Northern Great Plains (NGP), a primary production area for many crops including oilseeds, is at particular risk for decreasing cropland suitability under climate change. While canola (Brassica napus L.) has historically dominated oilseed production in the NGP, camelina (Camelinasativa L.) has been suggested as a potential climate-smart oilseed crop for the future due to agronomic attributes including drought tolerance, low input requirements, and cold hardiness.
Methods: In this study, we examine the viability of both camelina and canola under future climate scenarios by first defining theircurrent environmental niche and then projecting their potential distribution under two different carbon emission scenarios.
Results: While both crops are currently grown primarily in the NGP, we found that they have distinct spatial and environmental ranges, and that these ranges are largely consistent with what is described in the literature about their differing biological niches. We also find that under future climate change scenarios, environmental suitability for both crops is projected to decrease, though more so for canola.
Discussion: This study helps to identify specific regions that may experience shifts (positive or negative) in environmental suitability for growing canola and camelina, but more broadly sheds light on the nonstationary and shifting range suitability that might be expected for crops under climate change.
Introduction
Plant distributions are sensitive to the effects of climate change, including changes to temperature, precipitation, and increased carbon dioxide (CO2) levels (Bakkenes et al., 2002; Kelly and Goulden, 2008). Agricultural species are no exception (Leng and Huang, 2017; Ramankutty et al., 2002). Moreover, climate change impacts on other aspects of working lands, such as soil and water resources, are likely to exacerbate effects on agricultural productivity, food security, and the health and livelihood of rural communities (Gowda et al., 2018). Global estimates of cropland suitability under climate change have identified the North Central United States (US) as one of the most vulnerable cropping regions to changes in temperature and the US Great Plains as one of the most sensitive regions to changes in precipitation (Knapp et al., 2023; Ramankutty et al., 2002). These are established, highly productive cropping regions of the US, particularly for corn, soybeans, small grains, and oilseed crops (NASS, 2024). This highlights the need for adaptation strategies for farmers, such as the introduction of alternative crops that are better suited to new and projected environmental conditions (Howden et al., 2007).
Camelina (Camelina sativa) has been broadly lauded in recent decades by the scientific community and industry as a potential alternative oilseed crop to support a climate-smart crops future (Sydor et al., 2022). Camelina was historically grown in Europe and Russia until the 1940s when it was displaced by more productive oilseed crops like rapeseed (Brassica napus) (Ehrensing and Guy, 2021). Throughout the mid-20th century, efforts to breed oilseeds resulted in the production of new varieties, including canola during the 1970s (Brassica napus, B. rapa, B. juncea, though B. napus is primarily grown in the US today) (Phillips et al., 2001; Stefansson and Kondra, 1975). Since then, canola has continued to receive substantial agricultural research investment (Chen et al., 2005; Pavlista et al., 2011; Sparks, 1993) and has become one of the most widely cultivated crops in the Great Plains today (NASS, 2024; United States Department of Agriculture (USDA), 2015). However, the moisture requirements of canola are not well suited to the dryland conditions of parts of the Great Plains (Pavlista et al., 2012), and given projected changes to precipitation in this region, there is interest in alternative, more drought tolerant oilseed crops (Zanetti et al., 2021).
Compared to canola, camelina has been characterized as more drought and cold tolerant, better suited to marginal lands, lower input, and less susceptible to economic damage by pests and pathogens (Ehrensing and Guy, 2021; Kuzmanović et al., 2021; McVay and Lamb, 2008; Obour et al., 2015; Zanetti et al., 2021). Both of these Brassica crops (camelina and canola) have spring and winter varieties (Mirek, 1960), and when grown as winter cover crops can provide additional ecosystem services such as enhanced soil health (Obour et al., 2015; Weyers et al., 2019), spring weed suppression (Hoerning et al., 2020), and pollinator forage (Eberle et al., 2015). Camelina seed can be harvested for oil and shows promise for fuel, food, feed, and industrial applications (reviewed in: Sydor et al., 2022). Due to these attractive properties, camelina production expanded rapidly in the Northern Great Plains (particularly Montana) in the 2000s. However, low yields, lack of a robust market, and low profits have restricted more widespread adoption of camelina by farmers (Jewett, 2015; Obour et al., 2015). Expanded breeding efforts (Ehrensing and Guy, 2021; Obour et al., 2015) and incentives for biodiesel production (WAPMC, 2012) could ameliorate some of these effects.
Overall, there is a need to understand agricultural vulnerabilities exposed by climate change in order to proactively plan interventions and implement policies for a climate smart future (Rosenberg, 1992). In this study, we assess the current environmental niche of camelina and canola within the US and project how the distributions of these crops may shift under projected climate change scenarios. We contrast the current established ranges of these crops with what is suggested in the literature about their respective niches and discuss opportunities for changes to region-specific agriculture in the near future (50 years).
Methods
Crop and environmental variable data
Land use data for camelina and canola were obtained from the National Agricultural Statistics Service Cropland Data Layer (CDL), which has 30 m resolution (USDA NASS, 2024). We obtained data for the five most recent available years at the time of this study (2019-2023) and created a raster mosaic to summarize the maximum range of either crop across the US over these 5 years. All data analysis and visualization were completed in R version 4.4.0 (R Core Team, 2024).
Annual Downscaled Climate Projections for the US, originally published in Pearson et al. (2014) was accessed via NASA Center for Climate Simulation (nccs.nasa.gov). This data has been downscaled to 800 m spatial resolution, has a temporal range of 2010-2100, an annual temporal resolution, and is provided for two different greenhouse gas emissions scenarios: a reference/high-CO2 concentration of 750 ppm scenario (WRE) and a policy/stabilization at 450 ppm scenario (LEV). These predictions were developed based on the MAGICC/SCENGEN framework (UCAR, 2007) developed in the IPCC Fourth Assessment Report (IPCC, 2024) and use an ensemble of five atmosphere-ocean general circulation models (Fordham et al., 2012; Pierce et al., 2009). We selected 11 bioclimatic variables (isothermality, annual precipitation, annual mean temperature, and precipitation and mean temperature of the wettest, driest, warmest, and coldest quarters). Quarterly climate data provide seasonal granularity, which is important for modeling land use suitability for crops across their lifecycles. Moreover, by parameterizing data by seasonally relevant terms (e.g., coldest quarter) rather than set, three-month periods, these quarters can vary by location and are thus more biologically relevant. These bioclimatic variables are commonly used to model species distributions (Busby 1991; Booth et al., 2014) and responses to climate change (O’Donnell and Ignizio, 2012). To ensure internal consistency across climate variables in both spatial resolution and interpolation method, we used these projections to describe both the current (2019-2023) and future (2069-2073) climate conditions. Previous studies find that the ensemble of models used to create these estimates effectively reproduces recent climate observations (Fordham et al., 2012).
Data on soil productivity (Schaetzl et al., 2012) and soil drainage (Schaetzl et al., 2009) was accessed via the USDA Forest Service forest health data repository. Each of these layers has a spatial resolution of 240 m. The soil Productivity Index (PI) is an ordinal index developed by Schaetzl et al. (2012) that uses family-level soil taxonomy information along with modifiers to assign a value from 1 to 19, with 19 representing the most productive soils. The PI has been shown to be strongly correlated with crop productivity (Schaetzl et al., 2012). The soil Drainage Index (DI) is based on work by Hole (1978); Hole and Campbell (1985), and Schaetzl (1986) and is likewise an ordinal index. It quantifies long-term soil wetness, that is, “the quantity of water that soil contains and makes available to plants under normal, long-term climatic conditions” (Schaetzl et al., 2009). It is based on the water table depth and the volume of soil available for rooting. DI values range from 0 (impervious surface) to 99 (open water), with higher values representing soils that are more capable of supplying more water to plants. These indices are temporally static.
The distribution of managed species is influenced by both environmental and socioeconomic factors. While projected environmental conditions (e.g., precipitation and temperature) are somewhat predictable, socioeconomic drivers are influenced by a multitude of factors and thus more difficult to forecast (Lant et al., 2016). Therefore, for our model, we have decided to focus entirely on environmental suitability. This assumes that the socioeconomic factors (e.g., markets, processing facilities) impacting the current distribution of either crop are independent of environmental factors. While excluding socioeconomic factors is certainly a limitation of this study (see Discussion), it also allows for the possibility of socioeconomic adaptations (technology, policy, etc.) that could support agile expansion of either crop into new, environmentally suitable regions.
Crop niche
Each of these data layers was read into R using the raster package (Hijmans, 2023). We extracted environmental data (i.e., climate and soils data, described above) for the locations where each crop was grown between 2019–2023 under either scenario using the exactextractr package (Baston, 2023). Data were averaged across years, and we calculated the standard deviation, mean, and median of these environmental values. To understand how the environmental niches of the two crops differ, we used t-tests to compare the distribution of environmental conditions between crops for the current period 2019-2023. Because the estimates for the current period were nearly identical for the two climate change scenarios (Supplementary Figure S1), we present only the results from the LEV scenario when describing environmental niche.
Crop suitability
To estimate current and projected crop suitability, we first summarized the environmental niche distributions using empirical cumulative distribution functions (ECDFs). For visualization purposes, we estimate and plot crop suitability across a hexbin surface for the conterminous US, created using the sf package (Pebesma, 2018; Pebesma and Bivand, 2023). These maps comprise 72,406 full (approximately 110 km2) or partial hexbins.
Using the ECDFs, we estimated crop suitability by calculating probability (area under the curve) for each hex value (environmental values, averaged across hex area) ± 1 standard deviation (Figure 1; see Crop niche above). Environmental variables with low probability (< 20%) of supporting each crop were designated as limiting factors. This cutoff was intended to represent conditions that may be too far outside of a “goldilocks zone,” where it might be impractical to overcome an environmental limitation via agronomic intervention. We chose this cutoff after visualizing the probability distributions and assessing alternative thresholds (0%, 50%, 75%; data not shown). Then, to determine crop suitability across the US, we took the average probability across all 13 environmental variables, treating the limiting environmental factors as having zero probability. We did this for each crop, climate scenario, and time period and calculated the change in environmental suitability as the difference in hexbin value between the two time periods (2019-2023; 2069-2073) under each climate scenario. For visualization purposes, we present only the LEV scenarios when mapping suitability (Figures 2, 3). A full version of future suitability estimates (Figure 3) is available in the Supplement (Supplementary Figure S2), but a full version of current estimates (Figure 2) is not shown, given the high correlation between scenarios. When plotting time comparisons, we use estimates from the same scenario for consistency (Figure 4; i.e., LEV vs. LEV and WRE vs. WRE).
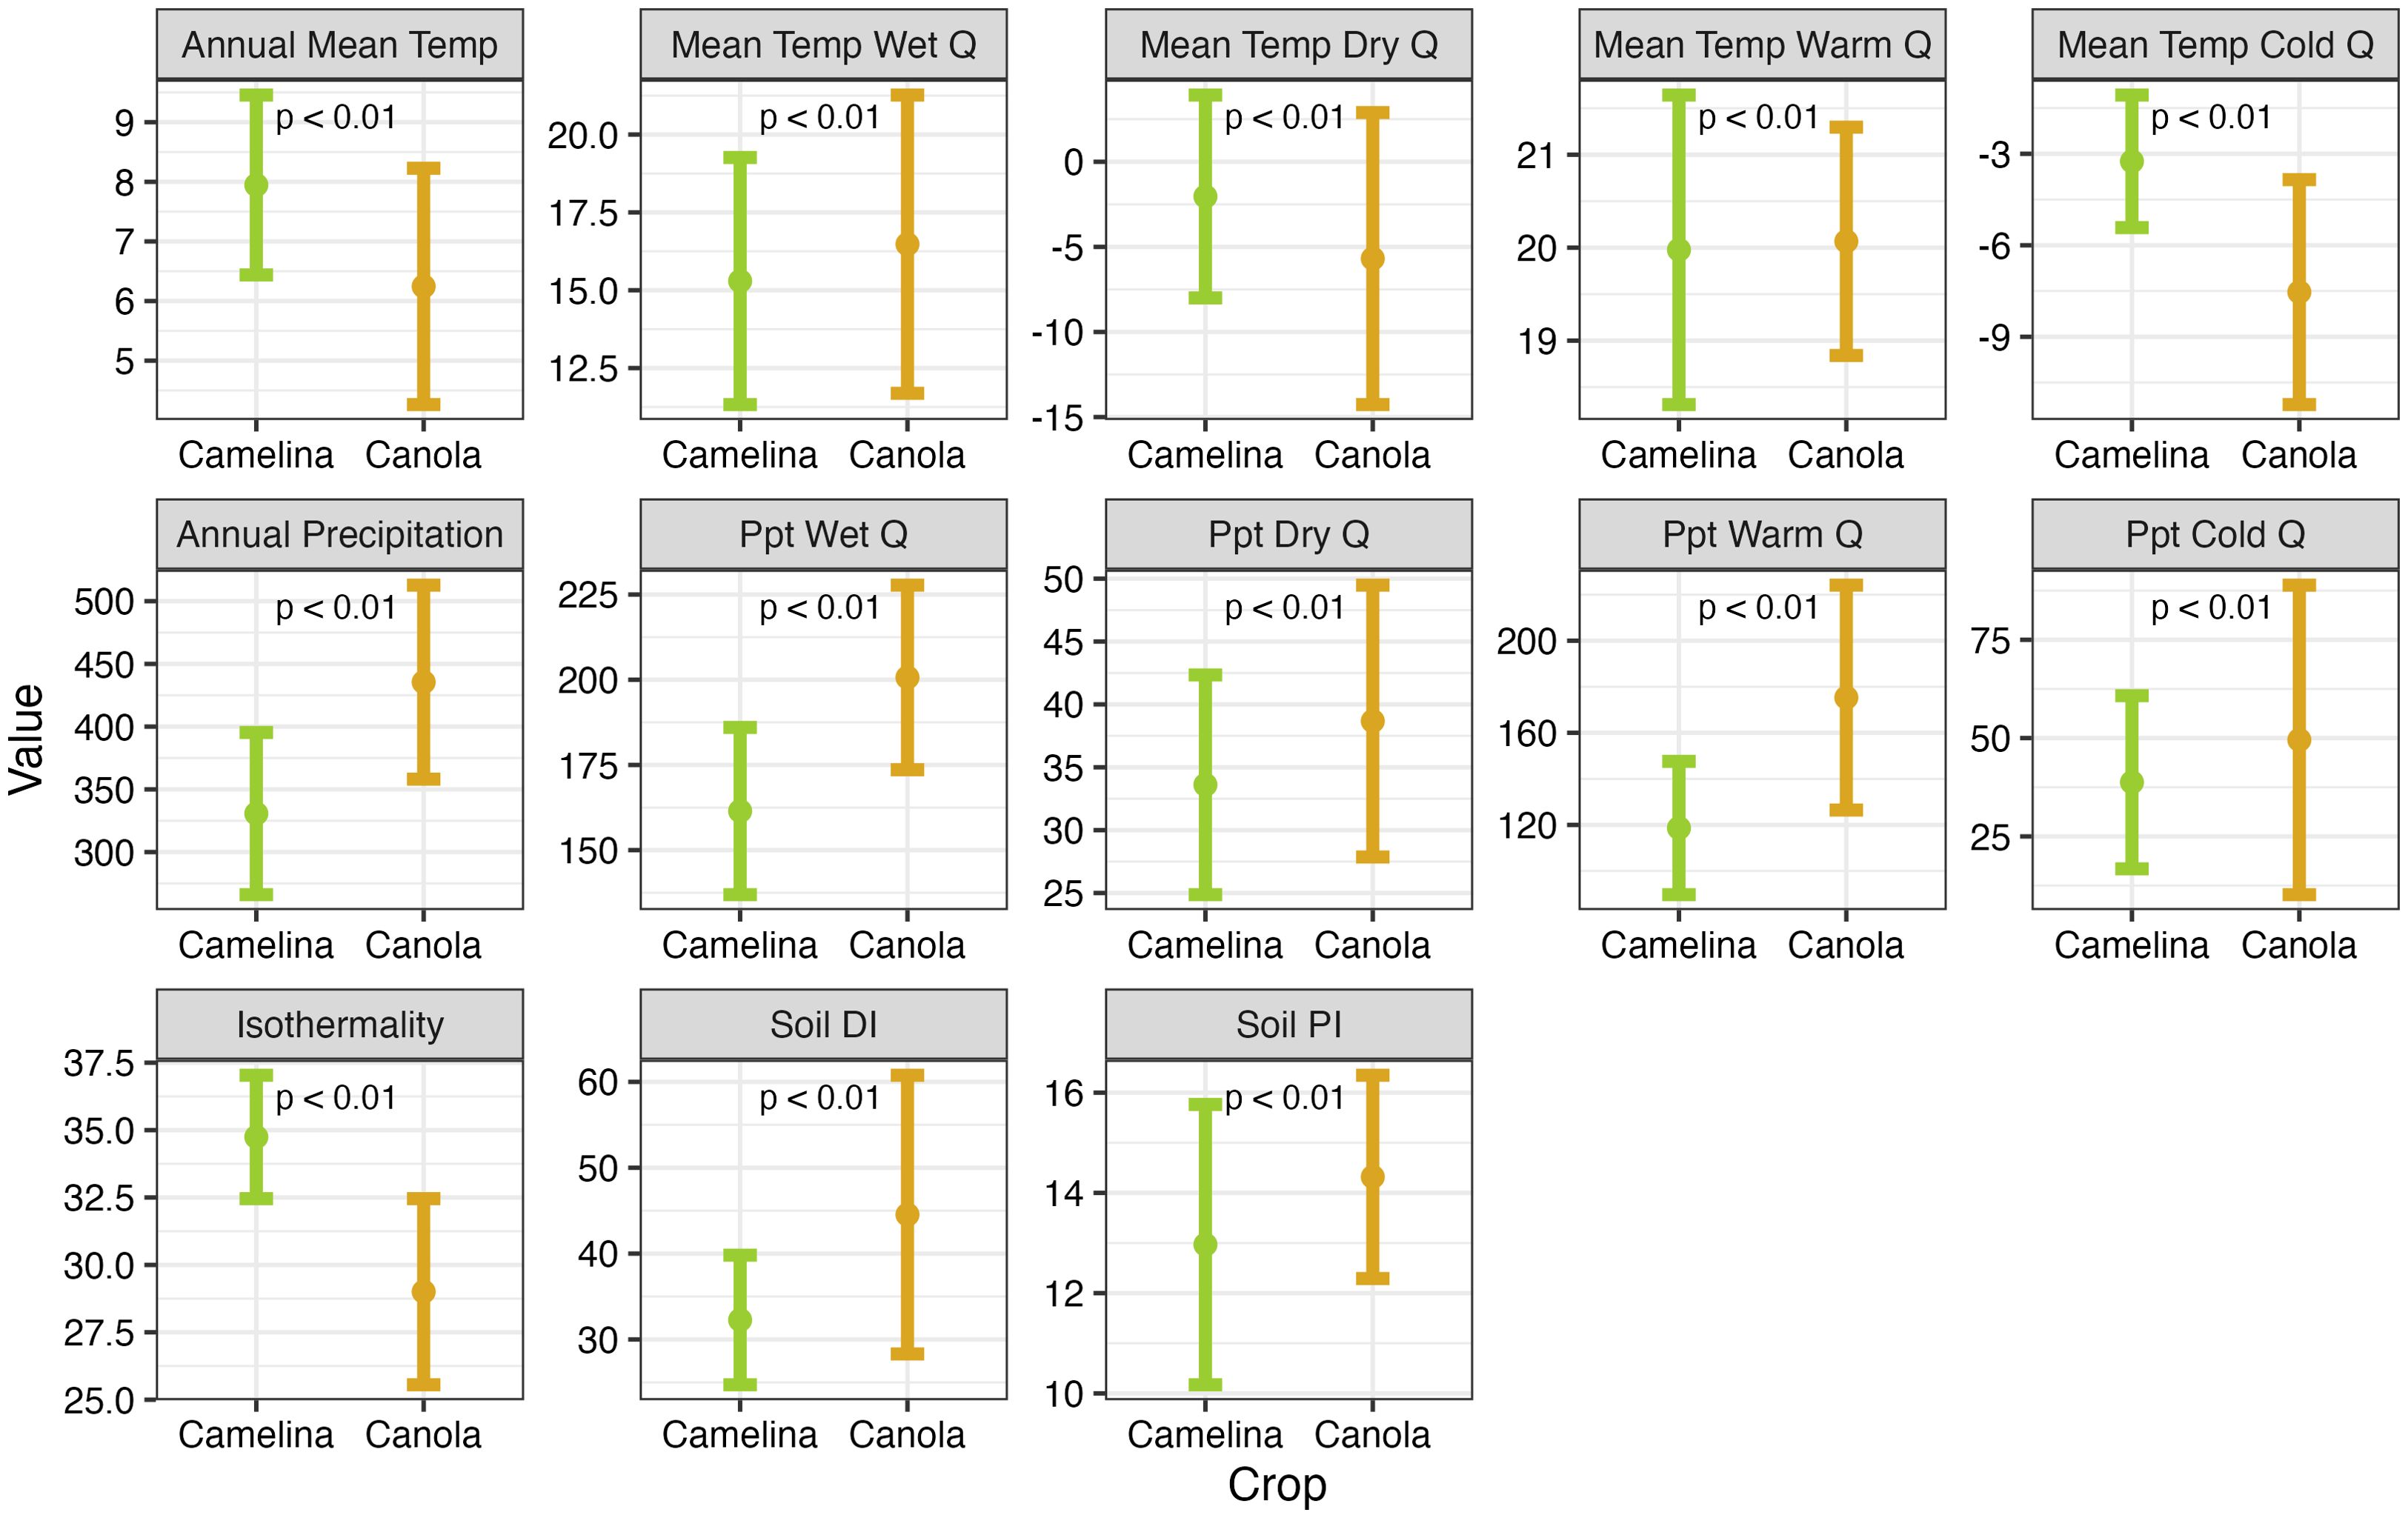
Figure 1. Point-range plots (mean ± 1 standard deviation) showing differences in the environmental conditions where canola and camelina are currently (2019-2023) grown in the US. Each crop’s relationship to the listed climate variables is based on data from a scenario where CO2 emissions stabilize at 450 ppm. The soil Productivity Index and Drainage Index are ordinal indices, isothermality is shown as a percentage, temperature variables are shown in degrees Celsius, and precipitation is shown in millimeters.
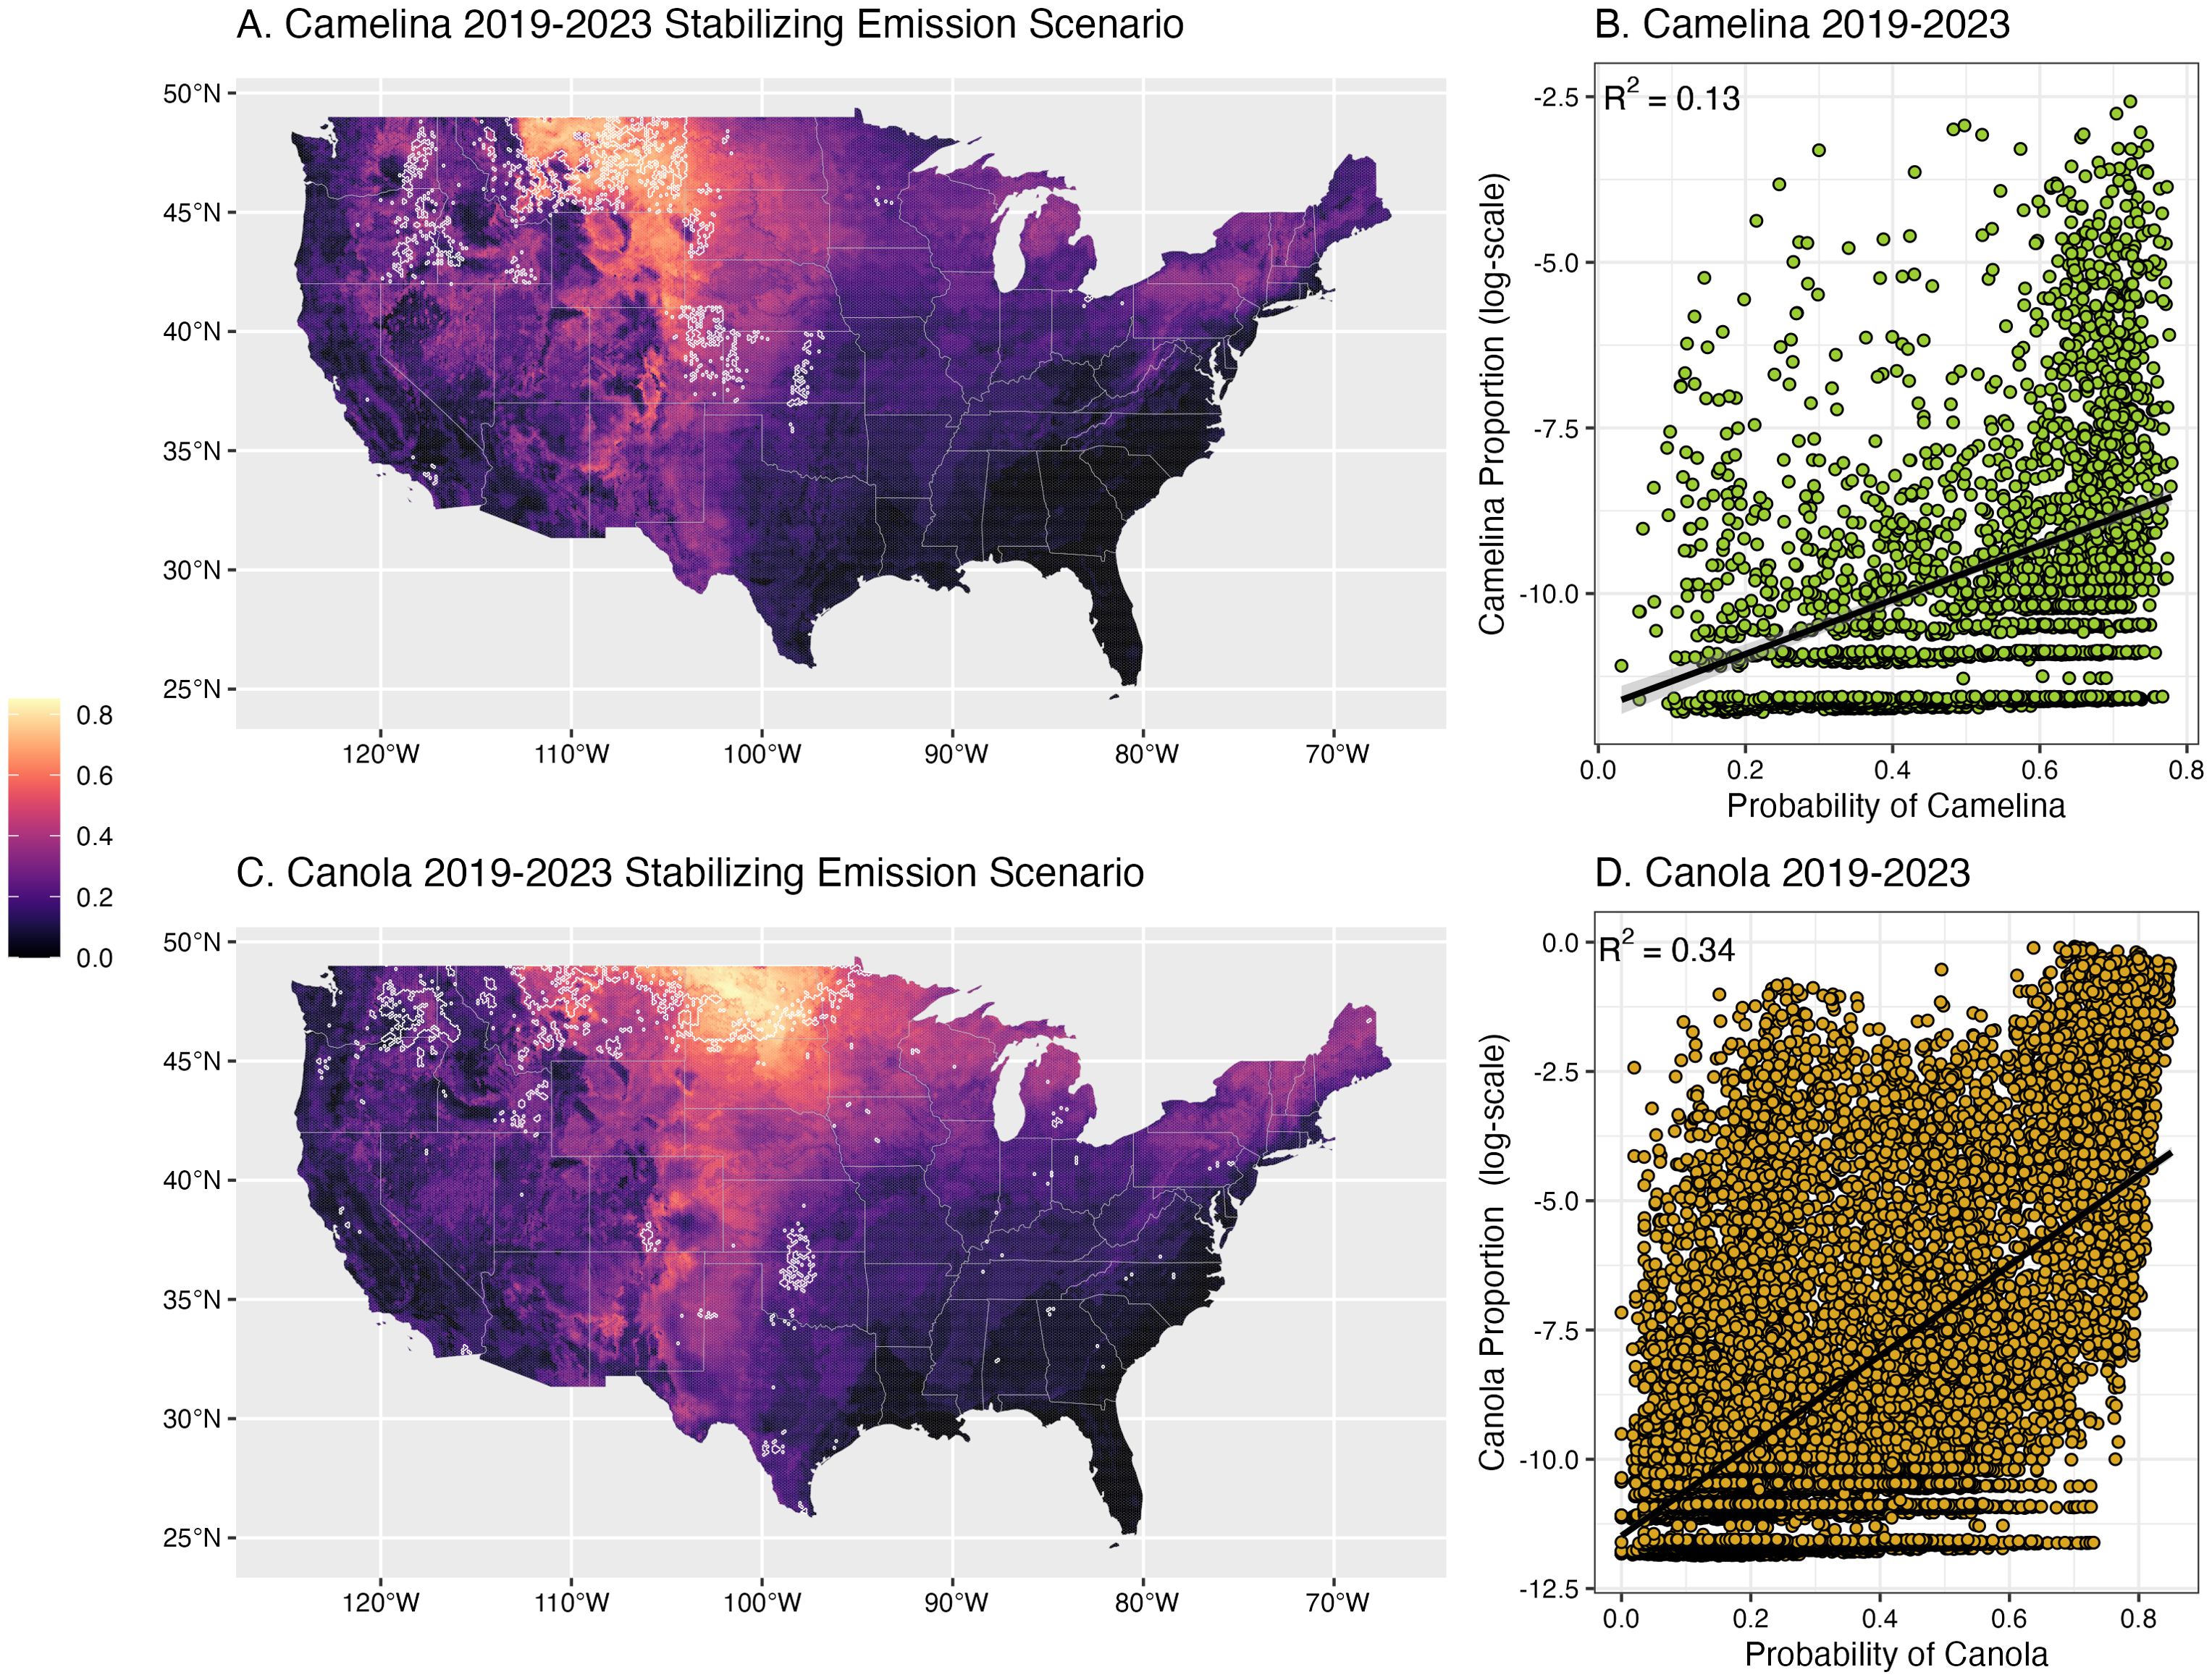
Figure 2. Estimated environmental suitability (shading) of camelina (A) and canola (C) for 2019–2023 in the continental US based on a scenario where CO2 emissions stabilize at 450 ppm. Suitability is the average probability across 13 environmental variables. Lighter shaded regions indicate areas with higher probability of environmental suitability, based on environmental conditions where each crop is currently grown. The 2019–2023 regions of highest productivity (top 5%, based on proportional area within each hexbin) are highlighted by a white polygon. (B) (camelina) and (D) (canola) show the correlation between the estimated probability of each crop based on modeled environmental suitability and the actual current (2019-2020) proportional area within each hexbin (represented by points). Given the heavily right-skewed distribution of both camelina and canola data, only locations with non-zero proportional area are plotted in (B, D).
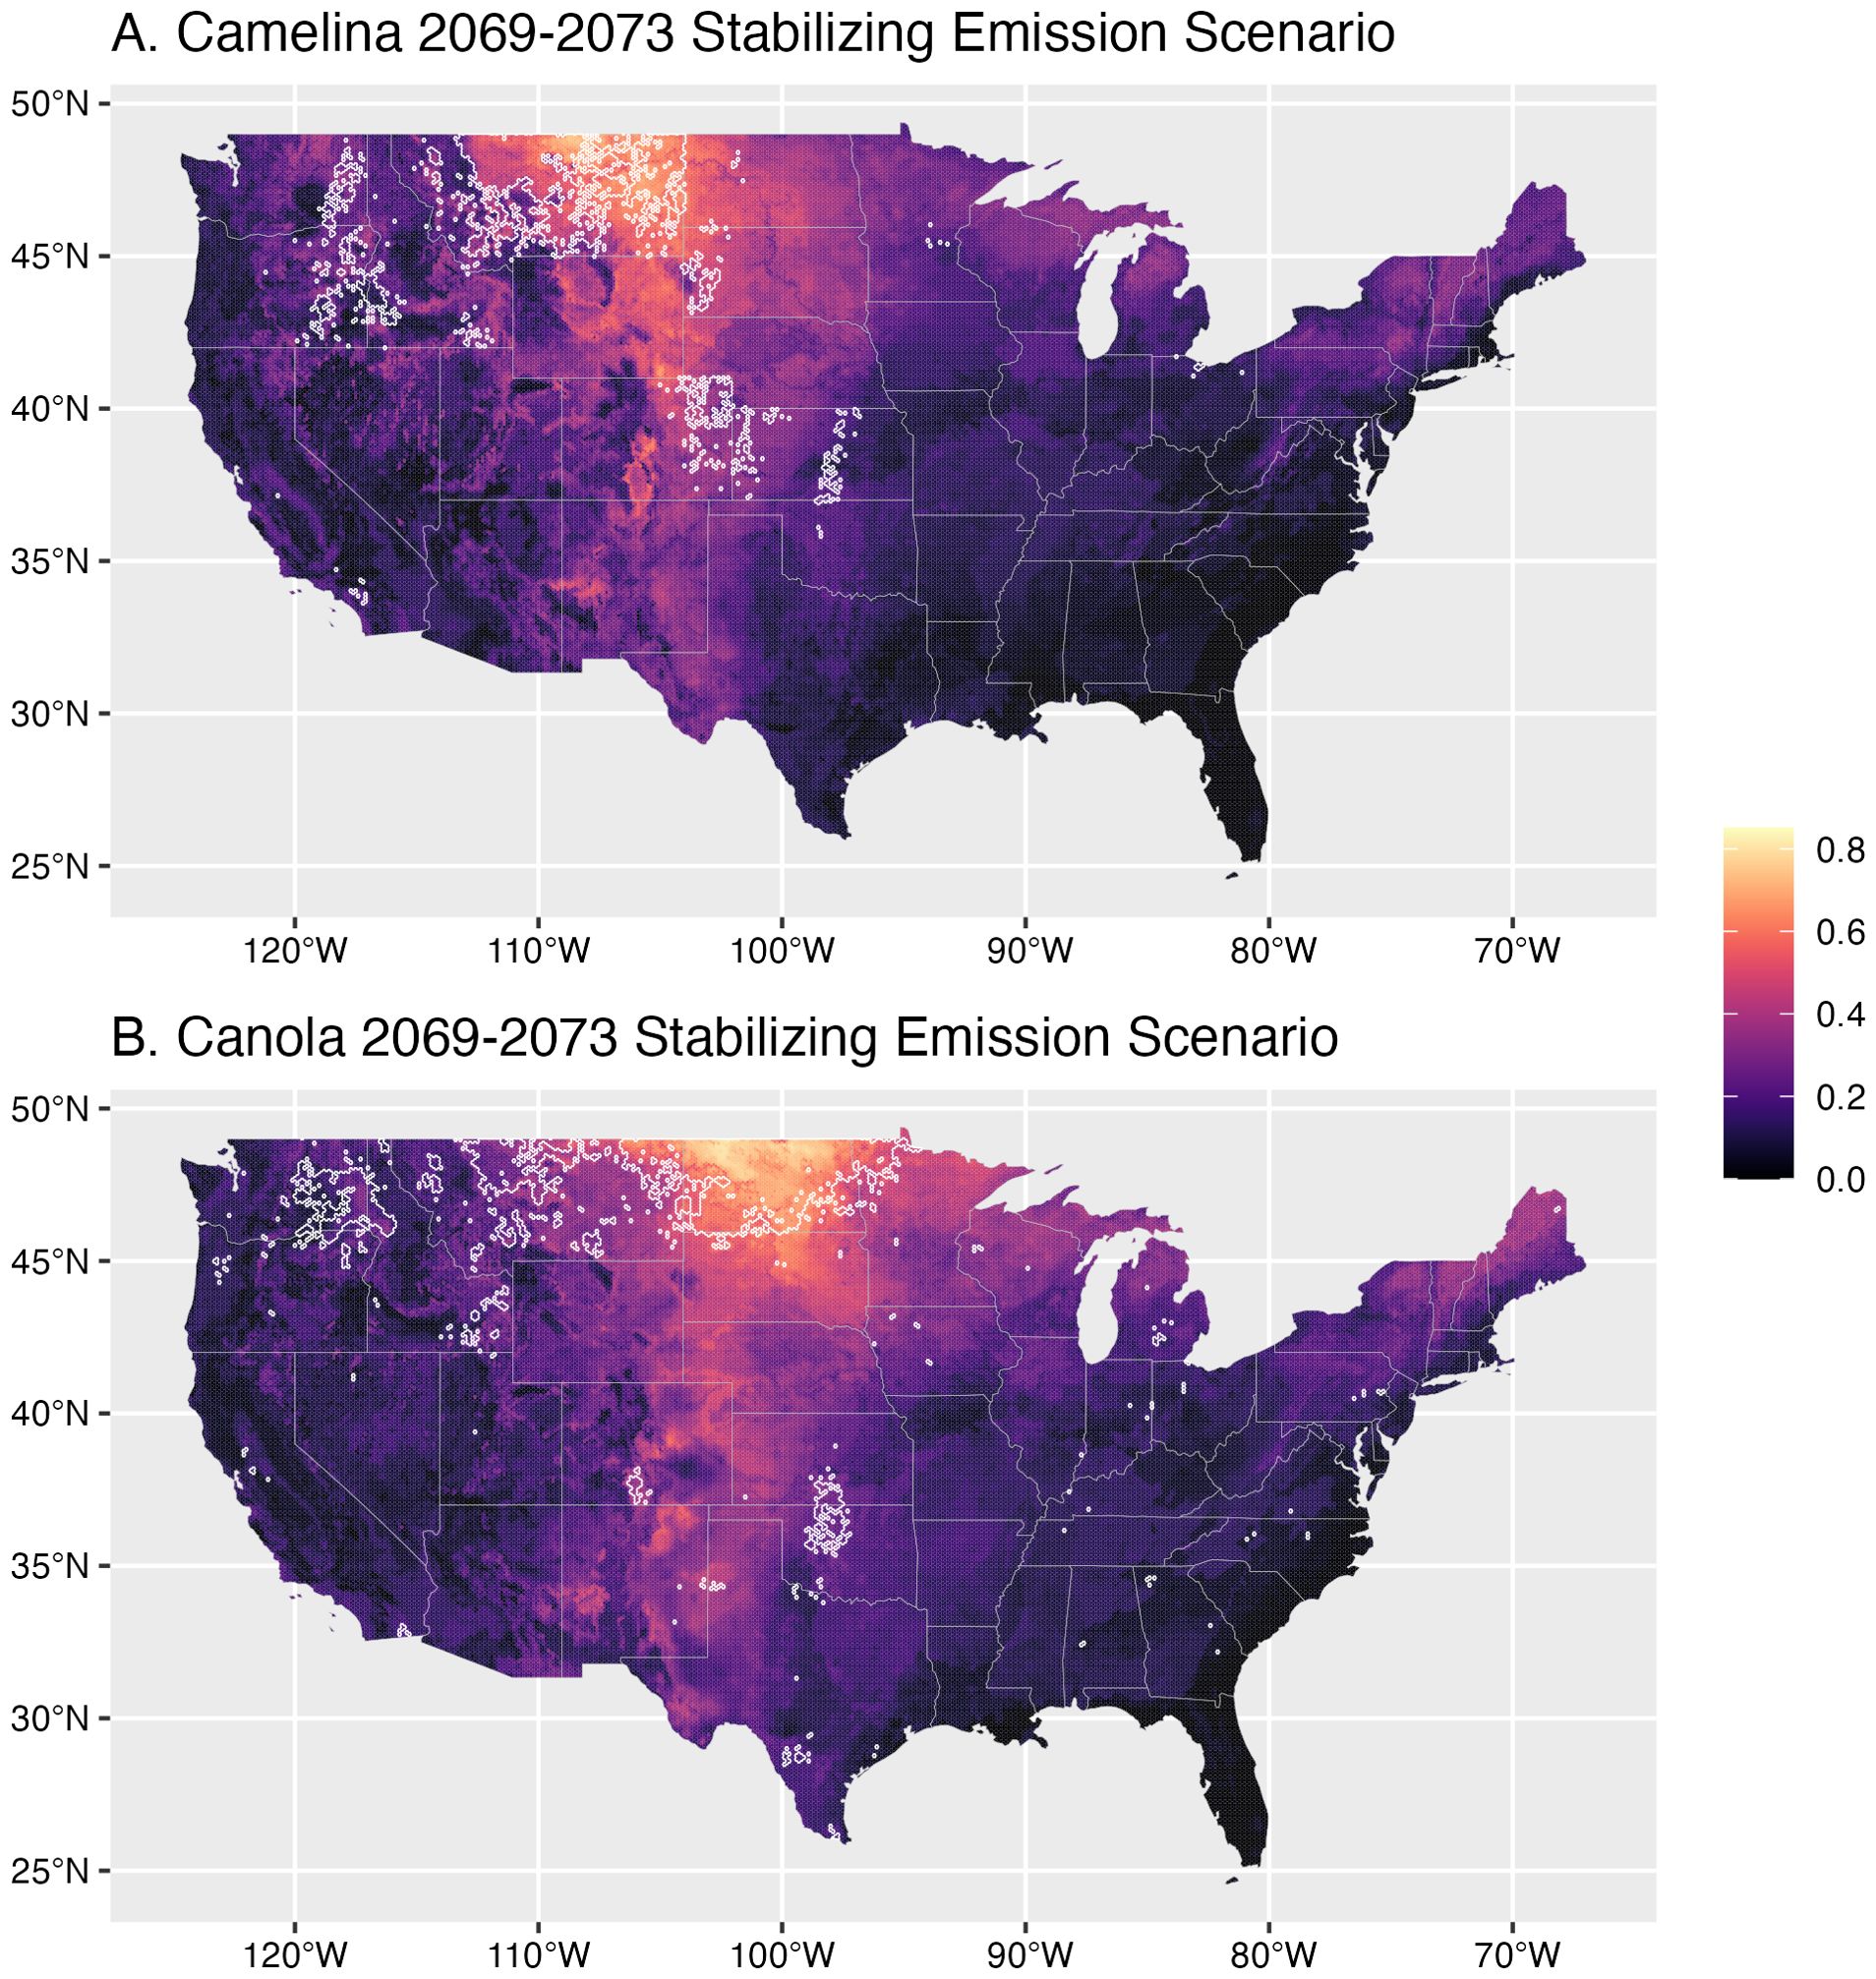
Figure 3. Future (2069-2073) estimates of camelina (A) and canola (B) suitability under a stabilizing emission scenario (CO2 emissions stabilize at 450 ppm). Shading indicates average probability of environmental suitability with lighter regions indicating higher probability. The current (2019-2023) top 5% most productive range for each crop is shown as a white outline. A full figure also showing estimates for the high emission scenario is available in the supplement (Supplementary Figure S6).
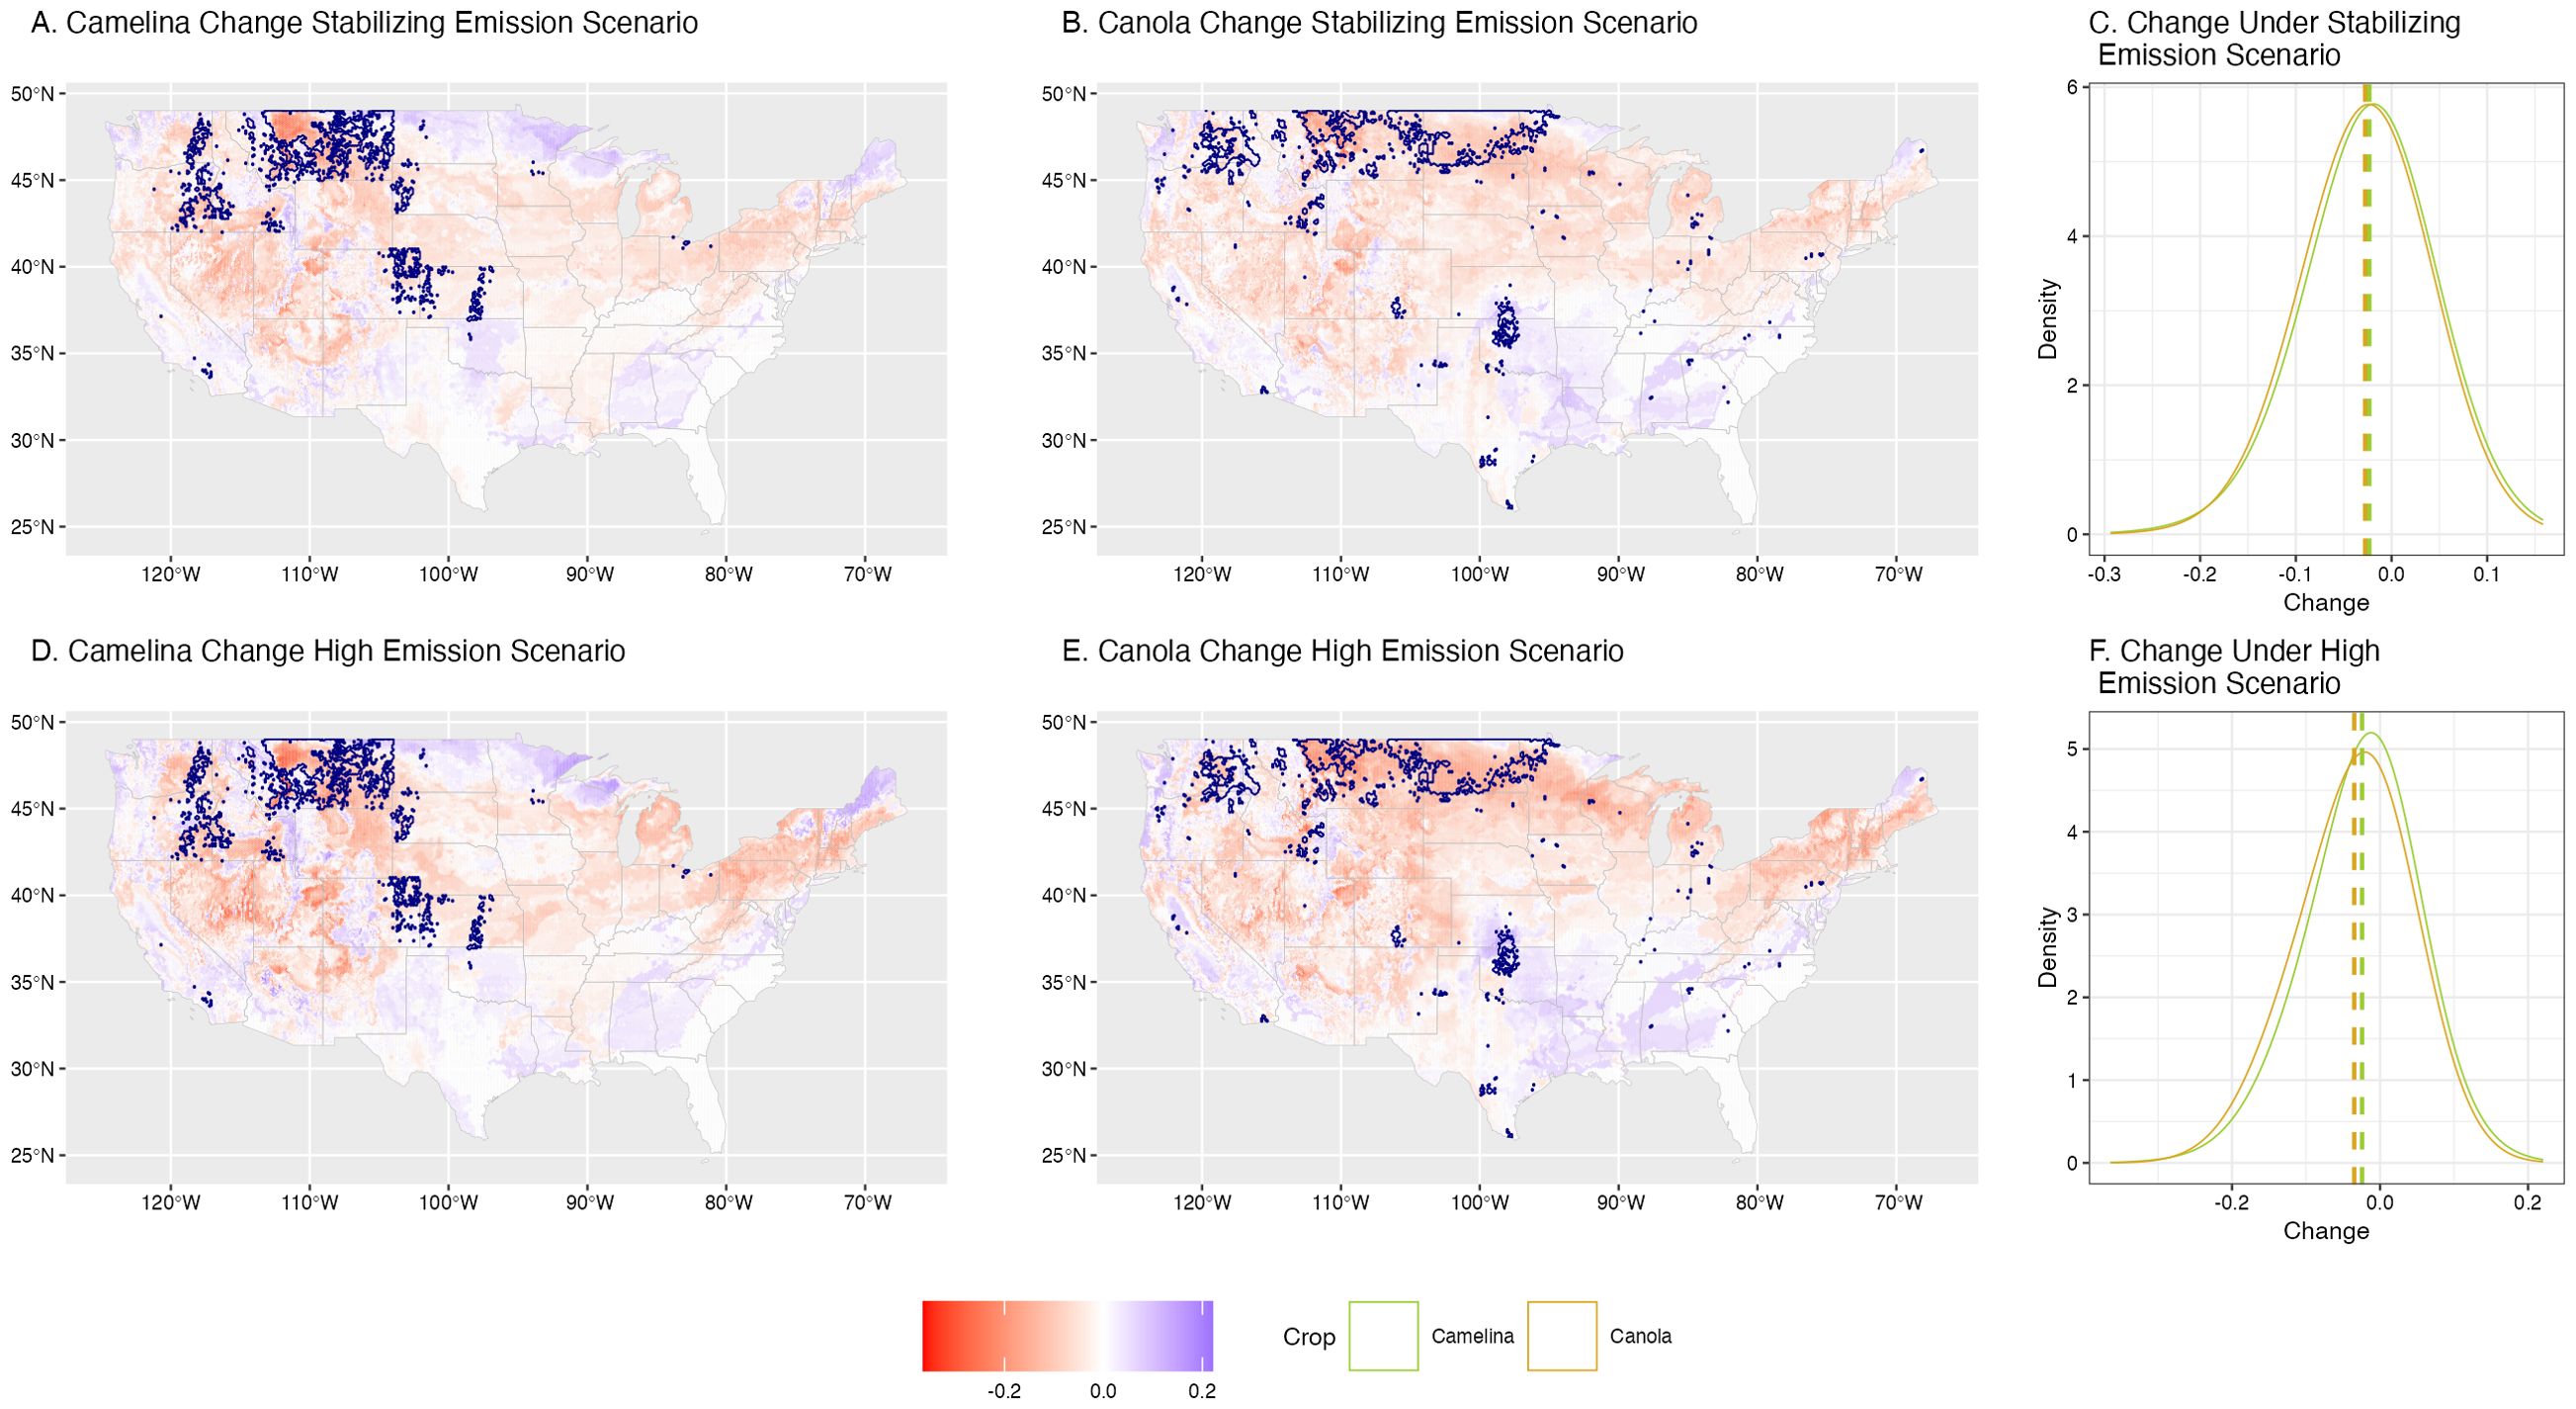
Figure 4. Change in current (2019-2023) versus projected (2069-2073) range of camelina (A, D) and canola (B, E) under a stabilizing emission scenario (CO2 emissions stabilize at 450 ppm; A-C) and a high emission scenario (D-F). The current (2019-2023) top 5% most productive range for either crop is shown as navy outlines (A, B, D, E). Positive changes in the projected crop distribution are shown in blue, and negative changes are shown in red, with darker shades of either color indicating greater change in suitability (change in average probability). The distribution of these changes for either crop under each emissions scenario are shown in (C) (stabilizing scenario) and (F) (high emissions scenario) as a density distribution with the mean (dashed line).
Throughout this manuscript, we define suitability based on the environmental conditions where each crop is currently grown. In the absence of absolute knowledge of physiological response curves for the species of interest, habitat suitability assessments often use occurrence or abundance records and associated environmental data to parameterize models (Mohammadi et al., 2022; Shen et al., 2021; Su et al., 2021; Wang et al., 2021), as we have done here. These relationships by no means imply a cause-and-effect and may be limited, particularly in managed systems (see Discussion for further explanation).
We used log-normal regression models to correlate the probability of environmental suitability (based on our niche model) with actual crop density (based on binned CDL data). Due to the heavily skewed nature of each crop’s area (Supplementary Figure S1), for these regressions we assess only locations where the crop is currently present (i.e., proportional area > 0). Areas where the crop is produced are known be suitable, but areas where it is absent are of unknown suitability. To compare crop suitability within each time period, we used two-sample t-tests. Similarly, to compare the change in environmental suitability between the two time periods, we used one-sample t-tests to assess if the overall change was significantly different from zero, and two-sample t-test to compare the two distributions (camelina and canola) for each climate scenario.
Results
Between 2019-2023, canola was grown across 32,047 km2 of the US (~0.2% of conterminous US land area) and camelina was grown across 272.8 km2 (~0.002%). Camelina is grown more extensively in warmer, dryer conditions and in areas with less productive soils (Figure 1). Canola, by comparison, is grown in areas with lower annual mean temperatures (Δμ= 1.7°C, t= 616.15, p < 0.01), specifically areas that are ~4.3°C cooler, on average, during the coldest quarter (t=1074.2, p < 0.01) and 3.6°C cooler during the driest quarter (t=334.14, p < 0.01). However, canola is grown in slightly warmer areas during the wettest (Δμ= -1.2°C, t= -163.22, p < 0.01) and warmest (Δμ= -0.1°C, t= -30.10, p < 0.01) quarters. Isothermality (the magnitude of diurnal temperature variability relative to annual temperature variability) was likewise lower in areas where canola was more extensively grown by 5.7% (t=1367.3, p < 0.01). That is, canola is grown in areas with more temperature variability across the year than within the average month. Canola is also grown in areas that receive more precipitation annually (Δμ=-104.8 mm, t=-887.10, p = 0.01), particularly in the warmest quarter (Δμ=-56.65 mm, t=-1064.45, p < 0.01) and wettest quarter (Δμ=-39.21 mm, t=-875.23, p < 0.01) but only slightly more precipitation in the coldest (Δμ=-10.77 mm, t=-265.80, p < 0.01) and driest quarters (Δμ=-5.07 mm, t=-317.30, p < 0.01). Furthermore, canola is grown on wetter (Δμ=-12.27, t=-878.14, p < 0.01) and more productive (Δμ=-1.25, t=-2.65, p < 0.01) soils, based on the soil Drainage Index and Productivity Index, respectively.
Using these environmental niches, we estimated the probability for either crop across the conterminous US (Figure 2). For both crops, the current primary production region is the Northern Great Plains, with camelina dominating in Montana, while canola is more prevalent in North Dakota. Both crops’ suitability range extended south through the Plains states, and show some suitability in the Midwest, Southwest, and Northeast. Our estimates, based on the environmental niche of either crop, largely fell within their primary production ranges. In locations where each crop is currently grown, there was a positive correlation between our estimated probability values and the current proportion of cropped land for both camelina (R2 = 0.17, F1,2634 = 532.9, p < 0.01, Figure 2B) and canola (R2 = 0.38, F1,13541 = 8360, p < 0.01, Figure 2D). On average, we estimate current suitability to be about 1.5% higher for canola (μ= 23.0%) than camelina (μ= 21.5%) across the US (t144415 = -18.32, p< 0.01; 95% confidence interval = 1.67, 1.35).
Under future climate scenarios (Figure 3), we estimate suitability to be about 1% higher for canola (μLEV= 20.2%, μWRE= 20.4%) than camelina (μLEV= 19.2%, μWRE= 19.1%), on average across the US (LEV: t144792 = -14.59, p< 0.01; WRE: t144789 = -17.88, p< 0.01). Overall, suitability is expected to decrease for both camelina (LEV: μ= -2.32%, t72405 = -121.29, p< 0.01; WRE: μ=-2.44%, t 72405 = -103.3, p< 0.01) and canola (LEV: μ=-2.76%, t 72405 = -152.94, p< 0.01; WRE: μ=-3.50%, t72405= -146.56, p< 0.01) by 2069-2073. Environmental suitability for canola is predicted to decrease more than camelina (LEV: t144362 = -16.97, p< 0.01; WRE: t144792 = -31.56, p< 0.01) (Figures 4C, 4F), with the difference greater under the high emissions scenario (5.94% versus 5.08%). We predict that the Northern Great Plains will remain the most productive region for both crops (Figure 3), but changes in suitability will not be spatially constant (Figure 4). Both camelina and canola are projected to decrease in their current primary production ranges (Montana and North Dakota, respectively) by 25% or more [e.g., decrease in suitability of 0.2 (Figure 4), where suitability was previously 0.8 (Figure 3)]. For camelina, opportunities are projected to open throughout the upper Midwest, Pacific Northwest, and Southern Plains. Meanwhile, for canola, the Southwest is one of the only regions that is projected to increase in suitability in the future. It should be noted, however, that while the Southwest is projected to improve for both crops, overall suitability is expected to remain low (Figure 3) with several environmental factors limiting suitability in this region (Supplementary Figure S5).
Precipitation was the primary limiting factor for both crops under both emissions scenarios (Figure 5). That is, precipitation values, such as annual precipitation and precipitation during the wettest and warmest quarters, had the lowest probability of supporting each crop across the widest portion of the US. This is particularly notable in the eastern US, which receives excessive rainfall compared to either crop’s current distribution (Supplementary Figures S4I-M). However, as drought conditions in the western US intensify under future climate scenarios, particularly during the driest quarter, both crops will be limited by low precipitation in their western range (Supplementary Figure S4K). This is expected to become more of an issue for canola than camelina (Supplementary Figure S3).
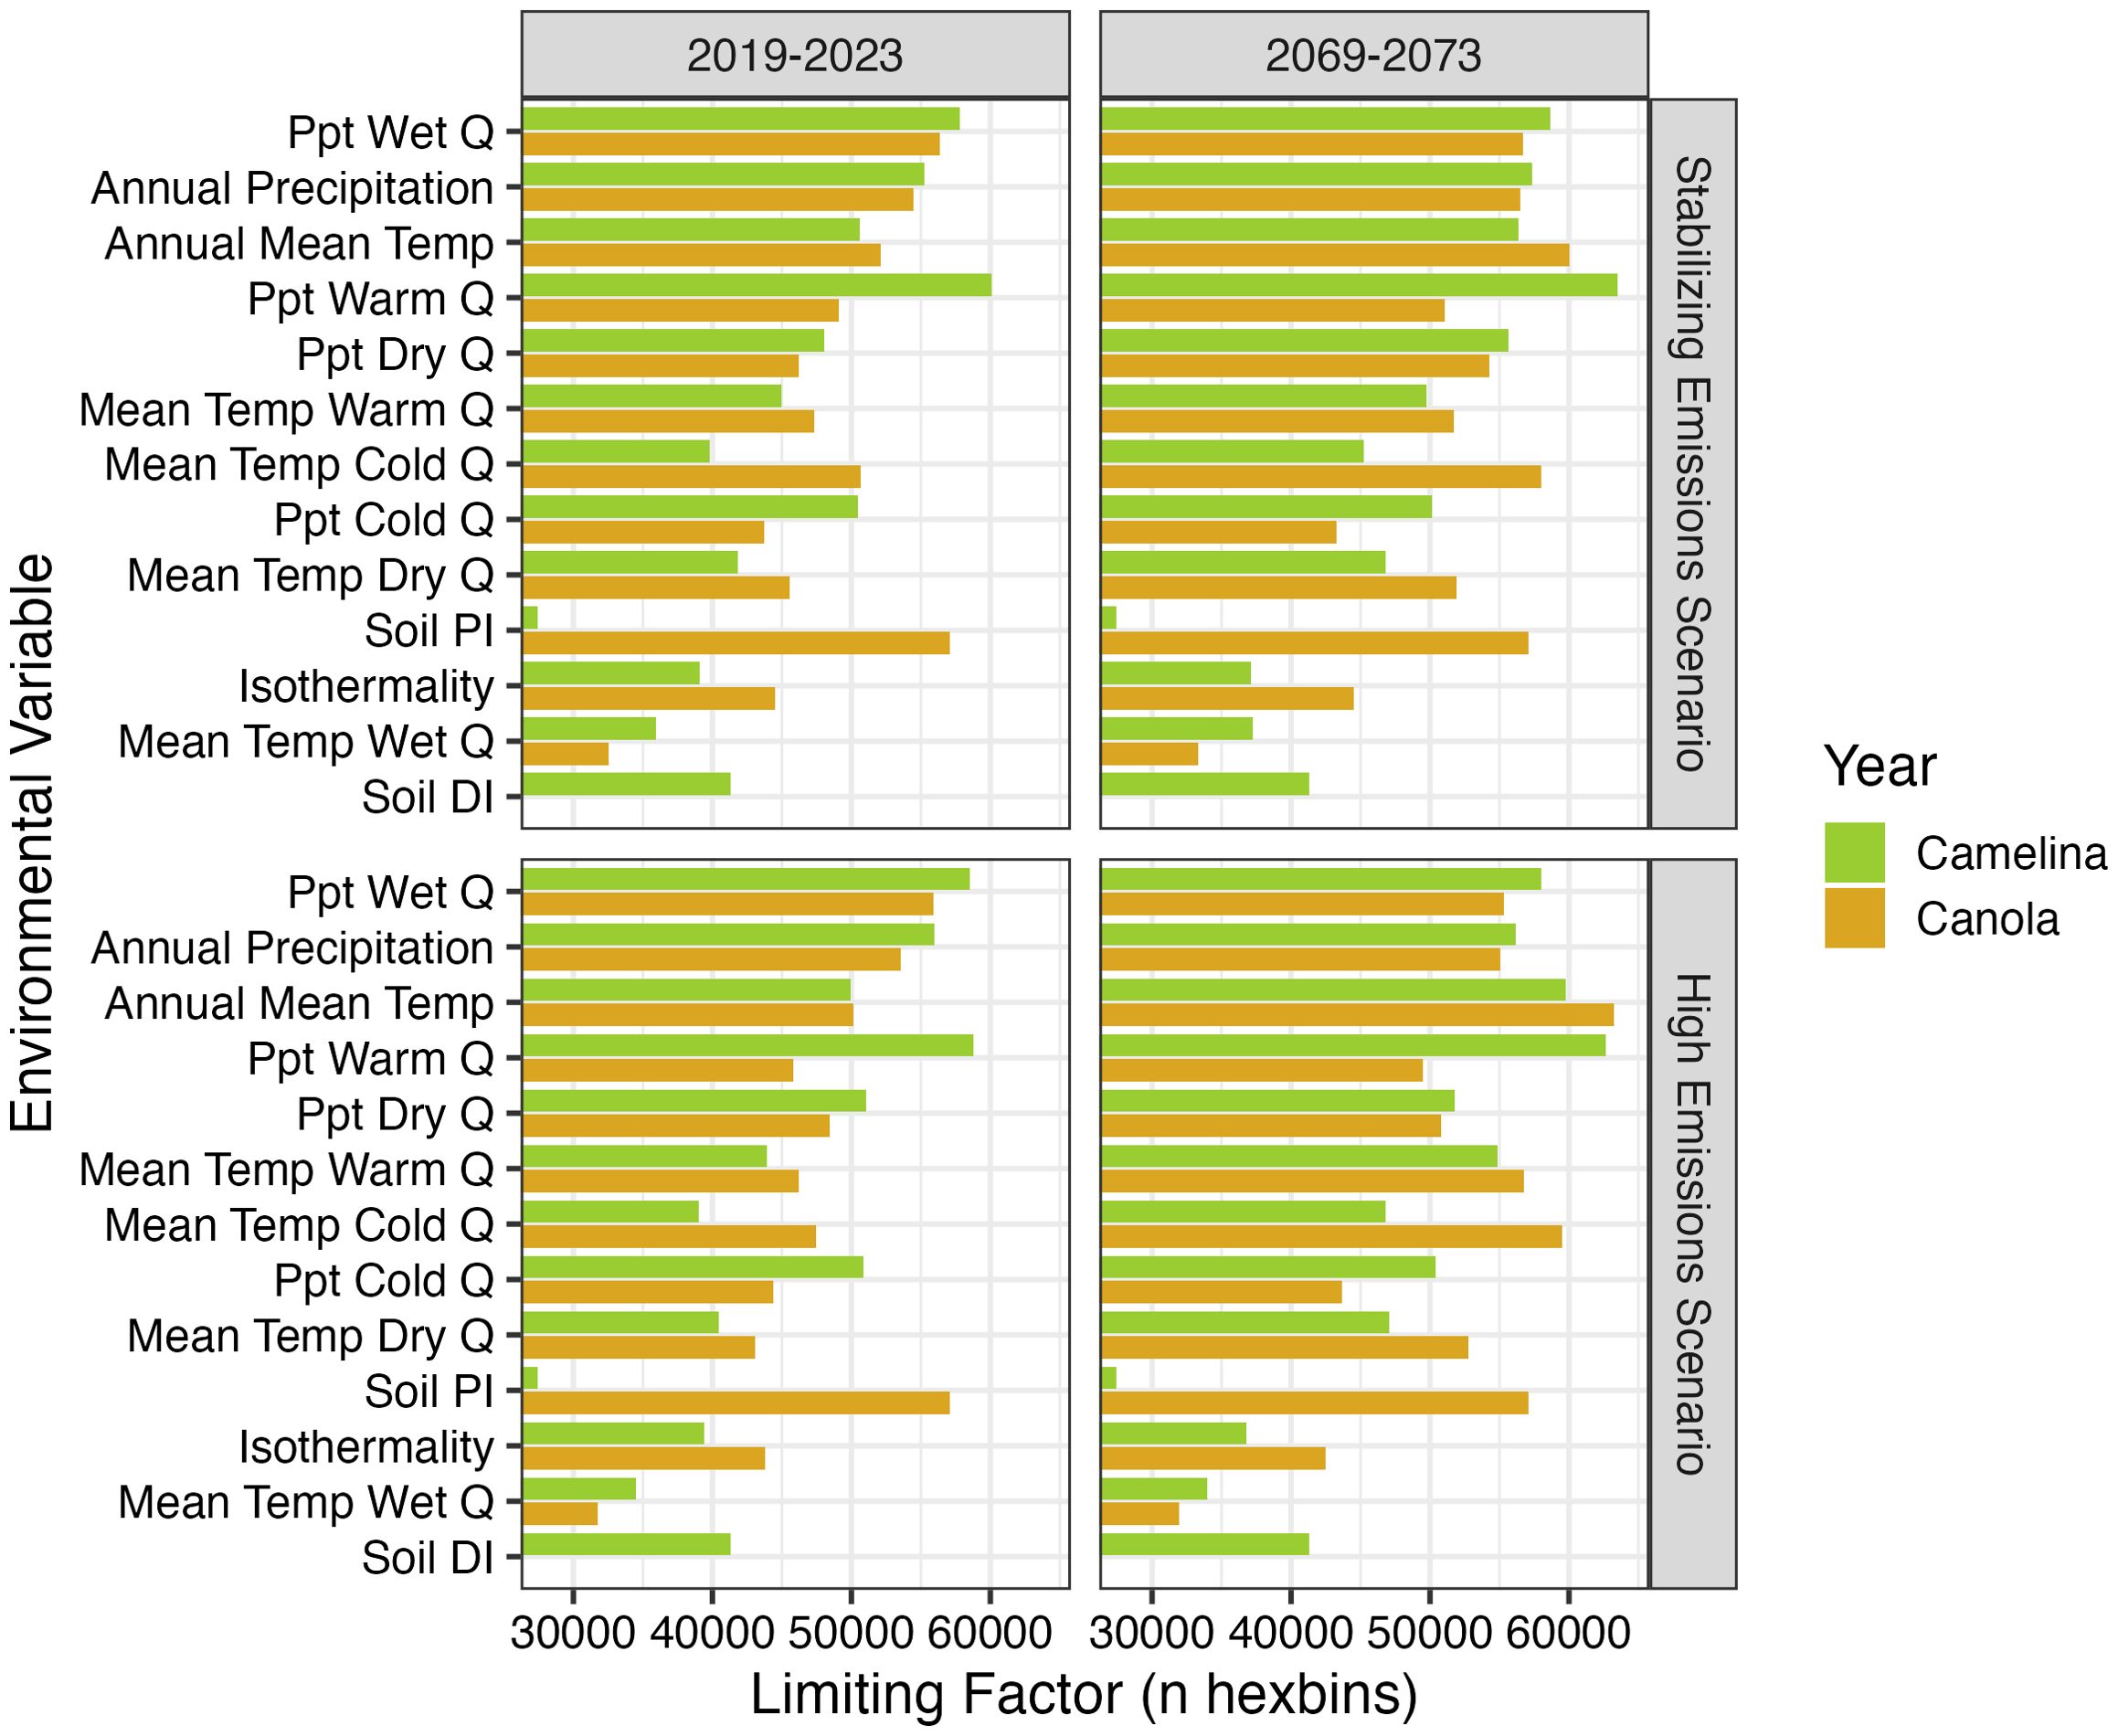
Figure 5. Limiting factors (< 20% probability) in determining the environmental suitability for camelina and canola growth for each hexbin. Variables show the temperature (Temp) and precipitation (Ppt) of the driest, warmest, wettest, or coldest quarter (Q) as well as soil Drainage Index (DI) or Productivity Index (PI). See Supplementary Figure S4 for a map of the distribution and direction of each of these limiting factors. The number of hexbins where soil DI (drainage index) was a limiting factor for camelina was low (~10,000) in each year/scenario, and therefore not plotted.
Canola is also expected to become more limited than camelina by temperature under future climate scenarios – across the year and in the coldest and driest quarters (Supplementary Figure S3). Increasing temperatures in the south are expected to limit suitability, particularly for canola, in the future (Supplementary Figures S4-C, F, H). Thus, it seems likely that increasing temperatures are contributing to the greater decrease in canola suitability expected in the future.
Soil conditions represented the greatest difference in suitability between crops (Figure 5). Canola was much more limited by soil productivity than camelina (Supplementary Figure S4A). Throughout most of the country, except the Central US, soil productivity was too low to support canola. Camelina, on the other hand, was limited by soil wetness (measured by the soil drainage index). Our model suggests that much of the eastern US has soils that are too wet to support camelina.
Discussion
We examined environmental suitability for two oilseed crops, canola and camelina, under two alternative climate change emissions scenarios. Our findings on each crop’s environmental niche are consistent with what has been suggested in the literature about their respective agronomic attributes (i.e., that camelina is a low-input, drought-tolerant crop, compared to canola) (Ehrensing and Guy, 2021; Obour et al., 2015). Currently, on average, environmental conditions across the US are more suitable to canola than camelina, based on our analysis of the available data. Under both climate change scenarios environmental suitability for each crop is expected to decrease in the near future (~ -25% in the primary production regions for either crop in 50 years). Our analysis suggests that this decrease will be more extreme for canola than camelina, but that average suitability across the country will remain higher for canola than camelina. This work builds on the growing literature examining the implications of climate change on land use suitability for crop production (Knapp et al., 2023; Lant et al., 2016; Ramankutty et al., 2002). Notably, our work is similar to that of Lant et al. (2016) who forecasted land use changes for several staple crops in the Central US based on climate models, soil characteristics, and topography across three time periods (2040, 2070, and 2100). Similar to our estimates in canola and camelina’s primary production rage, Lant et al. (2016) predicted a 22% decrease in suitability for corn, a 17% decrease for soybeans, and a 20% decrease for cotton by 2070, with a general northward shift in suitability. Overall, our findings add support to the idea that with shifting climate conditions, camelina may indeed be a viable alternative oilseed for farmers to consider for a climate-smart future.
We show that currently, camelina is grown in warmer, drier, less productive regions of the US than canola, which is largely consistent with each crop’s biological characteristics. One of the primary advantages of camelina, highlighted across studies, is its capacity to grow on marginal land with minimal inputs (Berti et al., 2016; Blackshaw et al., 2011; Ehrensing and Guy, 2021; Moser and Vaughn, 2010; Putnam et al., 1993; Steppuhn et al., 2010; Von Cossel et al., 2019). We affirm this in our study by showing that canola is currently grown on significantly more productive land, based on the soil Productivity Index, compared to camelina. Notably, throughout most of the US, except for the Plains, our model suggests that soil productivity is a limiting factor for canola suitability, but less so for camelina (Supplementary Figures S4A), illustrating camelina’s potential edge.
Likewise, several previous studies suggest that camelina is drought tolerant (Agarwal, 2017; Czarnik et al., 2018; Moser and Vaughn, 2010; Putnam et al., 1993; Steppuhn et al., 2010), which is consistent with camelina being grown in regions with lower precipitation throughout the year and in regions with a lower soil Drainage Index. Currently, our results suggest that high precipitation during the driest quarter limits both crops from being grown in the eastern US. Thus, while camelina is drought tolerant, our findings also suggest its potential may be limited in regions with higher precipitation and/or in regions with high soil wetness. Under future climate scenarios, drought conditions in the western US are expected to further limit suitability for both crops, but especially canola (Supplementary Figures S4I-M). This is consistent with suggestions that canola is poorly suited to dryland conditions (Pavlista et al., 2012), and that camelina may be a desirable alternative crop.
Inconsistent with the existing literature, we found that camelina is currently grown in warmer regions than canola. Spring camelina is suggested to be more freeze tolerant than canola (McVay and Lamb, 2008; Obour et al., 2015) and winter camelina varieties require a vernalization period (Anderson et al., 2018) and are described as extremely winter hardy (Gesch and Archer, 2013). Thus, we would have expected camelina to be grown in colder regions, particularly those with the lowest winter temperatures (coldest quarter), but we observed the opposite. This discrepancy likely highlights a limitation of our study approach, rather than a true biological effect. Because camelina is currently less extensively grown than camelina, our model may fail to capture its entire potential biological range, based on its current realized niche. Thus, our results may provide conservative estimates, and further adoption of winter camelina varieties, for example, could expand camelina’s range.
Examining these temperature constraints spatially, we see that warm temperatures during the warmest quarter are primarily a limiting factor in the southern US (Supplementary Figures S4G, H) and are currently more limiting for canola (Figure 5). Indeed, high temperatures during the warmest quarter seem to be a primary limiting factor in suitability for canola under a future, high emissions scenario (Supplementary Figures S4G). Phenologically, the warmest quarter is the time when seeds are developing in these spring-blooming crops. Previous work by Gan et al. (2004) shows that canola and other oilseed mustards are more susceptible to temperature stress during seed development than at earlier stages (i.e., bud development or flowering). Temperature stress during seed development can lead to lower seed yields and lower seed weights for both crops (Aksouh-Harradj et al., 2006; Gan et al., 2004; Nadakuduti et al., 2023) and has been shown to reduce oil production and alter fatty acid profiles for camelina (Aksouh-Harradj et al., 2006; Nadakuduti et al., 2023).
These crops’ distinct environmental niches were reflected in differences in their potential spatial distributions. Camelina shows suitability in Montana and throughout the Plains. Meanwhile, we estimate canola to have a more easterly range, extending further into the Dakotas. Camelina is not currently a widely cultivated crop (particularly when compared to canola), but these finding help identify additional areas that would be suitable for production. Notably, both crops are currently grown primarily in the Northern Great Plains, but our model suggests that each could be grown more extensively throughout the western US (Figure 2, Supplementary Figure S5). There have been several extension publications from Oregon State University, Washington State University, and University of Idaho over the past decade covering the biology and management of camelina (Ehrensing and Guy, 2021; Hulbert et al., 2012; Moore et al., 2019; Schillinger et al., 2013), which suggest interest by farmers in the region in adopting the crop. Based on our estimates of suitability, these areas are more suitable for camelina than canola and are likely to remain somewhat suitable in the next 50 years (though show some decrease in suitability). Additionally, our study highlights the upper Midwest as becoming more suitable for camelina in the future. Studies such as ours that project future environmental suitability for crops could help extension professionals and growers build capacity for crops that are likely to become suited to their region in the near future.
Overall, we show that at broad spatial scales, the current, realized niches of these two crops largely follow their distinct biological characteristics. This is interesting when considering the additional release and constraints that anthropogenic factors such as management (e.g., irrigation, fertilizer application) and social constrains (e.g., markets, government incentives, land availability, and farmer capacity/desire to grow certain crops) can introduce into the distribution of a managed species. Though, perhaps not surprising considering the economics (i.e., added inputs and lower yields) of growing a crop outside its ideal range. In the future, more environmental factors are projected to become limiting to the cultivation of these crops (Supplementary Figure S5). That is, while there are currently regions where all measured environmental factors show a high probability of supporting crop production (Supplementary Figure S5), under climate change, more factors (especially temperature) are expected to limit suitability, which could lead to a need for greater agronomic inputs.
Still, camelina is a highly adaptable crop (Zanetti et al., 2021; Zubr, 2003) that has been successfully grown across several regions of the US – from the Corn Belt (Gesch et al., 2014) to the Plains (Aiken et al., 2015; Berti et al., 2015), Pacific Northwest (Schillinger et al., 2012), and Southwest (under irrigation) (Hunsaker et al., 2011). A key limitation of our study is that our model is parameterized by the current production range for either crop. While we show this largely reflects what is known about these crops’ biology, it disregards each plants’ plasticity, adaptability, and the influence of plant variety. It also disregards socioeconomic factors such as possible differences in market quality standards for either crop and the production requirements to meet these standards. Substantially greater investment has been made into breeding varieties of canola for yield, oil quality, and environmental tolerance (Chen et al., 2005; Obour et al., 2015; Pavlista et al., 2011; Sparks, 1993), which likely explains its greater adoption and wider range. Similar breeding efforts for camelina could increase yield and oil quality (Ehrensing and Guy, 2021), as demonstrated by previous studies investigating camelina varieties in different environments to understand gene-by-environment interactions and effects on yields and oil quality (Jiang et al., 2014; Obour et al., 2017; Zanetti et al., 2017). Our models also assume that yield and quality are highest in the current production region, but this may not necessarily be the case given socioeconomic factors such as government incentives, processing facilities, and market opportunities (Reimer and Zheng, 2017; WAPMC, 2012). Due to lack of available yield data, we were unable to integrate yield estimates in our models, but this could be an important future direction if data become available. Alternatively, high-dimensional greenhouse studies, aimed at defining the productivity of these crops across a range of environmental conditions could be used. Such studies could expand our scope of understanding of the relative role and interactive effects of temperature, precipitation/water availability, and soil conditions/nutrient availability as well as solar radiation and genetic variety/cultivar on crop yields.
Breeding efforts for camelina may help improve yield and oil quality (e.g., fatty acid composition) which could improve marketability (Obour et al., 2015). Indeed, an advantage of our study is that it identifies the likely limiting environmental factors under future climate change scenarios, which could be used to proactively breed new cultivars of either crop that are well suited to future regional conditions. However, doing so should be approached with caution, given the uncertainty around these climate projections. While the projections we used were rigorously developed (Fordham et al., 2012; Pearson et al., 2014; Pierce et al., 2009), they do not account for several important factors such as seasonal variation in atmospheric CO2 concentrations or solar radiation which could affect yields (Biabani et al., 2021; Black, 1964; Monteith et al., 1997; Qian et al., 2019; Uddin et al., 2018), effects of extreme weather (Gornall et al., 2010), nor do they use the most current projections. There are also other agroecological aspects, related to climate change, such as pest pressure that we were unable to account for in these models (Gornall et al., 2010), though an additional advantage of camelina is its low susceptibility to the pests that cause economic damage to canola (Ehrensing and Guy, 2021).
Overall, we demonstrate that the environmental niche of these two crops is distinct, leading to distinct suitable ranges presently and under future climate scenarios. Consistent with the literature, camelina seems more resilient to certain aspects of climate change, which is likely to expand its suitable distribution, more than that of canola, in the near future. Future adoption of this crop could be supported by expanding farmer knowledge, breeding efforts, and marketability.
Data availability statement
Publicly available datasets were analyzed in this study. This data can be found here: https://www.nass.usda.gov/Research_and_Science/Cropland/Release/, https://www.fs.usda.gov/foresthealth/applied-sciences/mapping-reporting/soil-drainage.shtml, https://dpesgf03.nccs.nasa.gov/thredds/catalog/esgcet/bioClim.html. Reproducible code is available on GitHub (https://github.com/gmquinla/Quinlan_Goslee_2025_Front_Agron).
Author contributions
GQ: Conceptualization, Data curation, Formal analysis, Investigation, Methodology, Validation, Visualization, Writing – original draft, Writing – review & editing. SG: Conceptualization, Funding acquisition, Methodology, Project administration, Resources, Supervision, Validation, Visualization, Writing – review & editing.
Funding
The author(s) declare that financial support was received for the research and/or publication of this article. This work was supported by United States Department of Agriculture, Agricultural Research Service project 8070-21500-001-000-D and by an Agricultural Research Service Postdoctoral Fellowship.
Acknowledgments
This work contributes to the USDA-ARS Grand Challenge project, “Creating pollinator landscapes and overwintering practices to increase pollinator populations in a changing climate.” We gratefully acknowledge Gloria DeGrandi-Hoffman for her leadership on this project and providing feedback on early drafts of this manuscript. The United States Department of Agriculture is an equal opportunity service provider and employer. Mention of trade names or commercial products in this publication is solely for the purpose of providing specific information and does not imply recommendation or endorsement by the United States Department of Agriculture.
Conflict of interest
The authors declare that the research was conducted in the absence of any commercial or financial relationships that could be construed as a potential conflict of interest.
The reviewer RG declared a shared affiliation with the author(s) to the handling editor at the time of review.
Publisher’s note
All claims expressed in this article are solely those of the authors and do not necessarily represent those of their affiliated organizations, or those of the publisher, the editors and the reviewers. Any product that may be evaluated in this article, or claim that may be made by its manufacturer, is not guaranteed or endorsed by the publisher.
Supplementary material
The Supplementary Material for this article can be found online at: https://www.frontiersin.org/articles/10.3389/fagro.2025.1498293/full#supplementary-material
References
Agarwal A. (2017). Growth and yield response of camelina sativa to inorganic fertilizers and farmyard manure in hot semi-arid climate of India. Adv. Plants Agric. Res. 7, 305–309. doi: 10.15406/apar.2017.07.00258
Aiken R., Baltensperger D., Krall J., Pavlista A., and Johnson J. (2015). Planting methods affect emergence, flowering and yield of spring oilseed crops in the U.S. central High Plains. Ind. Crops Prod. 69, 273–277. doi: 10.1016/j.indcrop.2015.02.025
Aksouh-Harradj N. M., Campbell L. C., and Mailer R. J. (2006). Canola response to high and moderately high temperature stresses during seed maturation. Can. J. Plant Sci. 86, 967–980. doi: 10.4141/P05-130
Anderson J. V., Horvath D. P., Doğramaci M., Dorn K. M., Chao W. S., Watkin E. E., et al. (2018). Expression of FLOWERING LOCUS C and a frameshift mutation of this gene on chromosome 20 differentiate a summer and winter annual biotype of Camelina sativa. Plant Direct. 2, e00060. doi: 10.1002/pld3.60
Bakkenes M., Alkemade J. R. M., Ihle F., Leemans R., and Latour J. B. (2002). Assessing effects of forecasted climate change on the diversity and distribution of European higher plants for 2050. Glob. Change Biol. 8, 390–407. doi: 10.1046/j.1354-1013.2001.00467.x
Baston D. (2023). exactextractr: Fast Extraction from Raster Datasets using Polygons. https://CRAN.R-project.org/package=exactextractr.
Berti M., Gesch R., Eynck C., Anderson J., and Cermak S. (2016). Camelina uses, genetics, genomics, production, and management. Ind. Crops Prod. 94, 690–710. doi: 10.1016/j.indcrop.2016.09.034
Berti M., Gesch R., Johnson B., Ji Y., Seames W., and Aponte A. (2015). Double- and relay-cropping of energy crops in the northern Great Plains, USA. Ind. Crops Prod. 75, 26–34. doi: 10.1016/j.indcrop.2015.05.012
Biabani A., Foroughi A., Karizaki A. R., Rassam G. A., Hashemi M., and Afshar R. K. (2021). Physiological traits, yield, and yield components relationship in winter and spring canola. J. Sci. Food Agric. 101, 3518–3528. doi: 10.1002/jsfa.11094
Black J. N. (1964). An Analysis of the Potential Production of Swards of Subterranean Clover (Trifolium subterraneum L.) at Adelaide, South Australia. J. Appl. Ecol. 1, 3–18. doi: 10.2307/2401585
Blackshaw R., Johnson E., Gan Y., May W., McAndrew D., Barthet V., et al. (2011). Alternative oilseed crops for biodiesel feedstock on the Canadian prairies. Can. J. Plant Sci. 91, 889–896. doi: 10.4141/cjps2011-002
Booth T. H., Nix H. A., Busby J. R., and Hutchinson M. F. (2014). Bioclim: the first species distribution modelling package, its early applications and relevance to most current MaxEnt studies. Diversity and Distributions 20, 1–9. doi: 10.1111/ddi.12144
Busby J. R. (1991). BIOCLIM - a bioclimate analysis and prediction system. Plant Protection Quarterly 6, 8–9.
Chen C., Jackson G., Neill K., Wichman D., Johnson G., and Johnson D. (2005). Determining the feasibility of early seeding canola in the northern great plains. Agron. J. 97, 1252–1262. doi: 10.2134/agronj2005.0004
Czarnik M., Jarecki W., and Bobrecka-Jamro D. (2018). Reaction of winter varieties of false flax (Camelina sativa (L.) Crantz) to the varied sowing time. J. Cent. Eur. Agric. 19, 571–586. doi: 10.5513/JCEA01/19.3.2054
Eberle C. A., Thom M. D., Nemec K. T., Forcella F., Lundgren J. G., Gesch R. W., et al. (2015). Using pennycress, camelina, and canola cash cover crops to provision pollinators. Ind. Crops Prod. 75, 20–25. doi: 10.1016/j.indcrop.2015.06.026
Ehrensing D. T. and Guy S. O. (2021). Camelina (No. EM 8953-E), Oilseed Crops (Corvallis, OR: Oregon State University Extension Service).
Fordham D. A., Wigley T. M. L., Watts M. J., and Brook B. W. (2012). Strengthening forecasts of climate change impacts with multi-model ensemble averaged projections using MAGICC/SCENGEN 5.3. Ecography 35, 4–8. doi: 10.1111/j.1600-0587.2011.07398.x
Gan Y., Angadi S. V., Cutforth H., Potts D., Angadi V. V., and McDonald C. L. (2004). Canola and mustard response to short periods of temperature and water stress at different developmental stages. Can. J. Plant Sci. 84, 697–704. doi: 10.4141/P03-109
Gesch R. W. and Archer D. W. (2013). Double-cropping with winter camelina in the northern Corn Belt to produce fuel and food. Ind. Crops Prod. 44, 718–725. doi: 10.1016/j.indcrop.2012.05.023
Gesch R. W., Archer D. W., and Berti M. T. (2014). Dual cropping winter camelina with soybean in the northern corn belt. Agron. J. 106, 1735–1745. doi: 10.2134/agronj14.0215
Gornall J., Betts R., Burke E., Clark R., Camp J., Willett K., et al. (2010). Implications of climate change for agricultural productivity in the early twenty-first century. Philos. Trans. R. Soc B. Biol. Sci. 365, 2973–2989. doi: 10.1098/rstb.2010.0158
Gowda P. H., Steiner J., Olson C., Boggess M., Farrigan T., and Grusak M. A. (2018). “Chapter 10: agriculture and rural communities. Impacts, risks, and adaptation in the United States: the fourth national climate assessment, volume II,” FOURTH NATIONAL CLIMATE ASSESSMENT (Washington, DC: U.S. Global Change Research Program). doi: 10.7930/NCA4.2018.CH10
Hijmans R. (2023). raster: Geographic Data Analysis and Modeling. https://CRAN.R-project.org/package=raster.
Hoerning C., Wells M. S., Gesch R., Forcella F., and Wyse D. (2020). Yield tradeoffs and weed suppression in a winter annual oilseed relay-cropping system. Agron. J. 112, 2485–2495. doi: 10.1002/agj2.20160
Hole F. D. (1978). An approach to landscape analysis with emphasis on soils. Geoderma 21, 1–23. doi: 10.1016/0016-7061(78)90002-2
Howden S. M., Soussana J.-F., Tubiello F. N., Chhetri N., Dunlop M., and Meinke H. (2007). Adapting agriculture to climate change. Proc. Natl. Acad. Sci. 104, 19691–19696. doi: 10.1073/pnas.0701890104
Hulbert S., Guy S. O., Pan W. L., Schillinger W. F., and Sowers K. (2012). Camelina Production in the Dryland Pacific Northwest (No. FS073E) (Pullman, WA: Washington State University Extension).
Hunsaker D. J., French A. N., Clarke T. R., and El-Shikha D. M. (2011). Water use, crop coefficients, and irrigation management criteria for camelina production in arid regions. Irrig. Sci. 29, 27–43. doi: 10.1007/s00271-010-0213-9
IPCC (2024). Climate Change 2023: Synthesis Report. Contribution of Working Groups I, II and III to the Sixth Assessment Report of the Intergovernmental Panel on Climate Change Core Writing Team, Lee H., and Romero J. (eds.). (Geneva, Switzerland: IPCC), pp. 35-115. doi: 10.59327/IPCC/AR6-9789291691647
Jewett F. G. (2015). “Camelina sativa: for biofuels and bioproducts,” in Industrial Crops, Handbook of Plant Breeding. Eds. Cruz V. M. V. and Dierig D. A. (Springer New York, New York, NY), 157–170. doi: 10.1007/978-1-4939-1447-0_8
Jiang Y., Caldwell C. D., and Falk K. C. (2014). Camelina seed quality in response to applied nitrogen, genotype and environment. Can. J. Plant Sci. 94, 971–980. doi: 10.4141/cjps2013-396
Kelly A. E. and Goulden M. L. (2008). Rapid shifts in plant distribution with recent climate change. Proc. Natl. Acad. Sci. 105, 11823–11826. doi: 10.1073/pnas.0802891105
Knapp C. N., Kluck D. R., Guntenspergen G., Ahlering M. A., Aimone N. M., Bamzai-Dodson A., et al. (2023). Chapter 25: Northern Great Plains. Fifth National Climate Assessment (Washington, DC, USA: U.S. Global Change Research Program). doi: 10.7930/NCA5.2023.CH25
Kuzmanović B., Petrović S., Nagl N., Mladenov V., Grahovac N., Zanetti F., et al. (2021). Yield-related traits of 20 spring camelina genotypes grown in a multi-environment study in Serbia. Agronomy 11, 858. doi: 10.3390/agronomy11050858
Lant C., Stoebner T. J., Schoof J. T., and Crabb B. (2016). The effect of climate change on rural land cover patterns in the Central United States. Clim. Change 138, 585–602. doi: 10.1007/s10584-016-1738-6
Leng G. and Huang M. (2017). Crop yield response to climate change varies with crop spatial distribution pattern. Sci. Rep. 7, 1463. doi: 10.1038/s41598-017-01599-2
McVay K. A. and Lamb P. F. (2008). Camelina Production in Montana (No. MT200701AG) (m: Montana State University Extension).
Mirek Z. (1960). Taxonomy and nomenclature of Camelina pilosa auct. Acta Soc Bot. Pol. 49, 553–561. doi: 10.5586/asbp.1980.050
Mohammadi A., Almasieh K., Nayeri D., Adibi M. A., and Wan H. Y. (2022). Comparison of habitat suitability and connectivity modelling for three carnivores of conservation concern in an Iranian montane landscape. Landsc. Ecol. 37, 411–430. doi: 10.1007/s10980-021-01386-5
Monteith J. L., Moss C. J., Cooke G. W., Pirie N. W., and Bell G. D. H. (1997). Climate and the efficiency of crop production in Britain. Philos. Trans. R. Soc Lond. B. Biol. Sci. 281, 277–294. doi: 10.1098/rstb.1977.0140
Moore A., Wysocki D. J., Chastain T. G., Wilson T., and DuVal A. (2019). Camelina Nutrient Management Guide for the Pacific Northwest (No. PNW0718) (Moscow, ID: University of Idaho Extension).
Moser B. R. and Vaughn S. F. (2010). Evaluation of alkyl esters from Camelina sativa oil as biodiesel and as blend components in ultra-low-sulfur diesel fuel☆. Bioresour. Technol. 101, 646–653. doi: 10.1016/j.biortech.2009.08.054
Nadakuduti S. S., Laforest L. C., Tachev M., Decker A. N., Egesa A. O., Shirazi A. S., et al. (2023). Heat stress during seed development leads to impaired physiological function and plasticity in seed oil accumulation in Camelina sativa. Front. Plant Sci. 14. doi: 10.3389/fpls.2023.1284573
NASS (2024). 2022 Census of Agriculture: United States Summary and State Data (No. AC-22-A-51), Geographic Area Series (United States: USDA National Agricultural Statistics Service).
O’Donnell M. S. and Ignizio D. A. (2012). Bioclimatic predictors for supporting ecological applications in the conterminous United States, Data Series 691 (Reston, Virginia: US Geological Survey).
Obour A. K., Obeng E., Mohammed Y. A., Ciampitti I. A., Durrett T. P., Aznar-Moreno J. A., et al. (2017). Camelina seed yield and fatty acids as influenced by genotype and environment. Agron. J. 109, 947–956. doi: 10.2134/agronj2016.05.0256
Obour A. K., Sintim H. Y., Obeng E., and Jelizakof V. D. (2015). Oilseed camelina (Camelina sativa L crantz): production systems, prospects and challenges in the USA great plains. Adv. Plants Agric. Res. 2, 68–76. doi: 10.15406/apar.2015.02.00043
Pavlista A. D., Baltensperger D. D., Isbell T. A., and Hergert G. W. (2012). Comparative growth of spring-planted canola, brown mustard and camelina. Ind. Crops Prod. 36, 9–13. doi: 10.1016/j.indcrop.2011.07.020
Pavlista A. D., Santra D. K., Isbell T. A., Baltensperger D. D., Hergert G. W., Krall J., et al. (2011). Adaptability of irrigated spring canola oil production to the US High Plains. Ind. Crops Prod. 33, 165–169. doi: 10.1016/j.indcrop.2010.10.005
Pearson R. G., Stanton J. C., Shoemaker K. T., Aiello-Lammens M. E., Ersts P. J., Horning N., et al. (2014). Life history and spatial traits predict extinction risk due to climate change. Nat. Clim. Change 4, 217–221. doi: 10.1038/nclimate2113
Pebesma E. (2018). Simple features for R: standardized support for spatial vector data. R. J. 10, 439. doi: 10.32614/RJ-2018-009
Pebesma E. and Bivand R. (2023). Spatial Data Science: With Applications in R, 1st ed (New York: Chapman and Hall/CRC). doi: 10.1201/9780429459016
Phillips P. W. B., Khachatourians G. G., and Phillips P. W. B. (Eds.) (2001). The biotechnology revolution in global agriculture: innovation, invention and investment in the Canola industry, Biotechnology in agriculture series (Wallingford, Oxon: Cabi Publ).
Pierce D. W., Barnett T. P., Santer B. D., and Gleckler P. J. (2009). Selecting global climate models for regional climate change studies. Proc. Natl. Acad. Sci. 106, 8441–8446. doi: 10.1073/pnas.0900094106
Putnam D. H., Budin J. T., Field L. A., and Breene W. M. (1993). Camelina: A promising low-input oilseed. In: Janick J. and Simon J.E. New crops. p. 314-322. (eds.), Wiley, New York.
Qian B., Zhang X., Smith W., Grant B., Jing Q., Cannon A. J., et al. (2019). Climate change impacts on Canadian yields of spring wheat, canola and maize for global warming levels of 1.5°C, 2.0°C, 2.5°C and 3.0°C. Environ. Res. Lett. 14, 074005. doi: 10.1088/1748-9326/ab17fb
Ramankutty N., Foley J. A., Norman J., and McSweeney K. (2002). The global distribution of cultivable lands: current patterns and sensitivity to possible climate change. Glob. Ecol. Biogeogr. 11, 377–392. doi: 10.1046/j.1466-822x.2002.00294.x
R Core Team (2024). R: A Language and Environment for Statistical Computing. Vienna, Austria. https://www.R-project.org/.
Reimer J. J. and Zheng X. (2017). Economic analysis of an aviation bioenergy supply chain. Renew. Sustain. Energy Rev. 77, 945–954. doi: 10.1016/j.rser.2016.12.036
Rosenberg N. J. (1992). Adaptation of agriculture to climate change. Clim. Change 21, 385–405. doi: 10.1007/BF00141378
Schaetzl R. J. (1986). Soilscape analysis of contrasting glacial terrains in wisconsin. Ann. Assoc. Am. Geogr. 76, 414–425. doi: 10.1111/j.1467-8306.1986.tb00128.x
Schaetzl R. J., Krist F. J. Jr., and Miller B. A. (2012). A taxonomically based, ordinal estimate of soil productivity for landscape-scale analyses. Soil Sci. 177, 288–299. doi: 10.1097/SS.0b013e3182446c88
Schaetzl R. J., Krist F. J. Jr., Stanley K. E., and Hupy C. M. (2009). The natural soil drainage index: an ordinal estimate of long-term, soil wetness. Phys. Geogr. 30, 3830409. doi: 10.2747/0272-3646.30.5.383
Schillinger W. F., Wysocki D. J., Chastain T. G., Guy S. O., and Karow R. S. (2012). Camelina: Planting date and method effects on stand establishment and seed yield. Field Crops Res. 130, 138–144. doi: 10.1016/j.fcr.2012.02.019
Schillinger W. F., Wysocki D. J., Chastain T. G., Guy S. O., and Karow R. S. (2013). Camelina: Effects of Planting Date and Method on Stand Establishment and Seed Yield (No. PNW661) (Pullman, WA: Washington State University Extension).
Shen T., Yu H., and Wang Y.-Z. (2021). Assessing the impacts of climate change and habitat suitability on the distribution and quality of medicinal plant using multiple information integration: Take Gentiana rigescens as an example. Ecol. Indic. 123, 107376. doi: 10.1016/j.ecolind.2021.107376
Stefansson B. R. and Kondra Z. P. (1975). Tower summer rape. Can. J. Plant Sci. 55, 343–344. doi: 10.4141/cjps75-053
Steppuhn H., Falk K. C., and Zhou R. (2010). Emergence, height, grain yield and oil content of camelina and canola grown in saline media. Can. J. Soil Sci. 90, 151–164. doi: 10.4141/CJSS09046
Su H., Bista M., and Li M. (2021). Mapping habitat suitability for Asiatic black bear and red panda in Makalu Barun National Park of Nepal from Maxent and GARP models. Sci. Rep. 11, 14135. doi: 10.1038/s41598-021-93540-x
Sydor M., Kurasiak-Popowska D., Stuper-Szablewska K., and Rogoziński T. (2022). Camelina sativa. Status quo and future perspectives. Ind. Crops Prod. 187, 115531. doi: 10.1016/j.indcrop.2022.115531
Uddin S., Löw M., Parvin S., Fitzgerald G. J., Tausz-Posch S., Armstrong R., et al. (2018). Yield of canola (Brassica napus L.) benefits more from elevated CO2 when access to deeper soil water is improved. Environ. Exp. Bot. 155, 518–528. doi: 10.1016/j.envexpbot.2018.07.017
United States Department of Agriculture (USDA) (2015). Adoption of genetically engineered crops in the U.S. United States Department of Agriculture, USA. Washington, D.C.
Von Cossel M., Lewandowski I., Elbersen B., Staritsky I., Van Eupen M., Iqbal Y., et al. (2019). Marginal agricultural land low-input systems for biomass production. Energies 12, 3123. doi: 10.3390/en12163123
Wang C., Liu H., Li Y., Dong B., Qiu C., Yang J., et al. (2021). Study on habitat suitability and environmental variable thresholds of rare waterbirds. Sci. Total Environ. 785, 147316. doi: 10.1016/j.scitotenv.2021.147316
Weyers S., Thom M., Forcella F., Eberle C., Matthees H., Gesch R., et al. (2019). Reduced potential for nitrogen loss in cover crop–soybean relay systems in a cold climate. J. Environ. Qual. 48, 660–669. doi: 10.2134/jeq2018.09.0350
Zanetti F., Alberghini B., Marjanović Jeromela A., Grahovac N., Rajković D., Kiprovski B., et al. (2021). Camelina, an ancient oilseed crop actively contributing to the rural renaissance in Europe. A. Review Agron. Sustain. Dev. 41, 2. doi: 10.1007/s13593-020-00663-y
Zanetti F., Eynck C., Christou M., Krzyżaniak M., Righini D., Alexopoulou E., et al. (2017). Agronomic performance and seed quality attributes of Camelina (Camelina sativa L. crantz) in multi-environment trials across Europe and Canada. Ind. Crops Prod. 107, 602–608. doi: 10.1016/j.indcrop.2017.06.022
Keywords: camelina, canola, rapeseed, oilseed, climate smart agriculture, soil, climate change
Citation: Quinlan G and Goslee S (2025) The future of oilseeds: climate change expected to negatively impact canola more than camelina. Front. Agron. 7:1498293. doi: 10.3389/fagro.2025.1498293
Received: 18 September 2024; Accepted: 28 May 2025;
Published: 19 June 2025.
Edited by:
Debankur Sanyal, University of Arizona, United StatesReviewed by:
Ali Parsaeimehr, South Dakota State University, United StatesRuss Gesch, Agricultural Research Service (USDA), United States
Copyright © 2025 Quinlan and Goslee. This is an open-access article distributed under the terms of the Creative Commons Attribution License (CC BY). The use, distribution or reproduction in other forums is permitted, provided the original author(s) and the copyright owner(s) are credited and that the original publication in this journal is cited, in accordance with accepted academic practice. No use, distribution or reproduction is permitted which does not comply with these terms.
*Correspondence: Gabriela Quinlan, Z21xdWlubGFAbmNzdS5lZHU=