 Etefa Tilahun Ashine
 Addisu Assefa Mengesha†
 Minda Tadesse Bedane
- Jimma Agricultural Research Center, Ethiopian Institute of Agricultural Research, Jimma, Ethiopia
Evaluating the performance of irrigation schemes is crucial to identify key problems that impede scheme efficiencies and the utilization of available resources. Accordingly, the objective of this study was to evaluate the performance of Dabasso Lamaffa small-scale irrigation scheme. The study was carried out during the cropping season from November up to March 2015 E.C. Primary and secondary data were collected for implementing the efficiency and productivity of the scheme. To collect and measure the relevant data at the field level, the three representative farmers’ fields were selected at the head, middle, and tail-end water users in the irrigation scheme. Both internal and external performance indicators were considered for evaluation of the scheme. The internal indicators were conveyance efficiency, application efficiency, storage efficiency, distribution uniformity, and deep percolation ratio. The external indicators were agricultural output, water supply indicators, water delivery capacity indicators, physical indicators, and economic and financial indicators. The result reveals that the average efficiency of conveyance, application, storage, deep percolation ratio, and the distribution uniformity of the scheme were 76.44%, 30.47%, 82.74%, 69.53%, and 95.29%, respectively. The overall efficiency of the scheme was 23.29%, showing that the performance was poor, and it was caused mainly due to the water application problem at the field. The agricultural output productivity was 2620.83 (US$/ha), 2501.71 (US$/ha), 0.94 (US$/m3), and 0.91 (US$/m3), respectively, for output per unit irrigated area, output per unit command area, output per unit irrigation diverted, and output per unit water consumed. This result reveals that it was in a recommended output production, and in these regards the scheme was productive. The water supply indicators, such as relative irrigation supply (RIS) and relative water supply (RWS), were 2.13 and 2.05, which shows that there was no deficiency of water and it was supplied in excess. However, the water delivery capacity of the scheme was low, which was 83%, and it needs improvement. The irrigation ratio and the sustainability of the irrigation scheme were also good, showing there will be a continuation of using the scheme in the future. Awareness creation for the farmers on the field water management is essential to improve the economic and financial benefit of the scheme in the future.
1 Introduction
Agriculture plays a pivotal role in Ethiopia’s economy, serving as the backbone of the nation by contributing significantly to gross domestic product (GDP), providing employment for the majority of the population, and acting as the primary source of export earnings. According to Makombe et al. (2007), it accounts for approximately 46% of the GDP, 85% of the export, and 80% of the employment opportunities. Both industry and services depend strongly on the performance of agriculture, which provides raw materials, generates foreign currency for the import of essential inputs, and provides food for the fast-growing population. Despite its importance to the national economy, it is largely based on subsistence farming in Ethiopia. The productivity of the agricultural sector is very low and lags behind the population growth rate, resulting in food insecurity. Natural resources, such as land, water, and clean air, are vital for agricultural production, which has an impact on the food security of a nation and needs conservation (Kumar et al., 2022). Long-term sustainable agricultural production with the growing resource constraint of ensuring environmental conservation could be attained by implementing effective irrigation management strategies (Zhang et al., 2023; Hacisiileyman and Ozger, 2024).
Due to spatial and temporal rainfall variability, land degradation, fertility depletion, and climate change effects, Ethiopia, which is the second most populated country in Africa (Worldometer, 2023), will not be able to meet the food security of the country through a rainfed farming system. The production is severely affected by spatial and temporal rainfall variability, soil moisture stress, land soil fertility degradation, and climate change (Zerssa et al., 2021; Worqlul et al., 2019; Verma et al., 2023). Irrigation has been recognized by many development partners as the panacea to the food insecurity problem facing many developing countries, as rainfall patterns in many countries have become more unpredictable and inconsistent with traditional farming seasons (Bowan et al., 2023). In line with this, considering a combination of areas with specific crop patterns is vital in assessing the irrigation needs for a diversified cropping pattern for efficient utilization and effective water resource management (Kilic and Ozcakal, 2024; Rajput et al., 2025). Accordingly, Ethiopia is focusing on irrigated agriculture through the construction of irrigation infrastructure in small-and large-scale irrigation schemes for productivity improvement and sustainable production by constructing dams and other water harvesting structures. Hence, to reduce food insecurity, the government is investing in the development of small-scale community-based irrigation schemes (MoWR, 2001).
Small-scale irrigation is irrigated agricultural production on a small plot of land, the construction, operation, and maintenance require a relatively lower investment cost, and it is considered important for food security and food self-sufficiency (Tulu, 2003; Serbessa, 2018; Moges, 2022). Small-scale irrigation development, is of significant importance, raising production and productivity to achieve food self-sufficiency and ensure food security at the household and national levels (Brabben et al., 2004; Tesfaye et al., 2008; Gebregziabher et al., 2009). Irrigated agriculture can also play a vital role in supplying the required raw materials for domestic agro-industries and increasing export earnings. It could also play a key role in the improvement of the livelihood and economic welfare of many rural communities (Hussain and Hanjra, 2004). Even though the emphasis of irrigation development in Ethiopia is to maximize agricultural production to satisfy the ever-increasing food demand of the country and improve the income of the smallholder farmers through constructing schemes, unfortunately, the performance of most schemes was below the expected levels (Embaye et al., 2020; Haile et al., 2020).
Evaluating and improving the performance of existing schemes is a smart way of promoting sustainable development and is used as a benchmark for further irrigation improvement (Belay et al., 2023). Based on the different studies conducted for the evaluation of the irrigation schemes in Ethiopia, the major problems for their poor performance included technical, socioeconomic, institutional, and environmental aspects (Awulachew and Ayana, 2011; Amede, 2015; Berhane et al., 2016). Even though these reports were generally reported, effective management of the irrigation water in the field and administration of the scheme were some of the factors that could improve the performance. Due to the rise in farmers’ interest in irrigation, increasing water demand, and the increase in extension experts (Singh et al., 2016; Rajput et al., 2023), there has been increasing pressure to improve irrigation schemes’ performance to ensure land and water productivity.
Evaluating the performance of an existing scheme is crucial to identify the key problems that impede the scheme’s efficiency and utilization of available resources. Irrigation systems must be continuously evaluated and monitored regarding crop yield (Bowan et al., 2023; Rajput et al., 2024), with land and water productivity as the final goal of the irrigation system (Moges, 2022; Abo et al., 2024). Clear information is essential on how well one system is performing relative to another, which system responds better to irrigated agriculture output, and how much the irrigation schemes meet the planned and implemented objectives. Additionally, a performance evaluation is the analysis of an irrigation system based on measurements taken under field conditions. These are then compared with the ideal measurements and the efficiency of the diverted water and conveyed water, and adequacy and uniformity of the application of the diverted water to the field are determined (Jibril et al., 2017). Therefore, the objective of this study was to evaluate the performance of the Dabasso Lamaffa small-scale irrigation scheme.
2 Materials and methods
2.1 Description of the study site
The study site was located at Dabasso Lamaaffa, in the Buno Bedele Zone of the Oromia Regional State in the Chora District (Figure 1). Geographically, it is situated between 8°25.17′ latitude and 36°9.552′ longitude and at an altitude of 1,845m above mean sea level (AMSL). It has a yearly maximum and minimum temperature, relative humidity, wind speed, and solar radiation duration of 27.1°C, 9.12°C, 72.43%, 0.57m/s, and 6.88hr, respectively. The total annual average rainfall was 1,732 mm distributed non-uniformly mainly in the summer season. The small-scale irrigation scheme was constructed in 2022 with the financial support from the Agricultural Growth Program (AGP).
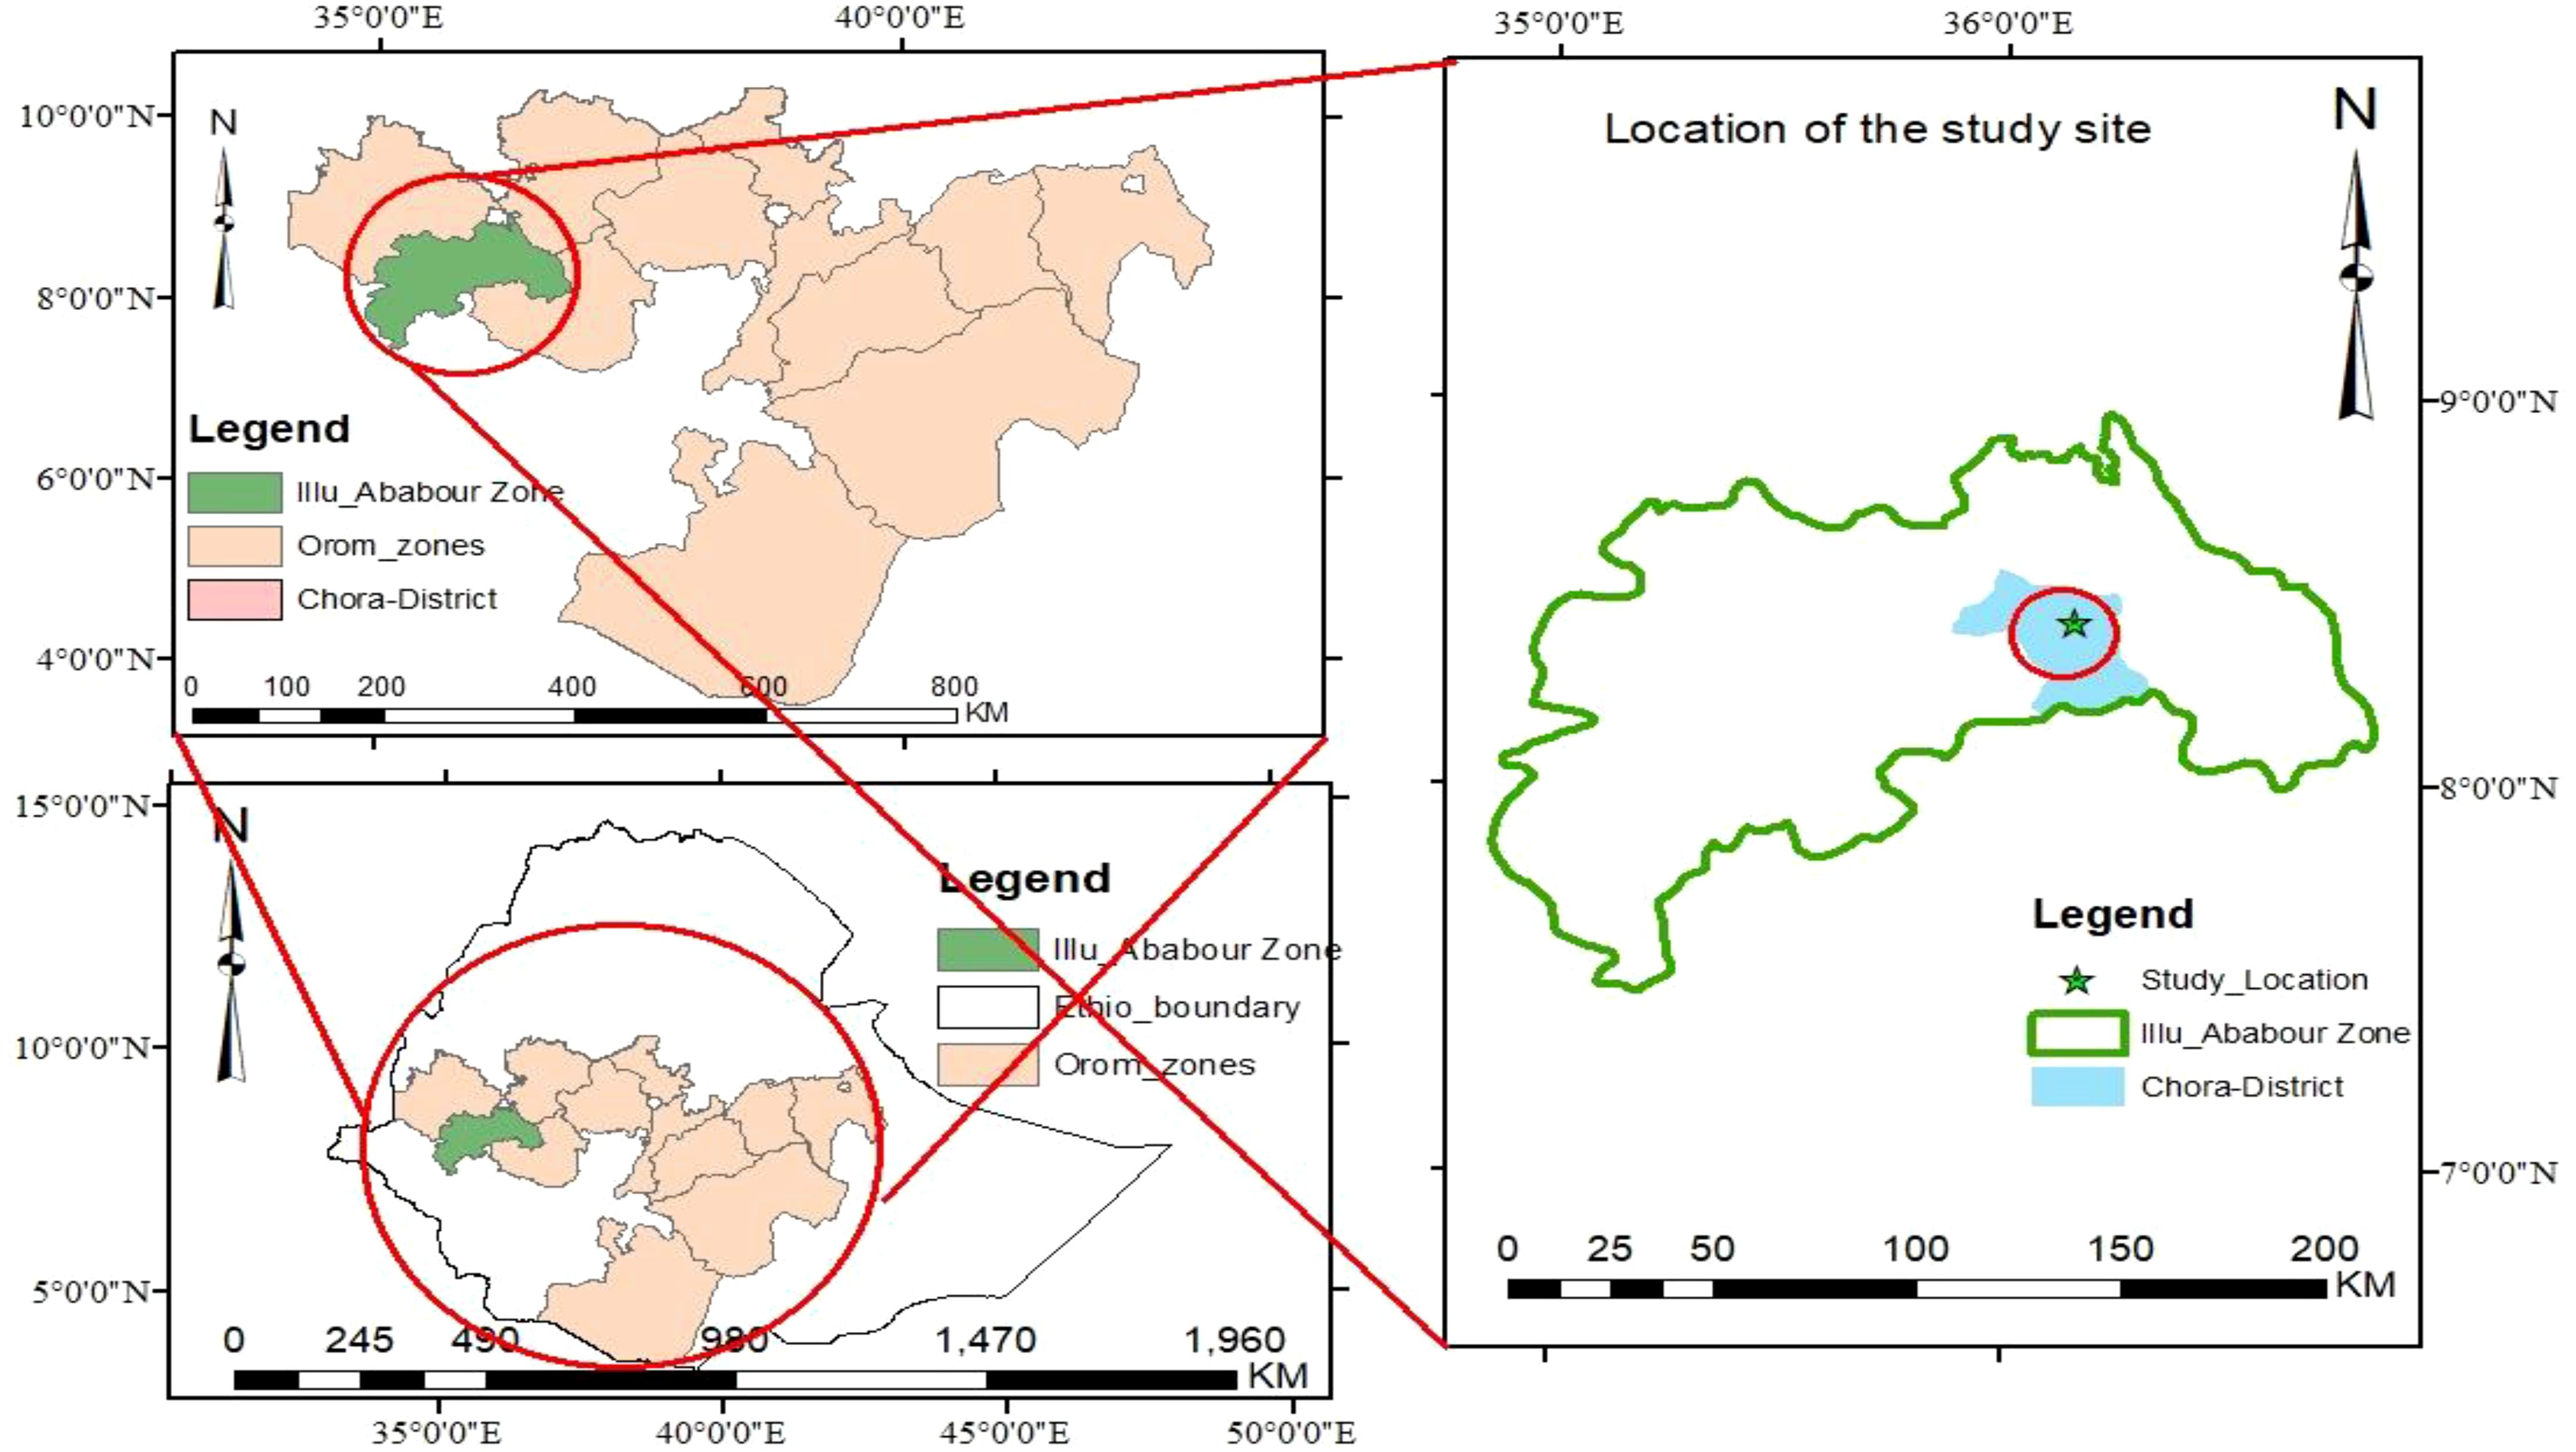
Figure 1. Geographical location of the study site.
2.2 Methods of data collection
Primary and secondary data were collected to assess the efficiency and productivity of the scheme. These data were collected through formal discussions with the zonal and wereda small-scale irrigation scheme experts, a field survey, and data collected from the field. The study was carried out during the cropping period from November to March 2015. To collect and measure the relevant data at the field level, three farmers’ fields were selected representing the head, middle, and tail-end water users in the irrigation scheme based on land tenure arrangements, water management practices, the willingness of the farmers, and the reach of the main canal that supplies the irrigation water (Figure 2).
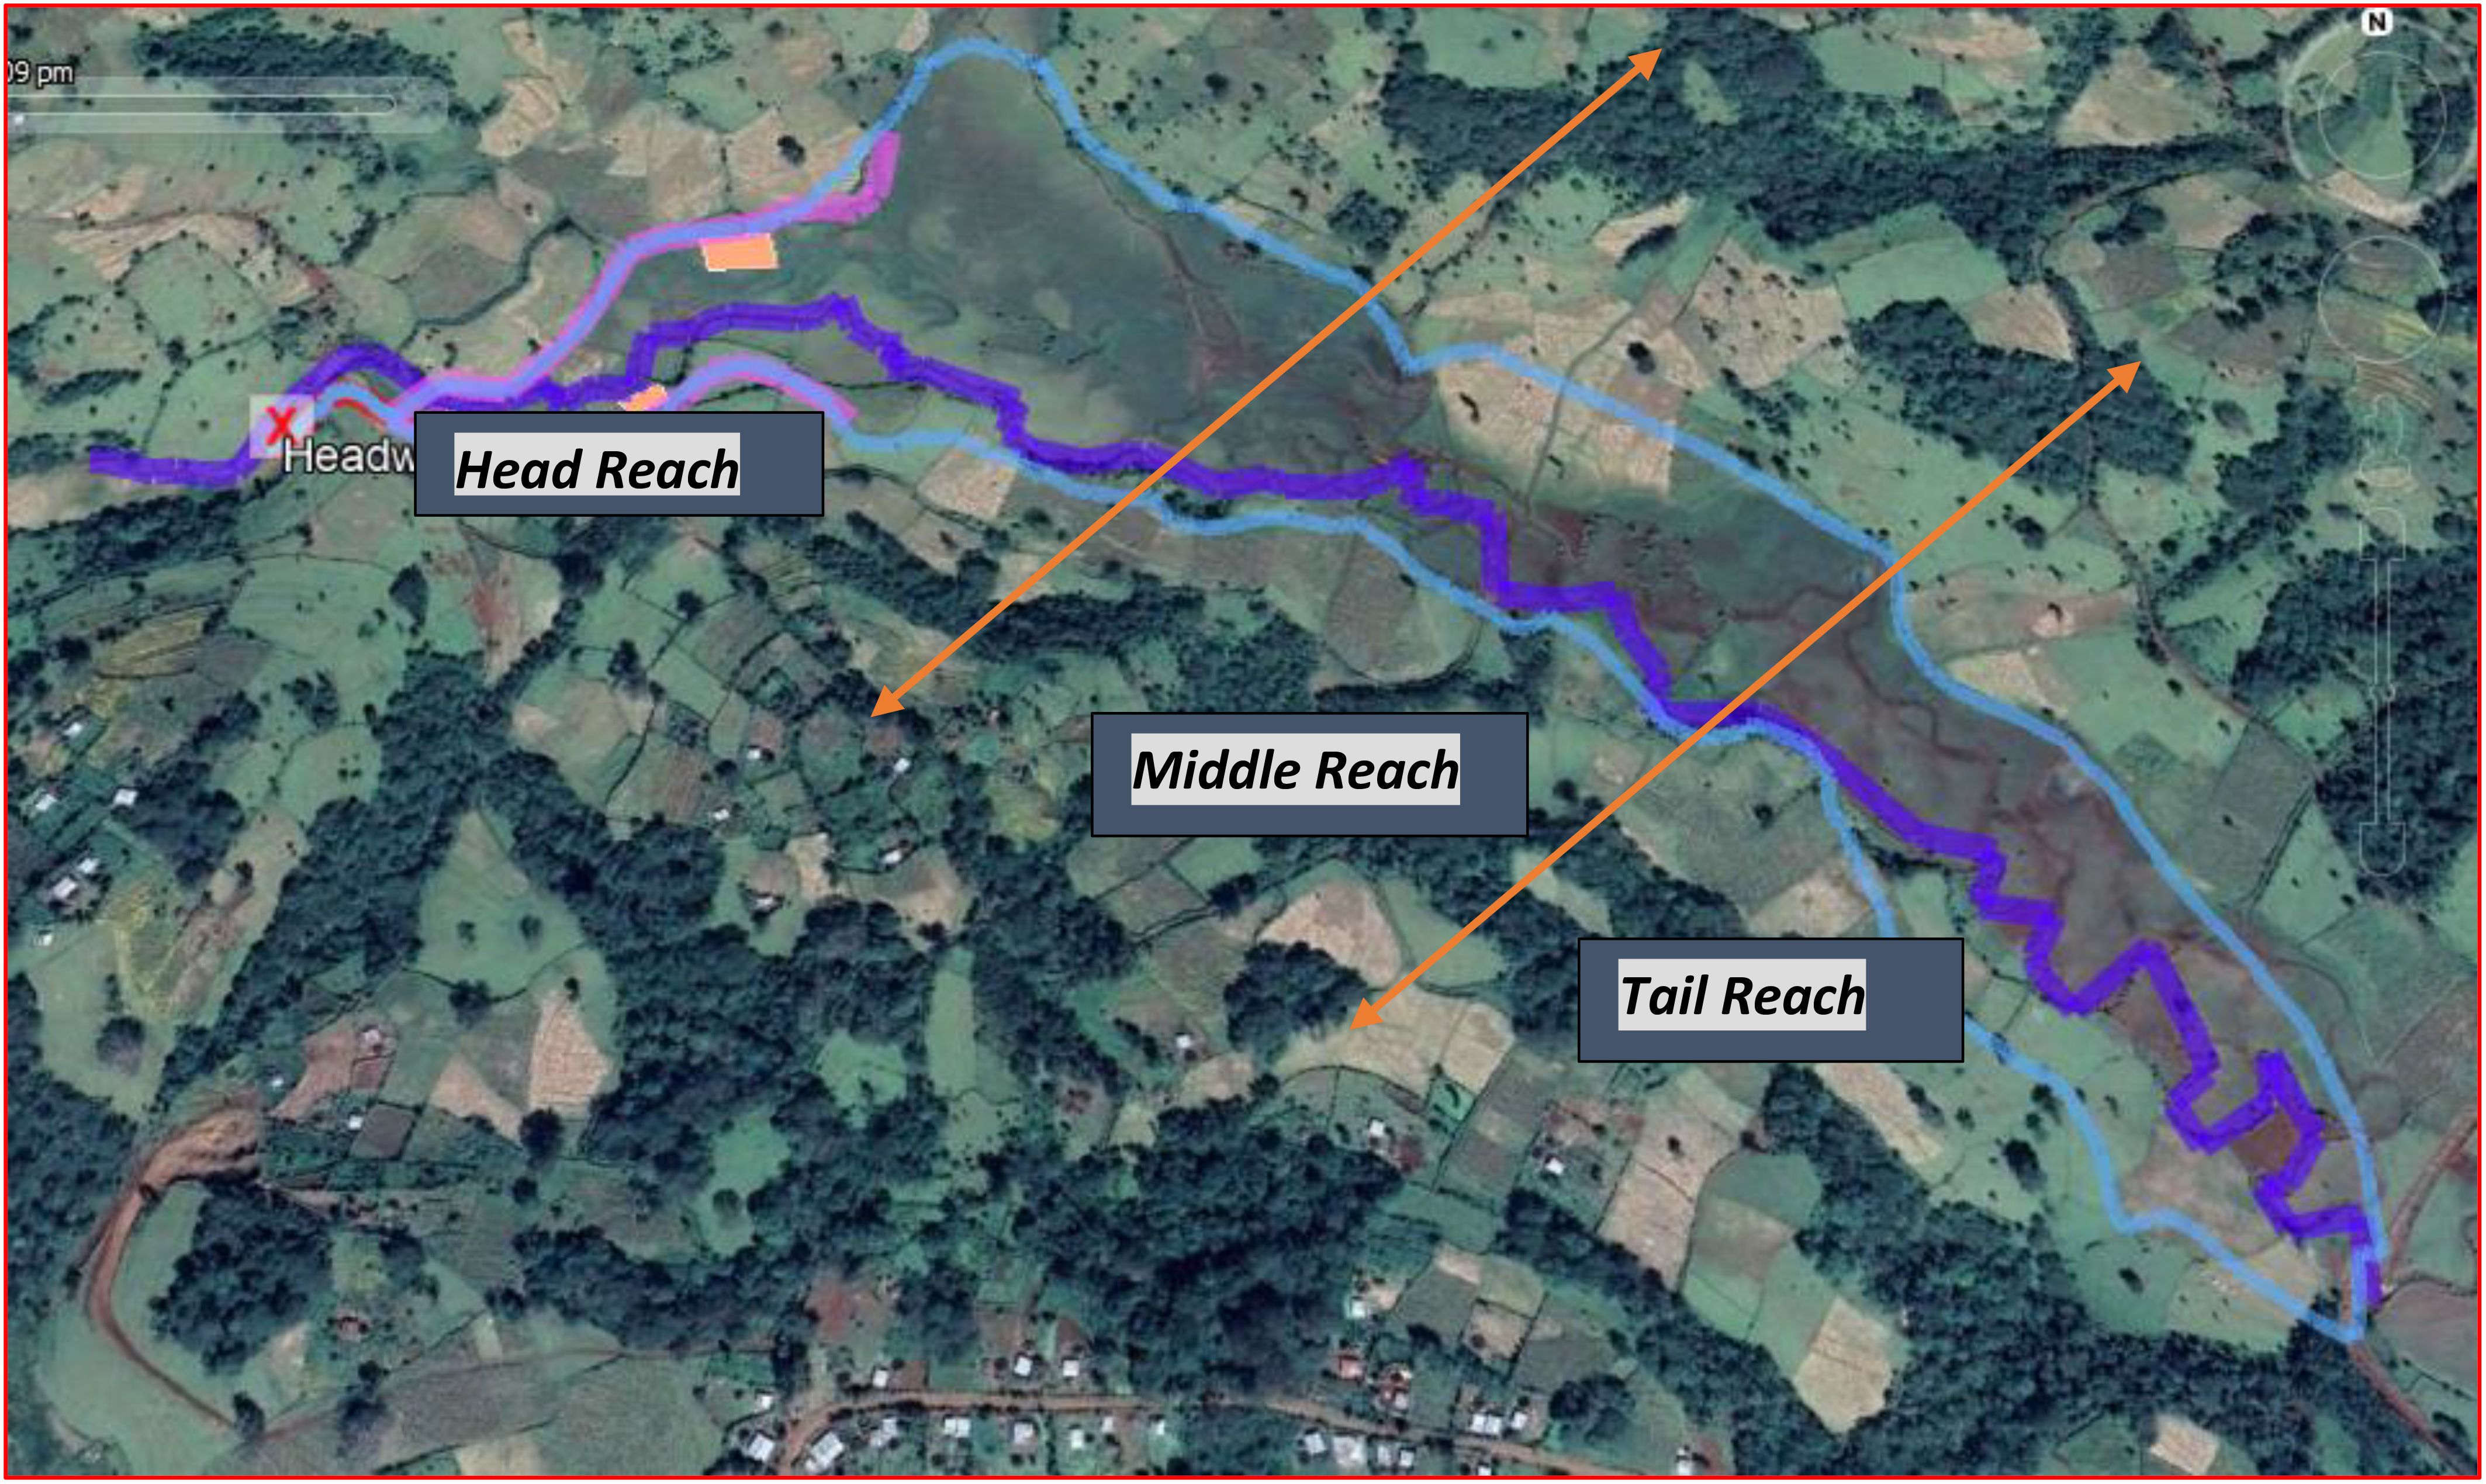
Figure 2. Location of the head, middle, and tail reaches of the scheme (Source: Retrieved from Google Earth).
2.2.1 Primary data collection
To assess the necessary performance indicators, three farm sites and crops in that field were selected from the top (head), middle, and tail reaches of the scheme. The primary data collection included a field observation to observe farmers’ indigenous knowledge, the practice of water application in the field, how they managed the water applied to the field, practices used to deliver the water from the canal to the field and create the water jump to increase its energy, how they scheduled water applications to the crop, the application program, and general water management techniques. The data regarding the construction of the canal following the longitudinal slope of the site and the layout and geometry of the physical features of the canal were also observed and collected.
Soil samples were collected at the head, middle, and tail reaches of the scheme up to 90 cm with 30 cm intervals using auger methods. Soil texture was estimated using a hydrometer test after drying in an oven at 105°C for 24 hr, and field capacity and permanent wilting point were evaluated using a pressure plate apparatus. A 5 cm × 5 cm core sampler was utilized to extract soil samples from the head, middle, and tail reaches from five points each at three different depths to assess the soil´s bulk density. The soil samples collected from the three areas at different depths before and after irrigation were weighed and oven-dried to determine the soil water content in the soil and other efficiencies.
2.2.2 Secondary data collection
Data that were relevant for the assessment such as design discharge, initial command area, and beneficiaries of the household were collected from the zonal agricultural and wereda agricultural offices of the irrigation and scheme administration program. Additionally, yearly climatic data were also collected from the Ethiopian National Meteorological Service Agency. Crop data (development stages, crop coefficient, rooting depth, critical depletion level, and yield response factor) were also collected from secondary data (Allen et al., 2016; Luo et al., 2022).
2.3 Determination of crop water and irrigation water requirements of the crops
For the determination of the crop and irrigation water requirements (Equations 1, 2), the CROPWAT 8.0 computer program was used to estimate the total water requirements of the crops grown in the irrigation schemes (Allen et al., 1998). The Penman–Monteith strategy was chosen to calculate the reference crop evaporation (ETo) (FAO, 1992). The value of Kc of the crop was taken from an FAO document (FAO, 1992 and Food and Agriculture Organization (FAO), 1998). The effective rainfall (Peff) was determined by the United States Department of Agriculture’s (USDA) soil preservation strategy.
where; Kc= Crop Coefficients Peff = Effective Rainfall ETo= Reference crop evaporation
2.4 Determination of performance evaluation of the internal indicators
2.4.1 Water flow rate measurement and conveyance efficiency
To determine the conveyance efficiency (Ec) of the canal, a current meter (electronic current meter) device was used at the head, middle, and tail reaches of the canal. It is a widely used device for the measurement of flow velocity and, hence, the discharge in an open channel flow. A cup-type current meter was used to determine the conveyance efficiency of the canal.
To measure the conveyance efficiency, a regular section of the canal was used and the cross-sectional area of the canal, i.e., the depth and width of the canal was measured using a tape meter. The flow velocity was measured by the current meter apparatus. The water flow discharge was then measured by multiplying the cross-sectional area by the flow velocity (Equation 3). For the measurement, a straight canal section and steady flow were considered. This procedure was also used at the middle and tail reaches of the canal. Since there was no secondary and tertiary canal, it was not measured. Finally, the canal conveyance efficiency was determined by considering the flow at two points, the first flow section was the inflow and the other section was the outflow and it is calculated using Equation 4 and the losses in the canal was calculated using Equation 5 (Michael, 2008).
where Q- Discharge (m3/s), A-Cross=sectional area (m2), and V- Flow velocity (m/s).
where Qout is outflow discharge (m3/s) and Qin is inflow discharge (m3/s).
The losses in the conveyance system were computed as
where Lc is the conveyance loss (m3/sec).
2.4.2 Application efficiency
Before applying the irrigation water to the field, determining the type of the crop, the development stage of the crop, and other soil properties of the scheme were essential. In this study, collecting the soil sample before and after irrigation was the basis to determine how the water was effectively used by the crop in each farmer’s field. The crop in the three fields was wheat and it was used as the study crop in the scheme.
Soil samples were collected from the three sites of the scheme, namely from the top, middle, and tail of the scheme from the selected farmers’ fields based on the root depth of the selected crop (wheat) for assessment before and after irrigation. From one site at the top, middle, and tail of the scheme, composite soil samples were collected from five representative points, two samples from the first 1/3rd and the last 1/3rd, and one from the second 1/3rd area of the farm (Figure 3) at three depths at intervals of 30 cm up to 90 cm using a soil auger. These samples were collected to determine the soil’s physical and chemical properties such as soil moisture, texture, soil field capacity, and permanent wilting point.
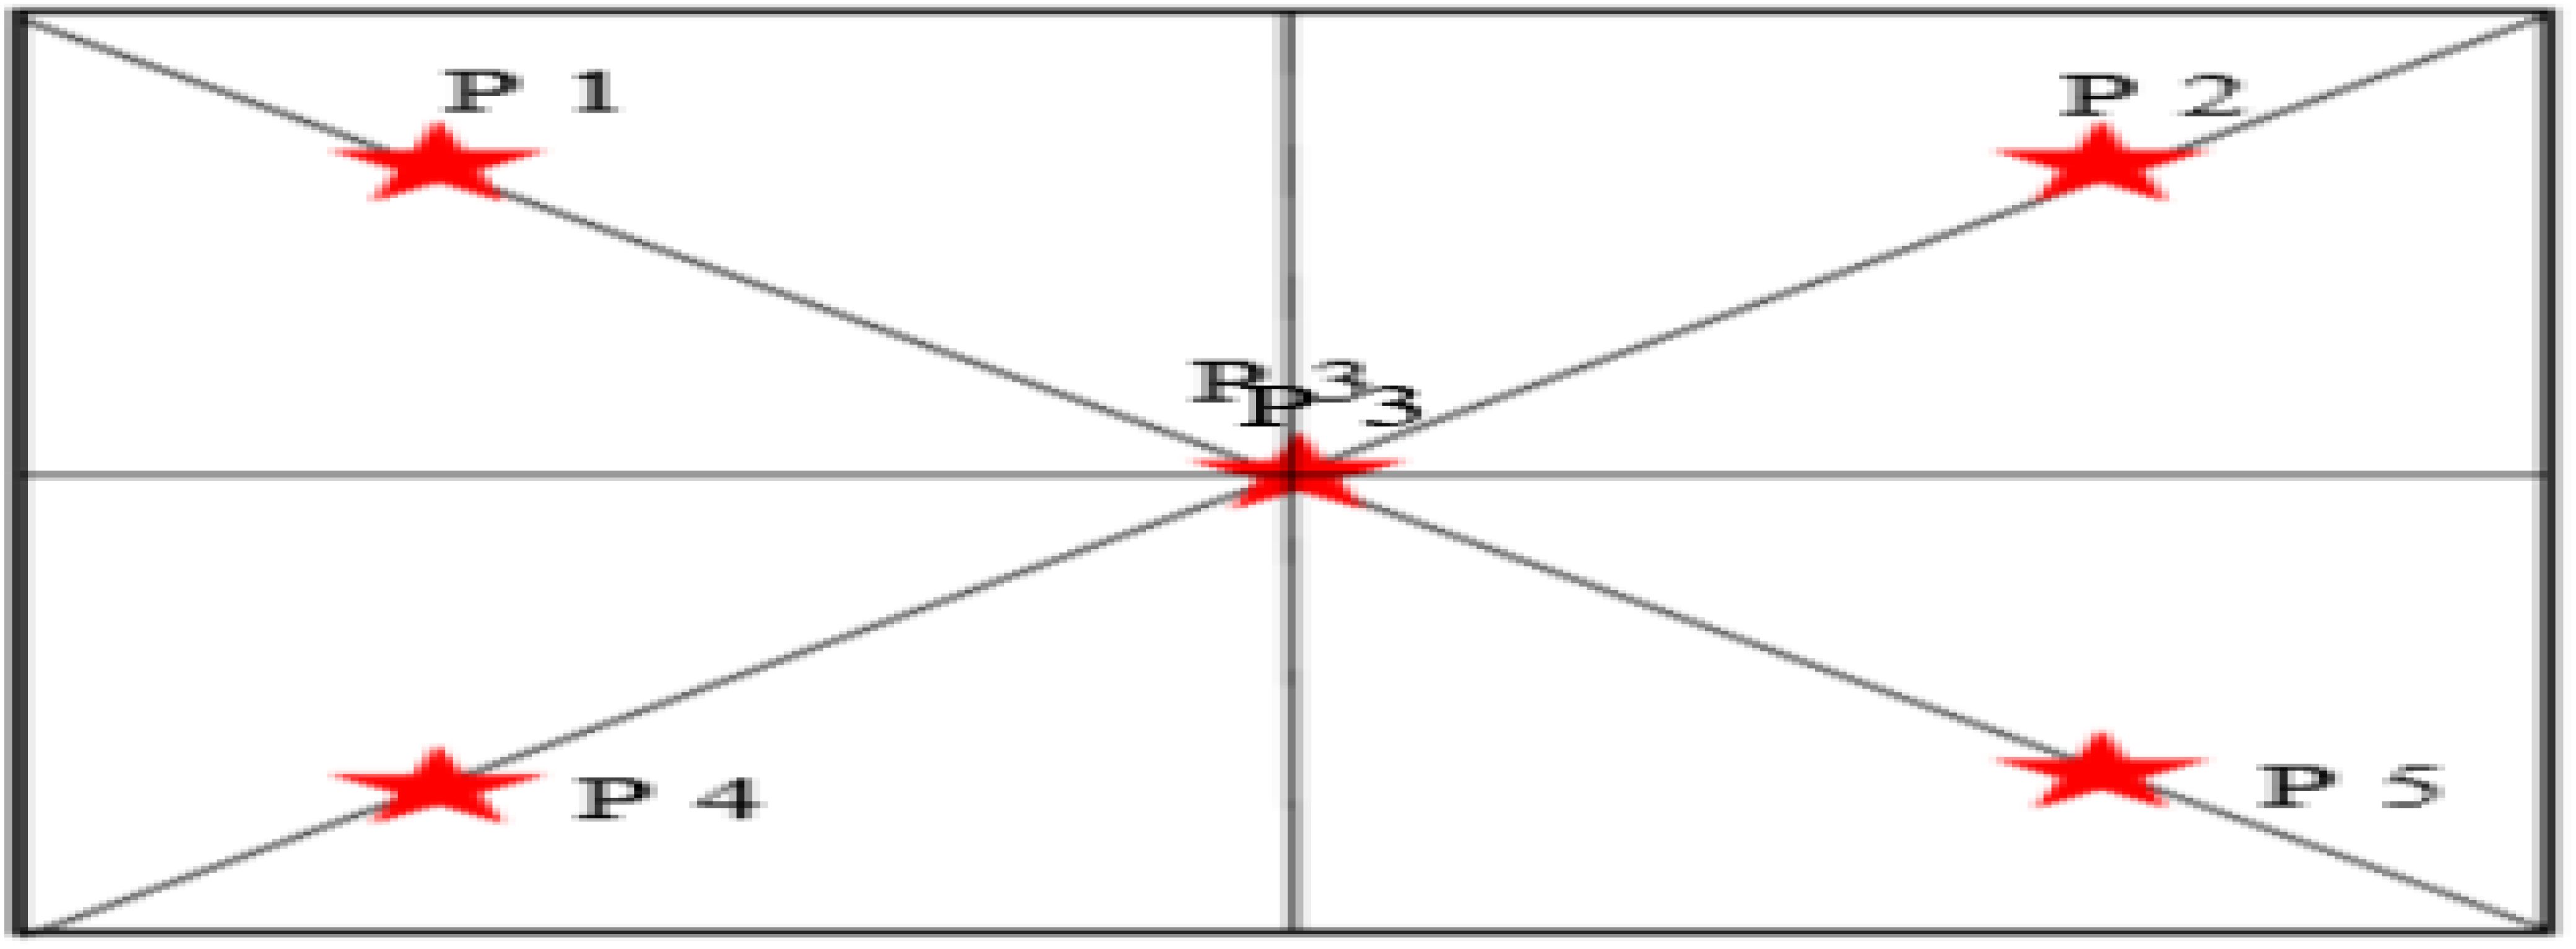
Figure 3. Representation of soil sampling points (Source: Field observation data).
To determine the soil water content at field capacity (FC) and at the permanent wilting point (PWP) for the determination of the total available water, a collected composite soil sample was used and the collected soil sample was analyzed at Debrezeit Agricultural Research Center using the pressure plate apparatus. The bulk density, the soil water content, and the total available water content, which were the basis to determine the application efficiency (Ea), were determined using the following equations (Equations 6–8):
where BD is the soil bulk density (g/cm3), Ws is the mass of dry soil (g), Vc is the volume of soil in the core (cm3), TAW is the volumetric total available water in the root zone (mm/m), Rd is the root depth (m),
θFC is the volumetric moisture content at field capacity (m3/m3), θV is the volumetric moisture content in (%), and θPWP is the volumetric moisture content at the permanent wilting point (m3/m3).
The Ea was determined by measuring the depth of water applied to each field in each specific irrigation field to the selected crop. Before irrigation, a soil sample was collected, and after that, irrigation was provided to the crop. Two days after irrigation, the depth of water stored in the root zone was determined as the difference between the after- and before-irrigation moisture contents of the soil. To do this, a total of 30 soil samples, i.e., 15 samples before and 15 samples after irrigation, were collected at 30 cm depth intervals up to 90 cm from the top, middle, and tail reaches, respectively, to determine the water stored in the soil root zone and the total depth of water applied to the field. The application efficiency was determined using Equation 9. The average depth of water stored in the root zone of the plant and average water delivered to the field was determined using Equation 10 and Equation 11 as shown below.
where Q is the discharge of irrigation water applied to the field (l/sec), A is the irrigated land area within the applied time (m2), t is the application time (sec), and d is the depth of soil (mm).
2.4.3 Storage efficiency
To determine the water stored in the soil root zone of each field, soil samples were collected from three representative sites in the selected farms at the top, middle, and tail reaches. Similarly, five samples were collected, two samples from the first 1/3rd and the last 1/3rd, and one from the second 1/3rd area of the farm at depths of 0–30 cm, 30–60 cm, and 60–90 cm based on the root depth of the study crop (wheat crop) before and after each irrigation event. The moisture content was determined using the gravimetric method.
The storage efficiency (Es) was calculated as the ratio of the quantity of water stored in the root zone to the quantity of water needed in the root zone of the crop. It was calculated using Equation 12.
where Es is the storage efficiency (%), Ws is the water stored in the root zone during irrigation (mm), and Wn is the water needed in the root zone prior to irrigation.
The water needed in the root zone prior to irrigation was computed using Equation 13 (Michael, 2008).
where Wn is the net amount of water to be applied during an irrigation (mm), Mfci and Mbi are the moisture content at field capacity and before irrigation in the ith layer of the soil (%), ρb and ρw are the bulk density of the soil in the ith layer and density of water (g/cm3), di is the depth of the soil layer within the root zone (mm), and n is the number of soil layers in the root zone.
2.4.4 Water distribution uniformity
Distribution uniformity (DU%) is a way of measuring whether all plants are getting the same amount of water. It does not measure whether enough or too much water is applied. The higher the distribution uniformity, the better the irrigation system is working. The distribution uniformity of the water applied to the field was determined using Equation 20. To determine the water stored in the soil root zone, each field was divided into three parts at the head, middle, and tail of the field. In total, from five places at depths of 0–30, 30–60, and 60–90 cm, soil samples were collected before and after each irrigation event.
Then, after the soil moisture contents of the soil samples were determined gravimetrically, at the selected points, the depth of stored water at a particular soil layer [X (0-30), X (30-60), and X (60-90)] was calculated using the Equation 14:
Where X is the soil moisture content stored at a respective depth interval (mm); Mai and Mbi are the moisture content of the ith layer of the soil after and before irrigation, respectively on weight basis (%); ρb and ρw are the Bulk density of the soil in the ith layer and density of water (g/cm3); and di is the Depth of the soil in the ith layer (mm).
The total depth of water stored at each point (X1 to X5) as shown in Equations 15–19 was determined by summing the values of X1(0-30), X1(30-60), and X1(60-90) of that specific point, i.e.,
Finally, the distribution uniformity was determined by
where Du is the water distribution uniformity (%), is the mean of the lower quarter depth of water infiltrated (mm), and is the mean depth of all water infiltrated (caught) (mm).
2.4.5 Deep percolation ratio
During the application of the intended amount of water at the field, the water could be delivered in excess, mainly due to a technical problem, and in this case, it may cause a loss of water and runoff and could be stored as deep percolation. This could affect the performance of the scheme. It was calculated using Equation 21 as follows (Feyen and Zerihun, 1999; Markos et al., 2019; Abo et al., 2024):
where DPR is the deep percolation ratio (%), Ea is the application efficiency (%), and RR is the runoff ratio (%), if there is any.
However, when the farmers irrigated fields, they used a tied furrow and due to this, there was no runoff loss observed and measured in the fields. As such, the overall scheme efficiency (Equation 22) was calculated as the product of conveyance and application efficiency (Food and Agriculture Organization (FAO), 2002):
where Ep is the overall scheme efficiency (%), Ec is the conveyance efficiency (%), and Ea is the application efficiency (%)
2.5 Determination of the external performance indicators
To determine the performance of the scheme, external indicators were used as illustrated by the International Water Management Institute (Molden et al., 1998).
2.5.1 Agricultural output indicators
Agricultural output indicators such as output per irrigated area, output per unit command area, output per irrigation water diverted, and output per unit water consumed (Equations 23–26) were determined by collecting the yield in the cropping season, the market price the farmers could obtain as the revenue, and other input costs of seed, fertilizer, pesticide, and labor force. The irrigable cropped area, i.e., the command area, was calculated using the global positioning system (GPS). The amount of diverted water at intake of the schemes was also measured in the fields by a Parshall flume. The following equations were used to compute the four basic agricultural output indicators (Molden et al., 1998).
2.5.2 Water supply indicators
After calculating the crop water demand during the growth season, the water supply performance indicators such as relative irrigation and relative water supply were evaluated. Irrigation supply is the volume of irrigation water delivered from the water source, measured at the headworks of the scheme (Equation 29). Relative water supply is the sum of delivered irrigation water and effective rainfall. During the investigation period, the crop in the scheme was wheat, and accordingly, the crop water requirement of the crop, which was the actual evapotranspiration demand, was determined using the CROPWAT 8.0 computer program. The crop water requirement and irrigation demand were calculated for each month using Equations 27 and 28, respectively, for the crop currently available on the field.
After determining the crop water requirement, effective rainfall, irrigation water demand, and water supply, i.e., both the relative water supply and irrigation supply, were determined using Equations 30, 31 as shown below.
where RWS is the relative water supply (m3), IWS is the irrigation water supply (m3), IWD is the irrigation water demand (m3), and CWR is the crop water requirement (m3).
2.5.3 Water delivery capacity indicator
The water delivery capacity (WDC) was determined from the measurement taken from the off-taking canal using the canal’s cross-sectional area, flow velocity in the canal, and the freeboard of the constructed structure. The maximum (peak) monthly crop water demand was computed using CROPWAT 8.0 and calculated by Bos et al. (1994) as shown below in Equation 32.
2.5.4 Physical indicators
It is common that before the beginning of the design, followed by the construction of the scheme, the command area that will be cultivated in the scheme is studied and it is used as an input for the design. Unfortunately, this irrigable area could not be addressed due to the siltation and other failures of the structure. This failure could have its own impact on the irrigation water used and the future sustainability of the scheme. Hence, these physical performance indicators were evaluated based on the irrigation ratio and sustainability of the irrigated area, as discussed by Molden et al. (1998). Both the irrigation ratio (IR) and sustainability of the irrigated area (SIA) were used to evaluate the physical indicators.
2.5.4.1 Irrigation ratio
The IR indicates the degree of utilization of the available irrigable area at a particular time. The irrigation ratio (Equation 33) is the ratio of the currently irrigated area to the command area (Bos et al., 1994).
where irrigated crop area (ha) is the portion of the actual irrigated land in any given irrigation season and the command area (ha) is the scheme’s potential command area.
2.5.4.2 Sustainability of irrigated area
The irrigated area can contract or expand and this has its own impact on the performance of the designed and constructed scheme and could mean that it is unable to meet the intended objective. The sustainability of the scheme was evaluated by collecting and delineating the area under irrigation and its potential obtained from the wereda irrigation scheme. The sustainability of the irrigated area was computed using Equation 34 (Molden et al., 1998).
Where currently irrigable area is the area currently irrigated (ha) and initially irrigated area is the designed irrigable area (ha).
2.5.5 Economic and financial indicators
Even though the constructed scheme could be advantageous in granting the farmers the possibility to produce in a dry period and have sustainable production, it has to be evaluated economically and financially. To do this, the gross return on investment, the financial self-sufficiency, and profitability in terms of area-based profitability per unit area and per unit of water used were evaluated.
2.5.5.1 Gross return on investment
To evaluate the gross return on investment, an assessment was made of how cost overruns are financed and cost under-runs deployed. In the scheme, the main indicators for the financial evaluations were input costs such as seed, fertilizer, and herbicides, and costs for hiring security guards. The gross return on investment was evaluated in Equations 35 and 36 as shown below.
where SGVP is the standard gross value of production
2.5.5.2 Financial self-sufficiency
To evaluate the production and productivity of the beneficiaries, and the ability of the user to operate and maintain the scheme, the scheme’s financial self-sufficiency was evaluated. Since the scheme commenced recently, it currently does not require maintenance. However, there are failed intake structures, division boxes, and collapsing structures that need maintenance. Hence, the financial self-sufficiency (Equation 37) was evaluated by considering the revenue from the fields, the expected construction material cost required for maintenance, and the cost required for the labor force and masonry experts.
where revenue from irrigation is the revenue generated from fees and total operation and maintenance expenditure is the amount expended locally for the operation and maintenance plus outside subsidies from the government.
2.5.5.3 Profitability
Both the profitability of the area used and water applied per hectare of land (Equations 38, 39) were evaluated to determine the profitability of the scheme to enhance production and productivity.
3 Result and discussion
3.1 Water requirement of the crop
When this study was conducted, all crops in the scheme were wheat crops planted in a cluster base for the initiation of the import substitution of wheat. Accordingly, the crop and irrigation water requirements were determined. The crop water requirement reveals that the seasonal crop water requirement was 290.2 mm (Table 1). Of this total crop water requirement, 96.31% was supplied through irrigation which was 279.5 mm. During the field observation, to deliver the required quantity of water, the farmers used surface water delivered through the constructed canals and there was an intake constructed throughout the canal. These findings are in a relatively similar range as Deo et al. (2017). However, there were other scholars who obtained a water requirement of 350–600 mm (Tesfamichael et al., 2016; Desta et al., 2017; Amdneh and Gebul, 2023; Ranjan et al., 2023). These variations could be because of the agroecology and crop variety.
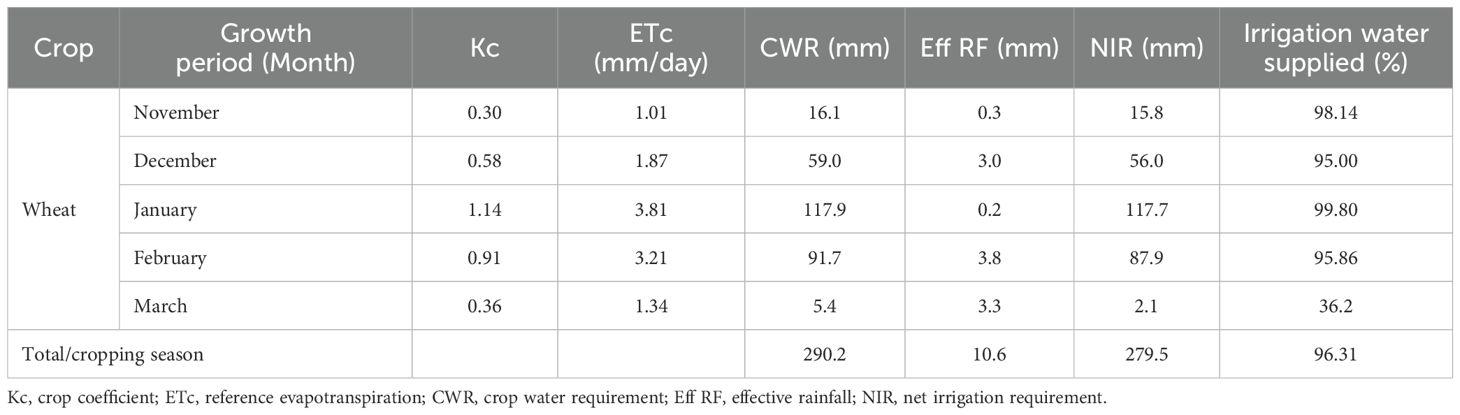
Table 1. Crop and irrigation water requirements.
3.2 Performance of the different internal indicators
3.2.1 Conveyance efficiency
The main canal conveyance efficiency reveals that at the head, middle, and tail reaches of the scheme, the efficiency was 87.73%, 72.86%, and 69.40%, respectively. The average conveyance efficiency of the scheme was 76.44% (Table 2). Since it was a newly constructed canal, the conveyance efficiency had to be higher than the current result. Additionally, the FAO (2001) suggested that the conveyance efficiency of a lined canal is 95% and, compared to this, the conveyance efficiency of the canal was low. During the field investigation, it was observed that the water that was diverted from the source through the headwork was overtopped from the canal and the water was lost before reaching the intake structure. This could be due to a design or technical problem during the construction of the canal.
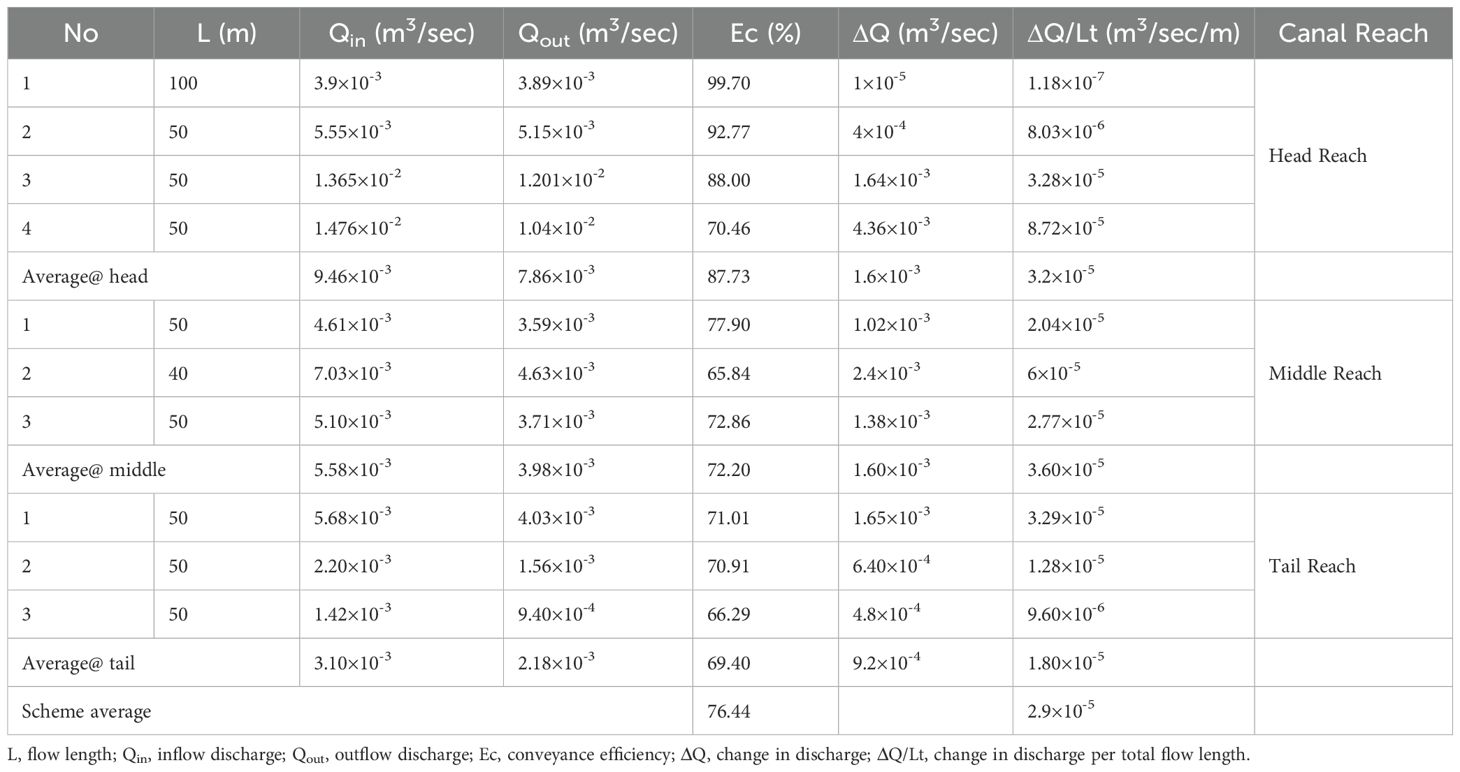
Table 2. Conveyance efficiency of the scheme at the head, middle, and tail reaches.
The average canal loss per meter was 3.2×10⁻⁵, 3.6×10⁻⁵, and 1.8×10⁻⁵ m3/sec/m at the head, middle, and tail reach of the canal, respectively (Table 2). The average canal loss was 2.9×10⁻⁵ m3/sec/m. There was an overtopping of the water and at some points, there were also seepage losses. This also signifies that there was poor stability of the materials. From this finding, it is clear that there was a conveyance efficiency variation within the scheme at the head, middle, and tail reaches. This was due to slope variation and there was an unlined canal at the tail reach, which had a relatively low flow conveyance.
3.2.2 Application efficiency
The study revealed that the average application efficiency of the Dabasso Lamaffa small-scale irrigation scheme was 30.5%, 27.09%, and 33.84% at the head, middle, and tail reaches of the selected farmers’ fields, respectively. The average application efficiency of the scheme was 30.47% (Table 3). The application efficiency in the middle of the scheme was relatively lower than the other two. This was due to the slope of the land in the middle and there was an overtopping and seepage loss due to the breakage around the intake of the canal. The application efficiency was poor and below the recommended application efficiency of furrow irrigation. According to soil conservation science, the attainable application efficiency ranges from 55% to 70% (Brouwer et al., 1989). Similarly, the Food and Agriculture Organization (FAO) (2002) reports the application efficiency of furrow irrigation to be in the range of 50%–70%.
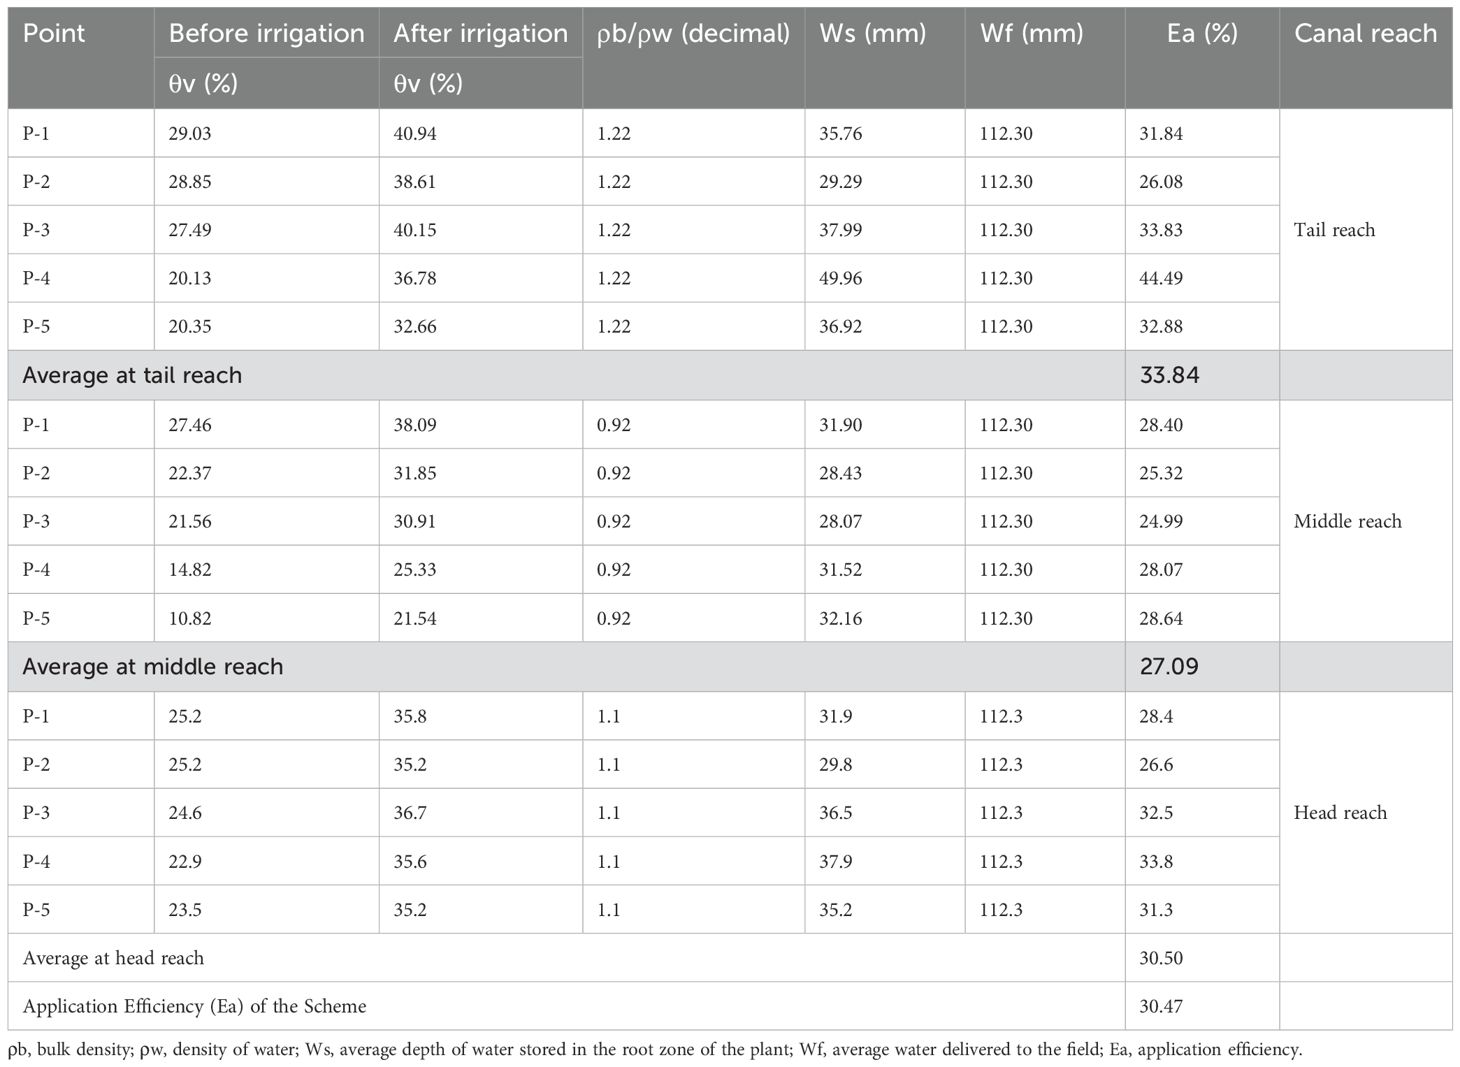
Table 3. Application efficiency of the water at the tail, middle, and head reaches of the scheme.
The property of the soil, farmers applying water properly to the crop, and technical failure of the canal around the intake could be the reasons for the low application efficiency. These problems could be resolved by protecting the canal with fencing and training the farmers to properly manage the water. In addition to this, since there was an overtopping of the water from the canal, it has to be maintained through the intervention from the wereda and zone irrigation scheme administrations.
3.2.3 Storage efficiency
The Dabasso Lamaffa irrigation scheme had an average storage efficiency of 84.4%, 72.29%, and 91.52% at the tail, middle, and head reaches, respectively. The average storage efficiency of the scheme was 82.74% (Table 4). The storage efficiency result shows that the water was properly applied to the crop as per the water demand. This was obtained due to, but not limited to, the principles the scheme administration was following for the watering program for the households in the scheme. This shows that there was no water deficit and soil moisture deficiency in the roots of the crop, which can happen due to the technical practice of the farmers.
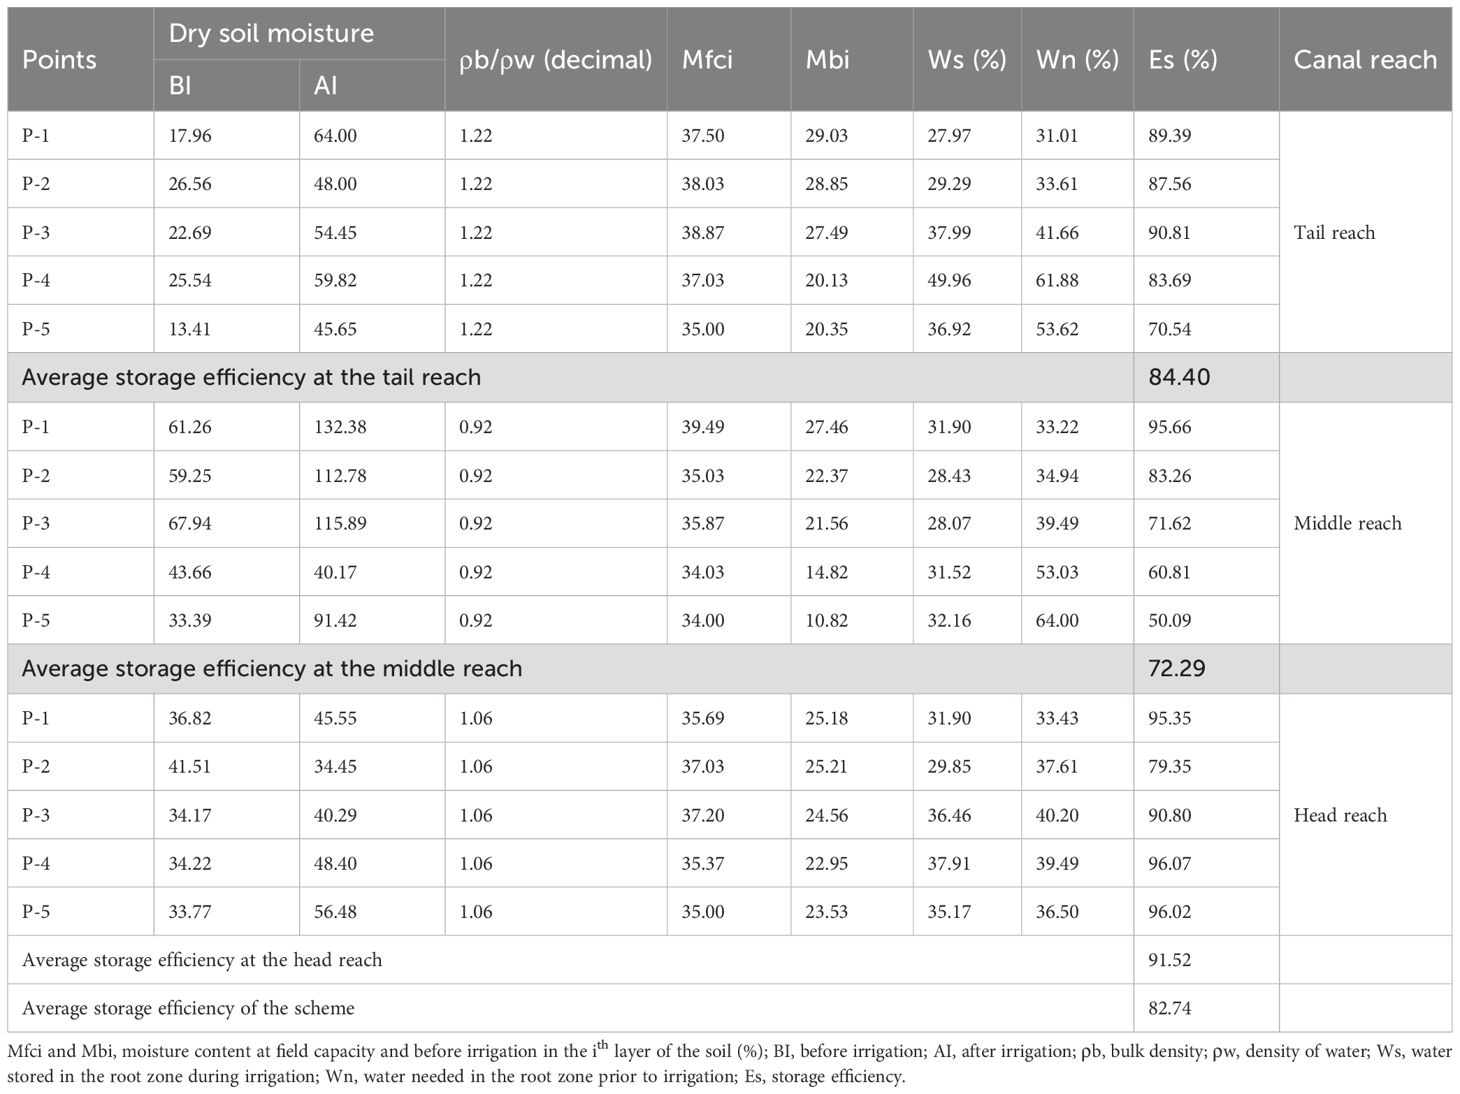
Table 4. Storage efficiency of the water at the tail, middle, and head reaches of the scheme.
The current finding was in agreement with Markos et al. (2019), who obtained a storage efficiency between 71% and 86% when evaluating the irrigation performance of the Sanko small-scale irrigation scheme and Tesfaye and Jemal (2020) when assessing the storage efficiency of the Wosha irrigation scheme, which ranged from 83% to 92.5%. The storage efficiency of the scheme reveals that it was performing well since the minimum recommended storage efficiency of furrow irrigation was 63% (Levine, 1982; Raghuwanshi and Wallender, 1998).
3.2.4 Deep percolation ratio
The farmers in the Dabasso Lamafa irrigation scheme were practicing the tied furrow irrigation system. Due to this, there was no water lost to runoff, and any water lost was stored in the form of deep percolation below the root zone of the crop. The results reveal that the average deep percolation ratio was 66.18%, 72.92%, and 69.49% at the head, middle, and tail reaches, respectively, and the average deep percolation ratio of the scheme was 69.53% (Table 5). This result shows that there was loss of water and water was lost due to deep percolation, evapotranspiration, and other technical application problems and also indicates over-irrigation. According to Brouwer et al. (1989), water loss through the deep percolation ratio can be more than 40%.
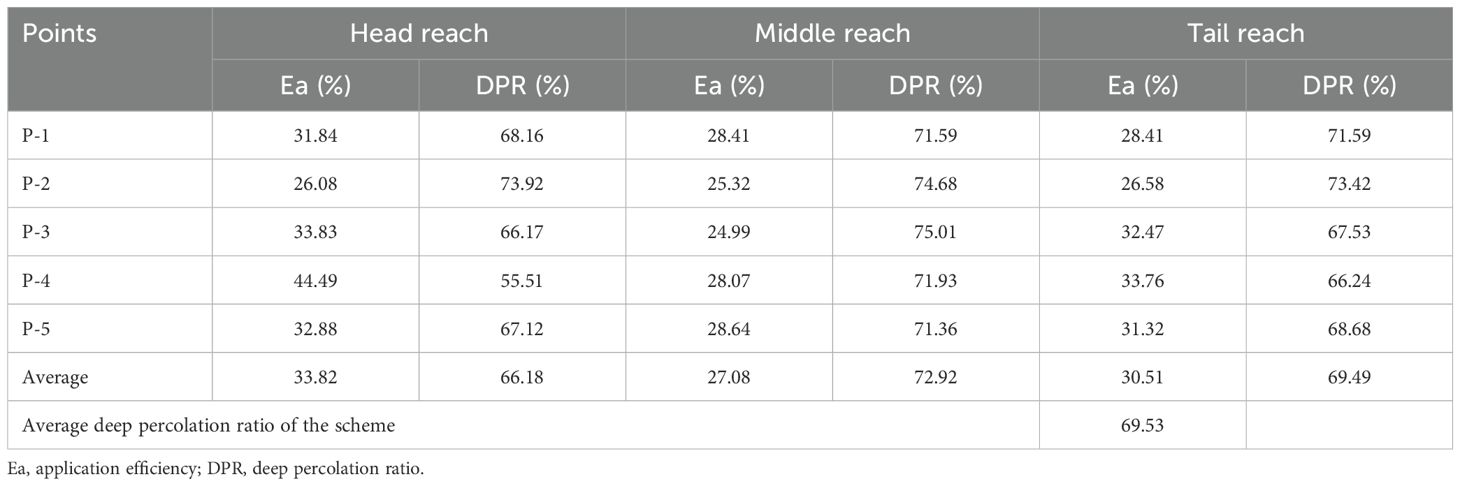
Table 5. Deep percolation ratio at the head, middle, and tail reaches of the scheme.
3.2.5 Distribution uniformity
The distribution uniformity of the scheme was 95.29% and it was 91.94%, 98.03%, and 95.90% at the tail, middle, and head of the scheme, respectively (Table 6). This distribution uniformity shows that the water was distributed uniformly throughout the scheme. This was because the land was well prepared and the furrows were made properly and were a relatively moderate length (15–20 m). The slope of the land (<3%) was also taken as one factor for the uniform distribution of the water in the scheme.
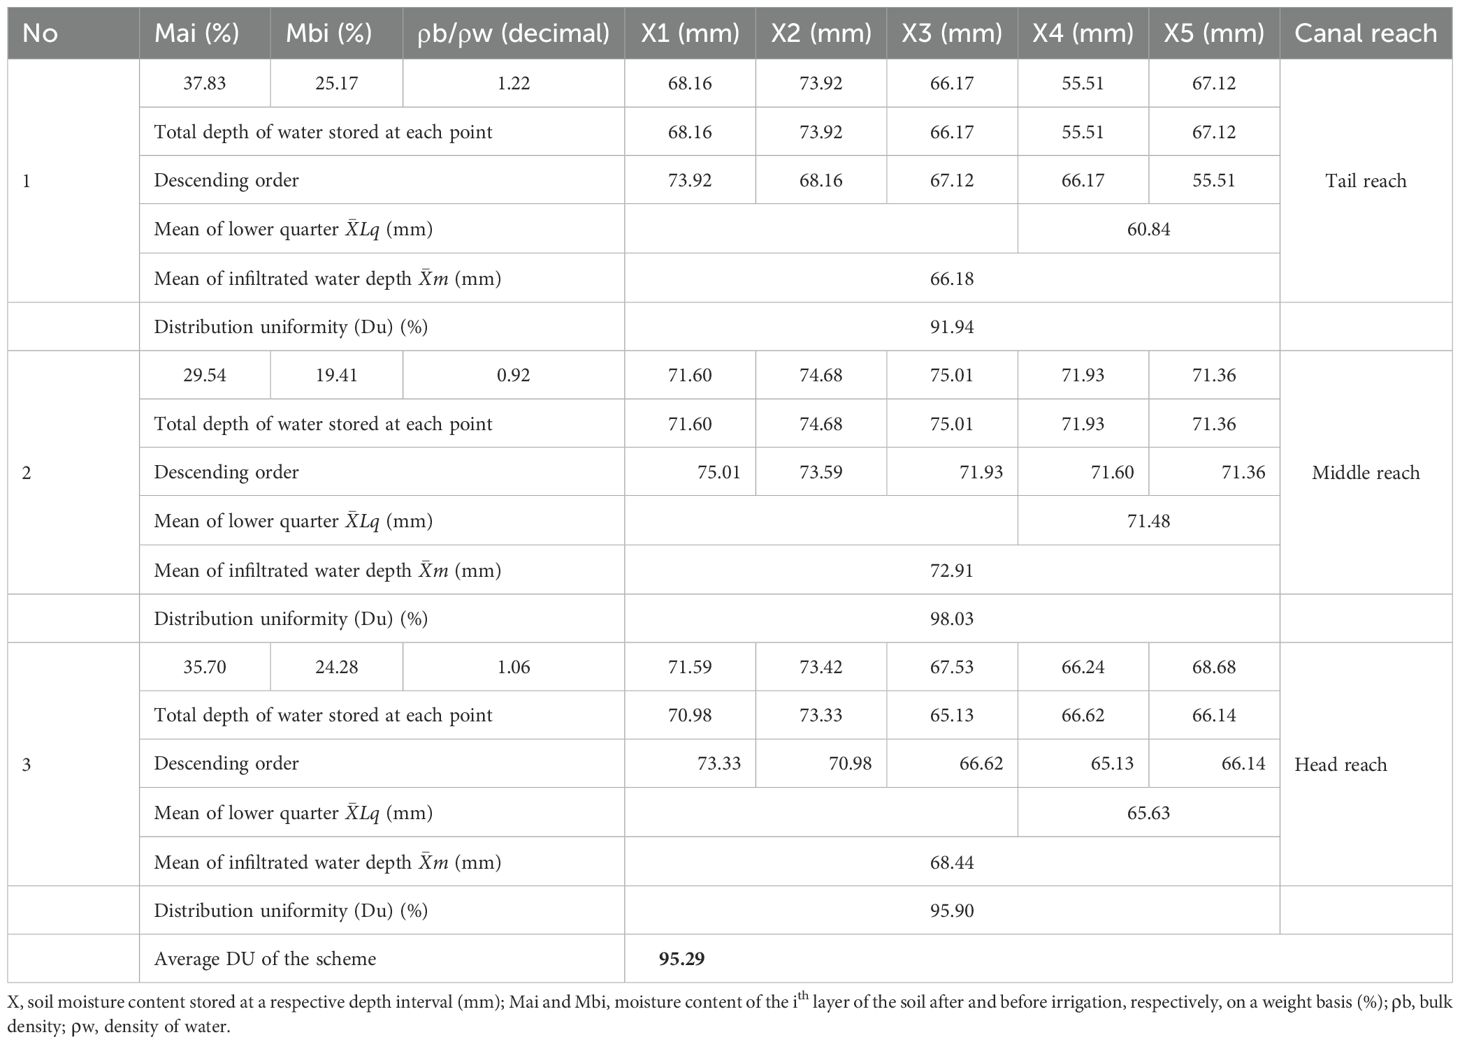
Table 6. Distribution uniformity at the head, middle, and tail reaches of the scheme.
A distribution uniformity of 65% is considered sufficient and if it is less than 30%, the distribution is poor (FAO, 1992; Eisenhauer, 1997). According to SJVDIP (1999), an effective distribution uniformity for furrow irrigation has to be between 80% and 90%. Similarly, Dessalew and Dar (2016) obtained a distribution uniformity of above 90% when evaluating the irrigation performance of the Bedene Alemetena irrigation scheme. There are also other scholars that obtained a distribution uniformity of a scheme above 90%, which has positive implications for an irrigation scheme’s sustainability (Tesfaye and Jemal, 2020; Hailu, 2008). Based on the above justification, it could be said that the farmers were distributing the water to the field uniformly, even though there was poor application efficiency.
3.2.6 Overall scheme efficiency
The poor application efficiency affected the overall scheme performance of the Dabasso Lamaffaa small-scale irrigation scheme. The result reveals that the overall efficiency of the scheme was 23.29% (Table 7). There was an expectation that this application efficiency, which was because of the farmers’ poor application of water in the fields, could be improved by training the farmers. Tesfaye and Jemal (2020) obtained an overall scheme performance efficiency below 30% when evaluating the Wosha and Dodicha irrigation schemes. Similarly, Abo et al. (2024) obtained an overall scheme efficiency below 30% when evaluating the Bilate irrigation scheme. Overall irrigation efficiency values between 50% and 60% are good, 40%–50% are reasonable, and 20%–30% are poor (Rai et al., 2017). Therefore, the overall scheme performance at Dabasso Lamafa in the cropping season of 2015 was categorized as poor.
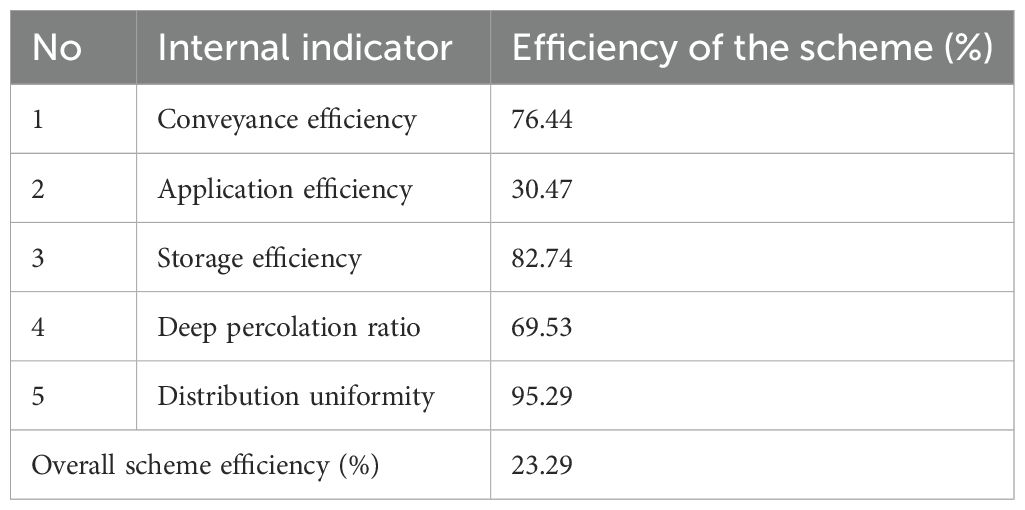
Table 7. Overall scheme efficiency.
3.3 Performance of the different external indicators
3.3.1 Agricultural output indicators
Water productivity is defined as the output per unit of water consumed and the output per unit of irrigation supply, whereas land productivity is defined as the output per unit of command area and irrigated area. The values for the four basic agricultural output indicators of the scheme, i.e., output per unit irrigated area, output per unit command area, output per unit irrigation diverted, and output per unit water consumed were 2620.83 US$/ha, 2501.71 US$/ha, 0.94 US$/m3, and 0.91 US$/m3, respectively (Table 8). The output per unit command area of a small-scale irrigation scheme was recommended to be between 1,223 and 9,436 US$/ha for different irrigation schemes (Degirmenci et al., 2003). Accordingly, the agricultural output of 2501.71 US$/ha was in the recommended range based on the study conducted by Degirmenci et al. (2003). This reveals that the command area was beneficial and was providing revenue for the farmers during the cropping season.
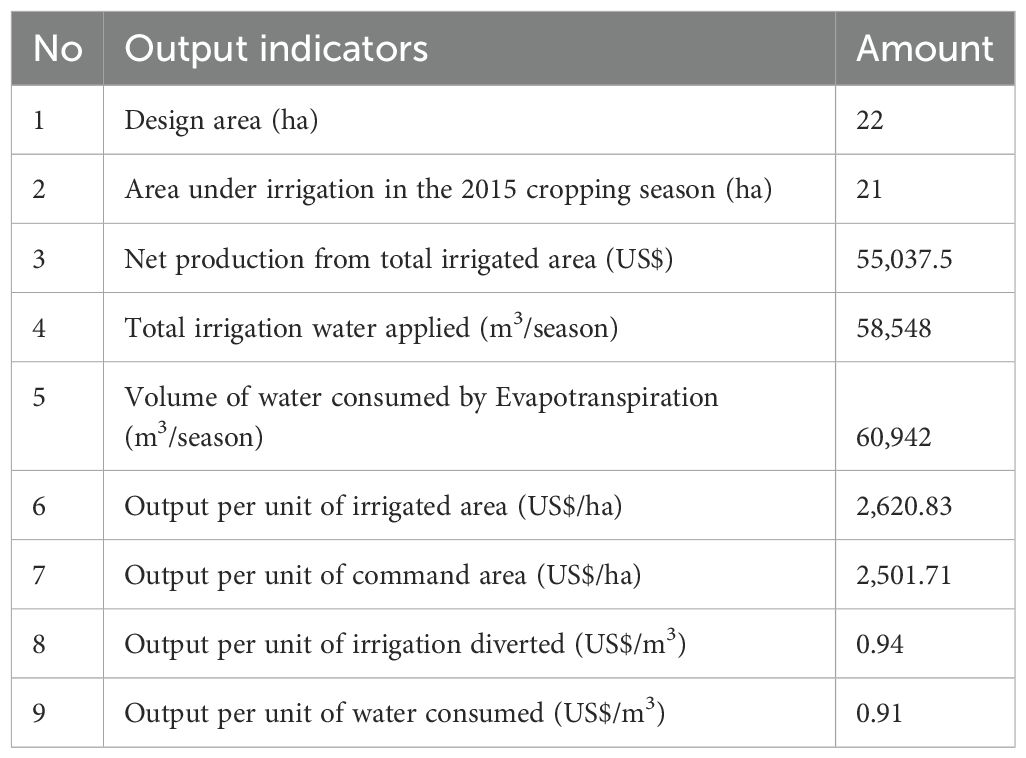
Table 8. The agricultural output of the Dabasso Lamaffaa scheme.
The output obtained per unit irrigated area from the scheme in the cropping season of 2015 was 2,620.83 US$/ha. It is one of the physical performance indicators that show the revenue gained by applying a meter cubed of water through irrigation. The revenue obtained from the irrigated area was relatively higher than that obtained from the command area. This shows that irrigation is more advantageous in the scheme. Similarly, Degirmenci et al. (2003), reported that the output per irrigated area among various irrigation schemes was in the range of 308–5,771 US$/ha. Accordingly, the output obtained per unit irrigated area from the Dabasso Lamaffa irrigation scheme was in the recommended range.
As shown in Table 8, the output per unit of irrigation diverted was 0.94 US$/m3. This shows that there was more benefit from the irrigated scheme. Similarly, Abo et al. (2024) obtained the same revenue value when evaluating the performance of the Bilate small-scale irrigation scheme. The value of output per unit of irrigation could be between 0.03 and 2.21 US$/m3 (Cakmak et al., 2004). Thus, the result of the output per irrigation delivered was in the recommended range of Cakmak et al. (2004) for the Dabasso Lamaffa irrigation scheme. The output per unit of water consumed was 0.91 US$/m3 for the Dabasso Lamaffa small-scale irrigation scheme. Molden et al. (1998) suggested that the output per unit of water consumed for irrigation schemes could be in the range of 0.03–0.91 US$/m3. Accordingly, the result of the output per water consumed was in the recommended range of Molden et al. (1998). This indicates that the water use efficiency of the scheme was good and farmers are managing effectively based on the given standards.
3.3.2 Water supply indicators
The water supply indicators, namely relative water supply and relative irrigation supply, were considered one of the optimal criteria for the measurement of the adequacy of the water supply for the crops. The values are evaluated as greater than one or less than one, showing oversupply and undersupply of water, respectively (Ayana and Awulachew, 2008). The RIS of the Dabasso Lamaffaa scheme was 2.13m3 (Table 9). Similarly, Wakena et al. (2023) obtained a relative irrigation supply of above 2.0 while evaluating the performance of the Degero and Gura Daso small-scale irrigation schemes, which were 2.28 and 2.06, respectively. This shows that there was an adequate supply of irrigation to meet the crop’s water demand and there was even an excess supply of water to the field. This could be due to poor knowledge of agronomic practice, irrigation scheduling problems, and unpredictable rainfall.
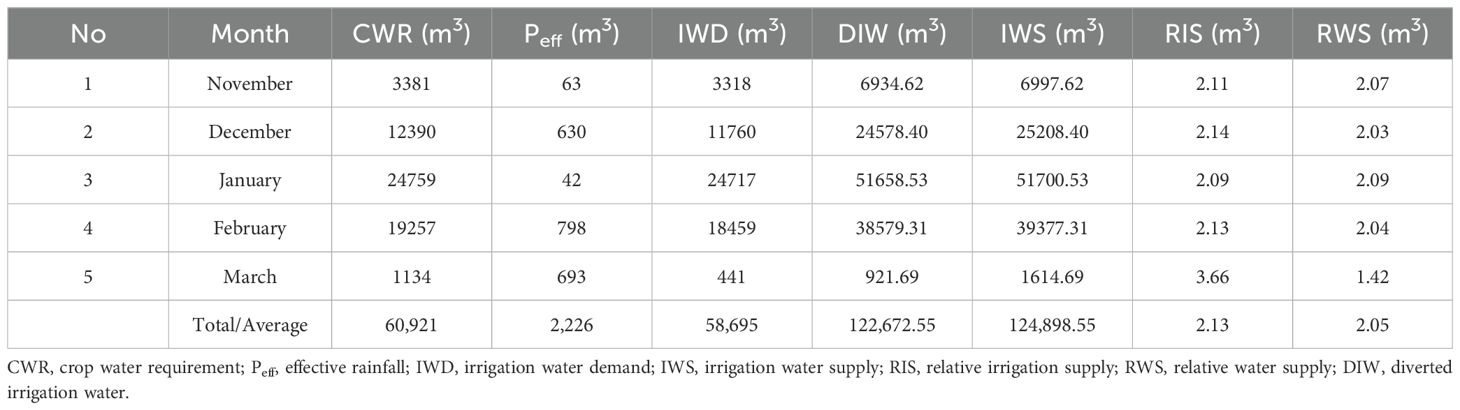
Table 9. Performance evaluation of the water supply indicators (WSIs) in the Dabasso Lamaffaa scheme. .
As shown in Table 9, the RWS of the scheme was 2.05, showing that there was excess delivery of water to the fields and the crops. Molden et al. (1998) reported that a relative water supply value of one is better than the higher or lower values for any irrigation scheme. Similarly, Ayana and Awulachew (2008) obtained a water supply ratio ranging from 1.46 to 2.05 for the Wonji irrigation scheme, indicating that the amount of water supplied at the scheme level exceeded the estimated crop water requirement. This value could be improved by applying agronomic practices, irrigation scheduling, and maintaining the intake of the off-taking canals at some points.
3.3.3 Water delivery capacity indicator
The WDC is an indicator that compares the amount of water delivered to the amount of water needed to be delivered, i.e., the total water supplied to the scheme divided by the gross irrigation water requirement. As shown in Table 10, the water delivery capacity of the canal in the Dabasso Lamaffaa irrigation scheme was 83%. This value is less than the expected capacity of the canal for delivering the intended quantity of water to the field. Overtopping of water from the canal and seepage loss at some failed parts of the canal shows that there was a low quantity of water in the fields during the irrigation application time. Due to this, the water released from the headwork takes a long time to flow and reach the fields.
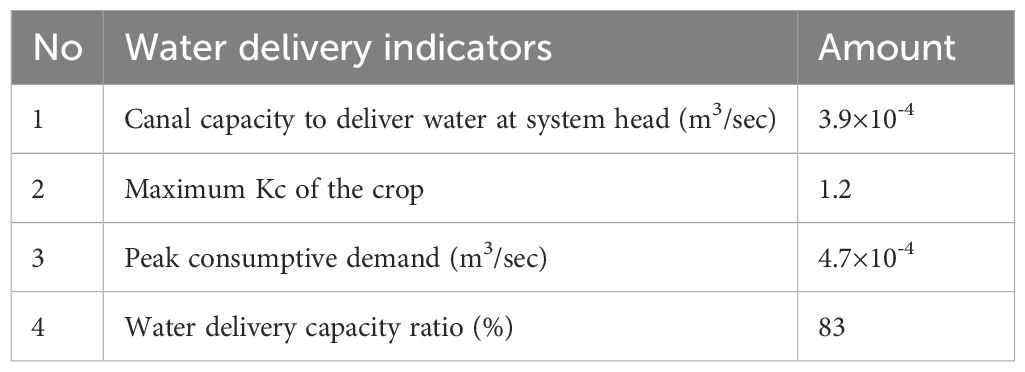
Table 10. Performance of the water delivery capacity indicators.
3.4 Physical indicators
Physical indicators are related to the changing or loss of irrigated land in the command area for different reasons. They can be determined by calculating the irrigation ratio and evaluating the sustainability of the scheme by comparing the initially and currently irrigated areas. In the current study, the irrigation ratio and the sustainability of the irrigated area were 0.95 and 1.1, respectively (Table 11). The irrigation ratio, which was 95% of the land, was very good. The remaining land could be the land that was left without cropping, as some of the farmers are not willing to sow wheat and prefer other horticultural crops. The 110% sustainability of irrigated land shows that there was a developing interest from the farmers in the commend area in the use of the irrigation scheme. Similarly, Kassa and Ayana (2019) and Abo et al. (2024), reported a sustainability of 1.08 and 1.05 for the Tahtay Tsalit and Furfuro irrigation schemes, respectively.

Table 11. Performance evaluation of the physical indicators. .
3.5 Economic and financial indicators
The economic and financial indicators of gross return on investment, financial self-sufficiency, area, and water-based profitability were used to evaluate the obtained yield from the irrigation scheme.
Gross return on investment
The gross return on investment indicator considers the production and the total cost of infrastructure for the irrigation scheme. The total construction cost for the headwork, canal, and ancillary structures was approximately 141,093.5 US$. The SGVP was determined using the currently irrigable area, crop type, and market price of the crop. The SGVP in the 2015 cropping season was 63,055.56 US$. Considering the above estimations, the gross return on investment was 45%, showing that the revenue was low (Table 12). Similarly, Behailu et al. (2004) reported a gross return between 18.25% and 42.1% when evaluating community-based irrigation schemes in the Tekeze basin in Tigray.
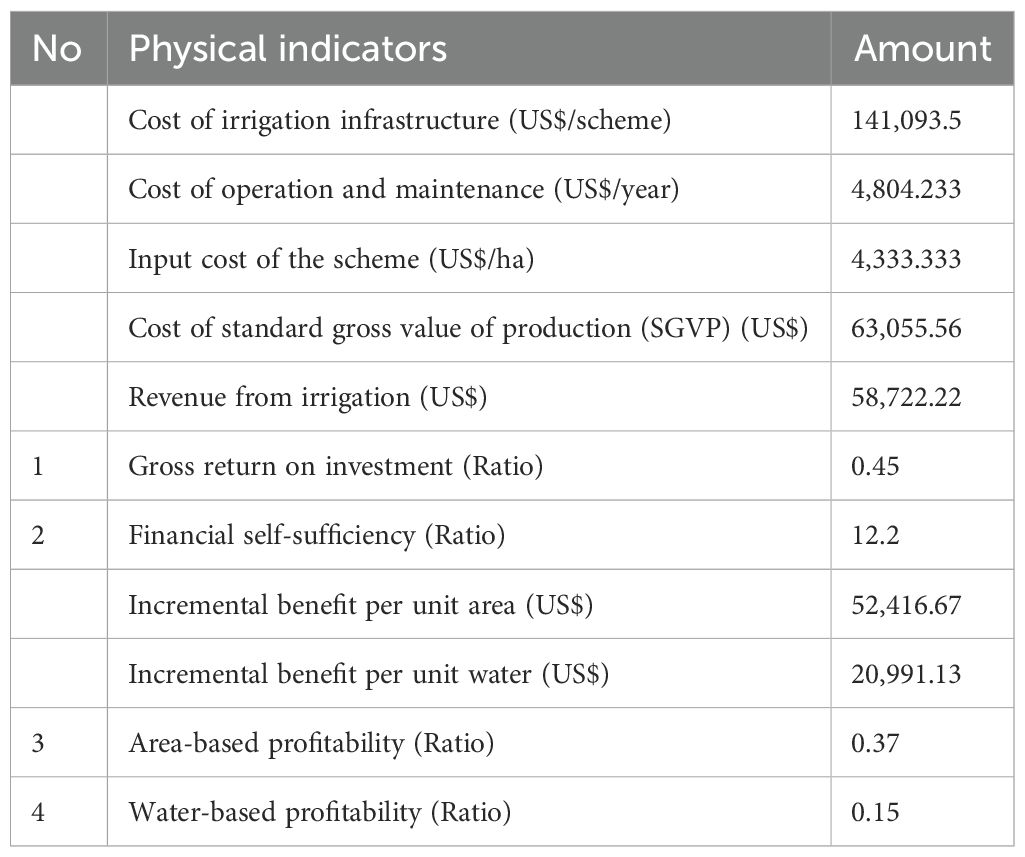
Table 12. Economic and financial indicators of the scheme. .
3.5.1 Financial self-sufficiency
The financial self-sufficiency result indicates how much of the revenue generated was used for operation and maintenance. It shows the ability of the users to manage the scheme without government support. Since the scheme commenced recently, there was no large maintenance observed except for the failure of the off-taking canal, breaking of division boxes, and collapsing structures. In the scheme, smaller maintenance tasks such as canal cleaning were done by the farmers themselves. However, to maintain the failed off-taking canal, division boxes, and collapsing structures, the operation and maintenance cost was estimated considering the material costs of fine aggregate, cement, and coarse aggregate. Furthermore, the labor force and masonry workers needed to maintain it for a 2-month period were also estimated to determine the cost. Since the total revenue obtained from the irrigation scheme in the cropping season was 58,722.22 US$ and the expected operation and maintenance was 4,804.233 US$, the financial self-sufficiency value was 12.2 (Table 12), showing that the farmers can maintain the scheme. However, water pricing has to be considered in the future.
3.5.2 Area and water-based profitability
Both the area and water-based profitability of the scheme were evaluated. The result reveals that the area-based profitability and water-based profitability ratios were 0.37 and 0.15, respectively (Table 12). This shows that the scheme’s profitability was low and this could be due to the production of one type of crop in the scheme, poor management of water in the fields, and a lack of awareness of producing wheat crops in the scheme. This could be improved through practicing irrigation scheduling for effective management of the field water, and cultivating commercial and high-value crops based on the farmers’ interest that need low input cost.
4 Conclusion
The performance of the Dabasso Lamaffa small-scale irrigation scheme was evaluated internally and externally. Five internal and nine external indicators were used to evaluate the scheme. The scheme has a relatively higher conveyance efficiency, showing that the water could flow and reach the fields. The lack of silt and sediment in the canal and the absence of water stagnation, grass, and debris were the reasons for the higher conveyance efficiency of the canal. The application efficiency of the scheme was poor and needs improvement in water management. The properties of the soil, farmers applying water properly to the crop, and technical failure of the canal around the intake could be the reasons for the low in-field water management. Even though the water was not applied effectively to the plants, the storage efficiency was good. This shows that there was no water deficit and soil moisture deficiency in the roots of the crops. Since the farmers were practicing tied furrow irrigation, there was no water lost to runoff and it was lost in the form of deep percolation and could contribute to the groundwater. Because the land was well prepared, the furrows were made properly and a relatively moderate length (15–20 m), and the slope of the land, the distribution uniformity of water was good. Since the application efficiency was poor, the overall performance of the scheme was poor.
The agricultural output indicators of the scheme, such as output per unit irrigated area, output per unit command area, output per unit irrigation diverted, and output per unit water consumed, indicated a recommended level of output production and, in this regard, the scheme was productive. There was also adequate water supply and irrigation supply in the scheme; however, the water delivery capacity requires improvement. The irrigation ratio and the sustainability of the irrigation scheme were also good, showing there will be a continuation of the scheme in the future. Even though the scheme was commenced recently, the economic and financial benefits obtained from the scheme were low. For better performance and the sustainability of the scheme, the following recommendations are made. During the field observation, there were deposited construction materials in the fields and the construction of the canal was not completed. Hence, it is better to construct a lined canal with the deposited materials to improve the conveyance efficiency of the canal and increase the command area. Creating awareness among the beneficiary farmers and water users’ associations about field irrigation water measurements, irrigation water management strategies, scheme operation, and maintenance practices through continuous training is essential.
Data availability statement
The raw data supporting the conclusions of this article will be made available by the authors, without undue reservation.
Author contributions
ET: Conceptualization, Data curation, Formal Analysis, Investigation, Methodology, Software, Supervision, Validation, Visualization, Writing – original draft, Writing – review & editing. AM: Conceptualization, Data curation, Formal Analysis, Investigation, Methodology, Writing – review & editing. MB: Conceptualization, Data curation, Formal Analysis, Investigation, Methodology, Software, Supervision, Validation, Writing – review & editing. HK: Conceptualization, Formal Analysis, Investigation, Methodology, Software, Supervision, Validation, Writing – review & editing.
Funding
The author(s) declare that no financial support was received for the research and/or publication of this article.
Acknowledgments
The authors are thankful to the Ethiopian Institute of Agricultural Research and small-scale irrigation scheme project coordinators Mr. Henok Tesfaye and Mr. Samuael Lindi for providing financial support for conducting the research. They also express appreciation for the staff members of the Irrigation and Water Harvesting Research program, namely Ms. Kalisa Aba Jihad, Mr. Aliyi Ababulgu, Mr. Abdurazak Abazinab, and Mr. Abazinab Abazeben. We are also thankful for the staff members of the soil and plant tissue analysis laboratory at the Jimma Agricultural Research Center.
Conflict of interest
The authors declared the following potential conflicts of interest with respect to the research, authorship, and/or publication of this article: The manuscript entitled “Performance Evaluation of Dabasso Lamaffaa Small Scale Irrigation Scheme at Buno Bedele Zone, South West Ethiopia,” was a research conducted by the responsible researchers namely ET, MB, AM, and HK. All the researchers collected and analyzed the necessary data and wrote the manuscript for publication. We hereby declare that this research is our original work and that all information in this document has been worked with responsibly and with ethical conduct. We also declare that, as required by these rules and conducts, all sources of materials that are not original to this work have been cited and duly acknowledged.
Generative AI statement
The author(s) declare that no Generative AI was used in the creation of this manuscript.
Publisher’s note
All claims expressed in this article are solely those of the authors and do not necessarily represent those of their affiliated organizations, or those of the publisher, the editors and the reviewers. Any product that may be evaluated in this article, or claim that may be made by its manufacturer, is not guaranteed or endorsed by the publisher.
References
Abo M. A., Assefa S., W/Michael A. (2024). Performance evaluation of the Bilate and Furfuro irrigation schemes in Silti Zone, Southern Ethiopia. J. Eng. Appl. Sci. 71, 88. doi: 10.1186/s44147-024-00419-5
Allen R., Pereira L., Raes D., Smith M. (1998). FAO Irrigation and Drainage Paper No. 56 Vol. 56 (Rome, Italy: Food and Agriculture Organization of the United Nations), 26–40.
Allen R. G., Pereira L. S., Smith M., Raes D., Wright J. L. (2016). FAO-56 dual crop coefficient method for estimating evaporation from soil and application extensions. J. irrigation drainage Eng. 131, 2–13. doi: 10.1061/(ASCE)0733-9437(2005)131:1(2)
Amdneh M. W., Gebul M. A. (2024). Determination of water requirement and crop coefficient of wheat crop in Central Ethiopia. Ethiopian Journal of Crop Science 12(1), 145–160.
Amede T. (2015). Technical and institutional attributes constraining the performance of small-scale irrigation in Ethiopia. Water Resour. Rural Dev. 6, 78–91. doi: 10.1016/j.wrr.2014.10.005
Awulachew S. B., Ayana M. (2011). Performance of irrigation: An assessment at different scales in Ethiopia. Exp. Agric. 47, 57–69. doi: 10.1017/S0014479710000955
Ayana M., Awulachew S. B. (2008). Comparison of irrigation performance based on management and cropping types. Impact of Irrigation on Poverty and Environment in Ethiopia, p.14. Draft Proceeding of the Symposium and Exhibition held at Ghion Hotel, Addis Ababa, Ethiopia 27th -29th November, 2007.
Behailu M., Tadesse N., Legesse A., Teklu D. (2004). Community based irrigation management in the Tekeze basin: Performance evaluation of small-scale irrigation schemes. Mekelle, Ethiopia: Mekelle University, International Livestock Research Institute (ILRI), Ethiopian Agricultural Research Organization (EARO).
Belay A. M., Assefa T. T., Belay S. A., Yimam A. Y. (2023). Evaluating the performance of small-scale irrigation schemes in sub humid Ethiopian highlands. Irrigation Drainage 72, 224–239. doi: 10.1002/ird.v72.1
Berhane G., Gebreyohannes T., Martens K., Walraevens K. (2016). Overview of micro-dam reservoirs (MDR) in Tigray (Northern Ethiopia): Challenges and benefits. J. Afr. Earth Sci. 123, 210–222. doi: 10.1016/j.jafrearsci.2016.07.022
Bos M. G., Murray-Rust D. H., Merrey D. J., Johnson H. G., Snellen W. B. (1994). Methodologies for assessing performance of irrigation and drainage management. Irrigation Drainage Syst. 7, 231–261. doi: 10.1007/BF00881553
Bowan P. A., Anzagira L. F., Issahaku Z., Bang-Era F. A. (2023). An evaluation of small-scale irrigation schemes infrastructure. J. Ghana Institution Eng. 23, 8–17. doi: 10.56049/jghie.v23i3.74
Brabben T., Angood C., Skutsch J., Smith L. (2004). Irrigation can sustain rural livelihoods: Evidence from Bangladesh and Nepal (Project Report). HR Wallingford. Imperial collage London. pp1–20.
Brouwer C., Prins K., Heibloem M. (1989). Irrigation water management: irrigation scheduling. Training manual, 4.
Cakmak B., Beyribey M., Yildirim Y. E., Kodal S. (2004). Benchmarking performance of irrigation schemes: a case study from Turkey. Irrigation Drainage 53, 155–163. doi: 10.1002/ird.118
Degirmenci H., Buyukcangaz H., Kuscu H. (2003). Assessment of irrigation schemes with comparative indicators in the Southeastern Anatolia Project. Turkish J. Agric. Forestry 27 (5), 293–303. doi: 10.3906/tar-0210-6
Deo K., Mishra S. R., Singh A. K., Mishra A. N., Singh A. (2017). Water requirement of wheat crop for optimum production using CROPWAT model. J. Med. Plants 5, 338–342.
Dessalew T., Dar B. (2016). Performance evaluation of bedene alemtena small scale irrigation scheme in Hallaba special Woreda, Southern Ethiopia. Open Access Library J. 3 (2), 1. doi: 10.4236/oalib.1102372
Desta F. Y., Abera K., Eshetu M., Koech R., Alemu M. M. (2017). Irrigation water planning for crops in the central highlands of Ethiopia, aided by FAO CROPWAT Model. Afr. J. Agric. Res. 12 (28), 2329–2335. doi: 10.5897/AJAR2017.12387
Eisenhauer D. E. (1997). Irrigation performance measures: efficiency and uniformity. J. Irrigation Drainage Eng. 123, 423–442. doi: 10.1061/(ASCE)0733-9437(1997)123:6(423)
Embaye T. A. G., Kahsay G. H., Abadi N., Kebede M. M., Dessie D. T. (2020). Evaluation of water harvesting structures on agricultural productivity: The case of Tigray Region, Ethiopia. Sustain. Water Resour. Manage. 6, 1–14. doi: 10.1007/s40899-020-00435-2
FAO (1992). CROPWAT: A Computer Program for Irrigation Planning and Management: Irrigation and Drainage Paper. No. 46. (Rome: FAO).
Food and Agriculture Organization (FAO) (1998). Irrigation Manual: Planning, Development, Monitoring and Evaluation of Irrigated Agriculture with Farmers Participation. Available online at: http://www.fao.org/4/ai596e/ai596e00.htm.
FAO (2001). Irrigation Water Management: Irrigation Methods. Eds. Brouwer C., Prins K., Kay M., Heibloem M. (Wageningen, Netherlands: Academia). Training manual no 5.
Food and Agriculture Organization (FAO) (2002). Irrigation Manual: Planning, Development, Monitoring and Evaluation of Irrigated Agriculture with Farmer Participation. Volume II, Module 7. Harare: Food and Agriculture Organization of the United Nations.
Feyen J., Zerihun D. (1999). Assessment of the performance of border and furrow irrigation systems and the relationship between performance indicators and system variables. Agric. Water Manage. 40, 353–362. doi: 10.1016/S0378-3774(99)00009-8
Gebregziabher G., Namara R. E., Holden S. (2009). Poverty reduction with irrigation investment: An empirical case study from Tigray, Ethiopia. Agric. Water Manage. 96, 1837–1843. doi: 10.1016/j.agwat.2009.08.004
Hacısüleyman V., Ozger M. (2024). Optimal cropping patterns using linear programming and evaluation based on food-energy-water nexus. Global J. Environ. Sci. Manage. (GJESM) 10 (1), 1–18. doi: 10.22034/gjesm.2024.01.01
Haile A. T., Alemayehu M., Rientjes T., Nakawuka P. (2020). Evaluating irrigation scheduling and application efficiency: baseline to revitalize Meki-Ziway irrigation scheme, Ethiopia. SN Appl. Sci. 2, 1710. doi: 10.1007/s42452-020-03226-8
Hailu M. (2008). Performance Evaluation of Small-Scale Irrigation Scheme: A Case Study of Selgie Irrigation Scheme, South Wollo (Haramaya University).
Hussain I., Hanjra M. A. (2004). Irrigation and poverty alleviation: review of the empirical evidence. Irrigation drainage 53, 1–15. doi: 10.1002/ird.v53:1
Jibril G., Saidu M., Yabagi A. (2017). Performance evaluation of Badeggi irrigation scheme, Niger State Nigeria, using efficiency techniques. Scholarly J. Sci. Res. Essay 6 (2), 42–47.
Kassa E. T., Ayana M. (2019). Hydraulic performance assessment of Tahtay Tsalit small scale irrigation scheme, Tigray, Ethiopia. Int. J. Water Resour. Environ. Eng. 9 (11), 254–263. doi: 10.5897/IJWREE2019.0876
Kilic M., Ozcakal E. (2024). Optimization of irrigation programming for different water allocation strategies at network level: method and application. (Water Resources Management), pp.1–pp15.
Kumar R., Manzoor S., Vishwakarma D. K., et al. (2022). Assessment of climate change impact on snowmelt runoff in Himalayan region. Sustainability 14, 1150. doi: 10.3390/su14031150
Levine G. (1982). Relative water supply: An explanatory variable for irrigation systems. Technical Report No. 6. (Cornell University).
Luo W., Chen M., Kang Y., Li W., Li D., Cui Y., et al. (2022). Analysis of crop water requirements and irrigation demands for rice: Implications for increasing effective rainfall. Agric. Water Manage. 260, 107285. doi: 10.1016/j.agwat.2021.107285
Makombe G., Kelemework D., Aredo D. (2007). A comparative analysis of rainfed and irrigated agricultural production in Ethiopia. Irrigation Drainage Syst. 21, 35–44. doi: 10.1007/s10795-007-9018-2
Markos H., Shemelies A., Sirak T. (2019). Performance evaluation of sanko small scale irrigation scheme at basketo special woreda in SNNPR, Ethiopia. Irrigat. Drainage Sys. Eng. 8 (233), 2. doi: 10.4172/2168-9768.1000233
Michael A. M. (2008). Irrigation theory and Practice. 2nd ed. (India: Vikas Publishing house Pvt Ltd).
Moges M. F. (2022). Indicators for evaluating the performance of small-scale irrigation schemes. J. Agric. Sci. Bot. 6 (8), 136. doi: 10.35841/2591-7897.22.6.136
Molden D. J., Sakthivadivel R., Perry C. J., De Fraiture C. (1998). Indicators for comparing performance of irrigated agricultural systems (Vol. 20) (IWMI).
MoWR (2001). Irrigation development strategy (Component of the water sector development program). Draft report. (Ethiopia: Addis Ababa).
Raghuwanshi N. S., Wallender W. W. (1998). Optimal furrow irrigation scheduling under heterogeneous conditions. Agric. Syst. 58, 39–55. doi: 10.1016/S0308-521X(98)00030-4
Rai R. K., Singh V. P., Upadhyay A. (2017). Planning and evaluation of irrigation projects: methods and implementation (Academic press).
Rajput J., Choudhary R., Kothari M. (2025). Optimization of cropping patterns in the Bhimsagar canal irrigation scheme using linear programming approach. Water Pract. Technol. 20, 15–34. doi: 10.2166/wpt.2025.001
Rajput J., Kothari M., Bhakar S. R., Dimple X., Kushwaha N. L., Singh P. K., et al. (2023). Evaluation of water delivery performance of right main canal of Bhimsagar medium irrigation scheme, Rajasthan. ISH J. Hydraulic Eng. 29, 378–388. doi: 10.1080/09715010.2022.2066483
Rajput J., Singh M., Lal K., Khanna M., Sarangi A., Mukherjee J., et al. (2024). Development of single and dual crop coefficients for drip-irrigated broccoli using weighing type field lysimeters in semi-arid environment. Environment Dev. Sustainability, 1–27. doi: 10.1007/s10668-024-05416-5
Ranjan A., Denis D. M., Sherring A., Kumar M., Singh V., Masih S. (2023). Water requirements of wheat crops in a small watershed by using CROPWAT. Int. J. Environ. Clim. Change 13, 126–133. doi: 10.9734/ijecc/2023/v13i21662
Serbessa A. (2018). Performance Evaluation of Irrigation System (Welenchity Surface Irrigation Scheme) (Addis Ababa University).
Singh A., Panda S. N., Saxena C. K., Verma C. L., Uzokwe V. N., Krause P., et al. (2016). Optimization modeling for conjunctive use planning of surface water and groundwater for irrigation. J. Irrigation Drainage Eng. 142, 04015060. doi: 10.1061/(ASCE)IR.1943-4774.0000977
SJVDIP (1999). Land retirement technical committee final report: The San Joaquin Valley Drainage Implementation Program and the University of California Salinity/Drainage Program. 120 p.
Tesfamichael F., Tripathi R. P., Tesfai M. (2016). Irrigation and nitrogen requirements of wheat under shallow water table conditions of Asmara, Eritrea. J. Geosci. Environ. Prot. 4, 80–87. doi: 10.4236/gep.2016.44011
Tesfaye A., Bogale A., Namara R. E., Bacha D. (2008). The impact of small-scale irrigation on household food security: The case of Filtino and Godino irrigation schemes in Ethiopia. Irrigation Drainage Syst. 22, 145–158. doi: 10.1007/s10795-008-9047-5
Tesfaye H., Jemal K. (2020). Technical performance evaluation of small-scale irrigation scheme at Wondo Genet, Ethiopia. Am. J. Science Eng. Technol. 12, 128–134. doi: 10.11648/j.ajset.20200504.12
Tulu T. (2003). Small-scale irrigation development in the wetlands of South-West Ethiopia. Integrated Water land Manage. Res. capacity building priorities Ethiopia 196.
Verma S., Verma M. K., Prasad A. D., Mehta D., Azamathulla H. M., Muttil N., et al. (2023). Simulating the hydrological processes under multiple land use/land cover and climate change scenarios in the mahanadi reservoir complex, Chhattisgarh, India. Water 15, 3068. doi: 10.3390/w15173068
Wakena Y., Adeba D., Mosisa G., Abebe K. (2023). Performance evaluation of small-scale irrigation system in case of degero and gura daso, Nejo district, West Wallaga, Oromia, Ethiopia. Front. (Boulder) 3, 24–35. doi: 10.11648/j.frontiers.20230303.11
Worldometer (2023). Elaboration of data by United Nations, Department of Economic and Social Affairs, Population Division. (World Population Prospects: The 2022 Revision. (Medium-fertility variant). Available online at: www.Worldometers.info (Accessed October 22, 2024).
Worqlul A. W., Dile Y. T., Schmitter P., Jeong J., Meki M. N., Gerik T. J., et al. (2019). Water resource assessment, gaps, and constraints of vegetable production in Robit and Dangishta watersheds, Upper Blue Nile Basin, Ethiopia. Agric. Water Manage. 226, 105767. doi: 10.1016/j.agwat.2019.105767
Zerssa G., Feyssa D., Kim D. G., Eichler-Lobermann B. (2021). Challenges of smallholder farming in Ethiopia and opportunities by adopting climate-smart agriculture. Agriculture 11, 192. doi: 10.3390/agriculture11030192
Keywords: efficiency, external indicators, irrigation scheme, internal indicators, overall scheme efficiency, profitability
Citation: Ashine ET, Mengesha AA, Bedane MT and Kebede HT (2025) Performance evaluation of Dabasso Lamaffaa Small Scale Irrigation Scheme at Buno Bedele Zone, South West Ethiopia. Front. Agron. 7:1529338. doi: 10.3389/fagro.2025.1529338
Received: 16 November 2024; Accepted: 26 March 2025;
Published: 01 May 2025.
Edited by:
Fucang Zhang, Northwest A&F University, ChinaReviewed by:
Lalita Rana, Dr. Rajendra Prasad Central Agricultural University, IndiaJintao Wang, Chinese Academy of Sciences (CAS), China
Copyright © 2025 Ashine, Mengesha, Bedane and Kebede. This is an open-access article distributed under the terms of the Creative Commons Attribution License (CC BY). The use, distribution or reproduction in other forums is permitted, provided the original author(s) and the copyright owner(s) are credited and that the original publication in this journal is cited, in accordance with accepted academic practice. No use, distribution or reproduction is permitted which does not comply with these terms.
*Correspondence: Etefa Tilahun Ashine, ZXRlZmF0aWxhaHVuQGdtYWlsLmNvbQ==
†ORCID: Etefa Tilahun Ashine, orcid.org/0000-0002-7028-9255
Addisu Assefa Mengesha, orcid.org/0000-0002-1499-0127
Minda Tadesse Bedane, orcid.org/0000-0002-7964-5375
Hewan Tadesse Kebede, orcid.org/0009-0004-6628-5800