 Cherinet Miju Wachu
 Araba Jemal Ibrahim
- Department of Soil Resource and Watershed Management, Oda Bultum University, Chiro, Ethiopia
Understanding the impact of land use on soil organic carbon stocks (SOCS) and soil properties is crucial for effective soil management and mitigating climate change. This study aimed to evaluate the effects of land use and slope on SOCS and soil properties in Southern Ethiopia. Soil samples were collected from the upper, middle, and lower slopes, with a total of 54 composite samples representing different land uses. The result revealed that total nitrogen, potassium, and organic carbon in land use and slope position were significantly affected. The highest soil organic carbon stocks, total nitrogen, and organic carbon values were observed in the enset-based land-use system, which also recorded. In lower slope showed the lowest levels of organic carbon (3.27%), total nitrogen (0.28%), available phosphorus (3.58 ppm), and SOCS (73.38 mg ha−1). The results indicated that different land-use systems influence the soil’s physicochemical properties and the variation of slope varies in forestry and enset land use system results of the soil properties studied. Based on these studies forestry and enset land system tremendous potential raise soil fertility capacity and diminish loss of soil nutrient and more conservation minded. Therefore, we concluded that using different plant residual materials and mixed farming methods, such as agroforestry, promotes the sustainable maintenance of soil physicochemical properties for both the present and the future. This underscores the need for integrated land management to boost carbon storage, enhance soil fertility, and combat climate change.
1 Introduction
Soil is related to land use, and the interaction between physical and chemical properties makes it a functionally complete resource. This resource is utilized for various purposes, such as agricultural, forestry, and urban development. Conversely, different land-use practices can affect soil health, diminishing productivity, the capacity of erosion resistance, and overall sustainability. Increasing human activity, particularly in land use, is a major cause of variations in soil properties and soil organic carbon stocks (SOCS) on a global scale (Agidew and Singh, 2018). In addition, anthropogenic activities and land-use changes may lead to reduced soil structure stability, loss of organic matter (OM), and a decline in nutrient stocks (Mohammad et al., 2005). Currently, approximately 33% of global soils are moderately to highly degraded. Of these degraded soils, 40% are located in Africa, primarily in regions affected by poverty and food insecurity (Karlen and Rice, 2018; Shaikh, 2018). According to global assessments, the proportion of severely degraded land grew from 15% in 1991 to 25% in 2011. In 2008, degradation affected over 20% of intensively used agricultural land, 30% of virgin forests, and 25% of grazing land (UNCCD, 2013; Kimura, 2018). Various land-use practices and their associated management techniques have altered soil physical and chemical properties.
The type of land-use system is a significant factor influencing soil organic carbon (SOC) levels, as it affects the quantity and quality of litter inputs, the decomposition rate, and the stabilization processes of OM in soil (Córdova et al., 2018). SOC losses are influenced by variations in land-use practices and management techniques (Alemayehu and Sheleme, 2013). Both biotic and abiotic factors determine the spatial and temporal variability of SOC storage (Weissert et al., 2016). Globally, hotspots like wetlands and peatlands—mainly located in arctic and tropical regions—contain the largest SOC reserves (Gougoulias et al., 2014; Köchy et al., 2015). Additional high SOC concentrations are found in deep soil horizons (>1 m). Global estimates suggest that SOCS in the topsoil layer are approximately 1,500 PgC (FAO, 2015).
Land-use changes significantly impact net primary production, species composition, stand age, root distribution, and litter quantity. Low SOC levels and other poor soil properties are key drivers of soil erosion. Substantial SOC losses from surface and subsurface soil layers, caused by accelerated soil erosion, can disrupt the global carbon cycle, as even slight changes in SOC pools can significantly affect carbon dynamics (Zhang et al., 2015). These changes in SOC storage can either exacerbate or mitigate climate change (Girma et al., 2020).
Variations in land use—particularly in natural versus managed systems, such as agroforestry, cultivated lands, grasslands, and grazing lands—alter soil properties and carbon balance (Berry, 2011). These changes have both positive and negative impacts on agricultural productivity and carbon stocks. Research has shown that natural ecosystems and managed agroecosystems exhibit significant differences in soil property status (Mulugeta et al., 2005; Nega and Heluf, 2013). Factors such as land-use type, vegetation cover, cultivation intensity, and fertilizer sources are key drivers of soil physical and chemical property variations (Abera and Wolde-Meskel, 2013).
Recent studies in Southern Ethiopia highlight that variations in soil properties, SOCS, and soil fertility are closely related to land-use management practices (Assefa et al., 2020). For instance, higher concentrations of SOC, total nitrogen (TN), cation exchange capacity (CEC), available phosphorus (Av. P), and exchangeable potassium (K) have been recorded in enset-based farming systems in Southern Ethiopia (Shrestha and Kafle, 2020; Wolka et al., 2021).
This study aims to evaluate the effects of land use and topography on soil properties. The landscape of the study area manifests complex land use and soil conservation practices; in this case, it may be the factor that affects soil properties and reduces productivity of soil. Understanding these influences of land use and slope is essential for sustainable land management and climate change mitigation.
2 Materials and methods
2.1 Description of the study area
This study was conducted in the Gedeo zone in the Kochore district of the southern part of Ethiopia (Figure 1). The study area is located 410 km away from Addis Ababa toward the south and approximately 120 km south of Hawassa, the capital city of the Sidamo region. The absolute location of the study area lies in 6˚ 8′ 0″–5˚ 55′ 5″ N latitude and 38˚ 4′ 0″–38˚ 20′ 0″ E longitude, and the area spans an altitude range of 1,500 to 2,200 m above sea level. The study area categorizes wone-dege based on the local climate. The study area with a slope ranging from gentle and medium. The area experiences a bimodal rainfall pattern, with the major rain season (kiremt or mehar) beginning in July up to November and the short rainy season from February to April (“Belg”) with the area characterized by a humid climate with an average yearly rainfall of 1,100 to 1,800 mm (Haile et al., 2024). The average monthly temperature of the study site ranges from 17°C to 21°C (Haile et al., 2024).
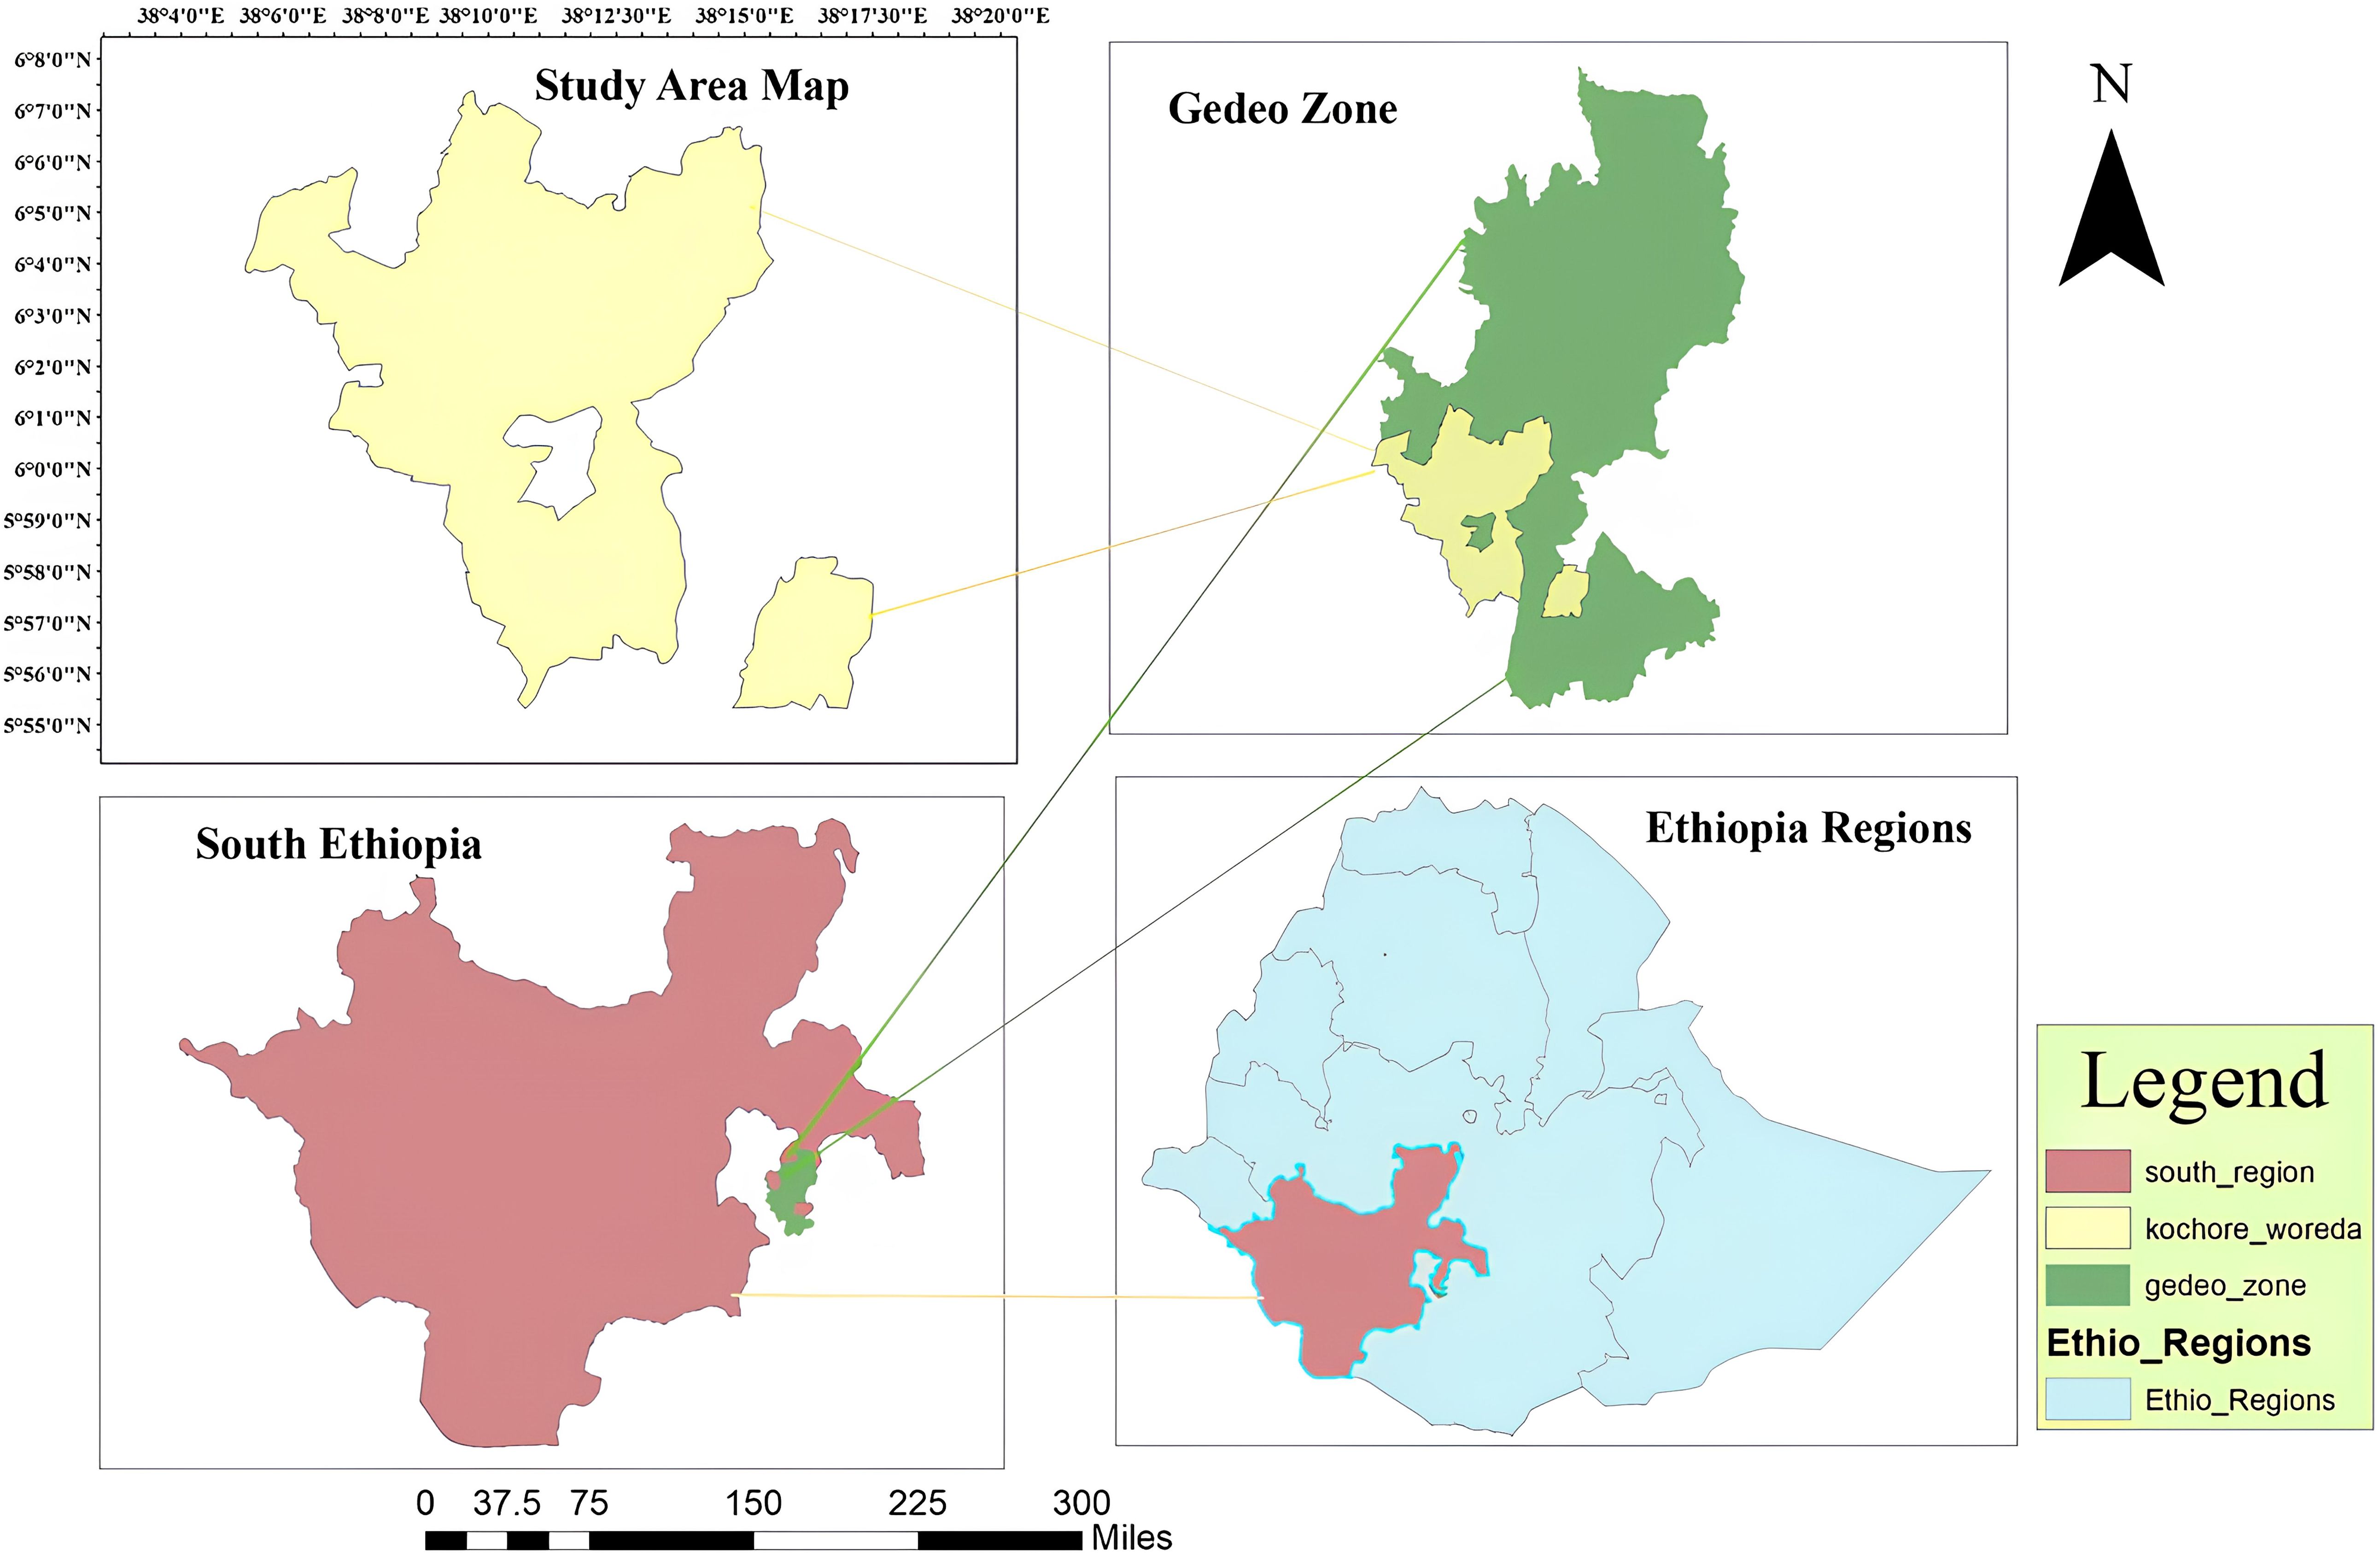
Figure 1. Map of study area (ArcGIS).
The major soil types of the study area are classified. The soil types dominant in the area include Eutric Nitosol (58%), Eutric Fluvisols (30%), and Dystric Nitosol (10%) (FAO/IAEA, 2018). The total population in the study area is 188,323, of whom 93,050 were male and 95,273 were female (StatsEthiopia.gov.et/wp-content/uploads/2023/08/Population-of-Zones-and-WeredasProjected-as-of-July-2023.pdf). Forestry, cultivated, and enset are the predominant land use in the study area (Wolka et al., 2021). A variety of tree species—Croton macrostachyus, Wanza (Cordia africana), Ficus sycomours, birbira (Millettia ferruginea), and Erythrina abyssinica—are found in the forest. The major crops grown are maize (Zea mays), coffee (Coffee arabica), enset, wheat, cabbage (Brassica oleracca), teff, and tubers (root crop), all grown in cultivated land. People depend on agricultural production and processing for the domestic market, especially when it comes to coffee and enset. Eighty-five percent (21,890 ha) of the land is utilized for growing both annual and perennial crops.
2.2 Soil sampling and preparation
The land-use types were chosen in an area adjacent to the study area to minimize variations of error. According to FAO (2006), there are three slope classifications in the study site: lower (5%–10%), middle (10%–15%), and upper slope class (>15%), and three land-use types (enset, forest, and cultivated land) were selected. Enset crops dominate the land cover because farmers plant these crops to sustain food security. The government encourages the planting of enset crops. Each farmer is required to plant enset crop on their land to ensure food sustainability, as mandated by the regional and zonal governments in south Ethiopia. Hence, total composite samples are 54 disturbed soil sample collected from three slopes. However, the other undisturbed 54 soil samples were taken to determine bulk density. The soil samples were meticulously separated from undesired material such as plant and animal remains, gravel, and soil. In addition, soil samples taken from four corners and one center of square plots were used to collect both disturbed and undisturbed soil, at depths of 0–20 cm, and while a sample of disturbed soil was collected using an auger to analyze the physicochemical properties of the soil, a sample of undisturbed soil were gathered using a core sampler for determine soil bulk density (Equation 1).
2.3 Soil laboratory analysis
Soil samples were air-dried at room temperature, then sieved through a 2-mm sieve and prepared for the determination of soil physical and chemical properties. Soil samples were also sieved through a 0.5-mm sieve for the determination of SOC. The analysis was conducted using the oxidation method to determine the organic carbon (OC) value (Blake, 1965). The exchangeable basic cations (K+, Ca2+, Mg2+, and Na+), have been extracted with 1 M ammonium acetate at pH 7.0. The CEC of the soil was determined from ammonium acetate saturate sample. The excess ammonium acetate is removed by washing with ethanol. Finally, the exchangeable K+ and Na+ determined with flame photometer Mg2+ and Ca2+ have been determined by atomic absorption spectra. The hydrometer method was used for the determination of soil particle size distribution (Bouyoucos, 1962). The soil pH was measured using a glass combination pH meter in the supernatant solution of 1:2.5 soil-to-water solution ratio (Van Reeuwijk, 1992). TN was conducted using Kjeldah (Blake, 1965), and available phosphorus (P) (Olsen et al., 1954), potassium (K) (Van Reeuwijk, 1992), and bulk density (B d) (Blake, 1965) were analyzed.
2.4 Calculation of soil organic carbon stock
Soil organic carbon content obtained from laboratory analysis was used to calculate carbon stock per unit area of land. Soil organic carbon stock was determined for each soil depth under different land use types according to Zhang et al., 2008 (Equation 2)
where
SOCS = soil organic carbon stock of the layer (t/ha),
Di = the depth of the soil sample thickness of the sampled soil layer (cm),
BD = soil bulk density of the soil layer (g cm−3),
% SOCi = soil organic carbon content in the soil layer (%),
C Fi =coarse fragment content of the soil layer> 2 mm (%), and
100 is the conversion factor from g/cm2 to t/ha.
A coarse fraction was determined during sample preparation after the repeated crushing of clods by hand, mechanical grinding, drying, and sieving until the sample was passed through a 2-mm sieve. However, most of the fraction of fragments were below 2 mm, which are fine particles and excluded from the calculation.
2.5 Statistical analysis
Statistical analysis of the soil data was performed on replicated sample using General Linear Model( GLM) procedures to determine significant differences among parameters related to slope and land use. Mean separation was done by least significance difference (LSD) for those attributes that are significantly different. All statistical analyses were conducted using statistical software (SAS, 2004) version 9.4 following the two-way ANOVA procedure.
3 Results and discussion
3.1 Effects of land use and slope position on soil physical properties
3.1.1 Soil particle size
Clay particle size varied significantly (p < 0.001) and was affected by land use (Table 1). Relatively, the highest clay content, 55.2%, was found in cultivated land and the lowest, 50%, was observed in forestry land. Similarly, clay particle size was significantly influenced by slope position. The average sand fraction was the lowest (21.39%) in the upper slope position and the highest (25.33%) in the lower slope position.
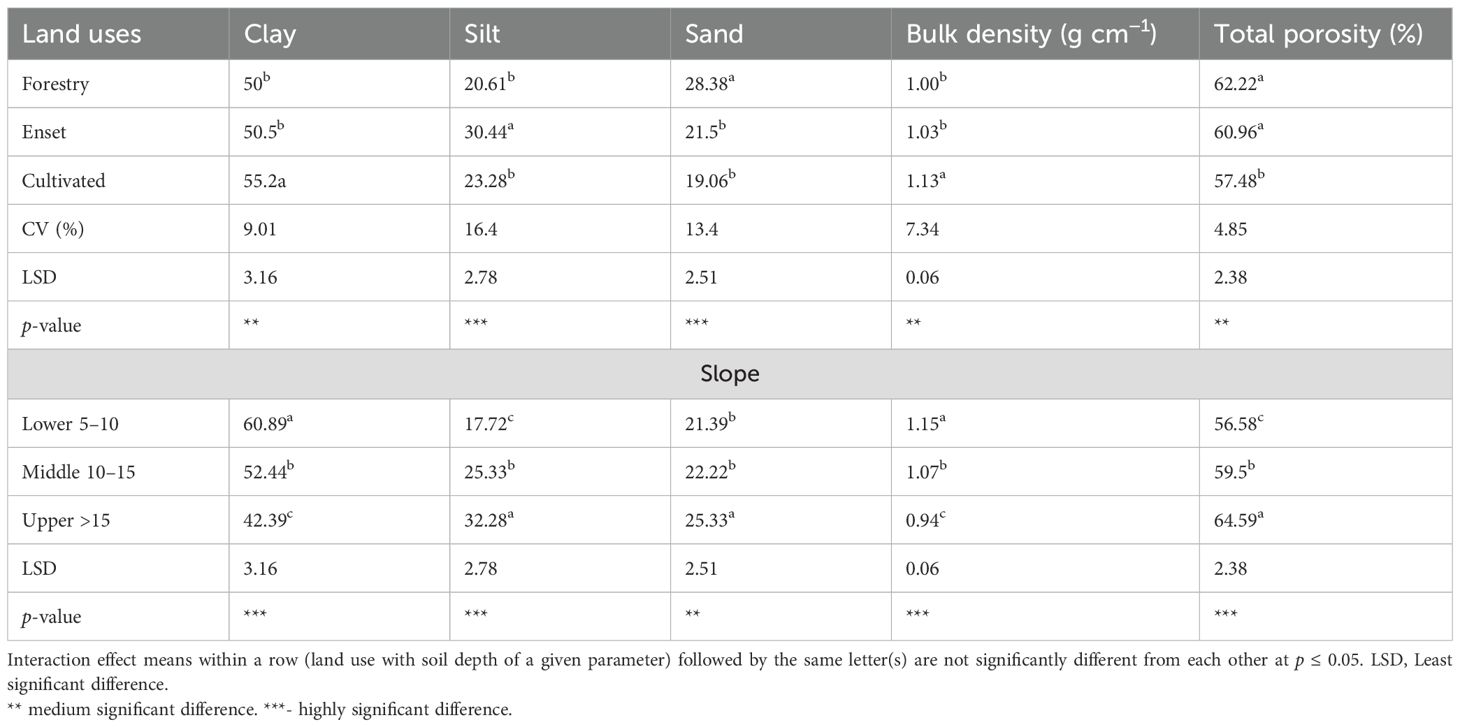
Table 1. Effects of land use and slope on soil physical properties.
This may be attributed to continuous plowing, soil disturbance, and the removal of topsoil in cultivated areas, which accelerate weathering processes and transform silt and sand into clay. Additionally, the relatively high clay content in cultivated land may result from tillage and deforestation, as these practices increase clay formation through accelerated weathering. Years of continuous tillage can enhance the clay content in the plow layer by altering the soil’s moisture, aeration, and temperature regimes, which, in turn, influence the rate of chemical reactions. These results align with previous studies (Chimdi and Gurmessa, 2023; Suh and Tsheko, 2024), which found that cultivated land has a higher clay content compared to other land uses.
We observed the highest clay content at lower slope positions. This increased clay content can significantly influence soil properties, affecting nutrient availability, drainage, and overall soil fertility. As a result, the lower slope areas often support different vegetation and agricultural practices compared to the upper slopes (Haile et al., 2024). However, it is consistent with other studies (Bojago et al., 2023; Atinafu et al., 2024), which found that the highest clay content was recorded at the lower slope of the gradient. It may be because the lower slope is composed of finer-textured parent material, or if there is prolonged weathering in that area, clay content may naturally be higher.
Forestry (20.61%) and enset (30.44%) systems show contrasting silt contents, possibly due to differences in vegetation cover and soil disturbance. The higher silt in enset could be attributed to OM retention and reduced erosion compared to cultivated systems (Demeku et al., 2022). Silt distribution is strongly influenced by slope-induced erosion higher on steep slopes and land management reduced in cultivated soils.
The sand fraction size was also significantly (p < 0.05) affected by land use (Table 2). The highest sand content at the lower slope position may be due to the lack of movement in this area, as well as the absence of sand particle translocation within the lower slope soil.
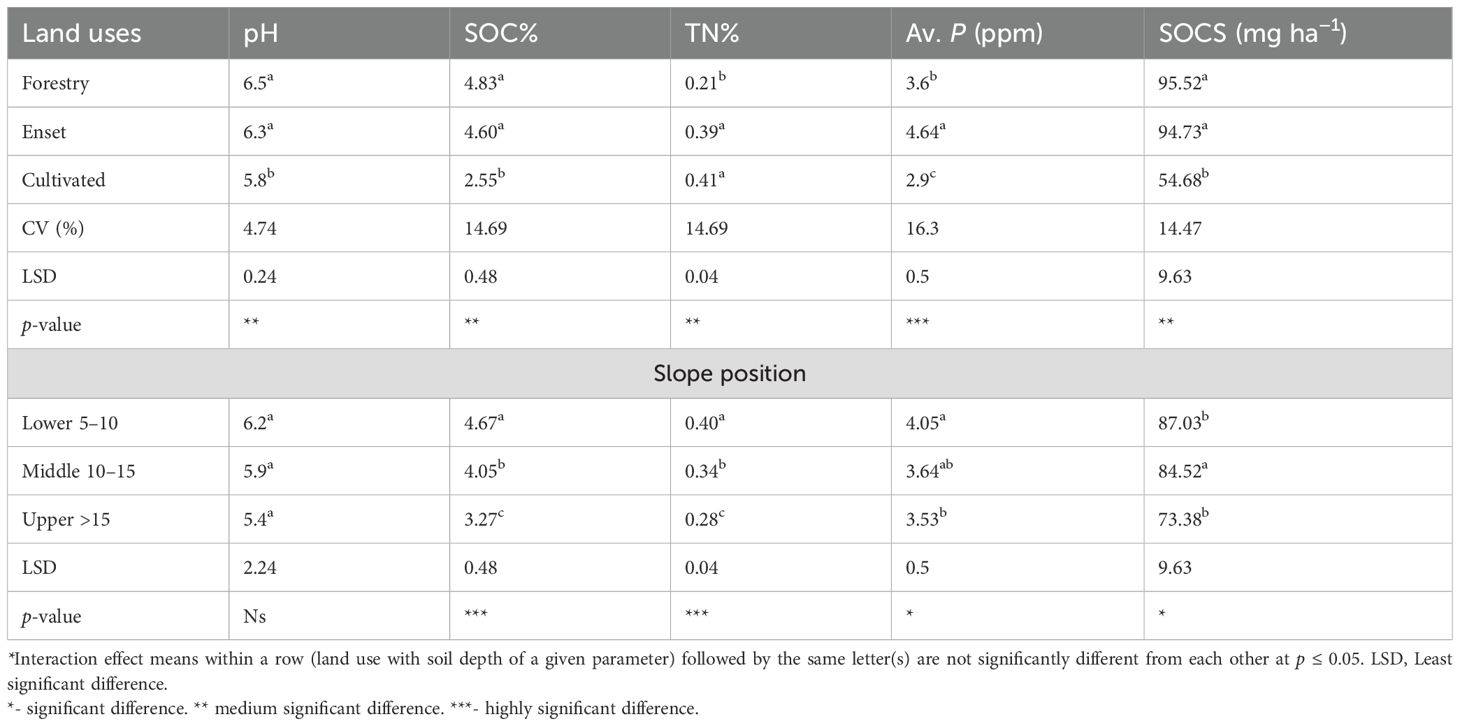
Table 2. Effects of land use and slope position on soil chemical properties.
Additionally, the lack of clear translocation and accumulation of finer fractions at lower parts of slopes has been attributed to the length of slopes in young glacial landscapes. In such terrains, soil material is translocated due to anthropogenic denudation, with more pronounced changes observed at the lower slope and in depressions (Shaikh, 2018).
3.1.2 Bulk density
The highest BD was recorded in cultivated land and the lowest was recorded in forestry land. BD of the soils varied significantly (p < 0.05) across different land uses (Table 1). Several studies have observed that cultivated lands often exhibit higher bulk density due to intensive agricultural practices. For instance, research indicates that cultivated land increases soil bulk density as a result of animal trampling, which leads to soil compaction (Mohammad et al., 2005; Spohn et al., 2023; Abera et al., 2024; Atinafu et al., 2024). Additionally, the removal of crop residues and continuous cultivation have been associated with increased soil compaction, contributing to higher BD.
The lowest BD (1 g/cm³) was observed in forestry land (Table 1), which could be attributed to farming methods that increase OM and subsequently lower BD. This finding aligns with the results of Rigal et al (Rigal et al., 2019), which highlighted that continuous animal and household waste additions, along with increased litter deposition from plant cover, enhance soil OM storage and reduce BD.
This study indicates that BD varies with slope position, often showing lower values at upper slope positions and higher values at lower slope positions. Factors including soil compaction, OM content, and erosion processes all have an impact on this pattern. For instance, a study observed that the upper slope position, which had a higher clay content, exhibited a lower bulk density compared to lower slope positions (Ivan et al., 2022; Hailu et al., 2024).
However, it is important to note that other studies have reported different findings (Kucuk, 2019; Bayle et al., 2023). Research has shown that lower slope positions recorded the highest values for clay content and other soil properties, while BD was higher in the upper slope position.
3.1.3 Total porosity
The total porosity (TP) of the soil was highest at 57.48% in cultivated land and at 62.22% in forestry land (Table 1). The higher TP in forestry land soil may be attributed to crop residues, earthworms, and OM, which improve soil porosity. This finding is consistent with the work of Jemal and Tesfaye (2020), which observed that forest land utilization exhibited higher TP compared to other land uses due to high OC content and the role of earthworms in decomposing plant leaves. In addition, studies (Abukari et al., 2021; Atinafu et al., 2024) show that vegetation leaf decomposition enhances microbial activity, which reduces bulk density, increases soil organic matter (SOM), and improves soil porosity. TP varied significantly (p < 0.001) with slope position. Among slope positions, the highest TP (64.59%) was recorded at the upper slope, while the lowest TP (56.58%) was observed at the lower slope (Table 1). Soil compaction, erosion, and the distribution of OM are some of the factors contributing to differences in total soil porosity across slope positions (Mulugeta et al., 2005). Lower slopes absorb eroded materials from higher places, including finer particles that diminish macropore space and increase bulk density, leading to lower porosity (Morgan and Royston, 2006). Upper slope positions have less foot traffic and machinery impact than lower slope sites, decreasing soil compaction and retaining higher porosity (Tetengi et al., 2022).
3.2 Effects of land use and slope position on soil chemical properties and soil organic carbon stocks
3.2.1 Soil reactions
The highest pH value was recorded in forestry land, while the lowest pH value was observed in cultivated land (Table 2). Soil pH (H2O) varied significantly (p < 0.001) across land uses. In this study, cultivated land is subject to various land-use practices. Farmers apply different inorganic fertilizers, which may contribute to the lower pH. In addition, lower pH in cultivated land may be due to the fact that the application of nitrogen-based fertilizers (e.g., urea and ammonium sulfate) contributes to soil acidification by increasing hydrogen ion concentration (Guo et al., 2010; Jemal and Tesfaye, 2020; Haile et al., 2024).
On the other hand, soil pH beneath shade trees such as Croton macrostachyus (commonly known as “Wanza”), Cordia africana (“Grare” in local name), Ficus vasta (“Warka”), and Millettia ferruginea (“Birbira”) significantly differed from the pH in open-field areas (Aschalew and Zebene, 2018). Various studies support this phenomenon, showing that the soil under tree-shaded areas has a noticeably higher pH compared to open-field soil (Bore and Bedad, 2016; Jemal and Tesfaye, 2020). Forest land has a higher pH due to its high OM content, limited soil disturbance, and cation buildup, whereas cultivated land experience acidification due to intensive farming, fertilizer application, and cation leaching (Dessalegn et al., 2014).
3.2.2 Organic carbon
SOC was significantly affected (p < 0.001) by land-use types, including cultivated, forestry, and enset land. The highest SOC was recorded in forestry land and the lowest was recorded in cultivated land, likely due to tree canopies, vegetation cover, and cro p residues, which contribute to the accumulation of OC in forested areas. The highest SOC in forestry land (4.83%), despite its higher pH (6.5) compared to cultivated land (pH 5.8, SOC 2.55%), can be attributed to greater OM inputs (leaf litter and root exudates) and minimal soil disturbance, which enhance carbon sequestration while maintaining near-neutral pH due to buffering by base cations (Ca²+ and Mg²+) from decomposing biomass (Cherinet et al., 2025). Similar findings from various regions in Ethiopia have demonstrated higher SOC levels under the canopies of coffee and shade trees such as Wanza (Cordia africana), Warka (Ficus vasta), and Birbira (Millettia ferruginea) compared to areas outside their canopies (Aschalew and Zebene, 2018; Wolka et al., 2021).
The highest SOC value of 4.67% was recorded in the lower slope, while the lowest value of 3.27% was observed in the upper slope (Table 2). Therefore, slope position significantly influenced SOC (p < 0.001). Upper slope locations are more prone to soil erosion caused by gravity and surface runoff, leading to the removal of organic-rich topsoil. Eroded materials, including OM, are carried downhill and deposited in lower slope locations. This buildup increases SOC levels in certain locations (Lal, 2003). In addition, increased SOC in the lower slope may be attributed to effective soil conservation practices, reduced human intervention, decreased grazing pressure, the regeneration of native vegetation, and partially enclosed practices (Bahadur Budha et al., 2020; Ali, 2022).
3.2.3 Total nitrogen
Land use showed a significant difference (p < 0.001) in relation to TN. The highest TN value (0.41) was recorded in cultivated land, while the lowest (0.21) was observed in forestry land (Table 2). Higher TN levels on cultivated land result from farmers’ frequent application of synthetic nitrogen fertilizers (such as urea and ammonium sulfate) to increase crop productivity. In some cases, crop residues are left on fields and plowed back into the soil, contributing to nitrogen enrichment (Brady and Weil, 2008). The lowest TN content is observed in forestry land, and the decomposition of organic material is slower due to cooler microclimates and reduced microbial activity, leading to lower nitrogen mineralization (Sandhya et al., 2023). In addition, various authors have suggested that in forest land, nitrogen is often immobilized in plant biomass and released slowly over time. Furthermore, deep-rooted trees may contribute to greater nitrogen leaching, reducing the available TN in the soil (Shibu Ebrahim, 2007; Sandhya et al., 2023).
TN significantly influenced slope position (Table 2). Therefore, the highest TN was registered in the lowest part of the slope position. OM and nutrients are moved from higher to lower slope locations via soil erosion processes. Fine soil particles that are high in OM and nitrogen are carried downslope by runoff, where they accumulate at the lower slope (Demeku et al., 2022; Atinafu et al., 2024). Moreover, the favorable moisture conditions in lower slope positions promote suitability to vegetation growth. The resulting plant litter and root biomass contribute additional OM, which, upon activity decomposition, increases the soil’s nitrogen content (Kidanemariam et al., 2012; Seifu et al., 2020).
3.2.4 Available phosphorus
The average value of Av. P was 3.6, 4.64, and 2.9 ppm in forestry, enset, and cultivated land use, respectively. Hence, Av. P was significantly varied (p < 0.001) in land use. The highest Av. P was recorded in enset land, and this may be related to long-term manure, appropriate handling of the leftovers, household waste refusal of the application and increased soil Av. P concentration, and the resulting rise in microbiological activity. Similarly (Materechera, 2001), the report has also documented how OM increases the mobility of inorganic P and complexes P from adsorption sites in ligand exchange, influencing P in soil solution. This result confirms (Alemayehu and Sheleme, 2013) that Av. P may have risen as a result of the conversion of organic P to accessible P through mineralization, the addition of crop manure and animal debris to enset crop, and the coating of the reaction surfaces of the soil particles to prevent or delay P sorption.
In slope position, Av. P in the lower and middle part of the slope positions was higher, and Av. P content in the lower slope was found to be higher than that of the upper slope. Besides, it is significantly affected at the slope position. This could be due to the application of manure and phosphorus fertilizers on lower slope farm, as well as the deposition of eroded material such as crop residual and animal debris from upper slope. These factors might contribute to the increased availability of phosphorus (Av.p) in lower slope area.
3.3 Soil organic carbon stocks
The result showed that SOCS vary in forestry, cultivated, and enset land-use practices; the highest mean registered was 95.52 and 94.73 mg ha−1 in forestry land and enset land, respectively. Moreover, SOCS significantly varied in forestry, cultivated, and enset land. When comparing enset land, Forestry and cultivated land use, Forestry land had the highest SOCS. The natural forest’s larger SOCS may be explained by the regular input of litter, the existence of a root system, and the altered microclimate, all of which slow down the pace at which OM decomposes. Similarly (Girma et al., 2020; Kibet et al., 2022), the higher SOCS registered for the soil of the forest land could be mainly because of the low rate of litter decay, and biomass inputs also found a higher mean SOCS in the virgin forest than in all the other land cover categories in the western part of Ethiopia (Lemenih et al., 2006). The lowest SOCS were recorded in cultivated land because there is little nutrient replenishment. Cultivated land soils are characterized by low nutrient levels along with deterioration; this might be due to frequent cultivation and low nutrient replenishment, which caused the soil aggregate to disintegrate and release the available OC into the atmosphere (Lemenih et al., 2006; Girma et al., 2020; Kibet et al., 2022). Furthermore, the reduction of crop biomass after harvesting may be the primary cause of the low SOCS. Different field research studies indicated that in the majority of the soils in Ethiopia’s Bale highlands, rainfall and clay content are the main factors regulating SOCS under various land uses by influencing the rates of initial production and breakdown (Chibsa and Ta’, 2009).
In the case of slope position, the highest SOCS was 87.03 mg ha−1, and the lowest was 73.38 mg ha−1 in upper and lower slope locations, respectively. The mean SOCS content showed differences in the following order: lower > middle > upper slope position.
3.4 The effects of land use and slope position response on cation exchange capacity and exchangeable base
Relatively, the highest CEC was observed under enset land use and the lowest CEC was recorded in cultivated land. Hence, CEC significantly varied in forestry, enset, and cultivated land. Therefore, the highest CEC observed land might be land in terms of crop residue, plant coverage, and tree canopy that are linked to an increase in CEC in enset land. This result confirms (Alemayehu and Sheleme, 2013) that an increase in OM content was the primary cause of the increase in soil CEC values in agricultural land uses. The lowest CEC was recorded in cultivated land when compared with other lands; this could be due to the cleaning of crop residual and intensive cultivation, which might be linked to the decline of OC, which is a result of decreasing CEC (Ali, 2022).
In the case of slope positions, the CEC ranges from 44.11 to 27.94, which was recorded at the lower and middle slope positions (Table 3). The slope position significantly influenced (p < 0.001) CEC. The highest CEC was recorded in the lower slope position, and this could be attributed to the effect of the soil management practices that enhanced the OM content of the lower slope position since OM is significantly related to CEC according to the discussion (Sheleme, 2017). In general, the CEC of the land use and slope position was medium to high (Landon, 1991).
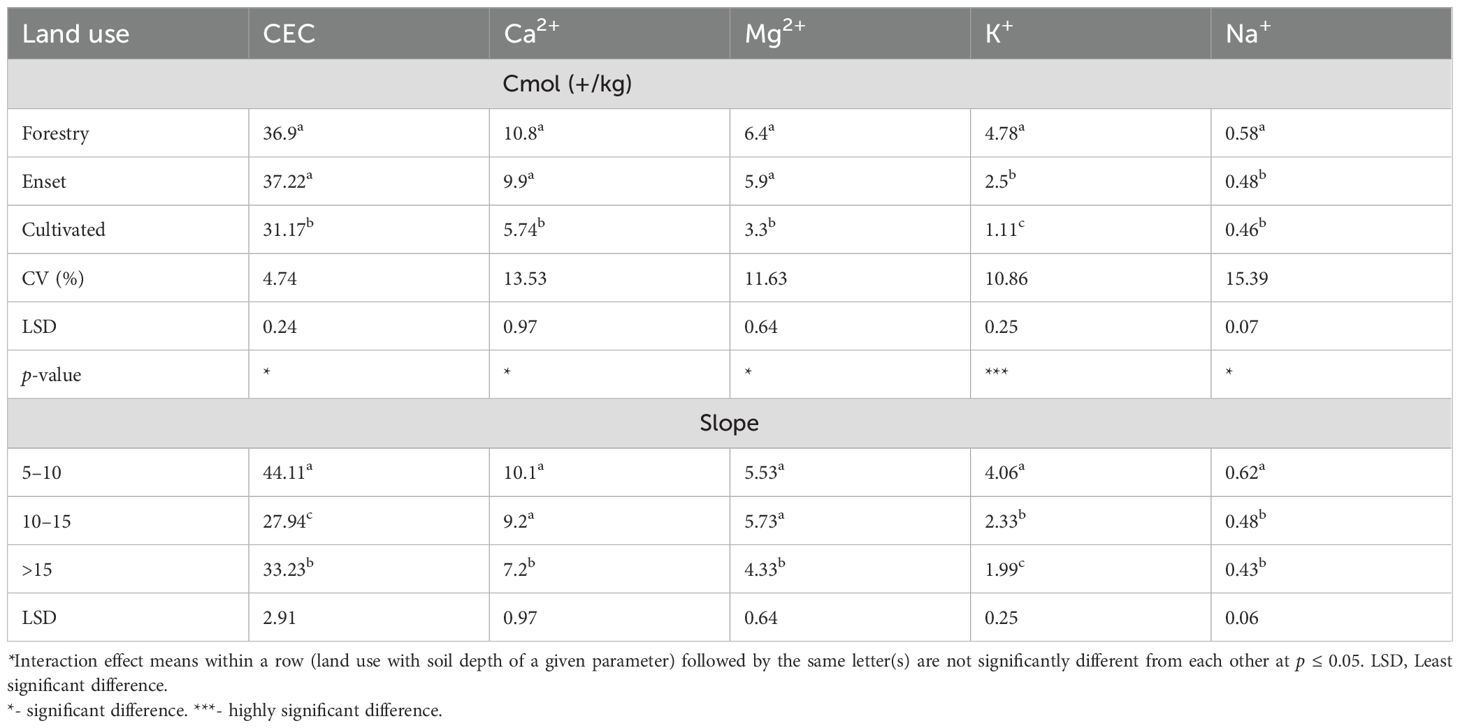
Table 3. Effects of land use and slope position on CEC and exchangeable base of soil.
The exchangeable base was dominated by Ca followed by Mg, K, and Na. The highest Ca was observed in forestry land (Table 3). Furthermore, the lowest content of Ca2+ was recorded in cultivated land. Because of their absorption, low plant nutrient replenishment, and high leaching intensity in cultivated land, exchangeable Ca2+ has been decreased in recently developed cultivated soils. This significantly reduces soil quality. Therefore, exchangeable Ca significantly (p > 0.005) affected forestry, enset, and cultivated land use. The exchangeable magnesium (Mg) concentrations followed a similar trend to that of Ca under different land-use systems. The highest exchangeable Mg 6.4 and 5.9 Cmol (+/kg) receded in forestry and enset, respectively (Table 3).
Variations in source substances, slope gradients, altitude, OM satisfaction, clay content, and ways to manage soil might be contributing factors for variations in exchangeable basic cation content among farms (Geremu et al., 2021). The highest exchangeable Ca2+, Mg2+, and K+ are significantly higher in forestry land use. This is related to the idea (Desalegn, 2024) that high soil OM acts as a nutrient storage and reduces soil erosion; it may be the cause of the greater exchangeable base concentrations observed with relatively higher OM. This could also help limit the leaching of basic cations from the soil.
The relatively low concentrations of K+ and Na+ were recorded in cultivated land (Table 3). This is attributed to the lower organic matter (OM) content, intensive cultivation practices, and reduced animal and crop residues, which contribute to the decline in these nutrient levels.
4 Conclusion
This study contributes to the existing body of knowledge by demonstrating how sustainable land-use systems (forestry and enset) enhance SOCS and improve soil fertility, thereby mitigating climate change through carbon sequestration. By comparing different slope positions and land uses, we provide empirical evidence that forestry and perennial cropping systems (enset) significantly reduce soil nutrient loss and increase SOC retention compared to conventional cultivation, highlighting their role in low-emission land management. The study highlights significant variations in soil physical and chemical properties across different land uses and slope positions. This study quantitatively demonstrates that forestry and enset land-use systems significantly enhance SOCS (95.52 and 94.73 Mg ha−¹, respectively), improve soil fertility [CEC: 36.9–37.22 Cmol(+)/kg], and reduce bulk density (1.00–1.03 g cm−³) compared to cultivated lands [SOCS: 54.68 Mg ha−¹, CEC: 31.17 Cmol(+)/kg, BD: 1.13 g cm−³]. Slope position further modulates these effects, with lower slopes accumulating higher clay (60.89%), SOC (4.67%), and TN (0.40%) due to erosion–deposition dynamics.
These findings emphasize the critical need for sustainable land management practices that preserve vegetation cover, reduce soil erosion, and enhance OM to mitigate soil degradation and improve agricultural productivity across varied landscapes.
Data availability statement
The original contributions presented in the study are included in the article/supplementary material. Further inquiries can be directed to the corresponding author.
Author contributions
CM: Writing – original draft, Writing – review & editing. AJ: Supervision, Visualization, Writing – review & editing.
Funding
The author(s) declare that no financial support was received for the research and/or publication of this article.
Acknowledgments
The authors are grateful to the Ministry of Science and Higher Education and Oda Bultum University for facilitating the study and research work. We are thankful to Essayas Assefa for the assistance and experiences shared during data collection.
Conflict of interest
The authors declare that the research was conducted in the absence of any commercial or financial relationships that could be construed as a potential conflict of interest.
Generative AI statement
The author(s) declare that no Generative AI was used in the creation of this manuscript.
Publisher’s note
All claims expressed in this article are solely those of the authors and do not necessarily represent those of their affiliated organizations, or those of the publisher, the editors and the reviewers. Any product that may be evaluated in this article, or claim that may be made by its manufacturer, is not guaranteed or endorsed by the publisher.
References
Abera F., Mebrate T., Lemma F., Tesfay, and Yitea Seneshaw Getahun (2024). Impact of soil and water conservation measures on soil physicochemical characteristics and crop productivity: evidence from korekore watershed in the central highlands of Ethiopia. Sci. World J. 2024, 2679180. doi: 10.1155/tswj/2679180
Abera G. and Wolde-Meskel E. (2013). Soil properties, and soil organic carbon stocks of tropical andosol under different land uses. Open J. Soil Sci. 03, 153–162. doi: 10.4236/ojss.2013.33018
Abukari A., Christian D., and Ochire-Boadu K. (2021). Bulk density and porosity of soils influenced by skidding operations in the Nkrankwanta Off-Forest Reserve of Ghana. Adv. Forestry Sci. 8, 1409–1415. doi: 10.34062/afs.v8i2.9530
Agidew A. A. and Singh K. N. (2018). Determinants of food insecurity in the rural farm households in South Wollo Zone of Ethiopia: the case of the Teleyayen sub-watershed, Agric. Food Econ 6 (1), 1–23. doi: 10.1186/s40100-018-0106-4
Alemayehu K. and Sheleme B. (2013). Effects of different land use systems on selected soil properties in South Ethiopia. J. Soil Sci. Environ. Manage. 4, 100–107. doi: 10.5897/JSSEM12.20
Ali S. (2022). Effects of wastewater use on soil physico-chemical properties and human health status. Indian J. Pure Appl. Biosci. 10, 50–56. doi: 10.18782/2582-2845.8864
Aschalew E. and Zebene A. (2018). Coffee growers local knowledge on shade tree species in Adola Rede District, Guji Zone, Southern Ethiopia. African. J. Agric. Res. 13, 2183–2191. doi: 10.5897/ajar2018.13350
Assefa F., Elias E., Soromessa T., and Ayele G. (2020). Effect of changes in land-use management practices on soil physicochemical properties in kabe watershed, Ethiopia. Air Soil Water Res. 13, 11. doi: 10.1177/1178622120939587
Atinafu M., Getnet K., and Gojjam A. (2024). Effects of physical soil and water conservation practices and slope gradient on soil physicochemical properties in northwestern Ethiopia. Arabian J. Geosciences 17 (3), 102. doi: 10.1007/s12517-024-11909-4
Bahadur Budha P., Paudyal K., and Ghimire M. (2020). Indicator based vulnerability assessment of chhayanath-rara municipality, western Nepal. Environ. Natural Resour. J. 18, 224–233. doi: 10.32526/ennrj.18.3.2020.21
Bayle D., Feyissa S., and Tamiru S. (2023). Effects of land use and slope position on selected soil physicochemical properties in Tekorsh Sub-Watershed, East Gojjam Zone, Ethiopia. Open Agric. 8 (1), 20220147. doi: 10.1515/opag-2022-0147
Berry N. (2011). Whole farm Carbon accounting by smallholder, lesson from plan Vivo project presentation at the small-scale mitigation whole farm and landscape accounting workshop (Rome: FAO). Available at: www.fao.org/climatechnage/micca/72531/en/ (Accessed October 27-28, 2011).
Blake G. R. (1965). Bulk Density in Methods of Soil Analysis. Agronomy No. 9, Part 1, C. A. Black, 374–390.
Bojago E., Delango M., and Milkias D. (2023). Effects of soil and water conservation practices and landscape position on soil physicochemical properties in Anuwa watershed, Southern Ethiopia. J. Agric. Food Res. 14, 100705. doi: 10.1016/j.jafr.2023.100705
Bore G. and Bedad B. (2016). Impacts of land use types on selected soil physico-chemical properties of loma woreda, dawuro zone, southern Ethiopia. Science Technol. Arts Res. J. 4, 40. doi: 10.4314/star.v4i4.6
Bouyoucos G. (1962). Hydrometer method improvement for making particle size analysis of soils. Agronomic J. 59, 179–186.
Brady N. C. and Weil R. R. (2008). The Nature and Properties of Soils (Vol. 13, pp. 662-710). (Upper Saddle River, NJ: Prentice Hall).
Cherinet M., Kiflu A., and Gizachew S. (2025). Effects of land use/land cover change on soil physicochemical properties and soil carbon stock in Kochore district, southern Ethiopia. Arabian J. Geosciences 18, 41.
Chibsa T. and Ta’ A. (2009). Assessment of Soil Organic Mat-ter under Four Land Use Systems in the Major Soils of Bale Highlands, South East Ethiopia. B. Factors affecting Soil Organic Matter Distribution. World J. Ag- ricultural Sci. 6, 1506–1512.
Chimdi A. and Gurmessa E. (2023). Effects of land use on selected soil properties and carbon sequestration in the Gurra watershed: The case of Chalia District, West Shoa Zone, Oromia, Ethiopia. South Afr. J. Bot. 156, 21–28. doi: 10.1016/j.sajb.2023.02.036
Córdova S. C., Olk D. C., Dietzel R. N., Mueller. K. E., Archontouilis S. V., and Castellano M. J. (2018). Plant litter quality affects the accumulation rate, composition, and stability of mineral-associated soil organic matter. Soil Biol. Biochem. 125, 115–124. doi: 10.1016/j.soilbio.2018.07.010
Demeku M., Assefa E., and Simane B. (2022). Variability of soil quality indicators along with the different landscape positions of Choke Mountain agroecosystem, upper Blue Nile Basin, Ethiopia. Heliyon 8 (7).
Desalegn M. (2024). Assessment and mapping of soil fertility status of migna kura kebele, wayu tuka district, east Wollega, Oromia, Ethiopia. Asian Soil Res. J. 8., 8–32. doi: 10.9734/asrj/2024/v8i1142
Dessalegn D., Beyene S., Ram N., Walley F., and Gala T. S. (2014). Effects of topography and land use on soil characteristics along the toposequence of Ele watershed in southern Ethiopia. CATENA 115, 47–54. doi: 10.1016/j.catena.2013.11.007
. Available online at: StatsEthiopia.gov.et/wp-content/uploads/2023/08/Population-of-Zones-and-WeredasProjected-as-of-July-2023.pdf.
FAO (2006). “Plant nutrition for food security: a guide for integrated nutrient management,” in Fertilizer and Plant Nutrition Bullet in 16 (FAO, Rome, Italy).
FAO (2015). Learning tool on Nationally Appropriate Mitigation Actions (NAMAs) in the agriculture, forestry and other land use (AFOLU) sector (Rome: FAO).
FAO/IAEA (2018). Management of Agroforestry Systems for Enhancing Resource use Efficiency and Crop Productivity (Vienna, Austria). Available at: https://www-pub.iaea.org/MTCD/Publications/PDF/te_1606.
Geremu T., Wogi L., and Feyissa S. (2021). Micronutrient status in soil and sorghum (Sorghum bicolor& (L.) moench) tissues in daro labu district, west hararghe zone of oromia region, Eastern Ethiopia. J. Chemical Environ. Biol. Eng. 5, 23. doi: 10.11648/j.jcebe.20210501.14
Girma D., Wogi L., and Feyissa S. (2020). Effect of land use types on soil organic carbon stock at sire morose sub watershed, hidabu abote district of north shoa zone, central highland of Ethiopia. Sci. Res. 8, 1. doi: 10.11648/j.sr.20200801.11
Gougoulias C., Clark J., and Shaw L. (2014). The role of soil microbes in the global carbon cycle: tracking the below-ground microbial processing of plant-derived carbon for manipulating carbon dynamics in agricultural systems. J. Sci. Food Agric. 94, 2362–2371. doi: 10.1002/jsfa.2014.94.issue-12
Guo J. H., Liu X. J., Zhang Y., Shen J. L., Han W. X., Zhang W. F., et al. (2010). Significant acidification in major Chinese croplands. Science 327, 1008–1010. doi: 10.1126/science.1182570
Haile G., Gebru C., Lemenih M., and Agegnehu G. (2024). Soil property and crop yield responses to variation in land use and topographic position: Case study from southern highland of Ethiopia. Heliyon 10, e25098. doi: 10.1016/j.heliyon.2024.e25098
Hailu A., Admase H., and Ewunetu T. (2024). Influence of land-use types and topographic slopes on the physico-chemical characteristics of soils in Northwestern Ethiopia. Front. Soil Sci. 4, 1463315. doi: 10.3389/fsoil.2024.1463315
Ivan M., Safner T., Rubinić V., Rutić F., Husnjak S., and Filipović V. (2022). Effect of slope position on soil properties and soil moisture regime of Stagnosol in the vineyard. J. hydrology hydromechanics 70, 62–73. doi: 10.2478/johh-2021-0037
Jemal K. and Tesfaye H. (2020). Soil physico-chemical property characterisation along with different land use system in gurage zone, southern Ethiopia. Modern Chem. 8, 40. doi: 10.11648/j.mc.20200803.12
Kibet E., Musafiri M., Kiboi M., Macharia J., Ng’etich J., Kosgei D., et al. (2022). Soil organic carbon stocks under different land utilization types in western Kenya. Sustainability 14, 8267. doi: 10.3390/su14148267
Kidanemariam A., Gebrekidan H., Mamo T., and Kibret K. (2012). Impact of altitude and land use type on some physical and chemical properties of acidic soils in tsegede highlands, northern Ethiopia. Open J. Soil Sci. 02, 223–233. doi: 10.4236/ojss.2012.23027
Kimura R. (2018). Global distribution of degraded land area based on dust erodibility determined from satellite data. Int. J. Remote Sens. 39, 5859–5871. doi: 10.1080/01431161.2018.1444295
Köchy M., Hiederer R., and Freibauer A. (2015). Global distribution of soil organic carbon - Part 1: Masses and frequency distributions of SOC stocks for the tropics, permafrost regions, wetlands, and the world. Soil 1, 351–365.
Kucuk M. (2019). Effects of vegetation cover/land use and slope aspect on surface soil properties near the copper smelter factory in murgul, Turkey. Appl. Ecol. Environ. Res. 17. doi: 10.15666/aeer/1705_1230512321
Lal R. (2003). Soil erosion and the global carbon budget. Environ. Int. 29, 437–450. doi: 10.1016/S0160-4120(02)00192-7
Landon J. R. (1991). Booker: Tropical Soil Manual: A Handbook for Soil Survey and Agricultural Land Evaluation in Tropics and Subtropics (London: Longman).
Lemenih M., Lemma B., and Teketay D. (2006). Changes in soil carbon and total nitrogen following reforestation of previously cultivated land in the highlands of Ethiopia. SINET: Ethiopian J. Sci. 28 (2), 99–108. doi: 10.4314/sinet.v28i2.18245
Materechera S. (2001). Influence of land-use on properties of a ferralitic soil under low external input farming in southeastern Swaziland. Soil Tillage Res. 62, 15–25. doi: 10.1016/s0167-1987(01)00202-1
Mohammad C., Mohseni Saravi R. ,. M., and Malekian A. R. A. S. H. (2005). Effects of livestock trampling on soil physical properties and vegetation cover (case study: Lar Rangeland, Iran). ” Int. J. Agric. Biol. 7, 904–908.
Morgan R. P. C. and Royston P. C. (2006). Soil Erosion and Conservation (UK: Blackwell Publishing), 304pp.
Mulugeta L., Karltun E., and Olsson. M. (2005). Assessing soil chemical and physical property responses to deforestation and subsequent cultivation in smallholder farming system in Ethiopia. Agriculture Ecosystem Environ. 105, 373–386.
Nega E. and Heluf G. (2013). Effect of land use changes and soil depth on soil organic matter, total nitrogen and available phosphorus contents of soils in senbat watershed, western Ethiopia. ARPN J. Agric. Biol. Sci. 8 (3), 206–212.
Olsen S. R., Cole C. V., Watanabe F. S., and D. L. A. (1954). Estimation of available phosphorus in soil by extraction with sodium bicarbonate. USDA Circular 939, 1–19.
Rigal C., Xu J., and Vaast P. (2019). Young shade trees improve soil quality in intensively managed coffee systems recently converted to agroforestry in Yunnan Province, China. Plant Soil 453, 119–137. doi: 10.1007/s11104-019-04004-1
Sandhya N., Mohan Kc, Pudasaini N., and Adhikari H. (2023). Divergent effects of topography on soil properties and above-ground biomass in Nepal’s mid-hill forests. Resources 12, 136.
Seifu W., Elias E., and Gebresamuel G. (2020). The effects of land use and landscape position on soil physicochemical properties in a semiarid watershed, northern Ethiopia. Appl. Environ. Soil Sci. 2020, 1–20. doi: 10.1155/2020/8816248
Shaikh M. K. (2018). Climate change and resilience in industrial aquaculture: a study of community capitals in the shrimp-farming zone in Bangladesh (Doctoral dissertation). doi: 10.32657/10356/73286
Sheleme B. (2017). Topographic positions and land use impacted soil properties along Humbo Larena-Ofa Sere toposequence, Southern Ethiopia. J. Soil Sci. Environ. Manage. 8, 135–147. doi: 10.5897/jssem2017.0643
Shibu Ebrahim M. (2007). Modeling long-term dynamics of carbon and nitrogen in intensive rice-based cropping systems in the Indo-Gangetic Plains (India) (India: Wageningen University and Research).
Shrestha S. and Kafle G. (2020). Variation of selected physicochemical and hydrological properties of soils in different tropical land use systems of Nepal. Appl. Environ. Soil Sci. 2020 (1), 1–6. doi: 10.1155/2020/8877643
Spohn M., Braun S., and Sier C. (2023). Continuous decrease in soil organic matter despite increased plant productivity in an 80-years-old phosphorus-addition experiment. Commun. Earth Environ. 4 (1), 251. doi: 10.1038/s43247-023-00915
Suh C. N. and Tsheko R. (2024). Spatial and temporal variation of soil properties and soil organic carbon in semi-arid areas of Sub-Sahara Africa. Geoderma Regional 36, 00770. doi: 10.1016/j.geodrs.2024.e00770
Tetengi M., Lawal A., Panti A., and Isah S. (2022). Selected physical and chemical properties of soils in mokwa, doko and edozhigi areas of Niger state, Nigeria.
Van Reeuwijk L. (1992). Procedures for Soil Analysis. 3rd Edition, International Soil Reference and Information Centre (ISRIC), Wageningen.
Weissert L., Salmond J., and Scwendenmann L. (2016). Variability of soil organic carbon stocks and soil CO2 efflux across urban land use and soil cover types. Geoderma 271, 80–90. doi: 10.1016/j.geoderma.2016.02.014
Wolka K., Biazin B., Martinsen V., and Mulder J. (2021). Soil organic carbon and associated soil properties in Enset (Ensete ventricosum Welw. Cheesman)-based homegardens in Ethiopia. Soil Tillage Res. 205, 104791. doi: 10.1016/j.still.2020.104791
Zhang J. H., Wang Y., and Li F. C. (2015). Soil organic carbon and nitrogen losses due to soil erosion and cropping in a sloping terrace landscape. Soil Res. 53, 87. doi: 10.1071/sr14151
Keywords: land use impact, soil organic carbon stocks, slop variation, soil fertility conservation, sustainable land management
Citation: Wachu CM and Ibrahim AJ (2025) Assessment of land use and slope influence on soil organic carbon stocks and soil properties in Southern Ethiopia. Front. Agron. 7:1536935. doi: 10.3389/fagro.2025.1536935
Received: 29 November 2024; Accepted: 02 June 2025;
Published: 01 July 2025.
Edited by:
Naser A. Anjum, Aligarh Muslim University, IndiaReviewed by:
Vikas Sharma, Sant Baba Bhag Singh University, IndiaSumit Chakravarty, Uttar Banga Krishi Viswavidyalaya, India
Copyright © 2025 Wachu and Ibrahim. This is an open-access article distributed under the terms of the Creative Commons Attribution License (CC BY). The use, distribution or reproduction in other forums is permitted, provided the original author(s) and the copyright owner(s) are credited and that the original publication in this journal is cited, in accordance with accepted academic practice. No use, distribution or reproduction is permitted which does not comply with these terms.
*Correspondence: Cherinet Miju Wachu, Y2hlcmluZXRtaWp1QGdtYWlsLmNvbQ==