 Haidee Tang
 Xiaojun Zhai
 Xiangming Xu
- 1Niab, East Malling, United Kingdom
- 2School of Computer Science and Electronic Engineering, University of Essex, Colchester, United Kingdom
Most studies treat flowering time of all fruit within an apple orchard as a single date, overlooking the variability in flowering time both between trees and among individual flowers on the same tree. Consequently, the simplified approach of using a single flowering date may contribute to inaccuracies in harvest time predictions in previous models, impacting fruit quality. In our study, we aim to analyze the variance caused by flowering time on apple maturity by calculating the number of growing hours using the linear Growing Degree Hour (GDH), non-linear GDH and Thermodynamic models and correlating them to maturity. We also determine the variance caused by year, canopy region and tree-to-tree variability. We found that the effect due to the variability in flowering time is cultivar dependent, with Cox’s Orange Pippin having the largest effect (18.4 - 18.7%), followed by Gala (13.42 - 14.71%), Golden Delicious (5.86 - 6.15%), Braeburn (2.88 - 3.37%) and almost no effect on Fuji (0.52 - 0.61%). Seasonal and tree differences had a smaller impact on fruit maturity, while canopy region showed no significant effects.
1 Introduction
It is established that fruit quality after long-term storage has been linked to fruit maturity at the time of harvest (Magness et al., 1926; Knee and Smith, 1989; Goncalves et al., 2017). Fruit picked too early are more likely to develop storage disorders such as core rot and internal browning (Argenta et al., 2023). Moreover, underdeveloped fruit are less attractive to consumers due to poor development in secondary metabolites (flavonoids). The group of secondary metabolites not only adds flavor and color to fruit, but also have antioxidant, anticancer, antiviral and anti-inflammation properties. On the other hand, although over-ripe fruit contains these beneficial and attractive qualities, they tend to be too soft and easily bruised, leading to rot and making it unsuitable for long-term storage (Wilkinson and Sharples, 1967; Goncalves et al., 2017). In addition, over-ripe fruit produces ethylene which causes an autocatalytic ripening effect on itself and other fruit in the vicinity, causing them to ripen. Picking fruit at the optimal harvest time can thus reduce fruit loss and increase fruit quality.
The optimal time of harvest is difficult to predict because there is no single clear index for apple maturity. We can observe changes in several physical traits such as color, firmness and sweetness, but these traits can be highly variable even among individual fruit on the same tree. These traits can vary year to year, with the extent of variability depending on cultivars, partially due to the variability in the season’s conditions (Blanpied and Silsby, 1992; Goncalves et al., 2017). The industry standard for maturity assessments includes destructive assessments of small samples of fruit, to measure firmness, Starch Pattern Index (SPI), soluble solids and ethylene. Firmness, soluble solids and SPI measurements can be aggregated into a single variable called Strief (Streif, 1996). No single feature can represent the true maturity of apples, and an aggregation of multiple features is more effective (Streif, 1996; Musacchi and Serra, 2018). Regardless of the maturity indicator, these assessments only forecast up to a week from the harvest window. Therefore, a clear definition of maturity and earlier indicators for the optimal harvest window are necessary for effective orchard harvest and post-harvest management (Luton and Hamer, 1983; Shewa et al., 2022).
A set calendar date after full bloom is not a good predictor of harvest windows, especially with changing climates (Musacchi and Serra, 2018). Statistical methods can be used to predict harvest windows for specific cultivars. Typically, they are done using growth models based on accumulation of effective temperatures within a specified temperature limit (Blanpied, 1982; Perry et al., 1987). Assorted windows of time were tested, as temperature has different effects on fruit depending on the stage of development (Warrington et al., 1999). Many model variants account for temperatures at different stages of development. Several studies showed that temperatures within 30-days post-bloom improved harvest date predictions (Blanpied, 1964; Blanpied and Ben-David, 1970). Perry et al. (1987) trialed 30-, 40-, 50- and 60-days post-bloom temperatures, but were only able to improve predictions by 1 day for Delicious apples, and no improvement for Golden Delicious apples. Other studies found that a three-month window (June, July and August) improved the prediction accuracy by 3 days (Luton and Hamer, 1983). The complete harvest window from full bloom to harvest only improved harvest day predictions by 1 day (Abeles and Lightner, 1984). Predictive results often varied greatly with cultivars (Sapkota et al., 2021). In most studies, average daily temperatures instead of hourly temperatures were used to predict harvest time. Thus, if the underlying relationship of temperature with fruit development is not linear, using hourly models is expected to improve predictions.
The term “full bloom” can mean different stages of flowering: 50% bloom (Blanpied and Silsby, 1992), 70% bloom (Sugiura et al., 2023) or 80% bloom (Luton and Hamer, 1983; Lysiak, 2012). Moreover, treating flowering times of all fruit in a single orchard as a single date ignore the variability in the flowering time between trees and between individual flowers on the same tree. Later blooming flowers developed fruit which were smaller and had greater levels of starch in apples (Volz et al., 1993). Thus, inaccuracies in predicted harvest time by previous models may be partially attributable to this simplification of flowering time for a given orchard. It can be argued that a better predictive model should be based on individual fruit, from flowering to harvest.
Fruit position within the canopy has been shown to affect maturity of apples (Robinson et al., 1983). The fruit position is used as a proxy for light exposure, as fruit grown on the outer zones of the trees were more likely to have higher soluble sugars (Robinson et al., 1983; Volz et al., 1993; Drogoudi and Pantelidis, 2011) and be firmer (Hamadziripi et al., 2014; Kalcsits et al., 2019; Kviklys et al., 2022). Inconsistent results, occasionally showing no change or opposing findings in maturity indices (Krishnaprakash et al., 1983), could be due to varying cultivar responses to the environment.
The most commonly used harvest prediction models use only the average flowering date to estimate at a single point in time to harvest. However, the impact of extended flowering time is not considered in these models, nor are other environmental factors. In this study, we aim to determine the degree of impact on harvest maturity, due to flowering time, season (year), region of the canopy and individual trees. Knowing the effect of these factors can improve harvest predictions and improve the overall fruit quality at the picking time. To model temperature effect on fruit development, we used three growth rate models (linear growing degree hours (linear GDH), non-linear GDH and Thermodynamic) to relate temperature to fruit maturity. The relative importance of individual factors (flowering time [i.e., temperature accumulation], season, tree, canopy region) was assessed in the framework of generalized linear modelling (GLM). In our study, we found that flowering time can affect fruit maturity at harvest but the degree of the effect is cultivar dependent.
2 Methods
2.1 Plants
We focused our research on five apple cultivars: Braeburn, Cox, Fuji, Gala and Golden Delicious. The same 14 trees were monitored over the 2022 and 2023 seasons, except for Cox’s Orange Pippin, which only had 5 fruit in 2022. There were three trees for each cultivar, except Fuji for which one tree was severely diseased and thus there were no fruits from this tree reaching maturation. The three trees of the same cultivar were adjacent to each other in an orchard; all five cultivars were situated in adjacent rows, which run north to south, with 2 m spacing between each tree and 2.5 m spacing between each row. All trees were about 12 years old and grafted on M9 rootstocks. The orchard received basic orchard management, but no commercial thinning or pruning was applied. Natural June drop was the only process of fruit thinning. All trees were at most 2.5 m tall and 2 m wide.
2.2 Flowering records
Apple flowers grow in clusters. Flowering records were done by tagging clusters of flowers with the date of bloom. The bloom date was noted when the majority (three of five flowers) of the cluster was fully open. Therefore, the flowering dates used in this study were when flowers on positions 2 and 3 were fully open, which usually occurred a day after the king bloom flower opened and a day before the flowers at positions 4 and 5 opened. A total of 1199 flower clusters were tagged between the 14 trees, made up of 12 to 85 clusters per tree (Table 1).
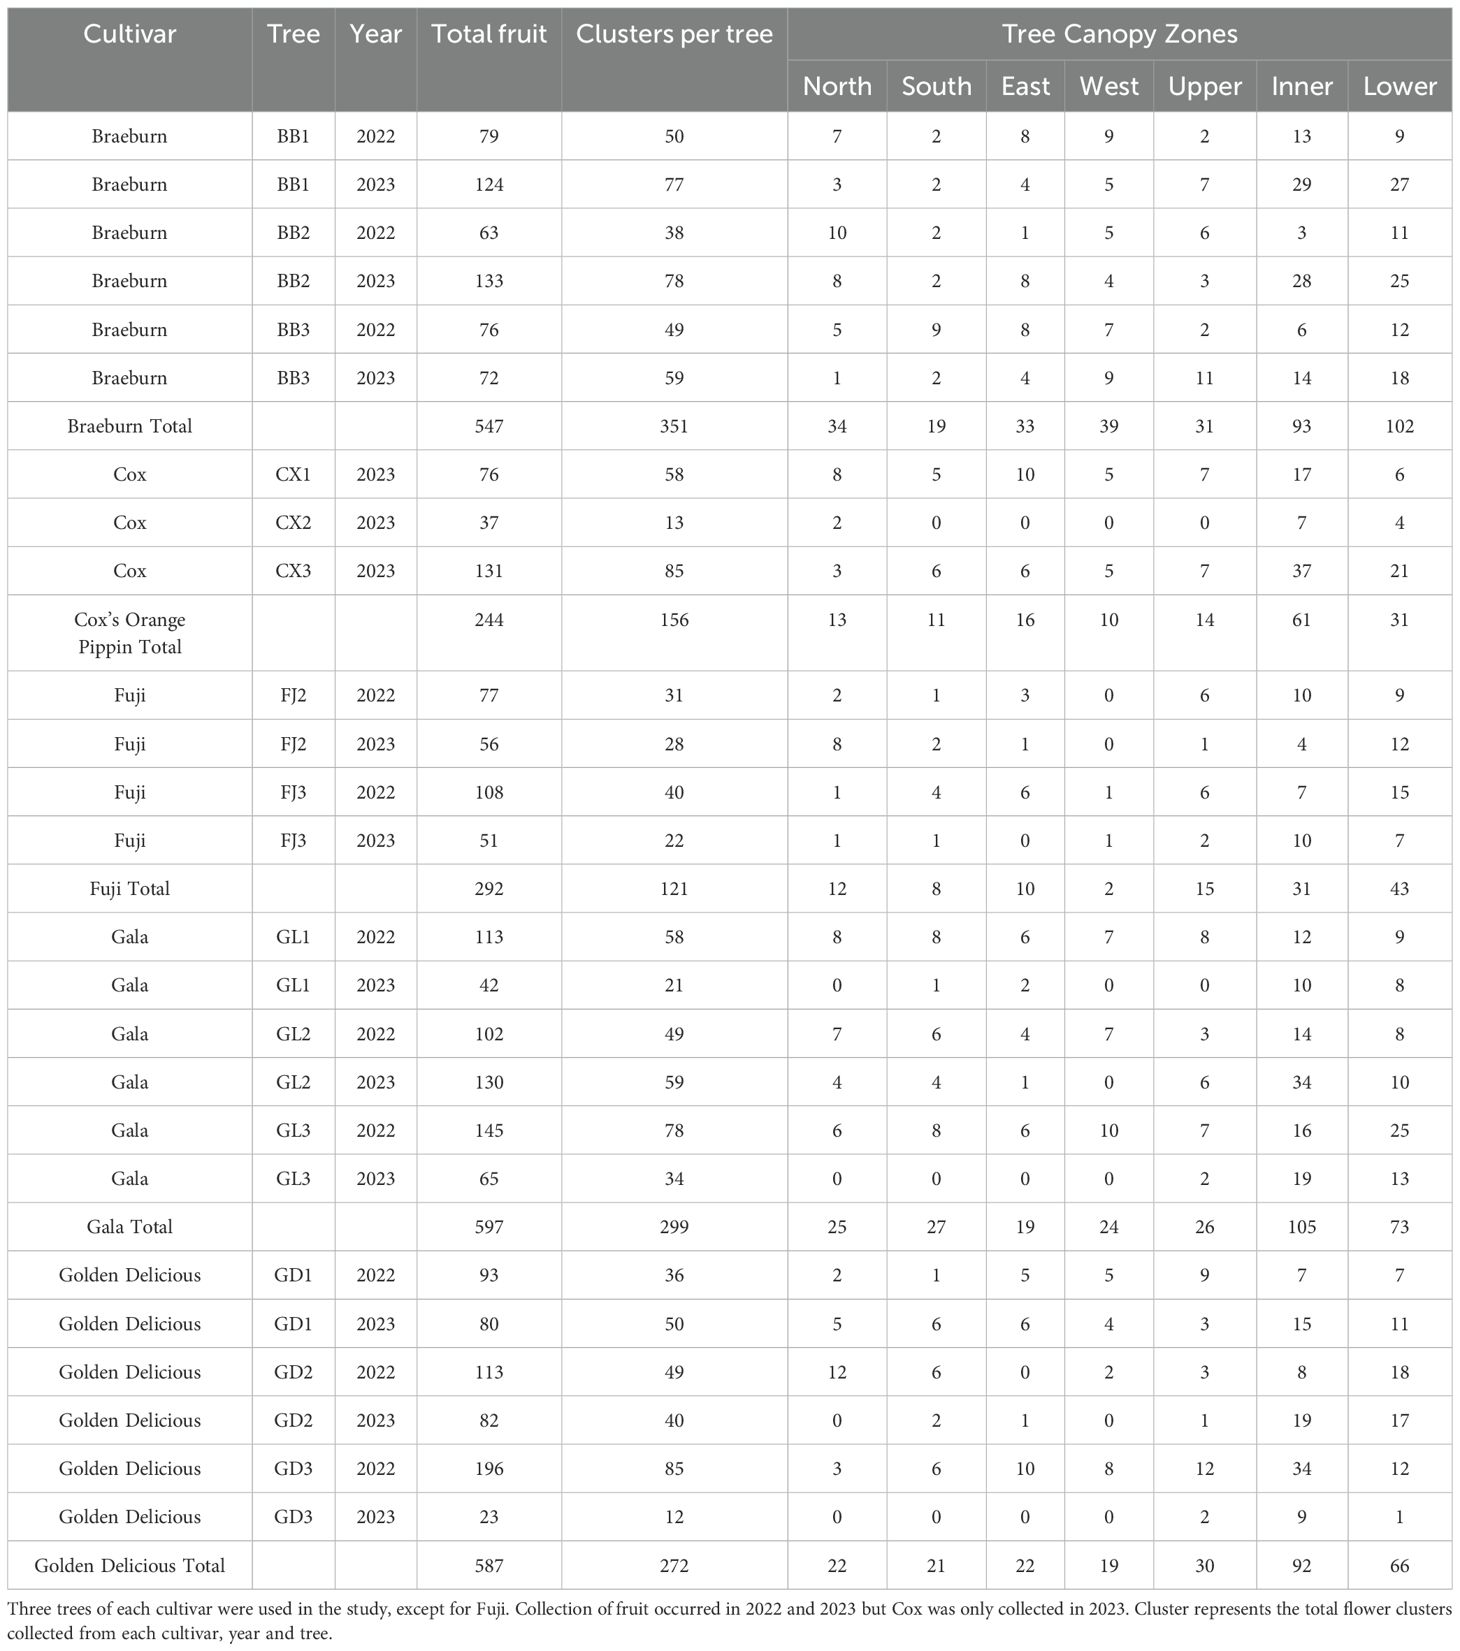
Table 1. Summary of fruit and cluster quantities across different trees and zones in 2022 and 2023.
2.3 Tree canopy zones
A single tree canopy was divided into 7 zones as a proxy for fruit exposure to light: north, south, east, west, upper, inner and lower (Table 1). The first 5 zones are regions on the outer areas of the trees with greater light exposure, whereas fruit from the inner and lower zones were mostly shaded by foliage during fruit development. The upper region consisted of fruit within the upper 25% of the tree. The fruit from the four cardinal directions were picked from the outer edge of the trees. Fruit picked from the inner and lower of the trees were located close to the trunk and within the lower 25% of the trees, respectively.
2.4 Temperature records
An official UK Meteorological Office Station situated approximately 465 m from the orchard in East Malling (51.2876°N, 0.4486°E, 33 m above the mean sea level) collected hourly temperatures.
2.5 Maturity measurements
In total, 2267 fruit were collected over two years (Table 1). The tagged fruit were harvested at the recommended commercial harvest date for specific cultivars in the UK, and tested for starch, brix and firmness within 36 hours from picking. They were always picked in the morning over a 3-month period. Firmness was measured by peeling two sides of the apple at 90 degrees in the equatorial region, avoiding obvious bruises, then using a fruit texture analyzer (Llyod LRX, UK) fitted with an 11 mm diameter probe to puncture the fruit to a depth of 8 mm. The force at 8 mm was used for the analysis. The Brix was measured using an Atago portable benchtop refractometer (palette series, model PR-32α), using water to calibrate at the start of each sampling day. The starch pattern index (SPI) is the gold standard in determining apple ripeness. An apple was first cut in half at its equator; one of the halves was then immediately stained with potassium iodine mixture (1% w/v iodine and 4% w/v potassium iodide), leaving it to stain for at least 30 minutes; finally the staining pattern was compared to the CTIFL starch conversion chart for apples to estimate SPI as an index from 1 to 10, and proportion of staining coverage. The 30-minute staining was more practical and allowed for all apples to be evaluated without large breaks between each set. No significant differences in staining pattern occurs within 30 minutes but starch breakdown may occur if left overnight (Per comms). The SPI, firmness and brix were transformed into a singular unit called the Streif index (Equation 1) (Streif, 1983, 1996).
2.6 Models describing temperature effects
Three temperature-based models were evaluated for their relationship with fruit maturity linear GDH, non-linear GDH and Thermodynamic). They were chosen to model the relationship between temperature and maturity. The preliminary analysis showed that the cultivars differed, hence we fitted a model across the two years for each cultivar separately. Hourly temperatures from flowering to harvest were used to calculate the growth units as specified by each model for individual apples. For each model, we used a simple grid search to identify the set of parameters that maximize the Kendall’s Tau correlation between SPI and accumulated temperature measurement from flowering to harvest for individual fruit. All parameters were iterated through a range as specified below for each model at a step length of 0.1. Temperatures at East Malling in 2022 and 2023 did not exceed 40°C, thus we did not explore higher temperatures for model parameters.
2.6.1 Linear growing degree hours
The linear GDH (Equations 2, 3), established by Anderson and Seeley (1992), assumes a linear relationship of growth with accumulative temperatures above a temperature (base) threshold. It has 3 parameters, Tb, Tc and Tu, representing the base, critical and optimal temperatures. Temperatures below the base do not count towards GDH units, nor temperatures exceeding the critical threshold. The contribution of each degree increase in temperature from the base linearly increases as temperature increases, up until the optimum temperature. Temperatures between the optimum and critical temperatures accumulate GDH units at the maximum rate. Thus, strictly speaking, this GDH is not linear but two lines joining at Tu.
In grid search, Tb spanned from 0°C to 10°C, Tu from 15°C to 25°C, and Tc from 30°C to 40°C. The base temperature originally proposed by Richardson et al. (1975) was 4.5°C for peach trees. However a recent study by Tang et al. (2024) found that the base temperatures of apple trees may be lower than 4.5°C. We extended the search from 0°C to 10°C to explore the best fitting base temperature. Tu was chosen based on the expected best growth conditions of most living organisms, and finally we expect the critical temperature to range somewhere between 30 and 40°C.
2.6.2 Non-linear growing degree hours
The second is another well established model growing degree hour model by Anderson et al. (1985) (Equations 4, 5). Opposed to the linear non-linear GDH model, this model assumes a non-linear accumulative relationship of growth with temperature. Each temperature increase from the base causes a non-linear increase in GDH up until the optimum temperature. Temperatures above the optimal gradually decrease in effectiveness in GDH accumulation.
The grid search range for Tb, Tc and Tu was the same as for the linear GDH model.
2.6.3 Thermodynamic model
The Thermodynamic model (Equation 6) is a non-linear growth rate model based on the theory of enzyme activity rate variation in response to temperature changes (Wagner et al., 1984; Xu, 1996). The parameters for the Thermodynamic model are B, C, TH and ρ.
In the grid search, the range of parameters B was 15 to 40°K, C was 5 to 30°K and TH was 290 to 300°K. The last variable in the equation, ρ, is a scaling factor and does not affect the correlation of the estimated growth unit from flowering to maturity with SPI, so it was fixed to 1.
2.7 Assessment of the relative importance of experimental factors in fruit maturity
Logistic regression with starch proportion as the response variable was used to determine the effect of flowering time (as approximated by the estimated temperature-based growth unit), year, individual trees, and fruit position within the tree canopy on fruit maturity. In the GLM analysis, a binomial distribution was assumed for the residual errors. The deviance explained by each experimental factor was calculated by extracting the residual deviance from ANOVA tables calculated using Chi-square (synonymous to likelihood ratio) as the test function. Since this study focused on the temperature effect (flowering time) on fruit maturity, the accumulated growth models estimated by one of the three models was first added in GLM analysis of SPI for each cultivar. Then, year, tree, and canopy region were added sequentially. A nested model approach was used to test for statistical significance of the effect of specific factors on fruit development (SPI).
3 Results
3.1 Variability of temperature and effects on flowering
The temperatures in 2022 during fruit development were more extreme than in 2023 and had a slightly lower median temperature (Figure 1). The median flowering day in 2022 was earlier than in 2023 by 9.8 days; flowering was spread over 3 weeks in 2022 (Table 2). On the other hand, temperatures in 2023 were more often within optimal growing temperatures, so flowering occurred within a shorter time span (∼11 days), with Cox’s Orange Pippin as an exception as there were no fruit available for this cultivar in 2022 (Table 2).
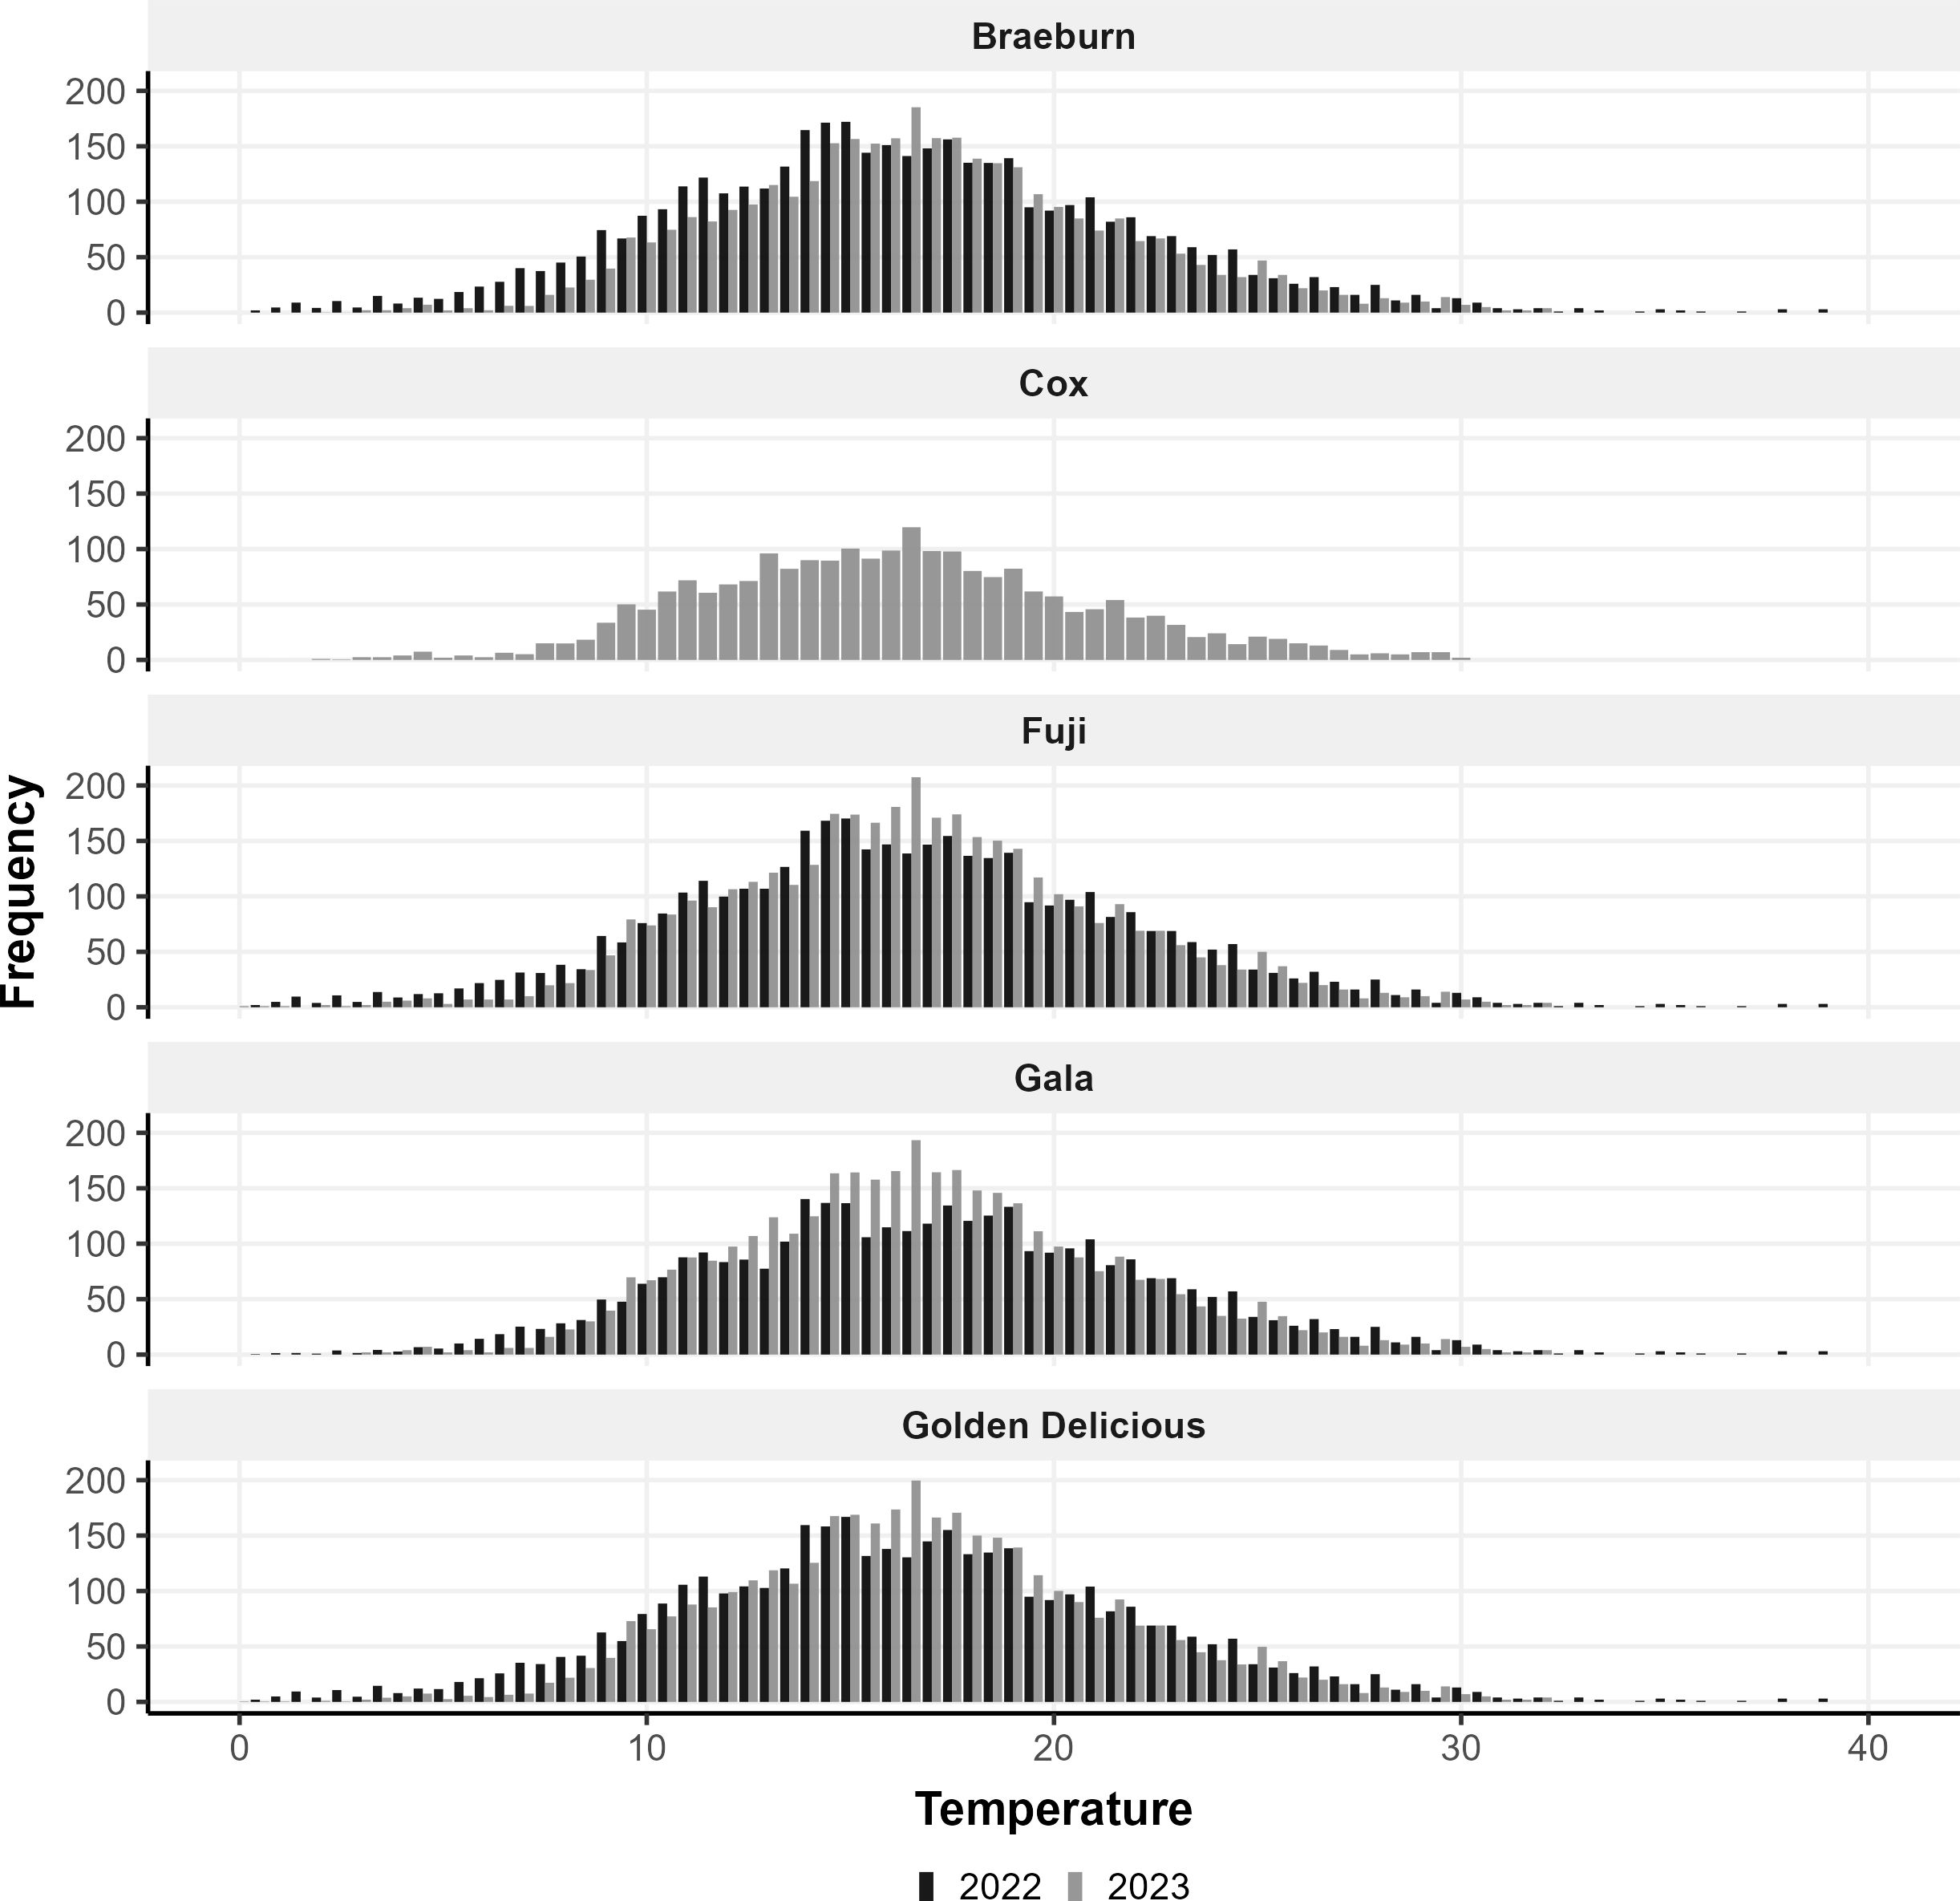
Figure 1. The frequency of temperatures between 0 and 40°C at 0.5°C increments from the first flowering to harvest for the five apple cultivars in 2022 (black bars) and 2023 (grey bars).
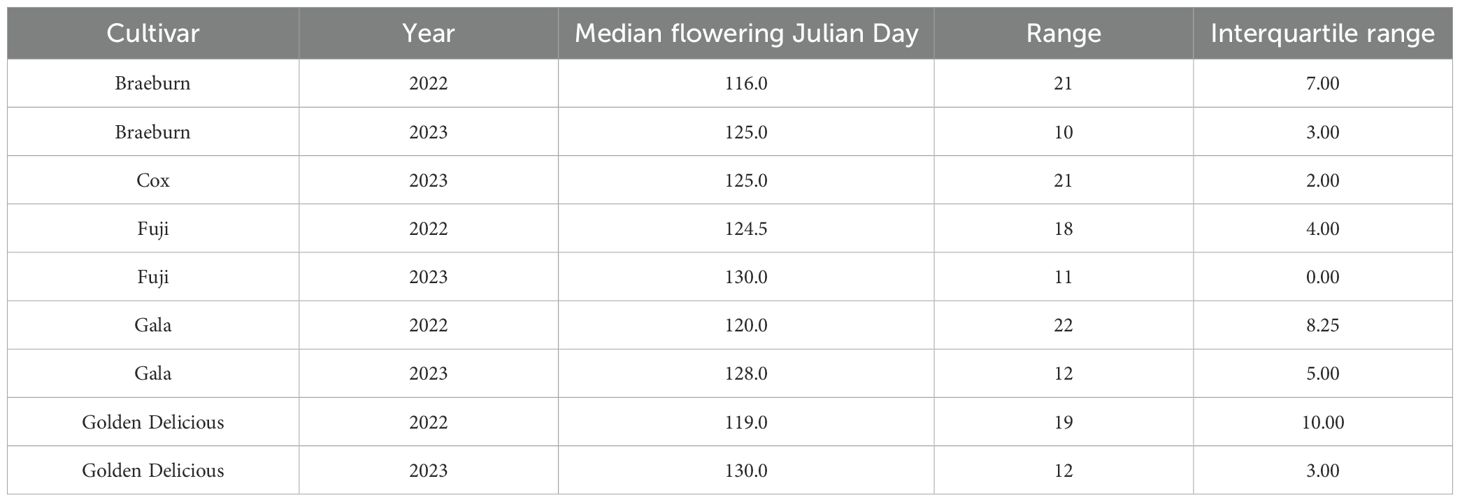
Table 2. Summary of flowering data from 2022 and 2023 for 5 apple cultivars.
3.2 Fruit maturity measurements
Of the five cultivars, Cox is the earliest to mature whereas Golden Delicious and Fuji matured the latest. Strief can account for several factors in one variable and no single fruit quality parameter has been able to accurately define the maturity of an apple. Therefore, Streif should be a better factor than individual measures for maturity. However, in the present study, Streif segregated the dataset in firmness and Brix measurements (Figure 2). This division of data seen in Braeburn and Gala are not due to differences between year, tree or canopy zones. The division is also seen in Cox indicate no differences between tree or canopy zone. There are no known biological differences between trees, including rootstocks, and since all trees were planted in the same orchard, in adjacent rows, they were exposed to the same environmental conditions and orchard management systems. We speculate there might be a latent variable segregating the data. Thus, we used starch proportion as the maturity indicator for the present study. The relationship between Streif and starch proportion appears to follow a logistic function (Figure 2), as the degradation of starch starts slowly, then increases rapidly as fruit matures.
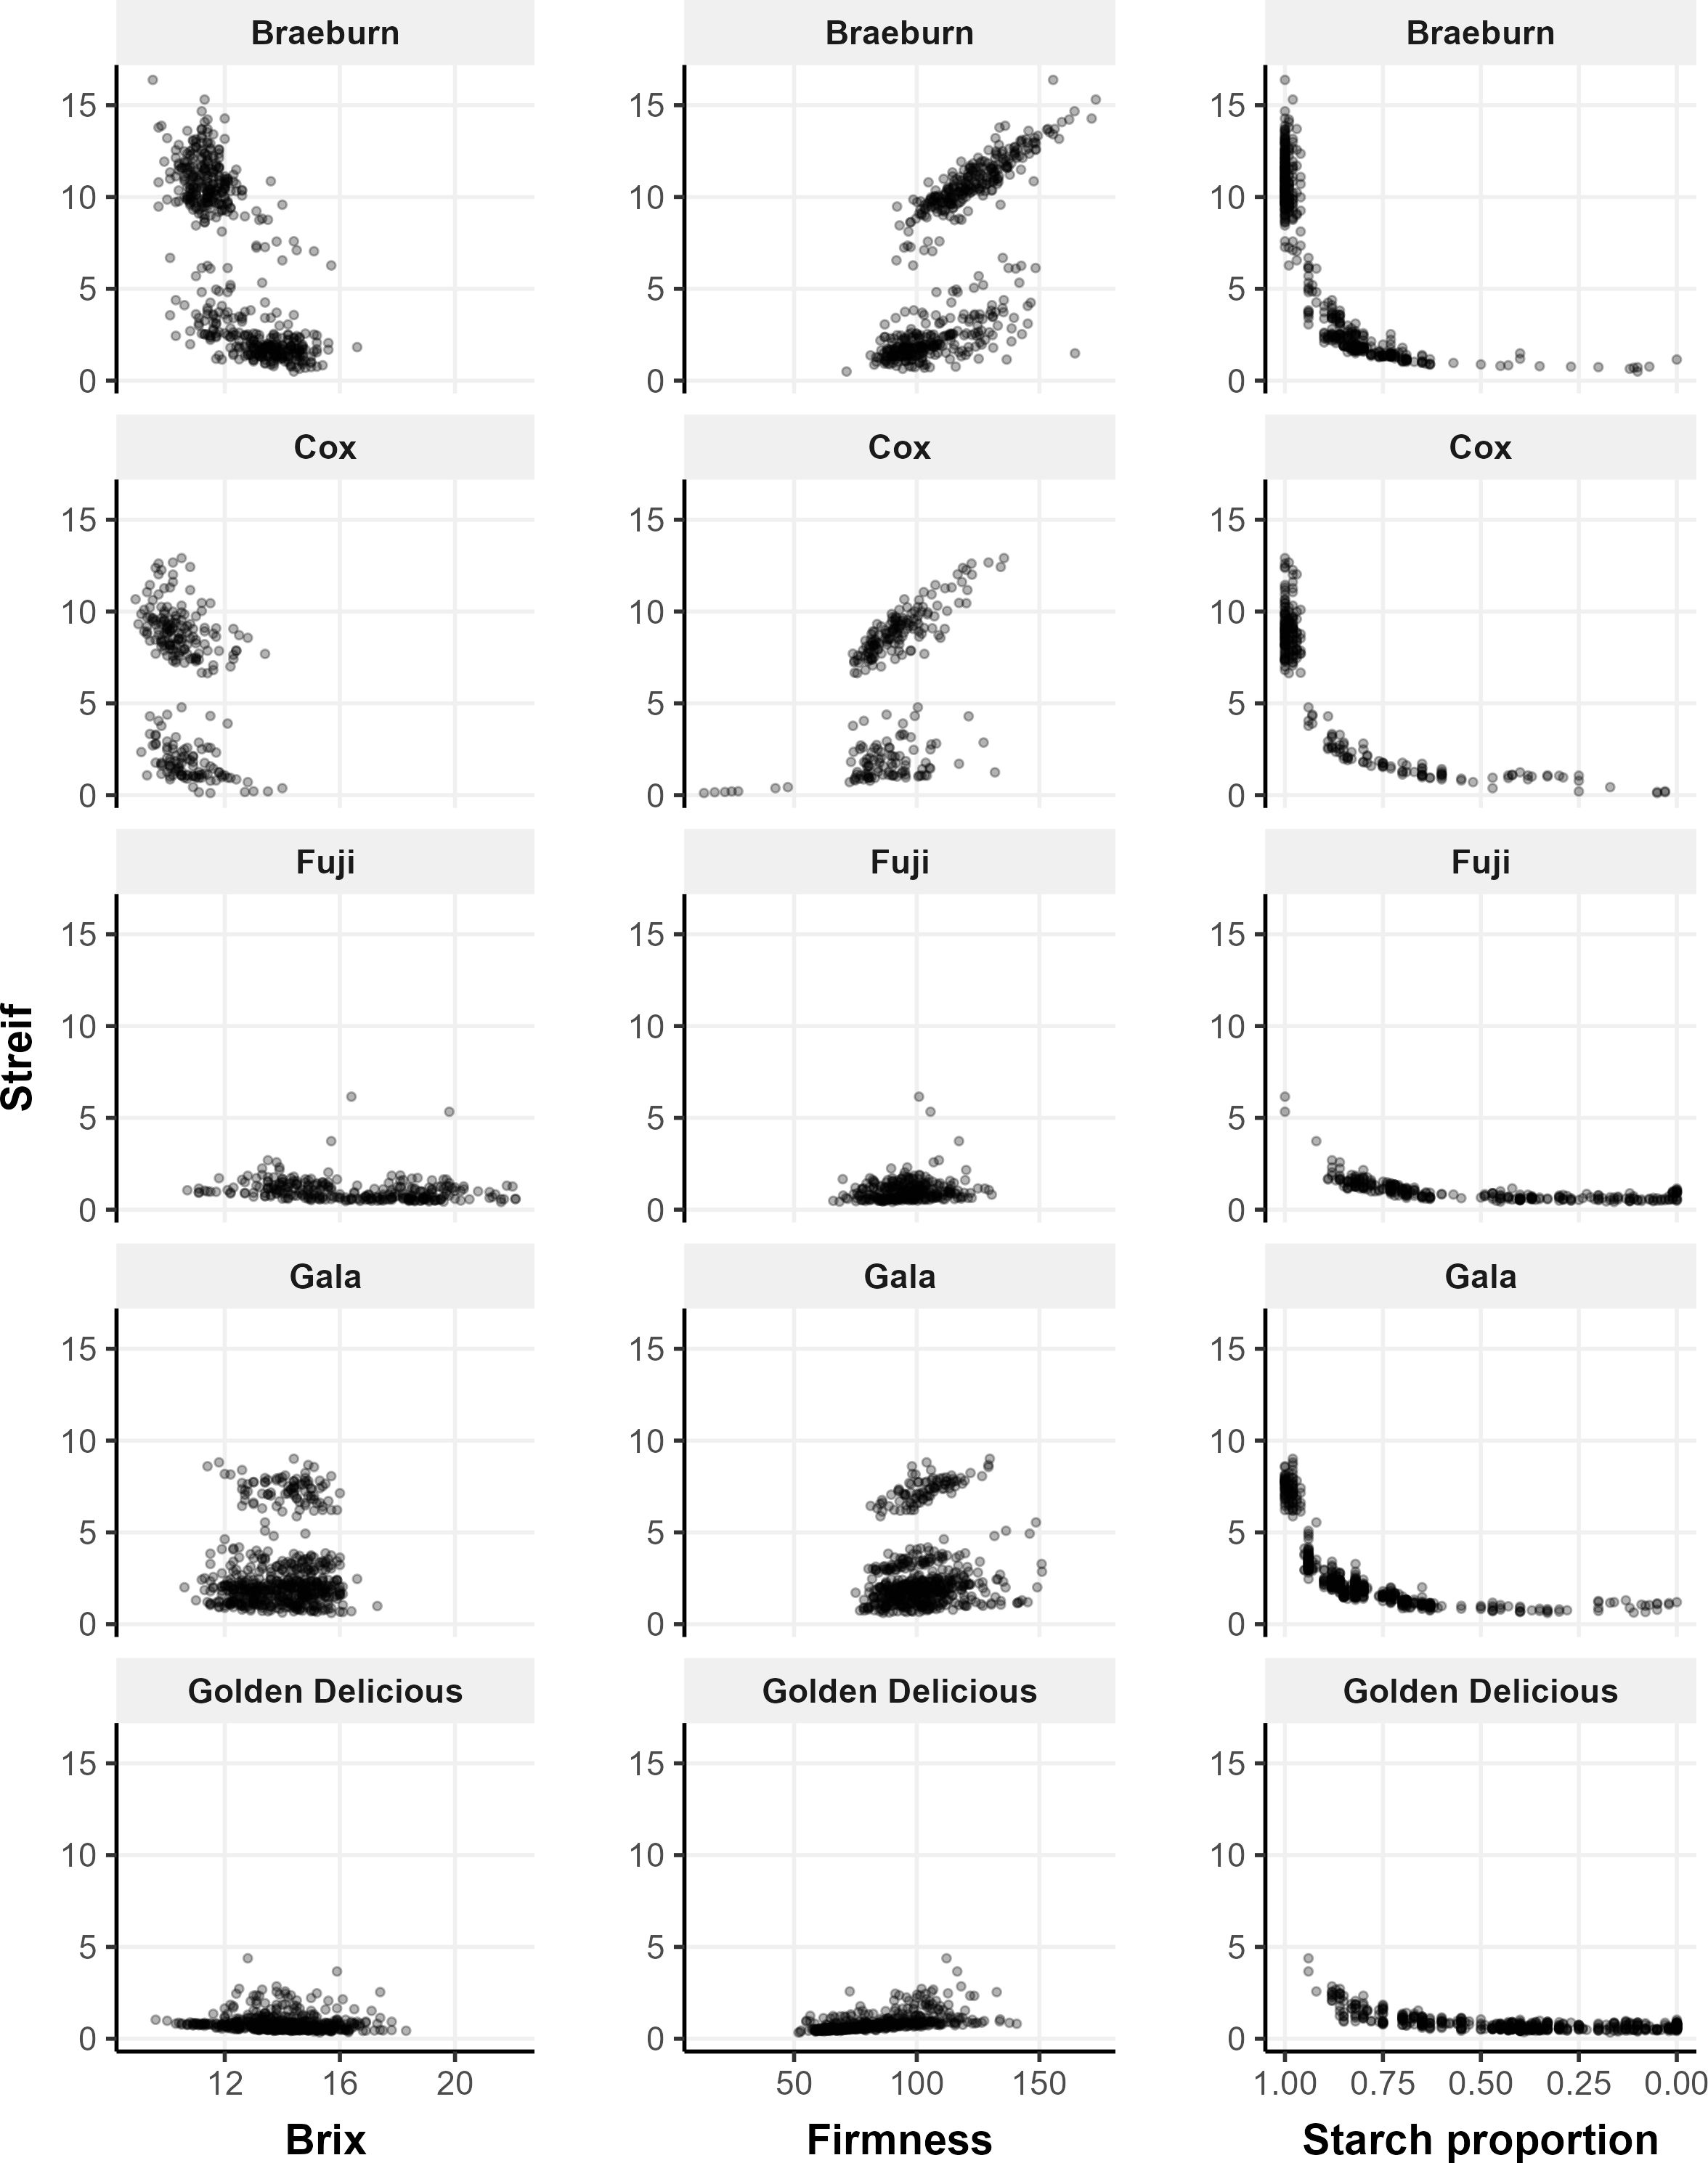
Figure 2. Strief vs Brix, firmness and starch measurements of all apple cultivars collected in 2022 and 2023 from a single orchard. Note: Cox only produced fruit in 2023 and samples were collected from three trees per cultivar, except for Fuji which only had two.
3.3 Temperature-based fruit development
The correlation between calculated linear GDH and starch proportion had a maximum of 0.54 from Braeburn and a minimum of 0.22 from Fuji (Table 3). Golden Delicious and Fuji have the smallest correlation, have nearly identical parameters (Table 3) and hence temperature-growth rate relationship (Figure 3A). They have the highest optimum and critical temperatures. Gala has the smallest effective temperature range between 9.1 – 30°C, which may be compensated by the lowest optimal temperature (16.1°C). Braeburn and Cox have similar temperature-growth rate relationship (Figure 3A), but the parameters for Cox are 3°C lower than Braeburn for all three parameters.
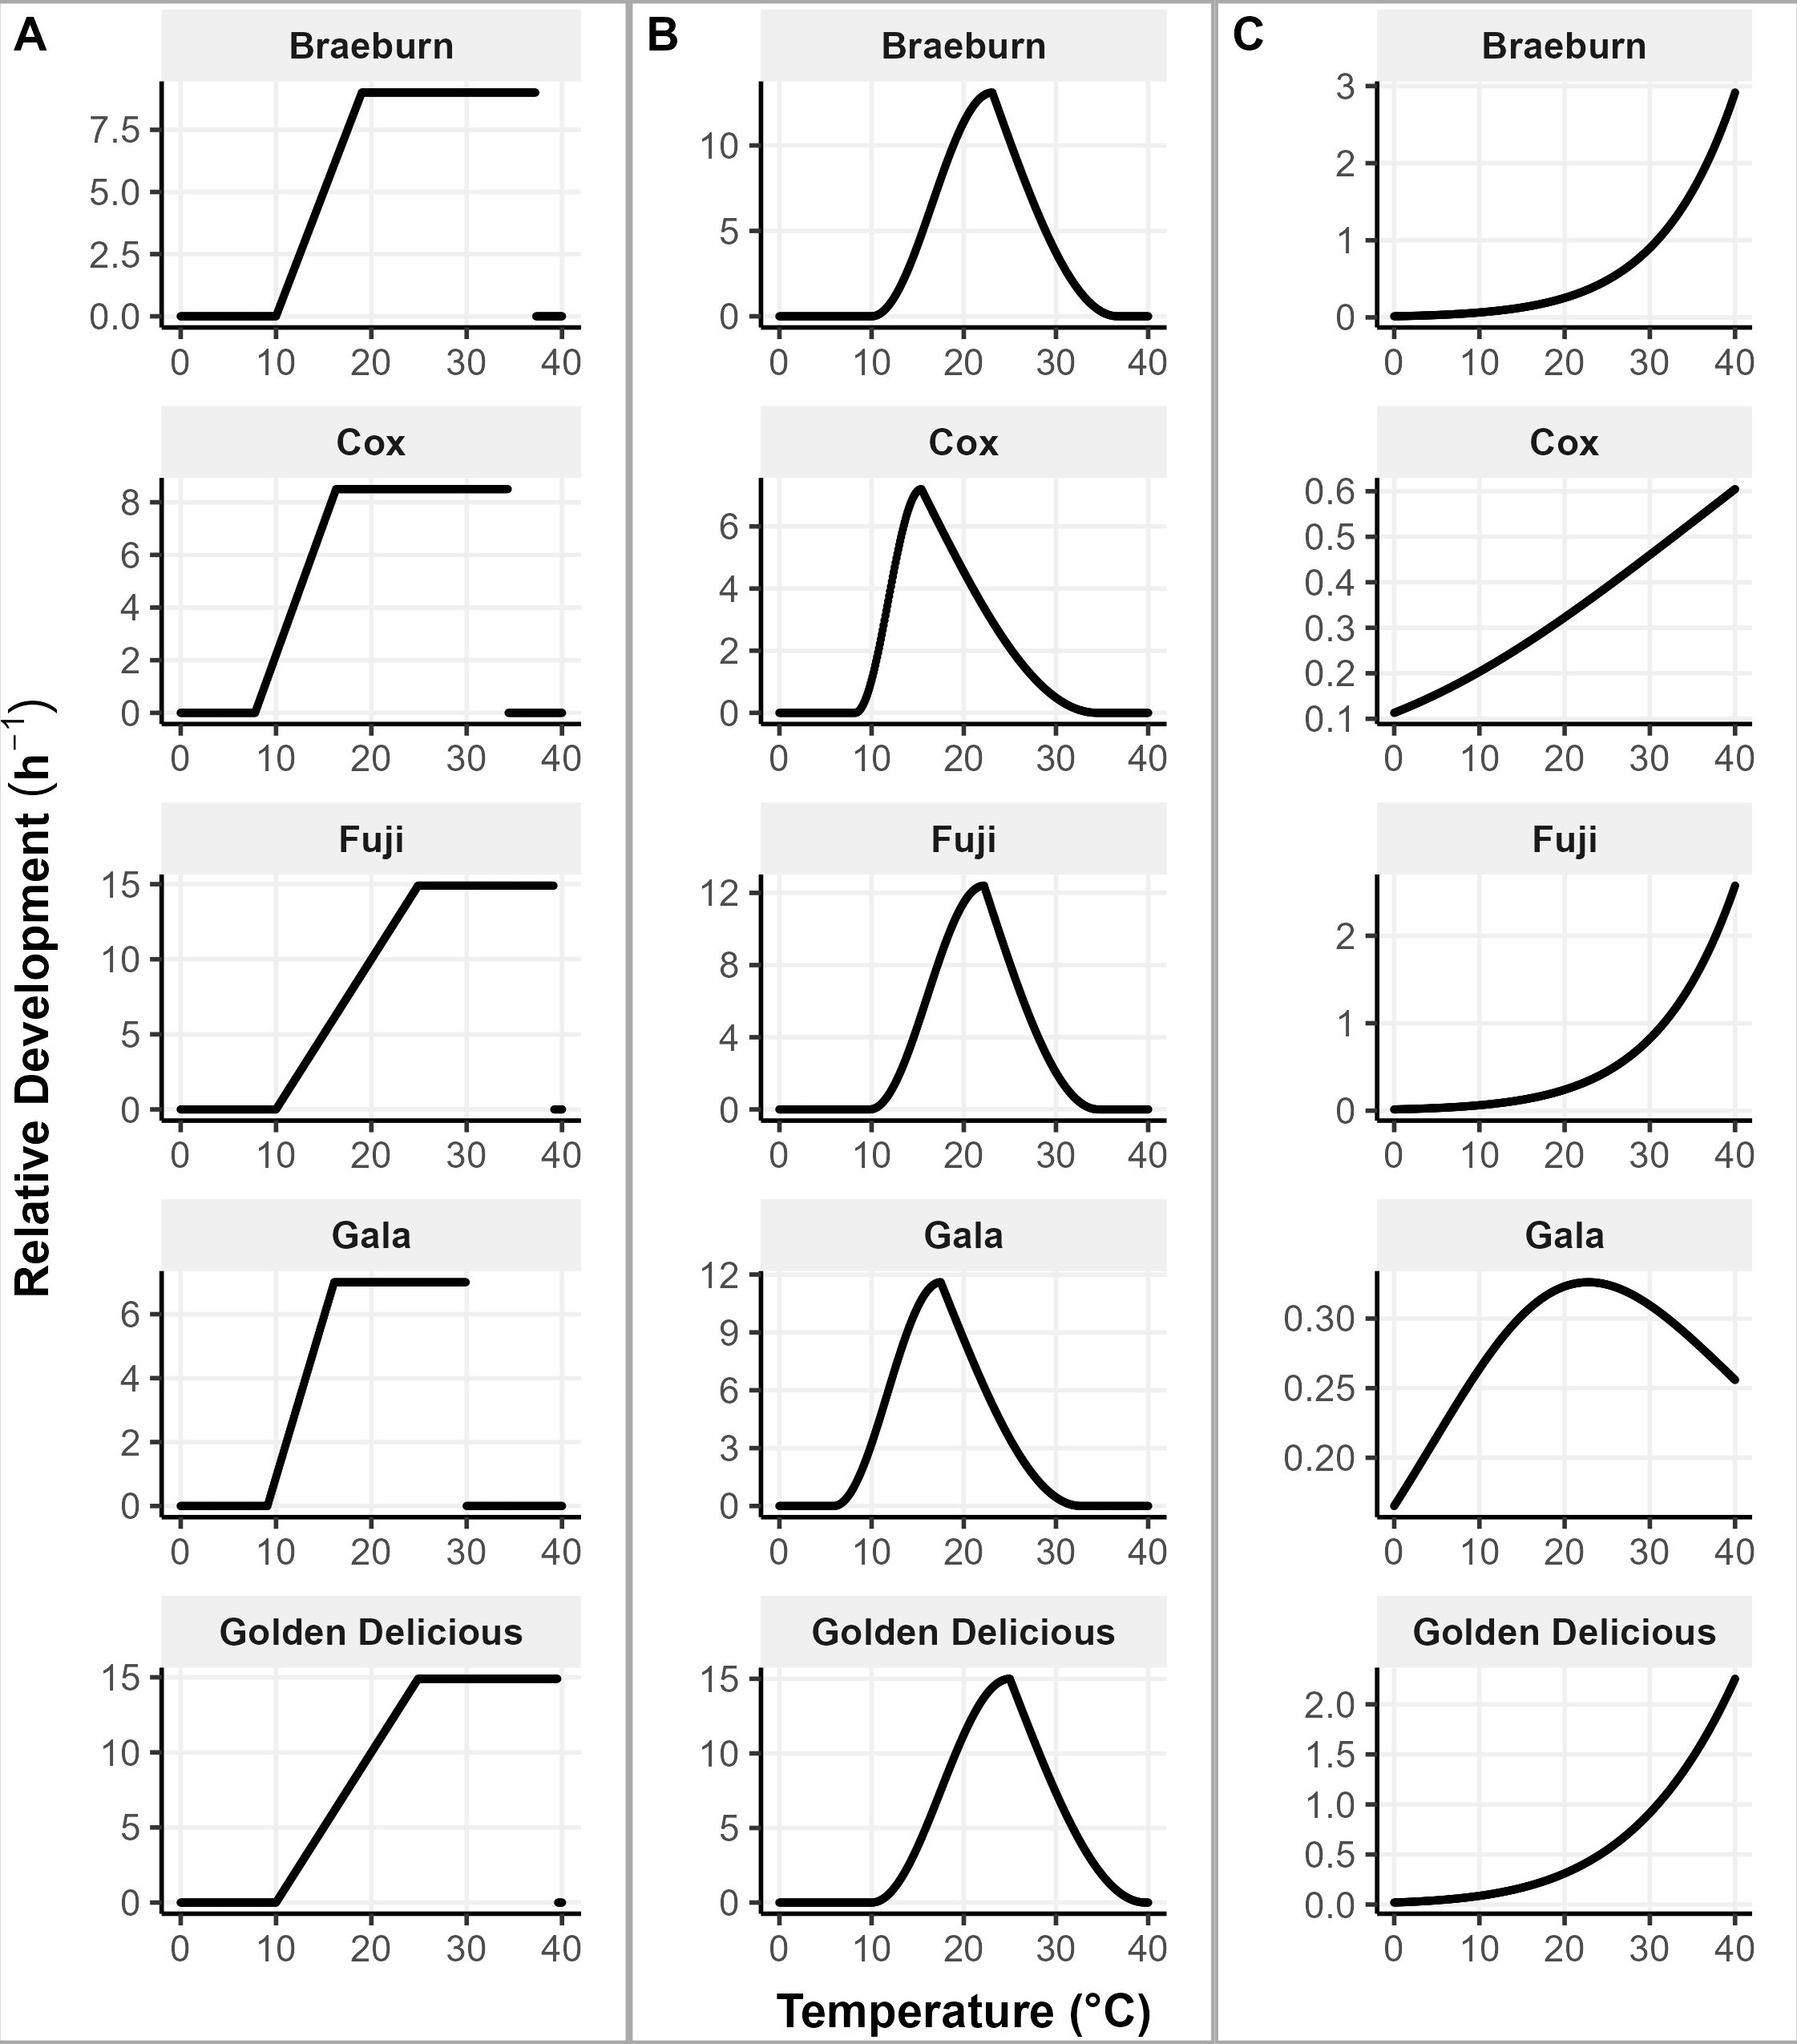
Figure 3. Growth rate of apple cultivars for hourly exposure to temperatures between 0 and 40°C using (A) linear GDH, (B) non-linear GDH and (C) Thermodynamic models.

Table 3. Linear growing degree hour model parameters estimated by the best correlation (Kendall’s Tau) to Starch.
For the non-linear GDH model, Braeburn has the highest correlation of 0.54. The least correlated is Fuji, with a weak negative correlation (Table 4). Fuji, Golden Delicious and Braeburn have similar temperature-growth rate relationship (Figure 3B). Their parameters vary slightly, with Fuji having lower temperature requirements and Golden Delicious being acceptive of high temperatures (Tc = 39.7°C). The critical temperature for Gala is the lowest of the five cultivars. Gala and Cox have low base temperature values (5.9 and 8.2°C, respectively).
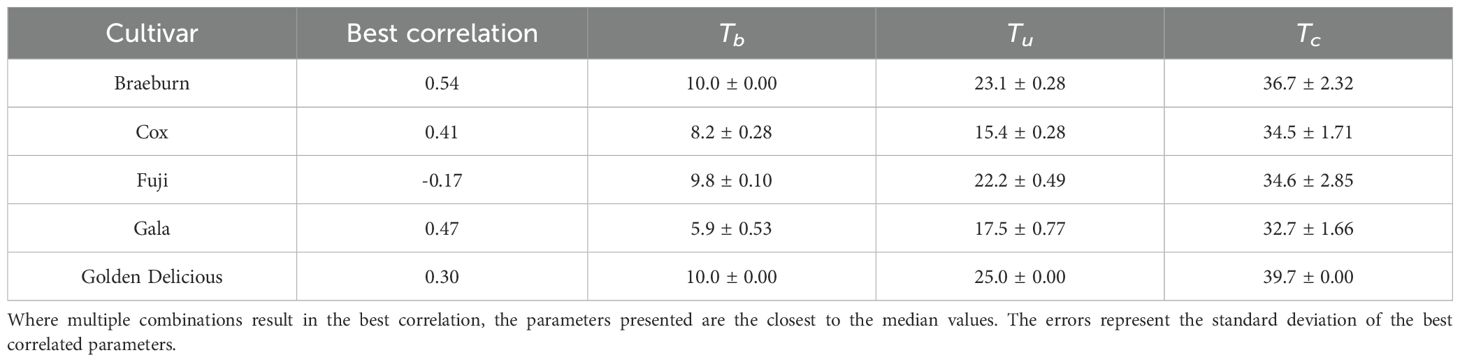
Table 4. Non-linear growing degree hour model parameters estimated by the best correlation (Kendall’s Tau) to Starch.
The temperature-growth rate relationship as modeled by the Thermodynamic model for Braeburn, Fuji and Golden Delicious are similar (Table 5, Figure 3C). They all follow an exponential pattern, suggesting their maximum growth rate has not been reached at 40°C. Similarly, Cox has also not reached its maximum growth rate 40°C, but its growth rate appears to be almost linearly related to temperature. In contrast, the maximum growth rate for Gala is at 22°C. The estimated relative growth rate at 22°C were similar for all cultivars.
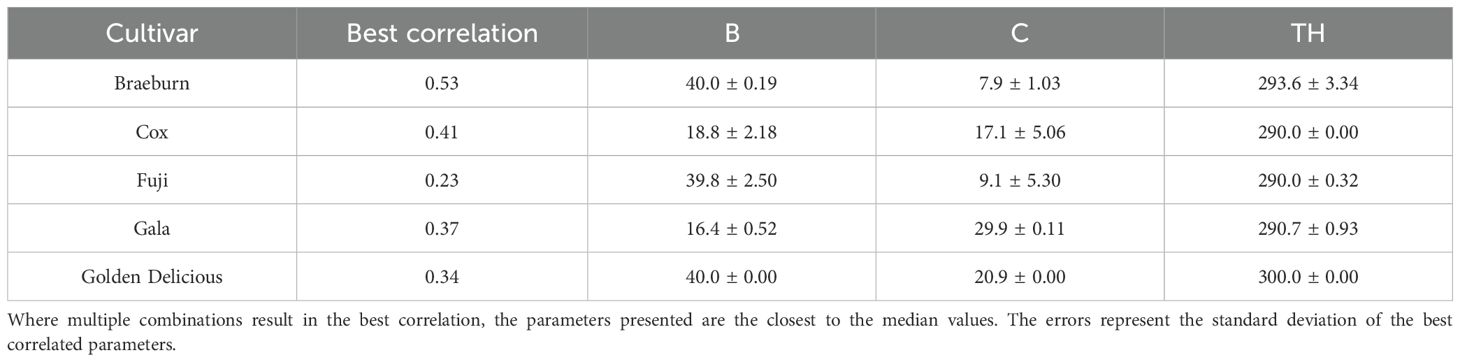
Table 5. Thermodynamic model parameters estimated by the best correlation (Kendall’s Tau) to Starch.
As expected, there is a negative correlation between the proportion of starch and accumulated growth unit for all three growth models —linear GDH (Figure 4A), non-linear GDH (Figure 4B) and Thermodynamic (Figure 4C) models. For Braeburn, Cox and Gala, the relationship follows a logistic shape as starch proportion does not change significantly in the early stages of development, but rapidly degrades after accumulation of certain growth units (Figure 4). The difference in the trend between years is consistent with the observed relationship of temperature accumulation with maturity: harvesting fruit appeared to be too early in 2023. For Golden Delicious, proportion of starch appears to decrease linearly with increasing accumulated growth units for all three models. The correlation between maturity and relative growth rates for Fuji apples were consistently the lowest (Tables 3-5), this is reflected by the weak trends observed for Fuji (Figure 4). The calculated accumulated growth units were higher in 2023 than in 2022 for linear GDH and Thermodynamic models, but the opposite was true for the non-linear model (Figure 4). This change in the accumulated growth units does not occur in the other four cultivars.
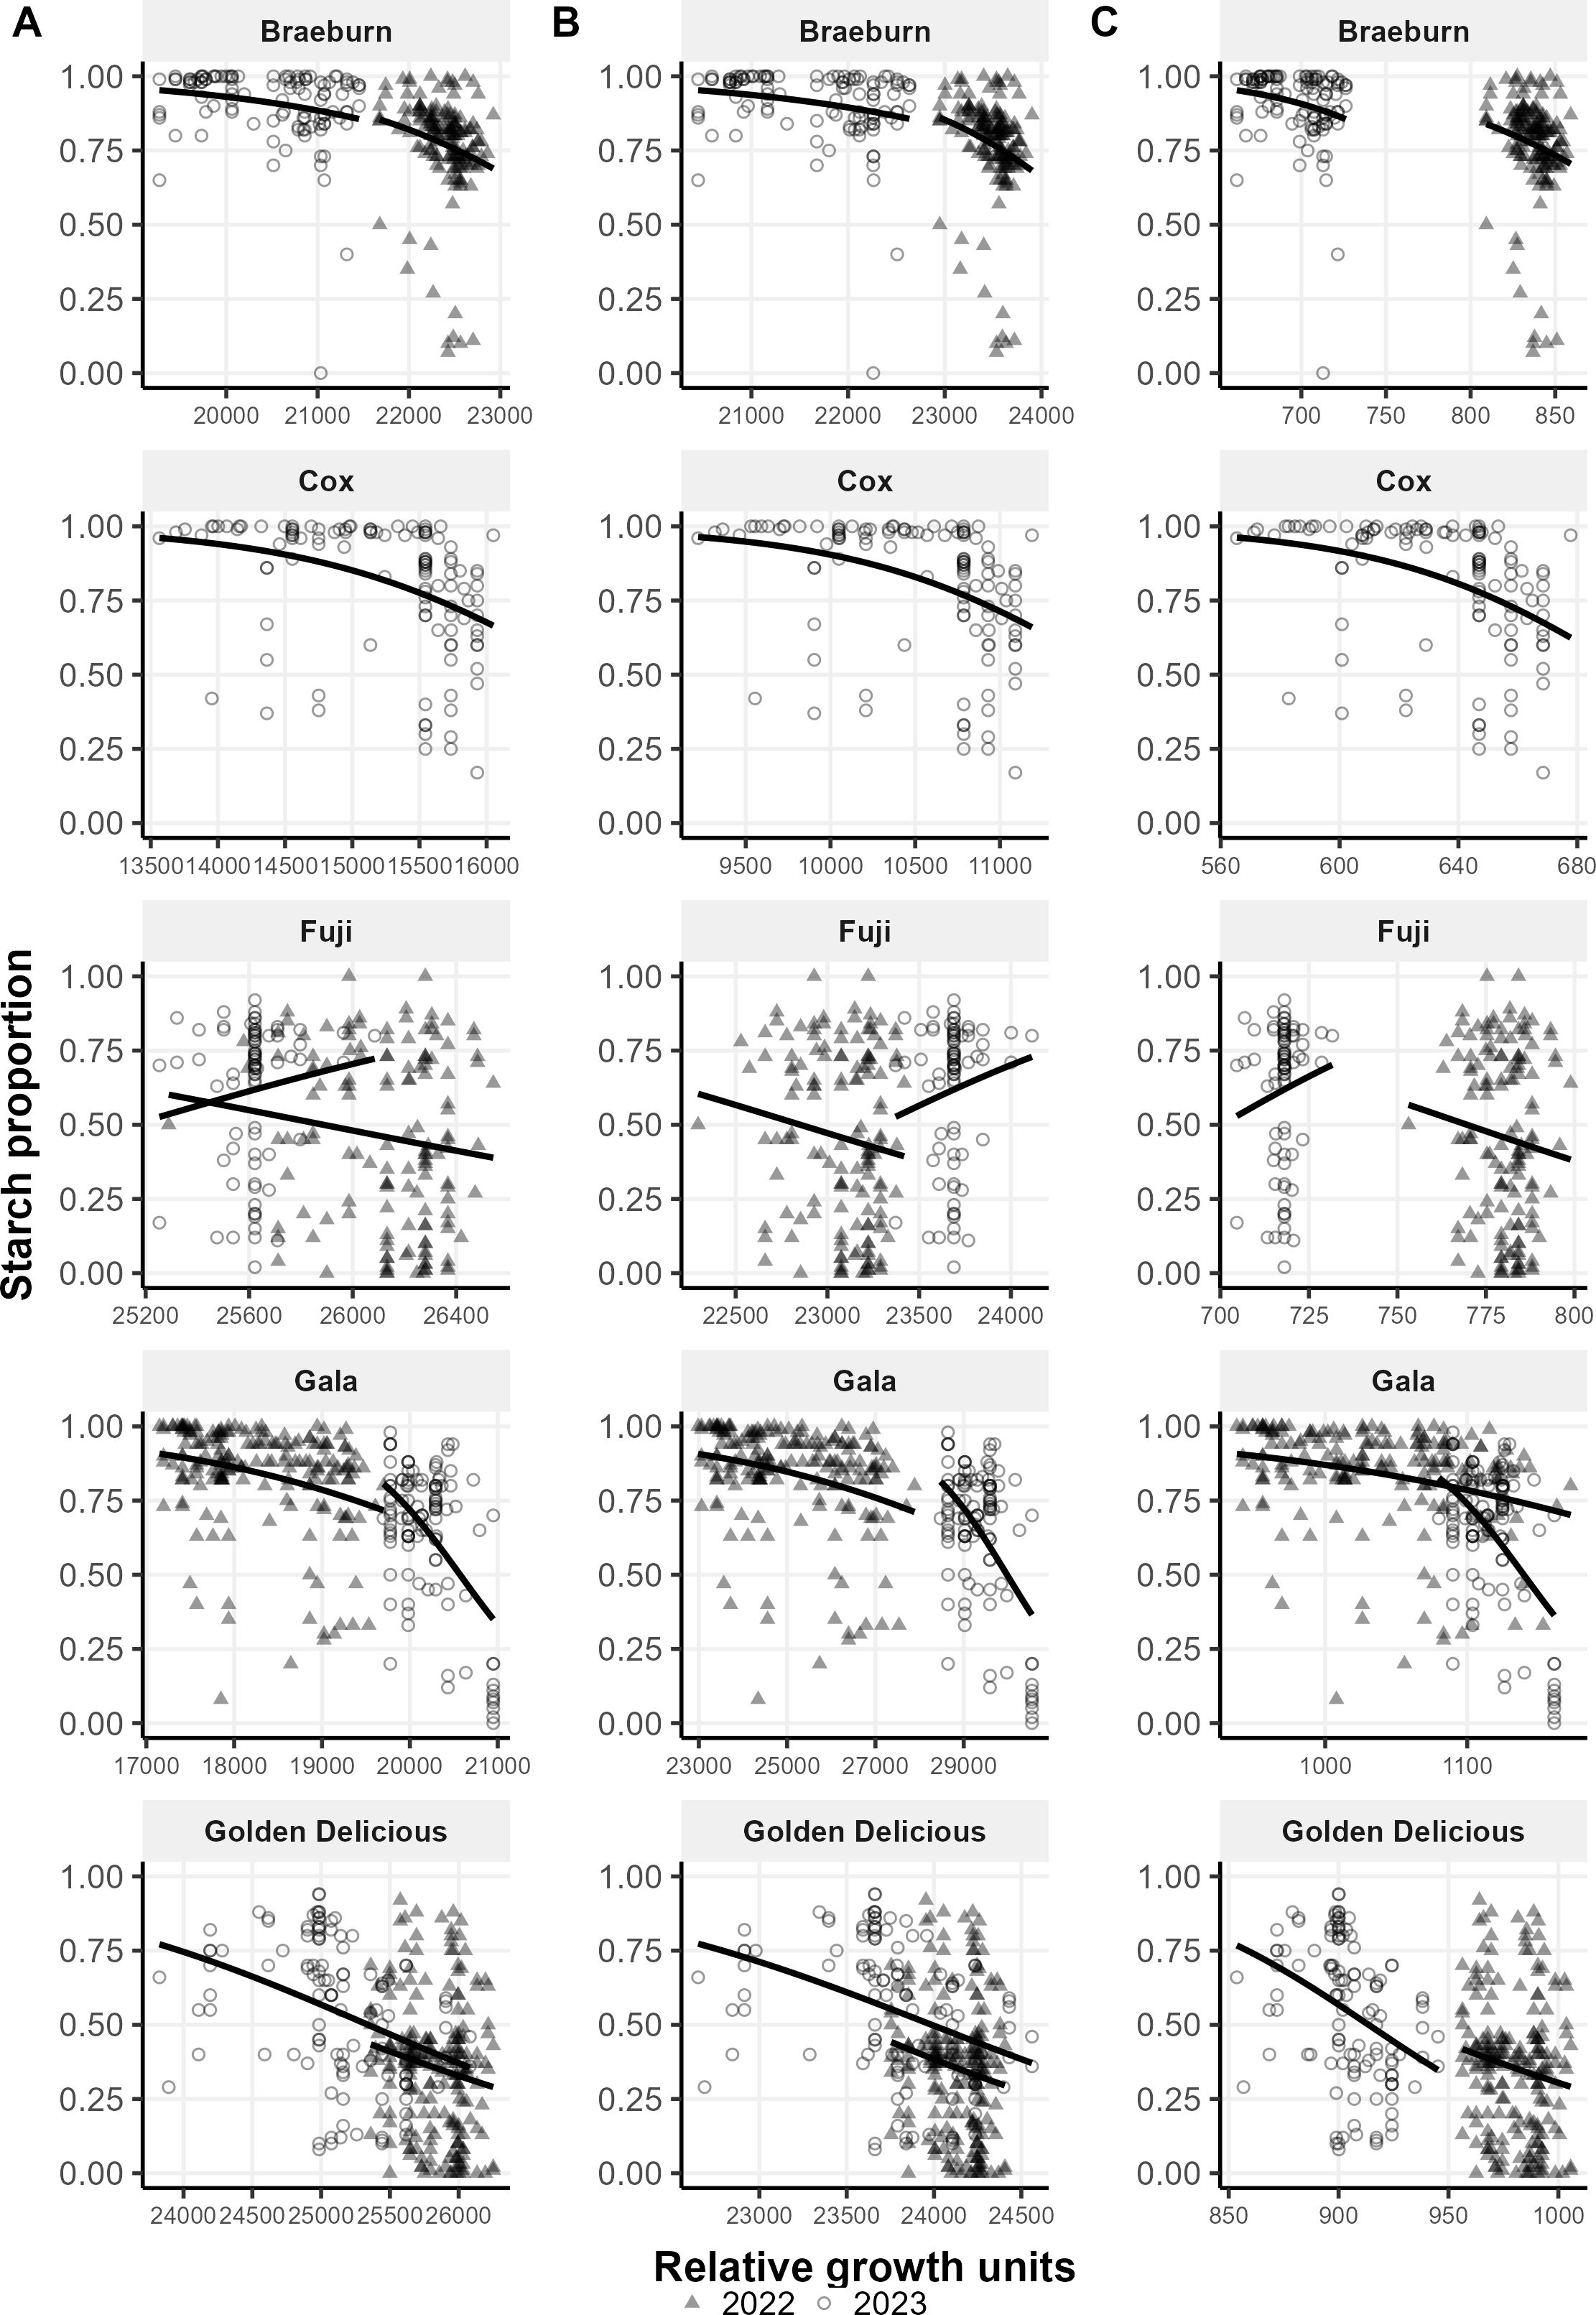
Figure 4. Proportion of starch (1 – immature and 0 – mature) against relative growth units calculated using (A) linear Growing Degree Hours, (B) non-linear Growing Degrees Hours and (C) Thermodynamic model for each apple cultivar across 2 years. The trend lines show the trends of the values from 2022 and 2023 for each cultivar on each model.
3.4 Factors contributing to maturity variation
Table 6 shows the summary of deviance in the fruit maturity (SPI) attributable to individual factors for individual cultivars. Comparing the deviance explained by the accumulated growth units across the three temperature growth models, the linear GDH model is the most effective for Gala (14.71%), the non-linear GDH model suits Braeburn, explaining 3.37%, and the Thermodynamic model works best for Cox (19.68%) and Golden Delicious (6.76%). However, it should be noted that the deviance attributable to the accumulated growth units was very similar among the three models (Table 6). The effect of accumulated growth units is not always statistically significant; only the linear GDH model for Braeburn (2.88%) and Gala (14.71%), non-linear GDH model for Braeburn (3.37%) and Thermodynamic model for Golden Delicious (6.76%) were statistically significant. For Fuji, < 1% of deviance in proportion of starch was explained by accumulated growth units (Table 6).
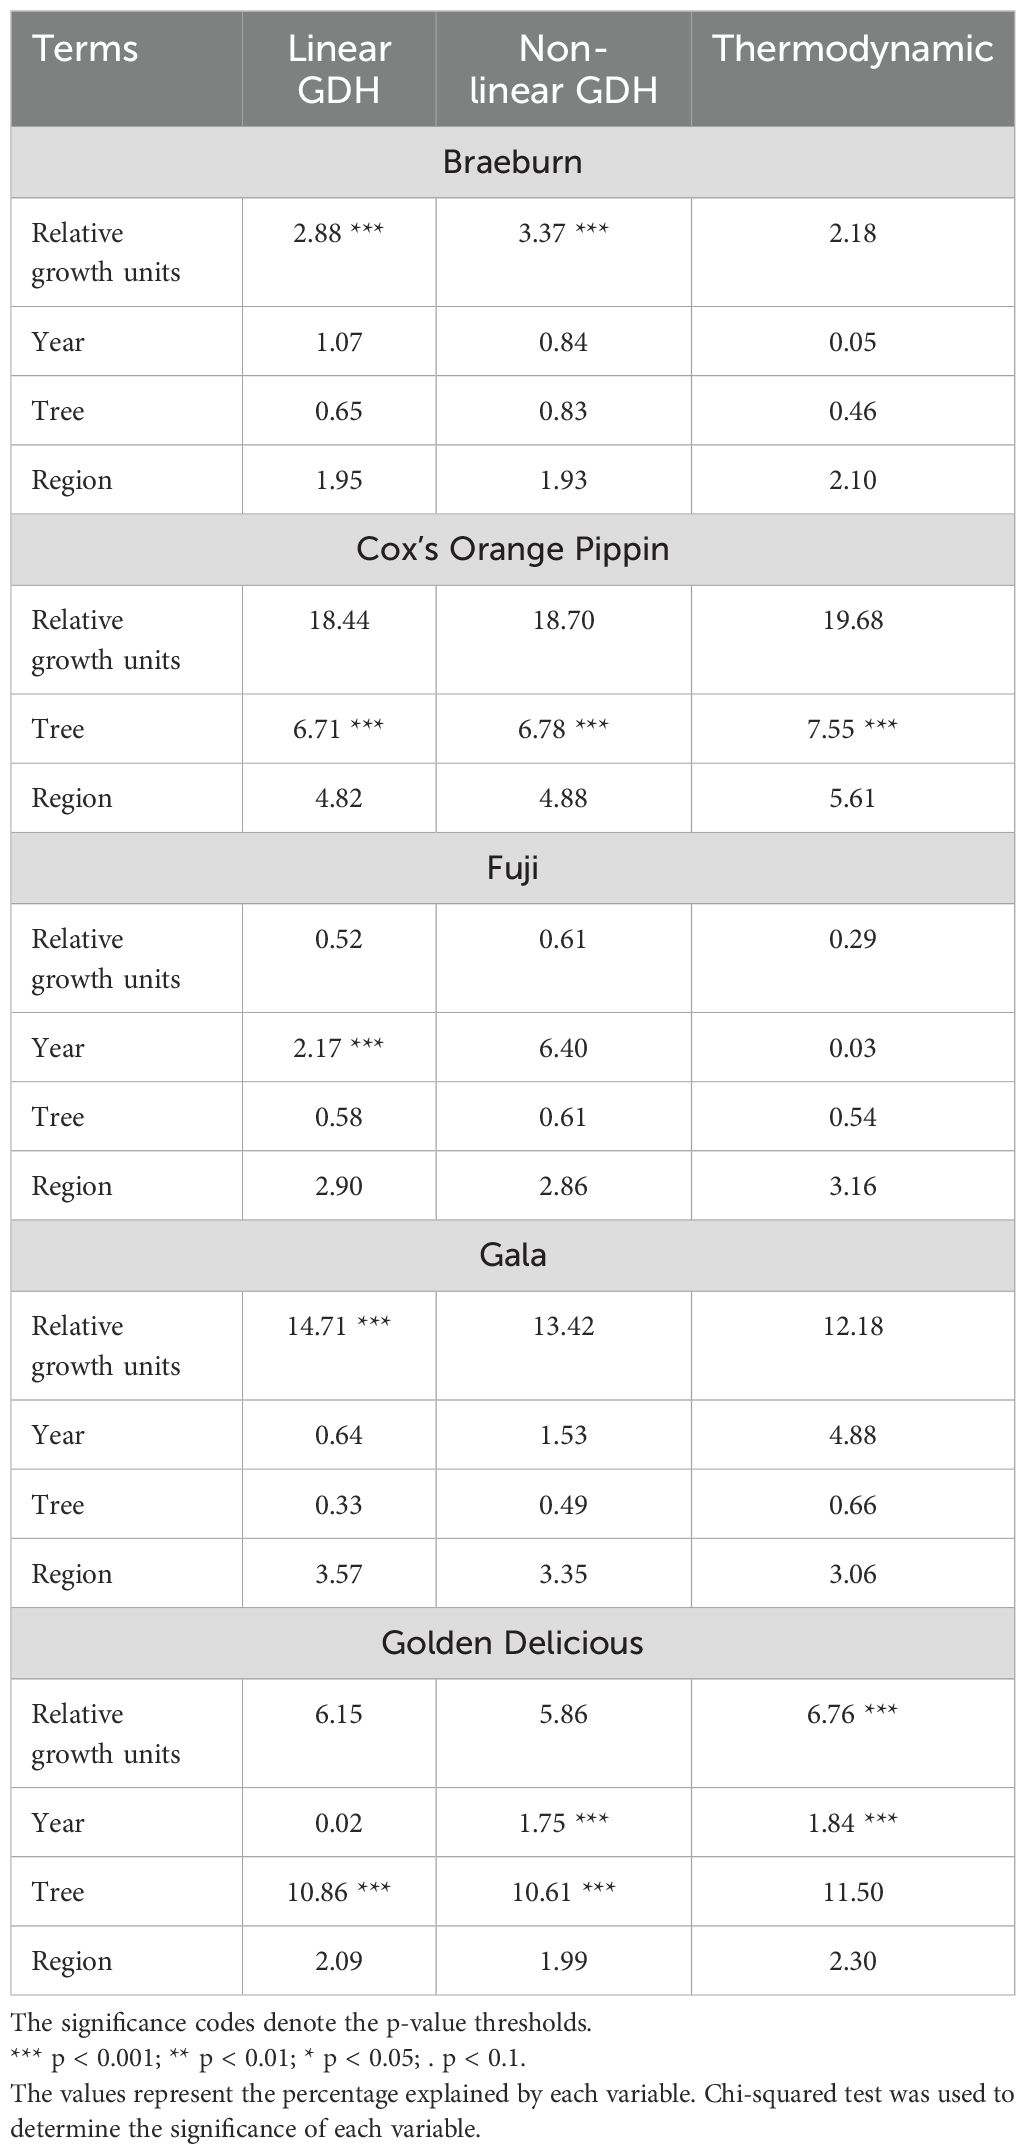
Table 6. The percentage of the total variation explained by the linear GDH, non-linear GDH and Thermodynamic models for all cultivars.
Some of the differences between the two seasons are expected to be accounted for by the accumulated growth units. The year effect did not contribute much to the deviance in proportion of starch for Braeburn or Gala, but it did affect proportion of starch significantly for Fuji with the linear GDH model (2.17%) and Golden Delicious with the non-linear GDH (1.75%) and Thermodynamic models (1.84%).
Differences between individual trees did not significantly affect proportion of starch for Braeburn, Fuji and Gala. In contrast, for Cox’s Orange Pippin, tree effects were highly significant for all growth models, contributing 6.71%, 6.75% and 7.55% of deviance in the linear GDH, non-linear GDH and Thermodynamic models, respectively. For Golden Delicious, tree effects were significant for the linear and non-linear GDH models (Table 6).
The regions within the canopy contributed to less than 6% of the deviance in the observed proportion of starch, none of which was statistically significant.
4 Discussion
4.1 Harvest predictions and flowering effect
Flowering can occur in a quick burst or a longer span of time depending on the temperatures in the season. Harvest prediction models commonly use the average flowering date to predict a single harvest date, thus ignoring tree-to-tree and within-tree fruit-to-fruit flowering time. The present research assessed whether the within-orchard variation in flowering time can impact fruit maturity at harvest and hence predicted harvest dates. The present research showed that within-orchard flowering time accounted for 2-20% of the variability in fruit maturity (as represented by proportion of starch in fruit), depending on cultivars.
In the present study, different apple cultivars had flowering differences of about 10 days, with the within cultivar variation of about 10 to 22 days. This difference in within-cultivar flowering time led to differences in accumulated growth units among individual fruit. Since temperature was usually much lower around the flowering time, the impact of this difference is thus expected to depend on the temperature-based growth relationship. We observed that the variation due to flowering time is less than 5% for Braeburn, Fuji and Golden Delicious, but can be much higher in Cox’s Orange Pippin (18.4-19.7%) and Gala (12.2-14.7%). Since the difference in flowering time is relatively small even when temperature was usually low in the spring this shows that incorporating fine-resolution flowering time may improve the accuracies in predicting the harvest window.
An unexpected linear trend was observed only for Golden Delicious. This could be due to a lack of immature Golden Delicious (namely with close to 100% starch), so we can only observe the stage in development where proportion of starch is reducing at a linear rate. Of course, unlike the other cultivars, Golden Delicious may indeed lose starch at a linear rate with accumulated growth units. Fuji consistently resulted in low correlation between starch and maturity. We deduce that Fuji may mature differently than the other cultivars, and that Fuji may not depend on temperature as much as other apple cultivars. Another possibility for the lack of temperature relationship for Fuji is the low variability in flowering time, particularly in 2023 with zero interquartile range. The loss of one tree in an already limited number of biological replicates may have compromised the statistical power in our study. Overall, this study should be replicated with a greater number of trees per cultivar to ensure that the results are accurate and reproducible.
4.2 Year, tree, region and cultivar effects on maturity variation
Year, tree and canopy region accounted for a small proportion of the observed variability in the proportion of starch after the accumulated growth unit was included in the model. For the year factor, there still appears to be some significant effects, depending on the cultivar. The effect of year on Fuji, with the linear GDH model, and Golden Delicious, with the non-linear GDH and Thermodynamic models were significant, albeit accounting for < 2% of the deviance. We assume that this year-to-year effect could be due to differences in the solar radiation intensity since the temperature effects were accounted for by the accumulated growth units. Further data on multiple years across multiple locations with large differences in solar radiation are required to assess the potential effect of solar radiation on fruit development. A better understanding might be gained by using a commercial orchard as the apple trees used in the study are not commercially thinned each year. The consequences of not thinning fruit include non-uniform fruit, and biennial cropping: less fruit after a season of heavy crop (Musacchi and Serra, 2018).
The effect of canopy region was insignificant for all cultivars. This result is inconsistent with previous findings (Robinson et al., 1983; Hamadziripi et al., 2014; Kalcsits et al., 2019; Kviklys et al., 2022). Most likely, this difference is due to the fact that our trees are small relative to conventional orchard trees; thus, there was no significant difference in shading between fruit in different zones of the same tree. In the present research, we used the proportion of starch as the maturity indicator; but previous studies focused on soluble sugars and firmness. Different maturity indicators may thus also account for the differences in the canopy effects.
It was surprising to observe the significant effects of individual neighboring trees on proportion of starch for Cox and Golden Delicious. As the trees were in proximity and exposed to the same biological and environmental conditions, it is difficult to explain such significant effects. One possible explanation could be that the number of fruit varied greatly among trees (hence possibly more variability in fruit development), which may affect fruit development in the same season and the following season (as these trees were not thinned) (Musacchi and Serra, 2018).
4.3 Evaluation of linear GDH, non-linear GDH and Thermodynamic models
In the present study, we did not use complicated optimization algorithm to estimate model parameters. Instead, we used a simple grid search approach to search a set of parameters that maximize the correlation of the estimated accumulated growth units and the observed proportion of starch. This simple approach will not be able to resolve non-converging issues often encountered in fitting complex nonlinear models. We used this approach for two reasons. Firstly, nearly all parameters are related to minimum, optimal and maximum temperature for fruit development. For these parameters, there is a well-defined range based on biological intuition. Secondly, the present study focuses on the relative effect of flowering time (as represented by temperature effects) and other factors on fruit maturity, not the precise parameter values. By ensuring the parameter values maximize the correlation, we expected to capture the maximum effects of flowering time (temperature model) on fruit development within our defined search limits. In our study, our maximum correlation was 0.54 for linear and non-linear GDH models on Braeburn, this is similar to values from a previous study by Sugiura et al. (2023), where their absolute correlation of their linear model was 0.56 in field studies. This gives us confidence that our models are appropriate for our study.
We expected the optimal growth temperatures to be within 15-30°C, similar to values found in Tang et al. (2024) and Luedeling et al. (2021), but optimal growth rates have not been determined by the Thermodynamic model, even at 40°C, except for Gala (Figure 3C). Optimal temperatures above 40°C are unrealistic, and we expect a detrimental effect on most biological functions when temperatures exceed the realistic optimal temperature range (Al-Whaibi, 2011). Although optimal growth temperatures were not identified, since it is likely that temperature fluctuations during the growth season range from 10-30°C, the effective growth for each cultivar modeled by the Thermodynamic model is similar to the other two models. The temperature rates were more biologically sound for the linear and non-linear GDH. However, it should be noted the linear GDH model is actually non-linear, consisting of two lines that join at the optimal temperature. There is no definitive rationale for preferring one GDH model over the other. The order of maximum relative development rates suggested by the non-linear GDH model follows the order of maturation of cultivars (Figure 2); Cox’s Orange Pippin matures earliest in the season, followed by Braeburn, Gala, Golden Delicious and Fuji. This makes biological sense, as a faster rate of development suggests a shorter development period is required. Moreover, the non-linear GDH model tends to explain more variation than the linear GDH model for most cultivars.
Commonly, when using the GDH model, the base temperature is set to 4.5°C, as per the original model (Anderson et al., 1985). We explored the limits for the base temperature between 0 to 10°C since flowering was observed in the spring when temperatures were usually less than 10°C and we did not expect growth below 0°C. In the linear GDH model, the base temperatures were 7.8°C for Cox, 9.1°C for Gala, and 10°C for Braeburn, Fuji and Golden Delicious. The non-linear GDH model had base temperatures of 10°C for Braeburn and Golden Delicious, 8.2°C for Cox, 9.8°C for Fuji and 5.9°C for Gala. Growing degree day models and their variants used similar base temperatures at 10°C (Blanpied, 1982) or higher (Perry et al., 1987). However, papers which fitted model parameters (Luedeling et al., 2021; Tang et al., 2024) or tested a series of base temperatures (Lysiak, 2012) found lower base temperatures (between 0 to 4°C) than observed in our study.
4.4 Assumptions and limitations
The maturity parameter used in this study was the proportion of starch. Previous studies indicated that maturity cannot be represented by a single variable. Our findings showed a latent variable present in our Streif measurements (Figure 3). Therefore for this study, we must assume that starch proportion is an adequate measure of maturity despite it being a highly subjective assessment. Considering that each of the fitted models only explained up to 20% of the variability in fruit maturity, there is still a large amount of unexplained variance. We can assume that everything else is due to random variability or that starch is not the best reflection of maturity. Physical assessments of fruit quality are therefore still required closer to the harvest window.
The authors acknowledge that flowering date and pollination date may not be the same. However, for the purpose of this study, we assume that flowers are pollinated when the flowers are fully open. Apple flowers are typically insect-pollinated but pollinators may not always be present (in abundance) in the orchard, so we cannot guarantee that the flowers were pollinated on the bloom date. This would introduce a level of error in GDH calculations.
4.5 Implementations
Changes in the climate can affect the duration of flowering time, and therefore, the downstream harvest window. Growers can more accurately predict the harvest window, particularly the duration of the harvest window, when accounting for the variation in flowering time. This can reduce the noise for harvest window predictions. Knowing the duration of the harvest window will help orchard management during the harvest season. Our results show there is still a large amount of variation unexplained, therefore it is essential to assess the fruit close to the predicted harvest date, whether by destructive fruit assessments or by non-destructive methods.
5 Conclusion
The variation of maturity can be effectively quantified by either the linear or non-linear GDH models. The effect of flowering variation varies depending on the cultivar; the effect is small for Braeburn and Golden Delicious, but large for Cox’s Orange Pippin and Gala. No flowering effect was found for Fuji. Considering these variations are induced within a 2-to-3-week period, flowering time is a significant contributor to maturity variation at harvest. Of the factors: year, region and tree specimen, only year and tree were significant for some cultivars but they we suspect the effects were due to non-uniform fruit cropping. Proper orchard management could help resolve differences.
Data availability statement
The raw data supporting the conclusions of this article will be made available by the authors, without undue reservation.
Author contributions
HT: Conceptualization, Data curation, Formal analysis, Methodology, Visualization, Writing – original draft, Writing – review & editing. XZ: Supervision, Writing – review & editing. XX: Funding acquisition, Supervision, Writing – review & editing.
Funding
The author(s) declare that financial support was received for the research and/or publication of this article. The research is funded by the UK Biotechnology and Biological Sciences Research Council (grant number: BB/W510762/1).
Acknowledgments
Thank you to Tom Passey, Jennifer Kingsnorth and Kirsty Malpas for helping with flower tagging and post-harvest assessments and to Karen Jones for helping with harvest day logistics. The authors acknowledge Research Computing at the James Hutton Institute for providing computational resources and technical support for the “UK’s Crop Diversity Bioinformatics HPC” (BBSRC grants BB/S019669/1 and BB/X019683/1), use of which has contributed to the results reported within this paper.
Conflict of interest
The authors declare that the research was conducted in the absence of any commercial or financial relationships that could be construed as a potential conflict of interest.
The author(s) declared that they were an editorial board member of Frontiers, at the time of submission. This had no impact on the peer review process and the final decision.
Generative AI statement
The author(s) declare that no Generative AI was used in the creation of this manuscript.
Publisher’s note
All claims expressed in this article are solely those of the authors and do not necessarily represent those of their affiliated organizations, or those of the publisher, the editors and the reviewers. Any product that may be evaluated in this article, or claim that may be made by its manufacturer, is not guaranteed or endorsed by the publisher.
References
Abeles F. B. and Lightner G. W. (1984). Optimal harvest date equations for west virginia apples. HortScience 19, 429–430. doi: 10.21273/HORTSCI.19.3.429
Al-Whaibi M. H. (2011). Plant heat-shock proteins: a mini review. J. King Saud Univ. Sci. 23, 139–150. doi: 10.1016/j.jksus.2010.06.022
Anderson J. L., Richardson E. A., and Kesner C. D. (1985). Validation of chill unit and flower bud phenology models for’montmorency’sour cherry. I International Symposium on Computer Modelling in Fruit Research and Orchard Management 184, 71–78. doi: 10.17660/actahortic.1986.184.7
Anderson J. L. and Seeley S. D. (1992). Modelling strategy in pomology: Development of the utah models. III International Symposium on Computer Modelling in Fruit Research and Orchard Management 313, 297–306. doi: 10.17660/actahortic.1986.184.7
Argenta L. C., Wood R. M., Mattheis J. P., Thewes F. R., Nesi C. N., and Neuwald D. A. (2023). Factors affecting development of disorders expressed after storage of ‘gala’apple fruit. Postharvest Biol. Technol. 204, 112439. doi: 10.1016/j.postharvbio.2023.112439
Blanpied G. D. (1964). The relationship between growing season temperatures, bloom dates and the length of the growing season of red delicious apples in north america. Proc. Amer. Soc. Hort. Sci. 84, 72–81.
Blanpied G. D. (1982). Observations of the ripening and harvest indices at commercial harvest dates of ‘delicious’ apple at its extreme northern latitudes1. HortScience 17, 783–785. doi: 10.21273/HORTSCI.17.5.783
Blanpied G. D. and Ben-David S. (1970). A new york study of ‘mcintosh’apple optimum harvest dates1. J. Am. Soc. Hortic. Sci. 95, 151–154. doi: 10.21273/JASHS.95.2.151
Blanpied G. D. and Silsby K. J. (1992). Predicting harvest date windows for apples. Cornell Cooperative Extension.
Drogoudi P. D. and Pantelidis G. (2011). Effects of position on canopy and harvest time on fruit physico-chemical and antioxidant properties in different apple cultivars. Scientia Hortic. 129, 752–760. doi: 10.1016/j.scienta.2011.05.036
Goncalves M. W., Argenta L. C., and Martin M. S. D. (2017). Maturity and quality of apple fruit durinig the harvest period at apple industry. Rev. Bras. Fruticultura 39, e–825. doi: 10.1590/0100-29452017825
Hamadziripi E. T., Theron K. I., Muller M., and Steyn W. J. (2014). Apple compositional and peel color differences resulting from canopy microclimate affect consumer preference for eating quality and appearance. HortScience 49, 384–392. doi: 10.21273/HORTSCI.49.3.384
Kalcsits L., Mattheis J., Giordani L., Reid M., and Mullin K. (2019). Fruit canopy positioning affects fruit calcium and potassium concentrations, disorder incidence, and fruit quality for ‘honeycrisp’ apple. Can. J. Plant Sci. 99, 761–771. doi: 10.1139/cjps-2019-0017
Knee M. and Smith S. M. (1989). Variation in quality of apple fruits stored after harvest on different dates. J. Hortic. Sci. 64, 413–419. doi: 10.1080/14620316.1989.11515972
Krishnaprakash M. S., Aravindaprasad B., Krishnaprasad C. A., Narasimham P., Ananthakrishna S. M., Dhanaraj S., et al. (1983). Effect of apple position on the tree on maturity and quality. J. Hortic. Sci. 58, 31–36. doi: 10.1080/00221589.1983.11515087
Kviklys D., Viškelis J., Liaudanskas M., Janulis V., Laužikė K., Samuolienė G., et al. (2022). Apple fruit growth and quality depend on the position in tree canopy. Plants 11, 196. doi: 10.3390/plants11020196, PMID: 35050084
Luedeling E., Schiffers K., Fohrmann T., and Urbach C. (2021). Phenoflex-an integrated model to predict spring phenology in temperate fruit trees. Agric. For. Meteorol. 307, 108491. doi: 10.1016/j.agrformet.2021.108491
Luton M. T. and Hamer P. J. C. (1983). Predicting the optimum harvest dates for apples using temperature and full-bloom records. J. Hortic. Sci. 58, 37–44. doi: 10.1080/00221589.1983.11515088
Lysiak G. (2012). The sum of active temperatures as a method of determining the optimum harvest date of’sampion’and’ligol’apple cultivars. Acta Scientiarum Polonorum. Hortorum Cultus11, 3–13. https:427//agro.icm.edu.pl/agro/element/bwmeta1.element.agro-a719922c-cf1c-47fe-993c-90607da92f1c
Magness J. R., Diehl H. C., and Haller M. H. (1926). Picking maturity of apples in relation to storage (Urbana-Champaign: US Department of Agriculture, University of Illinois).
Musacchi S. and Serra S. (2018). Apple fruit quality: Overview on pre-harvest factors. Scientia Hortic. 234, 409–430. doi: 10.1016/j.scienta.2017.12.057
Perry K. B., Blankenship S. M., and Unrath C. R. (1987). Predicting harvest date of ‘delicious’ and ‘golden delicious’ apples using heat unit accumulations. Agric. For. Meteorol. 39, 81–88. doi: 10.1016/0168-1923(87)90018-9
Richardson E. A., Seeley S. D., Walker D. R., Anderson J., and Ashcroft G. L. (1975). Phenoclimatography of spring peach bud development. HortScience 10, 236–237 doi: 10.21273/HORTSCI.10.3.236
Robinson T. L., Seeley E. J., and Barritt B. H. (1983). Effect of light environment and spur age on ‘delicious’ apple fruit size and quality. J. Am. Soc. Hortic. Sci. 108, 855–861. doi: 10.21273/JASHS.108.5.855
Sapkota S., Liu J., Islam M. T., Ravindran P., Kumar P. P., and Sherif S. M. (2021). Contrasting bloom dates in two apple cultivars linked to differential levels of phytohormones and heat requirements during ecodormancy. Scientia Hortic. 288, 110413. doi: 10.1016/j.scienta.2021.110413
Shewa A., Gobena D., and Ali M. (2022). Review on postharvest quality and handling of apple. J. Agric. Sci. Food Technol. 8, 028–032. doi: 10.17352/2455-815X.000141
Streif J. (1983). optimale erntetermin beim apfel. i. qualitatsentwicklung und reife. Gartenbauwissenschaft= Hortic. Sci. 48, 154–159. http://pascal-francis.inist.fr/vibad/index.php?action=getRecordDetail&idt=PASCALAGROLINEINRA83X0494510
Streif J. (1996). Optimum harvest date for different apple cultivars in the ‘bodensee’ area. COST 94. The postharvest treatment of fruit and vegetables. Determination and prediction of optimum harvest date of apples and pears. Proceedings of a meeting, Lofthus, Norway, 9-10 June 1994.
Sugiura T., Fukuda N., Tsuchida T., Sakurai M., and Sugiura H. (2023). Modeling the relationship between apple quality indices and air temperature. Hortic. J. 92, 424–430. doi: 10.2503/hortj.QH-076
Tang H., Zhai X., and Xu X. (2024). Evaluating the performance of models predicting the flowering times of twenty-six apple cultivars in england. Eur. J. Agron. 160, 127319. doi: 10.1016/j.eja.2024.127319
Volz R. K., Palmer J. W., and Gibbs H. M. (1993). Within-tree variability in fruit quality and maturity for ‘royal gala’ apple. International Symposium on Quality of Fruit and Vegetables: Influence of Pre-and Post-Harvest Factors and Technology 379, 67–74. doi: 10.17660/actahortic.1995.379.5
Wagner T. L., Wu H.-I., Sharpe P. J. H., Schoolfield R. M., and Coulson R. N. (1984). Modeling insect development rates: a literature review and application of a biophysical model. Ann. Entomol. Soc. America 77, 208–220. doi: 10.1093/aesa/77.2.208
Warrington I. J., Fulton T. A., Halligan E. A., and Silva H. N. D. (1999). Apple fruit growth and maturity are affected by early season temperatures. J. Am. Soc. Hortic. Sci. 124, 468–477. doi: 10.21273/JASHS.124.5.468
Wilkinson B. G. and Sharples R. O. (1967). The relation between time of picking and storage disorders in cox’s orange pippin apple fruits. J. Hortic. Sci. 42, 67–82. doi: 10.1080/00221589.1967.11514194
Keywords: apple, flowering time variability, maturity variability, fruit development models, fruit quality
Citation: Tang H, Zhai X and Xu X (2025) Flowering variation induces apple maturity variation at harvest. Front. Agron. 7:1545070. doi: 10.3389/fagro.2025.1545070
Received: 14 December 2024; Accepted: 06 June 2025;
Published: 09 July 2025.
Edited by:
Jiban Shrestha, Nepal Agricultural Research Council, NepalReviewed by:
Khalil R Jahed, Virginia Tech, United StatesKristina Laužikė, Lithuanian Research Centre for Agriculture and Forestry, Lithuania
Copyright © 2025 Tang, Zhai and Xu. This is an open-access article distributed under the terms of the Creative Commons Attribution License (CC BY). The use, distribution or reproduction in other forums is permitted, provided the original author(s) and the copyright owner(s) are credited and that the original publication in this journal is cited, in accordance with accepted academic practice. No use, distribution or reproduction is permitted which does not comply with these terms.
*Correspondence: Haidee Tang, SGFpZGVlLlRhbmdAbmlhYi5jb20=; aHQyMTA3NEBlc3NleC5hYy51aw==