 Leonardo Carvalho Brant Maia1*†
 Victor Martins Maia2†Alcinei Mistico Azevedo3†Evander Alves Ferreira3†Sérgio Luiz Rodrigues Donato4†Marlon Cristian Toledo Pereira2†
- 1Institute of Agricultural Sciences, Universidade Estadual de Montes Claros, Centro de Ciências Exatas e Tecnológicas, Departamento de Ciências Agrárias, Janaúba, MG, Brazil
- 2Institute of Agricultural Sciences, Universidade Estadual de Montes Claros, Janaúba, MG, Brazil
- 3Universidade Federal de Minas Gerais, Instituto de Ciências Agrárias, Montes Claros, MG, Brazil
- 4Instituto Federal de Educação, Ciência e Tecnologia Baiano, Guanambi, BA, Brazil
Paclobutrazol (PBZ) inhibits gibberellin biosynthesis and reduces plant size, whereas 2,4-D (2,4 dichlorophenoxyacetic acid) causes cell elongation and enhances fruit growth and productivity. In this study, we used a multivariate approach to evaluate the production and post-harvest characteristics of the ‘Prata-Anã’ banana in three production cycles after the application of paclobutrazol in the soil and 2,4-D during flowering. A randomized block design (4×4 factorial arrangement) was used, referring to the paclobutrazol (0, 0.1, 0.3, 0.5 g L-1) and 2,4-D concentrations (0, 10, 20, and 30 mg L-1), with three replicates. Five vegetative characteristics and one physiological characteristic were evaluated during plant flowering. Nine production variables were evaluated during harvest. The values of five production variables and two vegetative growth variables increased and the number of days between the clústeres decreased as the cycles progressed. 2,4-D did not affect the fruit production-associated characteristics. Further, 0.5 g a.i. (active ingredient), PBZ yielded lower and higher values for the production variables in the first and second production cycles, respectively. In the third cycle, 0.1 g a. i. paclobutrazol exerted the most prominent effect on the production variables, indicating that the plant response to growth regulators changes according to the production cycle.
1 Introduction
Various plant hormones, including auxins, cytokinins, gibberellins, abscisic acid, and ethylene, play crucial roles in plant and fruit growth and development (Tesfahun, 2018; Chen et al., 2020). The application of plant hormones and growth regulators in agriculture for various purposes is a widespread practice across many farming regions and crops worldwide. Among plant growth regulators, paclobutrazol (PBZ) and 2,4-D (2,4 dichlorophenoxyacetic acid) synthetic auxin stand out.
PBZ prevents oxidation reactions before GA12-aldehyde formation, thereby inhibiting the conversion of ent-kaurene to ent-kaurenoic acid in the gibberellic acid biosynthetic pathway. Consequently, gibberellin levels decrease, leading to reduced cell elongation and division (Rademacher, 2018).
Paclobutrazol application increases antioxidant potential, changes biennial bearing problems, inhibits plant growth, reduces internodal distance, inhibits shoot elongation, reduces leaf area, and increases root to shoot ratio. It is reportedly effective in inducing flowering in many tropical, subtropical, and temperate fruit crops. Paclobutrazol is also testified to defend plants from several environmental stresses, viz., drought stress, low and high temperature stress (Manmohan et al., 2023). Paclobutrazol is one of the most potent plant growth regulators, limiting vegetative progress and promoting blooming in fruit crops such as apples (Sha et al., 2021a; Gollagi et al., 2019).
Auxins, gibberellins, and cytokinins are directly involved in the initial stages of fruit growth and development, specifically in Phases I and II. However, the interplay between these growth regulators remains unclear (Majda and Robert, 2018). Auxin is crucial for regulating plant growth and development by promoting cell division, expansion, elongation, and differentiation (Fenn and Giovannoni, 2021). This hormone promotes cell elongation by enhancing cell wall expansion, resulting from the development of certain enzymes involved in cell wall synthesis (Fuentes et al., 2019). Auxin regulates cell wall properties by inducing cell wall (Fenn and Giovannoni, 2021). A study carried out by Tian et al. (2023) with pumpkin (Cucurbita spp.), on the production of fruits by parthenocarpy with the use of 2,4-D, demonstrates that it is possible to obtain fruits with the use of 2,4-D, however the dose used may vary with environmental conditions.
Production and post-harvest analyses revealed how paclobutrazol and synthetic auxin affect fruit quality, thus enabling the determination of the feasibility of using this growth regulator on fruits and plants to produce high-quality fruits that are well accepted by consumers. Post-harvest characterization of bunches and fruits is crucial for banana growers because bunch weight, fruit weight, length, and diameter are key criteria for product selection and grading.
Researching the impact of PBZ and 2,4-D, as well as their interactions in banana cultivation and post-harvest, is a complex task that requires the simultaneous consideration of multiple factors. Multivariate techniques allowed us to assess multiple variables and draw a single conclusion. Canonical variate analysis is a multivariate statistical method used for dimensionality reduction. This analysis aims to derive linear combinations of multiple correlated original characteristics known as canonical variables. This technique allows for capturing the simultaneous effects of original characteristics, potentially revealing variations that may go unnoticed when isolated original characteristics (Akour et al., 2023).
Therefore, this study hypothesized that applying paclobutrazol to the soil and synthetic auxin to the inflorescence increases the yield of ‘Prata Anã’ banana plants without compromising fruit quality. In this regard, this study aimed to evaluate the effects of soil-applied paclobutrazol and inflorescence-applied 2,4-D on the yield components of ‘Prata-Anã’ bananas over three production cycles using a multivariate approach.
2 Materials and methods
The experiment was conducted within the Gorutuba Irrigation District in Janaúba, Minas Gerais, Brazil (15° 41’ S, 43° 15’ W), at an elevation of 474 m. The climate was classified as Aw, according to the Köppen climate classification system. The soil in the experimental area was classified as a Red Eutrophic Oxisol with a medium to clayey texture (Santos et al., 2018). Soil physical analysis yielded the following results: sand = 0,64 kg, silt = 0,09 kg, and clay = 0,27 kg.
Micropropagated banana (Musa ssp.) seedlings of the ‘Prata Anã’ cultivar were used. The spacing used was 3.5 x 1.8 m. The plants were grown in “family” formations consisting of a mother plant (first cycle), daughter plant (second cycle), and granddaughter plant (third cycle). Crop management and pest control practices were performed according to technical recommendations (Donato et al., 2021a).
Microsprinkler irrigation was used in this study. In the first production cycle, irrigation water availability was reduced by 61% owing to prolonged drought. During this period, a three-day irrigation cycle was used to water the plants. Water was supplied based on the reference evapotranspiration, using a crop coefficient according to the phenological stage (Donato et al., 2021b) and the Penman-Monteith equation for the second and third production cycles.
Before installing the experiment, soil samples were collected and analyzed to determine nutrient levels, which guided the planning of planting and maintenance fertilization. Fertilizer doses for the three production cycles were carried out in accordance with technical recommendations (EPAMIG, 2015). Planting fertilizer was applied at a rate of 300 g of single superphosphate Ca(H2PO4)2 +CaSO4 2H2O per hole. The first topdressing fertilization was applied 60 days after planting, using 100 g of ammonium sulfate (NH4)2SO4 and 100 g of potassium chloride (KCl). Fertilization was repeated monthly until the beginning of production in the second production cycle 570 days after planting, with 18 applications. The micronutrient source used was 50 g of commercial brand FTE BR 12 with the following guaranteed contents: 9% Zn, 1.8% B, 0.8% Cu, 2.1% Mn and 0.1% Mo, and 10 liters of manure were applied per hole at planting for the first cycle. Fertilization with micronutrients and manure was carried out 360 days after planting for the second production cycle.
In the third production cycle, a soil analysis was performed and the results of the soil analysis recommended different fertilizers to be applied, due to the improved soil fertilization. In this production cycle, fertilization was performed monthly, starting 600 days after planting, with 6 g of urea (CH4N2O) and 45 g of potassium nitrate (KNO3). Phosphorus and magnesium were applied with 240 g of monoammonium phosphate (NH4H2PO4) and 90 g of magnesium sulfate (MgSO4). The amounts of micronutrients fertilized were as follows: 12 g of boric acid (H3BO3), 15 g of zinc sulfate (ZnSO4), 35 g of ferrous sulfate (FeSO4), 30 g of copper sulfate (CuSO4) and manure (10 L), were carried out 600 days after planting.
The treatments were arranged in a randomized block design with a 4–4 factorial scheme, comprising four doses of paclobutrazol (triazole) (Cultar® 250 SC) as follows: 0, 0.1, 0.3, and 0.5 g of active ingredient per plant, and four pre-harvest doses of synthetic auxin (2,4-dichlorophenoxyacetic acid, Sigma Aldrich ®) at concentrations of 0, 10, 20, and 30 mg L-1 per bunch, with three replications. The plots consisted of 12 plants arranged in three rows of four plants each, with two plants considered for data collection. The area occupied by each plot was 75.6 m2. An external border with a single planting row was used in the experiment.
Paclobutrazol (PBZ) was applied when the plants reached an average height of 50 cm, measured from the ground to the second leaf of the leaf rosette. The PBZ was diluted in two liters of water and applied to the soil, with moisture near field capacity, around the pseudostem, at an average distance of 25 cm.
Synthetic auxin treatments were applied approximately 12–15 days after inflorescence emergence using a backpack sprayer, when the bunches had between seven and nine female hands. An aqueous solution of 200 ml of distilled water was used, which was sufficient for application to the entire bunch at the concentrations described above.
Vegetative growth variables were assessed at the flowering stage as follows: pseudostem height at flowering (cm) (PHF), measured from the ground to the bunch stalk insertion point; pseudostem circumference at flowering (cm) (PCF), measured 0.30 m above the soil surface; number of fully expanded leaves at flowering; and mathematical model to estimate the total leaf area (TLA) of banana trees, using linear dimensions of the third leaf, such as length, width, and total number of leaves at inflorescence emission. using the non-destructive method proposed by Zucoloto et al. (2008) for Prata Anã banana. The leaf area index (LAI) was also determined to use an AccuPAR LP-80® PAR/LAI Ceptometer device from Decagon Devices Inc. The chlorophyll index (SPAD) was measured using an SPAD-502 device. The number of days between planting and harvest (total cycle) (DPH) and the number of days from inflorescence emergence to harvest (reproductive cycle) (DFH) were also determined.
Production in the first cycle began 355 days after planting, the second cycle began 573 days after planting, and the third cycle began 849 days after planting. The bunches of useful plants were harvested 120 days after the emission of the last female bunch, in the three production cycles, and dropped at the experimental site. At this stage, bunches were evaluated for the number of hands per bunch (NHB), number of fruits per bunch (NFB), average hand weight (AHW), average fruit weight (AFW), and bunch weight (BW). Two measurements were taken to measure fruit length: the first from where the fruit attaches to the flower cushion to the tip of its curved side along its longest axis and the second across the flesh along its shortest axis. This allowed us to determine the shape of the fruit, specifically, its concavity (CFP 02). Two fruits from the second hand were used for measurements.
The adjusted yield was calculated by multiplying the bunch weight (sum of hand weights) by the plant population per hectare. This was performed by obtaining the sum of the first-cycle yields, dividing by days to harvest, and multiplying by 365 days. For the second and third cycles, the adjusted yield was calculated by summing the yield of each cycle with those of the previous cycles, dividing by the number of days until harvest for each cycle, and then multiplying by 365 days. The number of bunches per year was also determined for each cycle by dividing 365 days by the number of days until bunch harvest for each cycle and multiplying the result by the corresponding production cycle number for the bunch harvest. The number of days from planting to harvest (DPH) (total cycle), which measures plant development until harvest, and DFH, which measures fruit growth until harvest, were also determined.
The data were analyzed using multivariate analysis of variance, followed by an assessment of the significance of the sources of variation at the 5% significance level using Pillai’s test. Subsequently, a graphical representation was performed using canonical variate analysis. A correlation study between the characteristics was also conducted. For this purpose, a network-based scatter plot was created to visualize significant correlations, as determined by the F-test at the 5% significance level. Statistical analysis was conducted using R statistical software (R Core Team, 2019) with stats, candiscs, and qgraph packages.
3 Results
The multivariate analysis of variance presented in Table 1 revealed significant effects for all sources of variation. The results are presented and discussed considering the presence of interactions. It is worth noting that because synthetic auxin is applied directly to the bunch after the emergence of the hands, this treatment was not considered for these evaluations (number of hands per bunch, number of fruits per bunch, SPAD index, leaf area index, total leaf area, plant height at flowering, pseudostem circumference at flowering, and number of leaves at flowering). Therefore, auxin dose was not included as a source of variation in the analysis described below.
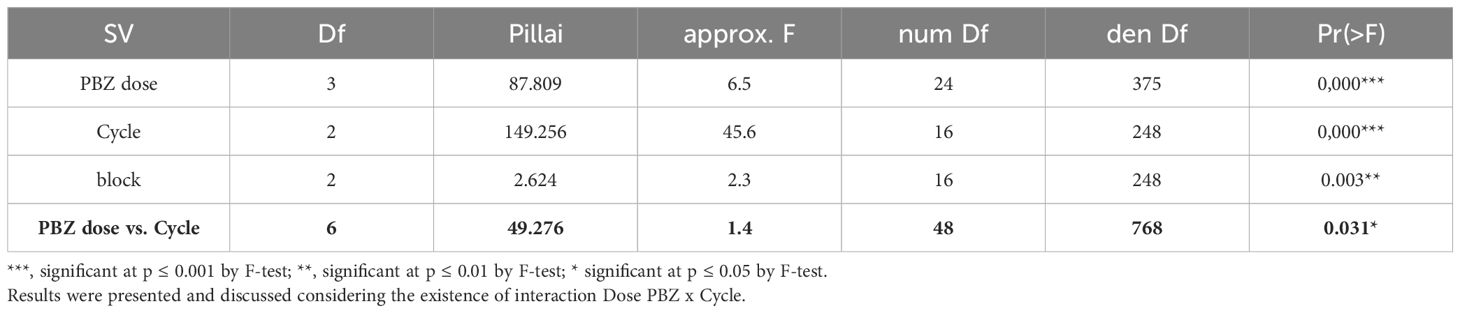
Table 1. Multivariate analysis of variance for the characteristics: number of hands per bunch (NHB), number of fruits per bunch (NFB), SPAD index (SPAD), leaf area index (LAI), total leaf area (TLA), plant height at flowering (PHF), pseudostem circumference at flowering (PCF), and number of leaves at flowering (NLF) as a function of paclobutrazol (PBZ) doses over three production cycles.
Figure 1 illustrates that canonical variable 1 (CV1) accounted for 50.51% of the variation in the analyzed variables, whereas canonical variable 2 (CV2) explained 22.22% of the variation. This accounted for 72.73% of the total variation in the analyzed variables, as explained by CV1 and CV2. The treatments are associated with lower doses of PBZ, and the third cycle exhibits higher CV2 estimates, particularly at a dose of 0.1 g of active ingredient per plant. In contrast, the 0.5 g dose of active ingredient per plant in the first cycle exhibited the lowest estimated CV2.
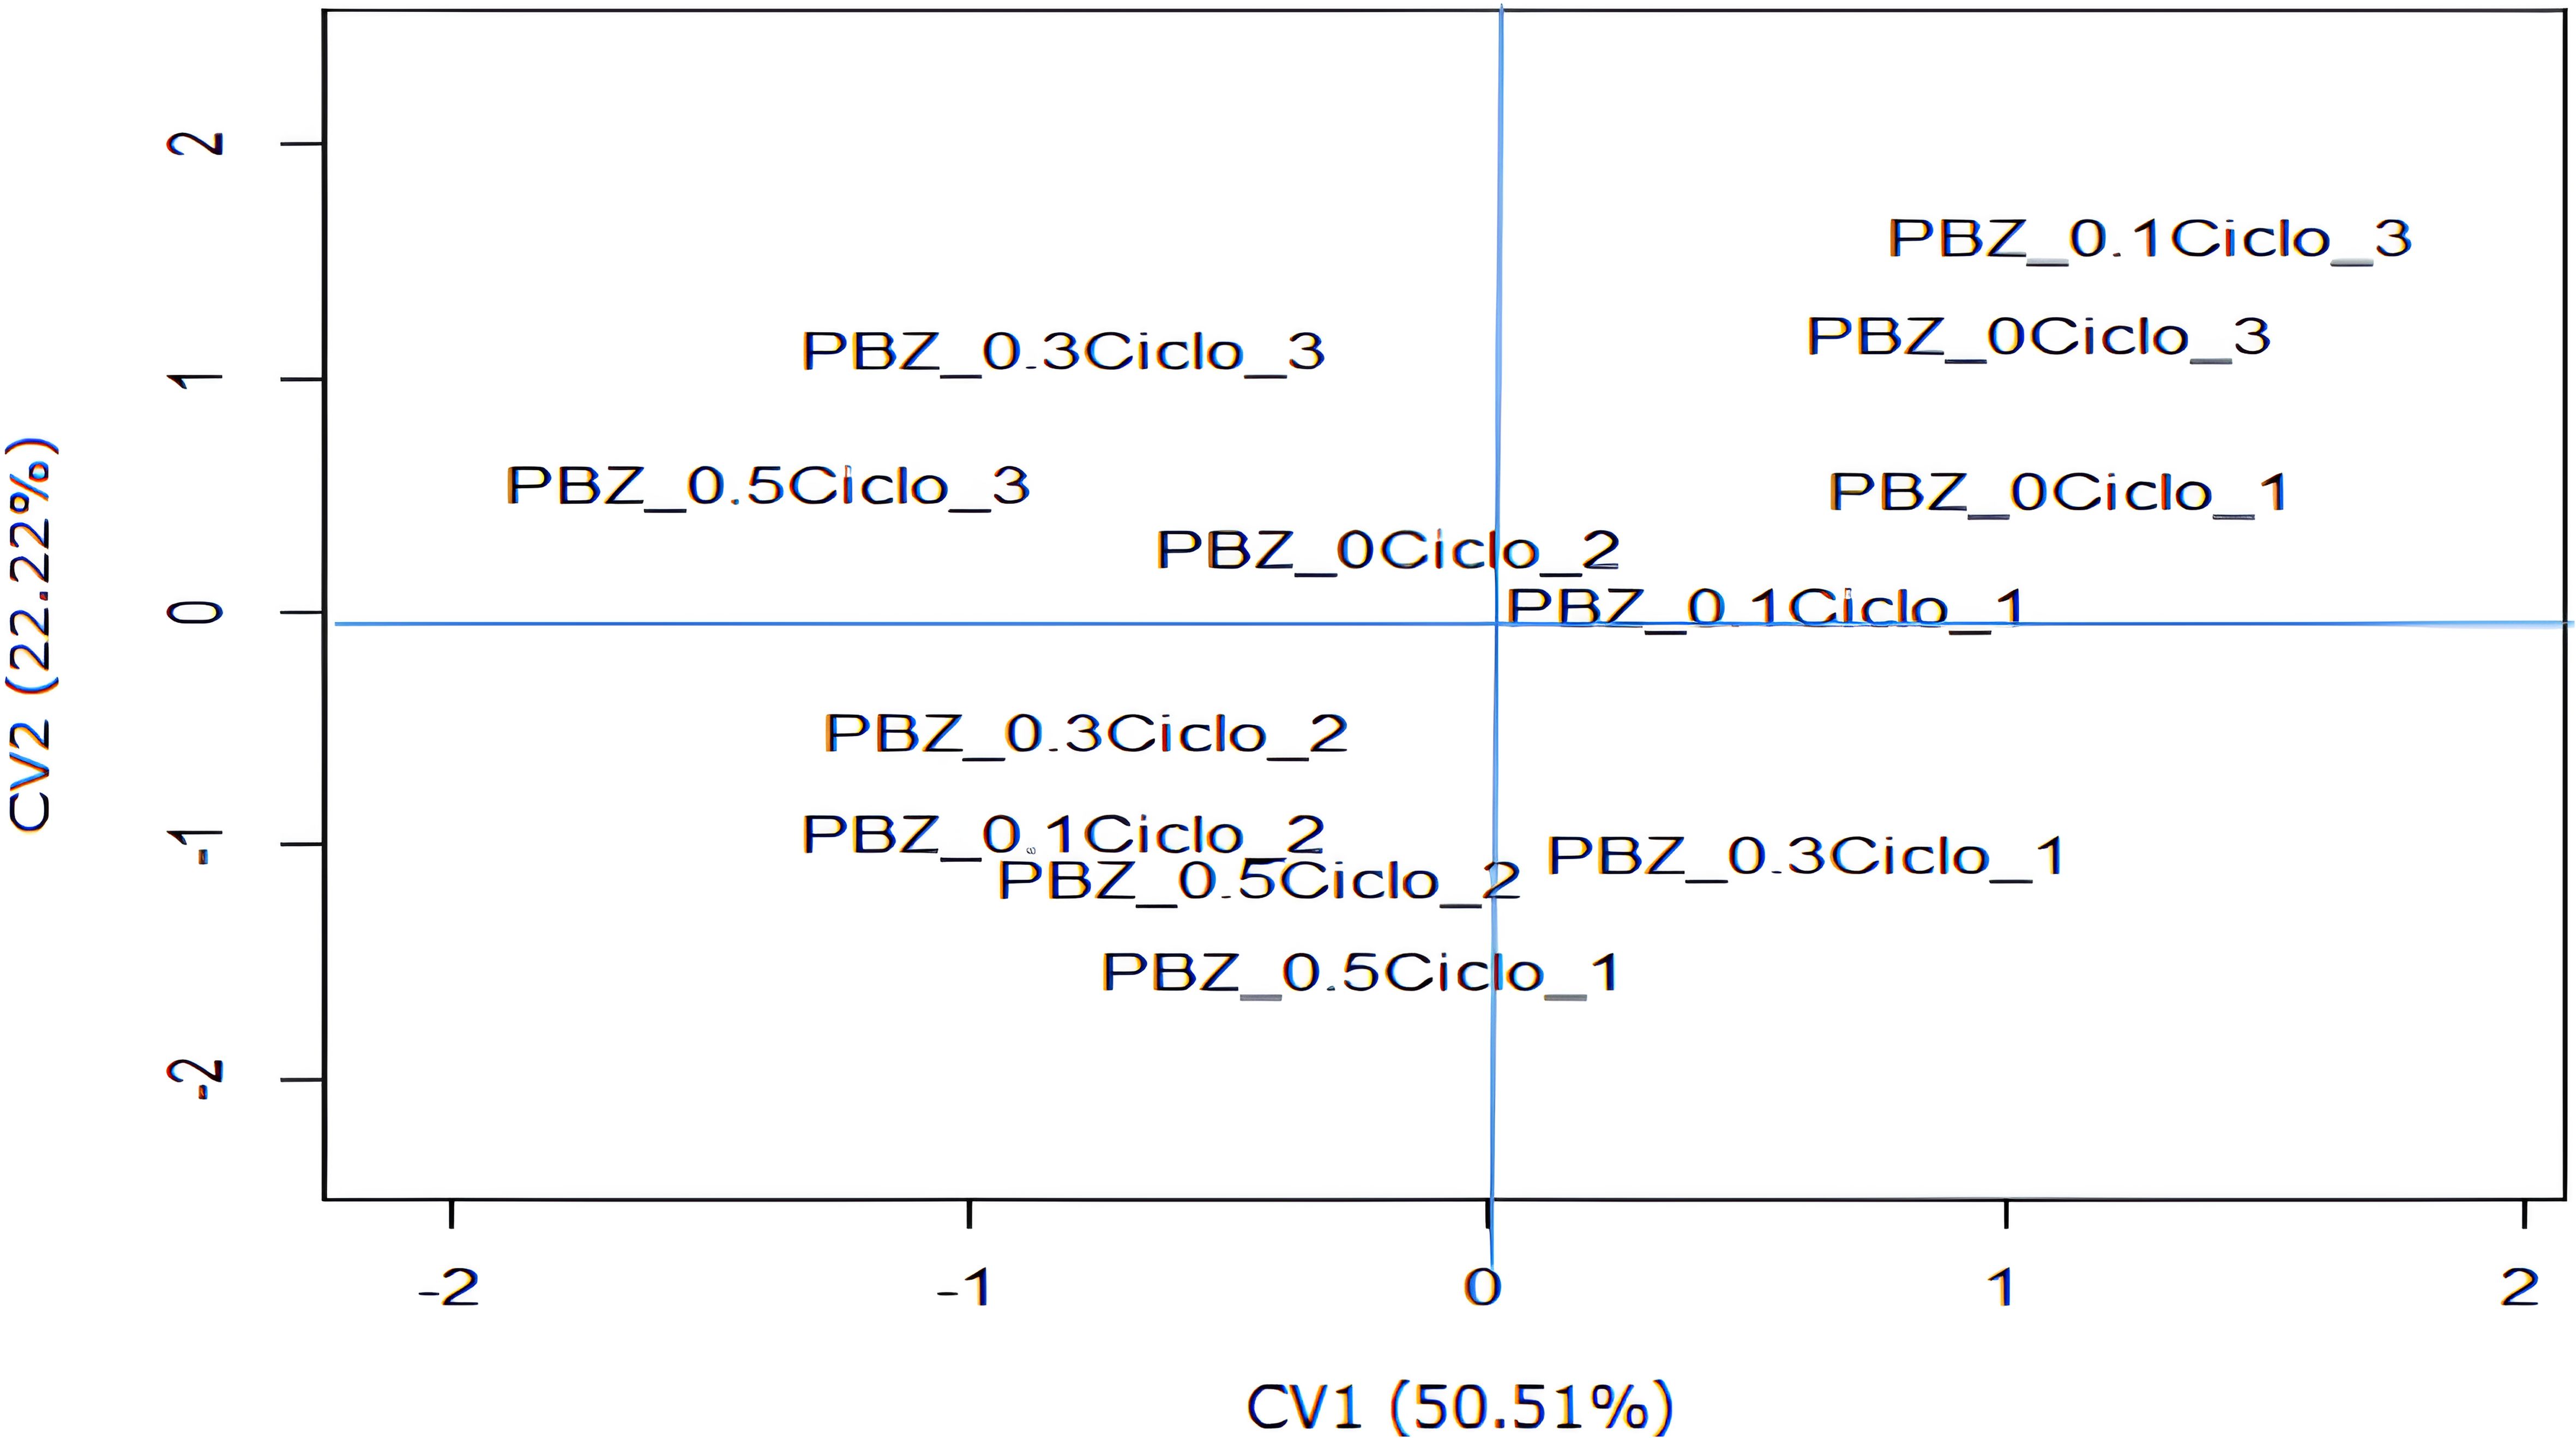
Figure 1. Scatter plot of scores for the first two canonical variables (CV1 and CV2) as a function of paclobutrazol (PBZ) doses and production cycles. (PBZ Doses: 0, 0.1, 0.3, and 0.5 g of active ingredient per plant; production cycles 1, 2, and 3).
To analyze the distribution of treatments in the study of canonical variables, it is crucial to examine the correlations between the explanatory and canonical variables (Table 2). Correlations with estimates above 0.7 can be considered biologically significant, as squaring this value yields a coefficient of determination greater than 50%. The correlations showed high estimates, and owing to their positive signs, they were directly proportional to the CV2 scores.
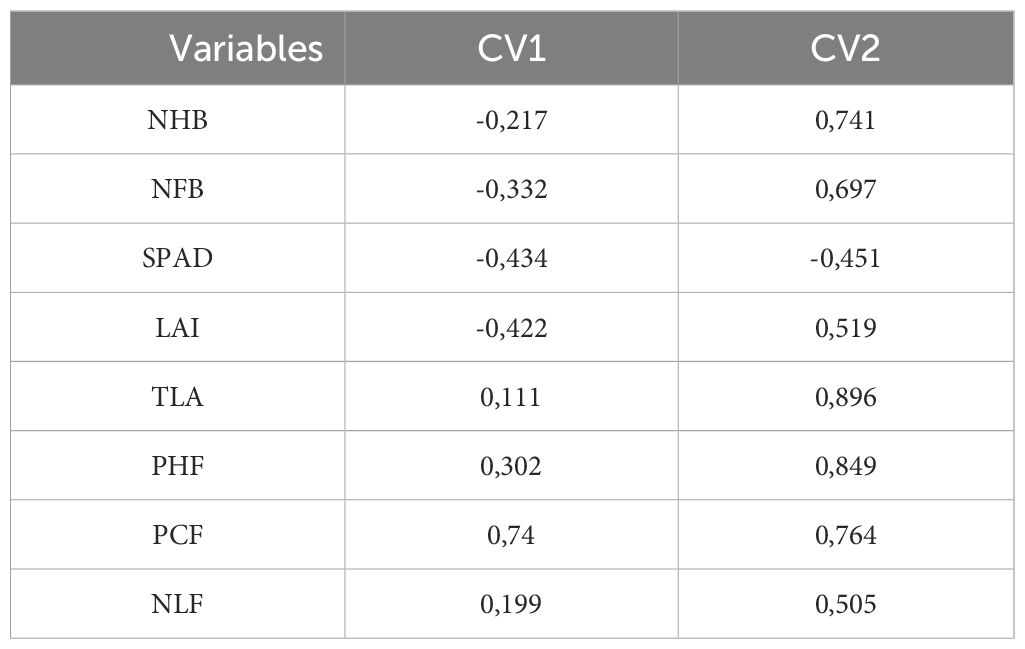
Table 2. Canonical correlation between the following evaluated characteristics: number of hands per bunch (NHB); number of fruits per bunch (NFB); SPAD index (SPAD); leaf area index (LAI); total leaf area (TLA); plant height at flowering (PHF); pseudostem circumference at flowering (PCF); number of leaves at flowering (NLF) and the two canonical variables (CV1 and CV2) as a function of paclobutrazol doses over three production cycles.
Analysis of the correlations between explanatory variables and canonical variable scores (Table 2) revealed that treatments with lower PBZ doses tended to result in a higher number of hands per bunch (0.741), fruits per bunch (0.697), total leaf area (0.896), plant height at flowering (0.849), and pseudostem circumference at flowering (0.764). As previously mentioned, the 0.1 g PBZ dose in the third production cycle yielded the highest values for these variables. This directly affects the bunch weight.
It is worth noting that, because PBZ is always applied to the soil when seedlings reach 50 cm in height, there is a cumulative and residual effect of this substance in subsequent cycles. Therefore, this outcome may result from the reduced residual effect of PBZ in the soil at a dose of 0.1 g active ingredient per plant, or even a growth-promoting effect at lower doses. The PBZ dose of 0.5 the active ingredient per plant over three production cycles showed lower CV2 values, particularly in the first two cycles, indicating a reduction in the measured variables due to this treatment. This trend continued in the third cycle when only the doses used were compared (Figure 1).
Significant effects (p ≤ 0.05) were identified through multivariate analysis of variance for the isolated factors PBZ, production cycles and block, the interaction between PBZ and production cycles, the isolated factor synthetic auxin (AUX), and the interactions between synthetic auxin vs. production cycles and PBZ vs. production cycles (Table 3). Therefore, the triple interaction of the factors under study (PBZ vs. AUX vs. cycle) or PBZ vs. AUX interaction had no significant effect.
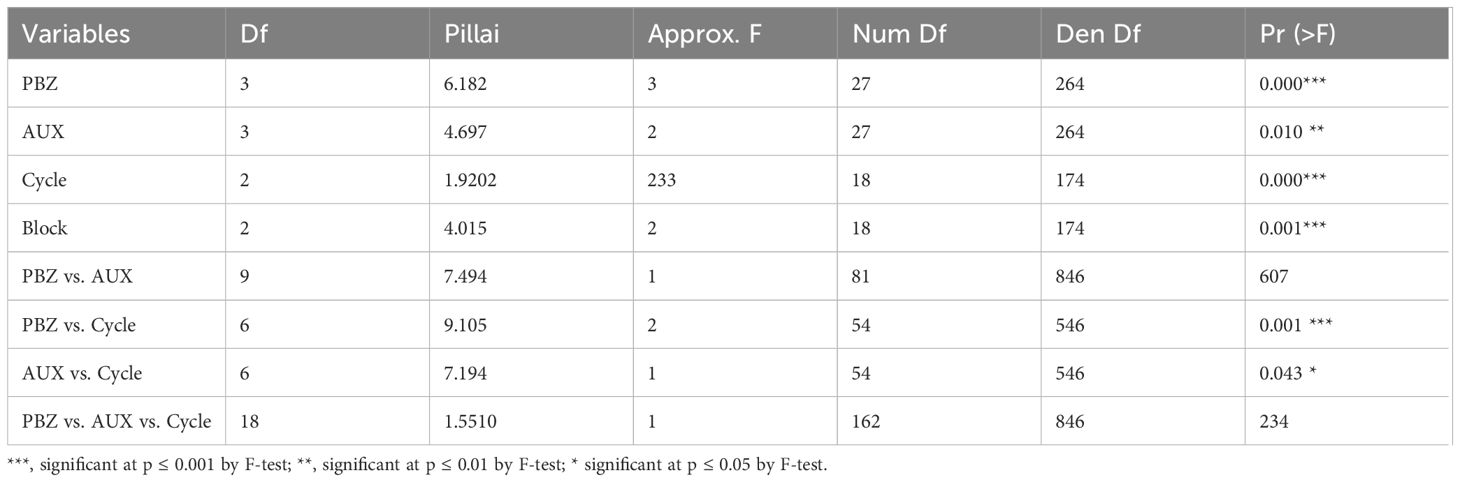
Table 3. Multivariate analysis of variance for the following characteristics: bunch weight (BW), average hand weight (AHW), average fruit weight (AFW), adjusted yield (AY), fruit curvature of the second hand (FC2), days from flowering to harvest (DFH), days from planting to harvest (DPH), interval of days between bunches (IDB), number of bunches per year (NBY) as a function of paclobutrazol (PBZ) and synthetic auxin (AUX) doses over three production cycles.
The interaction between the PBZ and production cycles had the most significant impact on the canonical variables (CV1 and CV2) of ‘Prata Anã’ banana (Figure 2). The analysis showed that CV1 accounted for 51.33% of the variation in the studied variables, whereas CV2 accounted for 26.45%. CV1 and CV2 accounted for 77.78% of the total variation in the analyzed variables. This suggests reasonable effectiveness of analyzing these results using a technique that only considers the first two canonical variables.
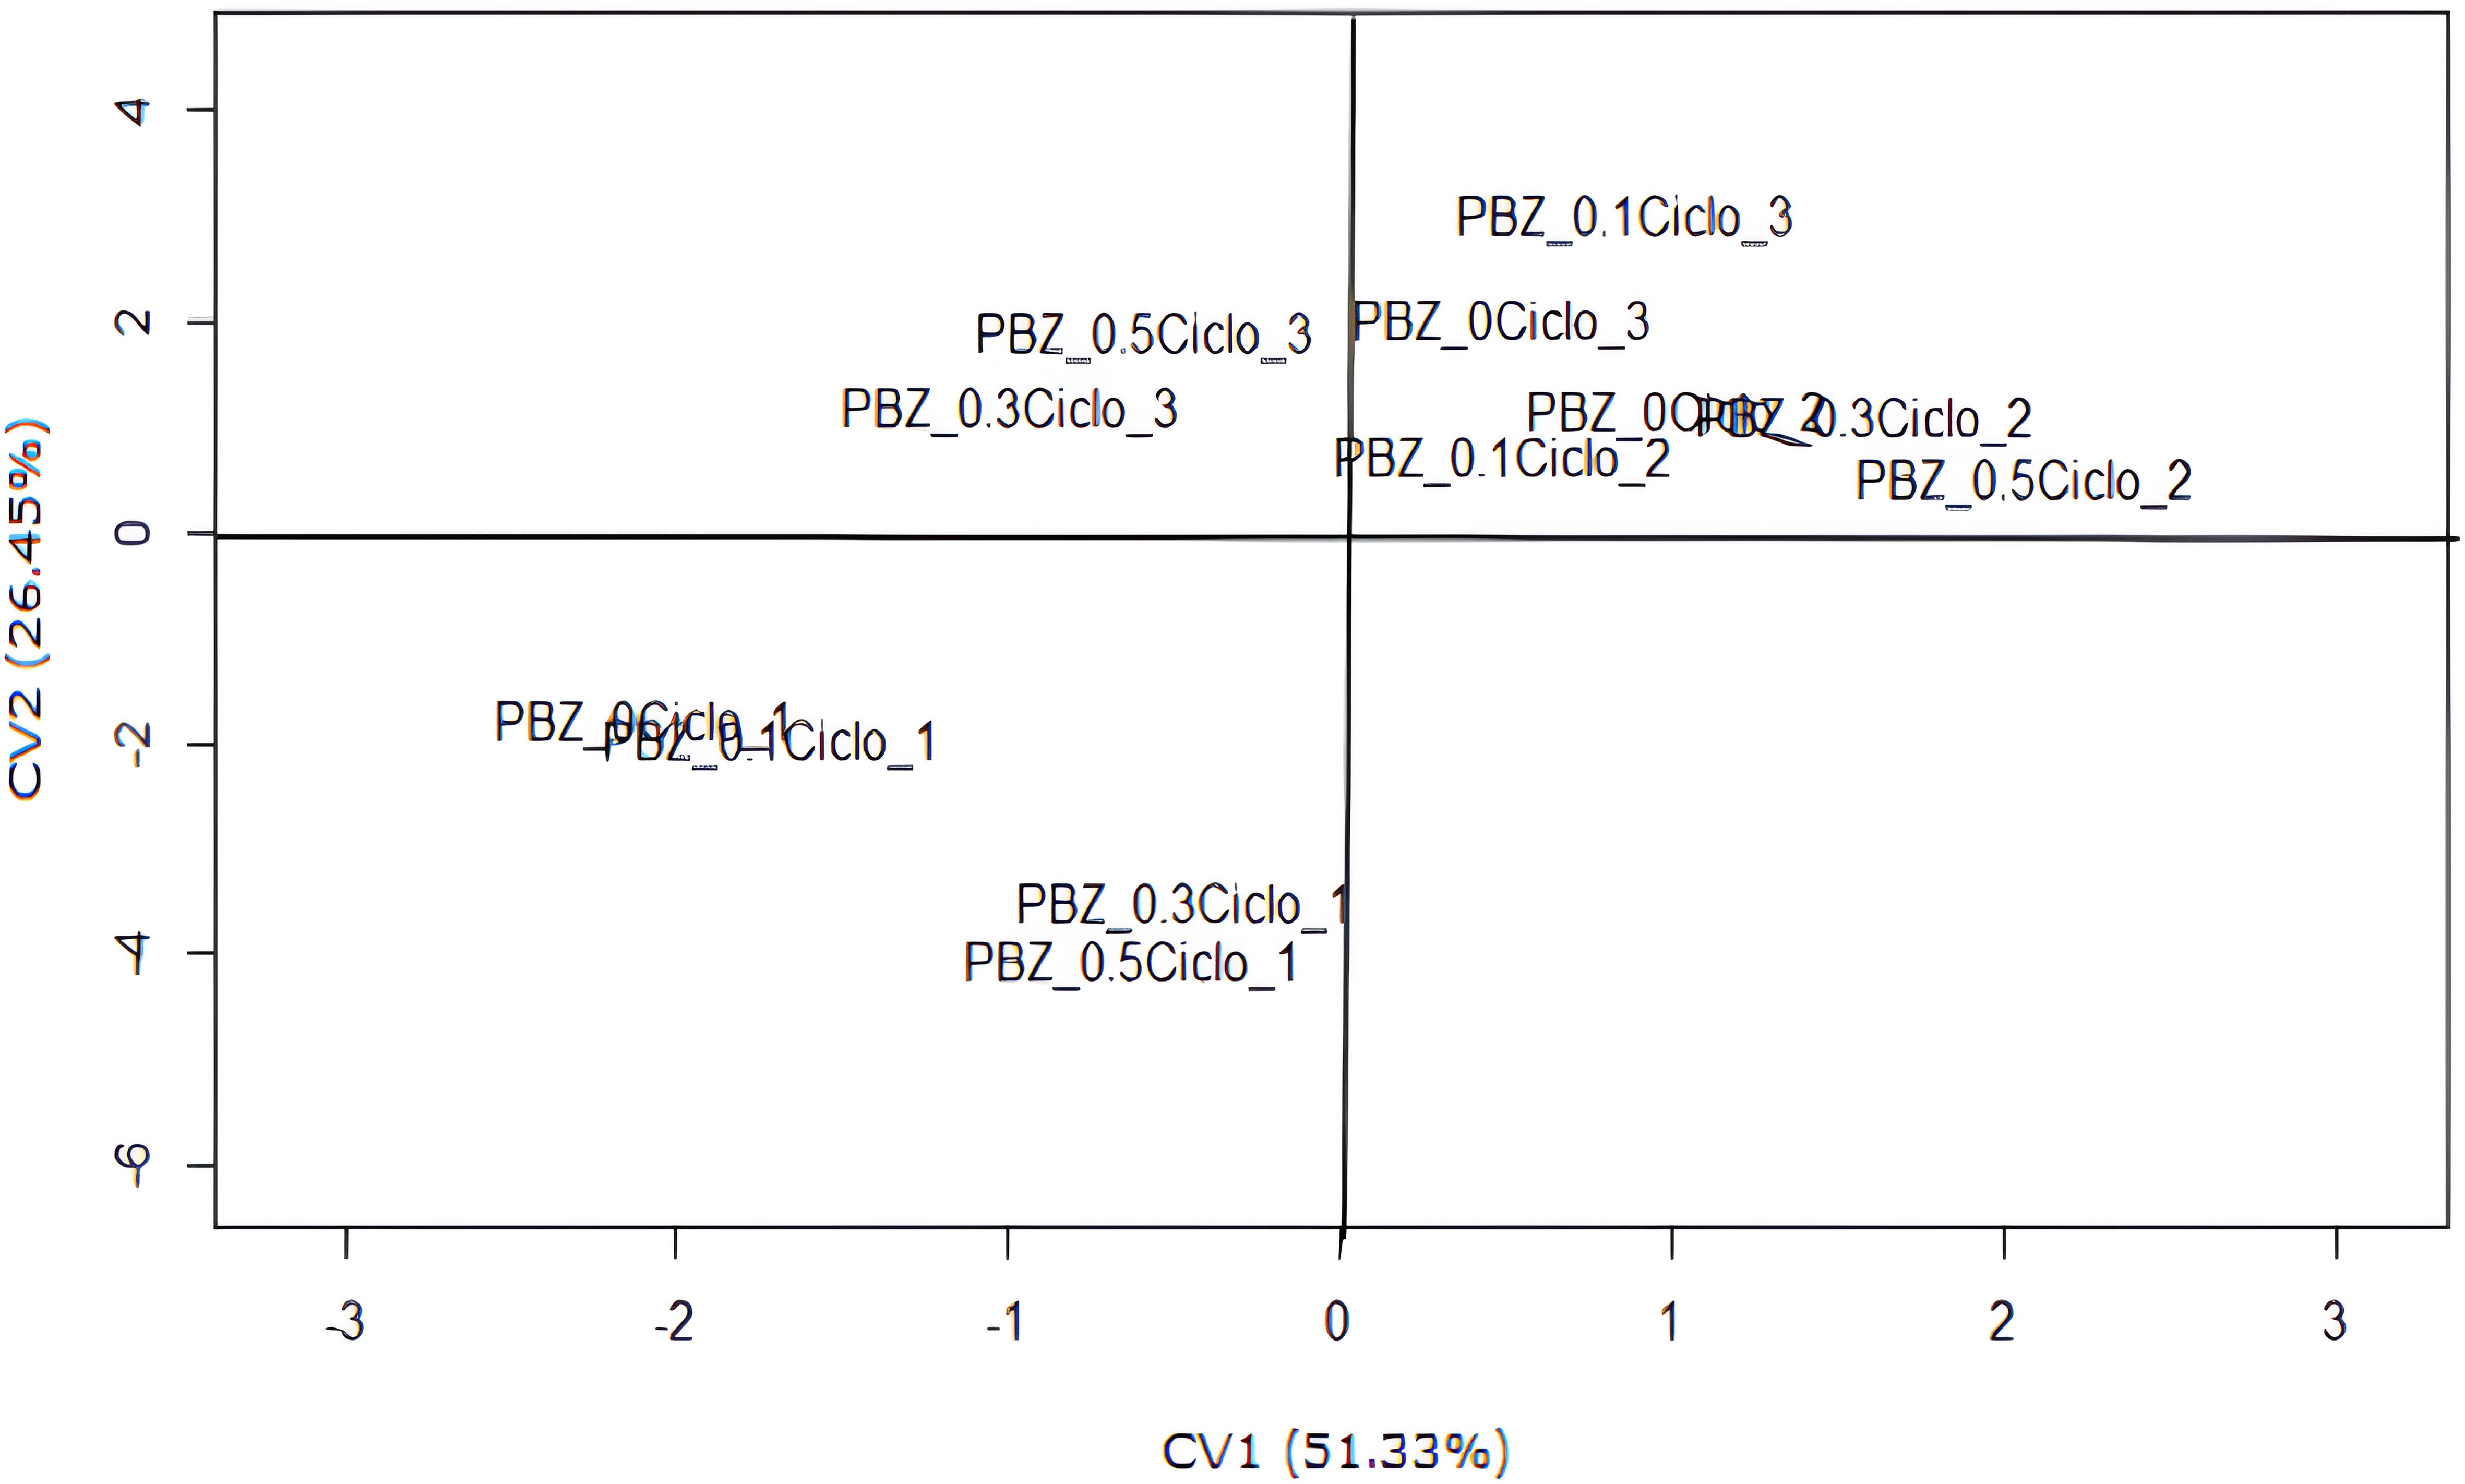
Figure 2. Scatter plot of scores for the first two canonical variables (CV1 and CV2) as a function of paclobutrazol (PBZ) doses and production cycles. (PBZ Doses: 0, 0.1, 0.3, and 0.5 g of active ingredient per plant; production cycles 1, 2, and 3).
It was also observed that all treatments involving the first harvest cycle are in the third quadrant, showing the lowest CV2 values. In the first cycle, PBZ doses of 0 and 0.1 g of active ingredient per plant resulted in the lowest CV1 value. In the second harvest cycle, the PBZ treatments were positioned near the axes of the Cartesian plane, indicating intermediate CV2 results. However, regarding the second cycle, the highest CV1 values were observed at PBZ doses of 0.3 and 0.5 g of active ingredient per plant. Examining CV2, the highest value of this canonical variable is achieved in the third cycle at a PBZ dose of 0.1 g of active ingredient per plant.
The explanatory variables were positively correlated with CV2, as follows: bunch weight (0.96), average hand weight (0.95), average fruit weight (0.93), fruit curvature of the second hand (0.79), number of days from planting to harvest (0.86), and number of bunches per year (0.84). However, the interval between flowering and harvest was negative (-0.90). Therefore, the longest reproductive cycle was observed in the first production cycle and in response to PBZ application at doses of 0.3 and 0.5 g of active ingredient per plant. When examining the correlations (Table 4), it was observed that the first cycle was characterized by lower estimates for bunch weight, average hand weight, average fruit weight, fruit curvature of the second hand, days from planting to harvest, and number of bunches per year. Higher estimates were obtained for the period between flowering and harvested.
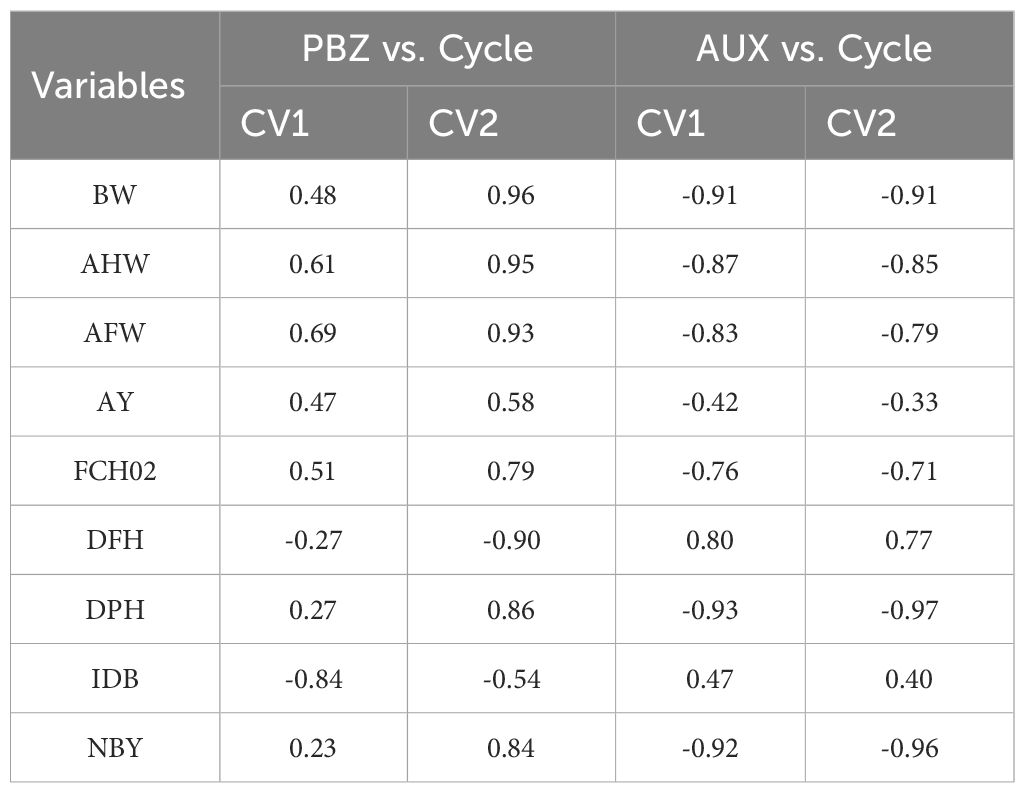
Table 4. Multivariate analysis of variance for the following characteristics: bunch weight (BW), average hand weight (AHW), average fruit weight (AFW), adjusted yield (AY), fruit curvature of the second hand (FCH02), days from flowering to harvest (DFH), days from planting to harvest (DPH), interval of days between bunches (IDB), and number of bunches per year (NBY) as a function of the doses of paclobutrazol and synthetic auxin in three production cycles.
As PBZ doses increased in the first cycle, CV2 estimates decreased, indicating reduced bunch weight, average hand weight, average fruit weight, and fruit curvature in the second hand. This also results in fewer days between planting and harvest, fewer bunches per year, and an increased interval between flowering and harvest when applying PBZ at doses of 0.3 and 0.5 g of active ingredient per plant. However, it is worth noting that the adjusted yield was not significantly influenced by PBZ in the three evaluated cycles due to the low correlation estimates of this characteristic with the first two canonical variables (CV1 and CV2).
Higher estimates were observed for CV2 in the second and third cycles (Figure 2). Therefore, considering the correlation estimates presented (Table 4), it can be inferred that the second and third cycles showed higher estimates for the production variables, days between planting and harvest, and the number of bunches per year. However, the dose of 0.1 g the PBZ active ingredient per plant in the third cycle is particularly noteworthy.
However, analysis of the first canonical variable (CV1) and its correlation with the evaluated variables reveals that treatments associated with the second production cycle, particularly at PBZ doses of 0.3 and 0.5 g active ingredient per plant, yielded higher estimates for this canonical variable. This suggests that these treatments resulted in a shorter interval of days between bunches (IDB) than the other treatments. Differences in the PBZ dosage effects were also observed between the second and third cycles. In the third cycle, higher PBZ doses resulted in lower CV1 estimates. In contrast, the opposite effect was observed in the second cycle. Consequently, the use of PBZ reduced IDB in both the first and second cycles. However, in the third cycle, this trend was reversed. Therefore, the response of plants to PBZ treatment varies depending on the production cycle, which may be influenced by environmental conditions, the growth and development stage of the plant, or even the cumulative effect of PBZ in subsequent cycles.
The PBZ dose, with the highest estimate for CV2, was 0.1 g of active ingredient per plant in the third production cycle (Figure 2). Analysis of the scatter plot, along with the positive correlation estimates, revealed that this dosage led to increased bunch weight, average hand weight, average fruit weight, fruit curvature of the second hand, days from planting to harvest, and number of bunches per year. These results suggest that PBZ at a specified dosage has a beneficial long-term effect (third cycle), considering its production characteristics. This may be due to the reduced residual effect of PBZ in the soil, which is attributable to the low dose used. The soil in the experimental area was classified as a sandy clay loam.
The soil at the experimental site has a sandy clay loam texture. For this reason, and because of the relatively low doses of PBZ compared to other trials with bananas and other fruit trees, it is possible that the residual effect of PBZ was not pronounced. This may have positively affected the long-term outcomes, specifically the bunch interval in the second cycle (shorter interval between bunches at the 0.5 g dose) and yield components in the third cycle (at the 0.1 g dose).
Analysis of canonical variable (CV1 and CV2) dispersion in relation to synthetic auxin doses and production cycles showed that CV1 accounted for 67.99% of the variation in the analyzed variables, whereas CV2 explained 13.58% of the variation (Figure 3). This accounted for 81.57% of the total variation in the analyzed variables, as explained by CV1 and CV2. The results of the four auxin (AUX) doses were similar, indicating a high degree of consistency in their effects. Therefore, although expected, no relevant effects of auxin on the studied variables were observed.
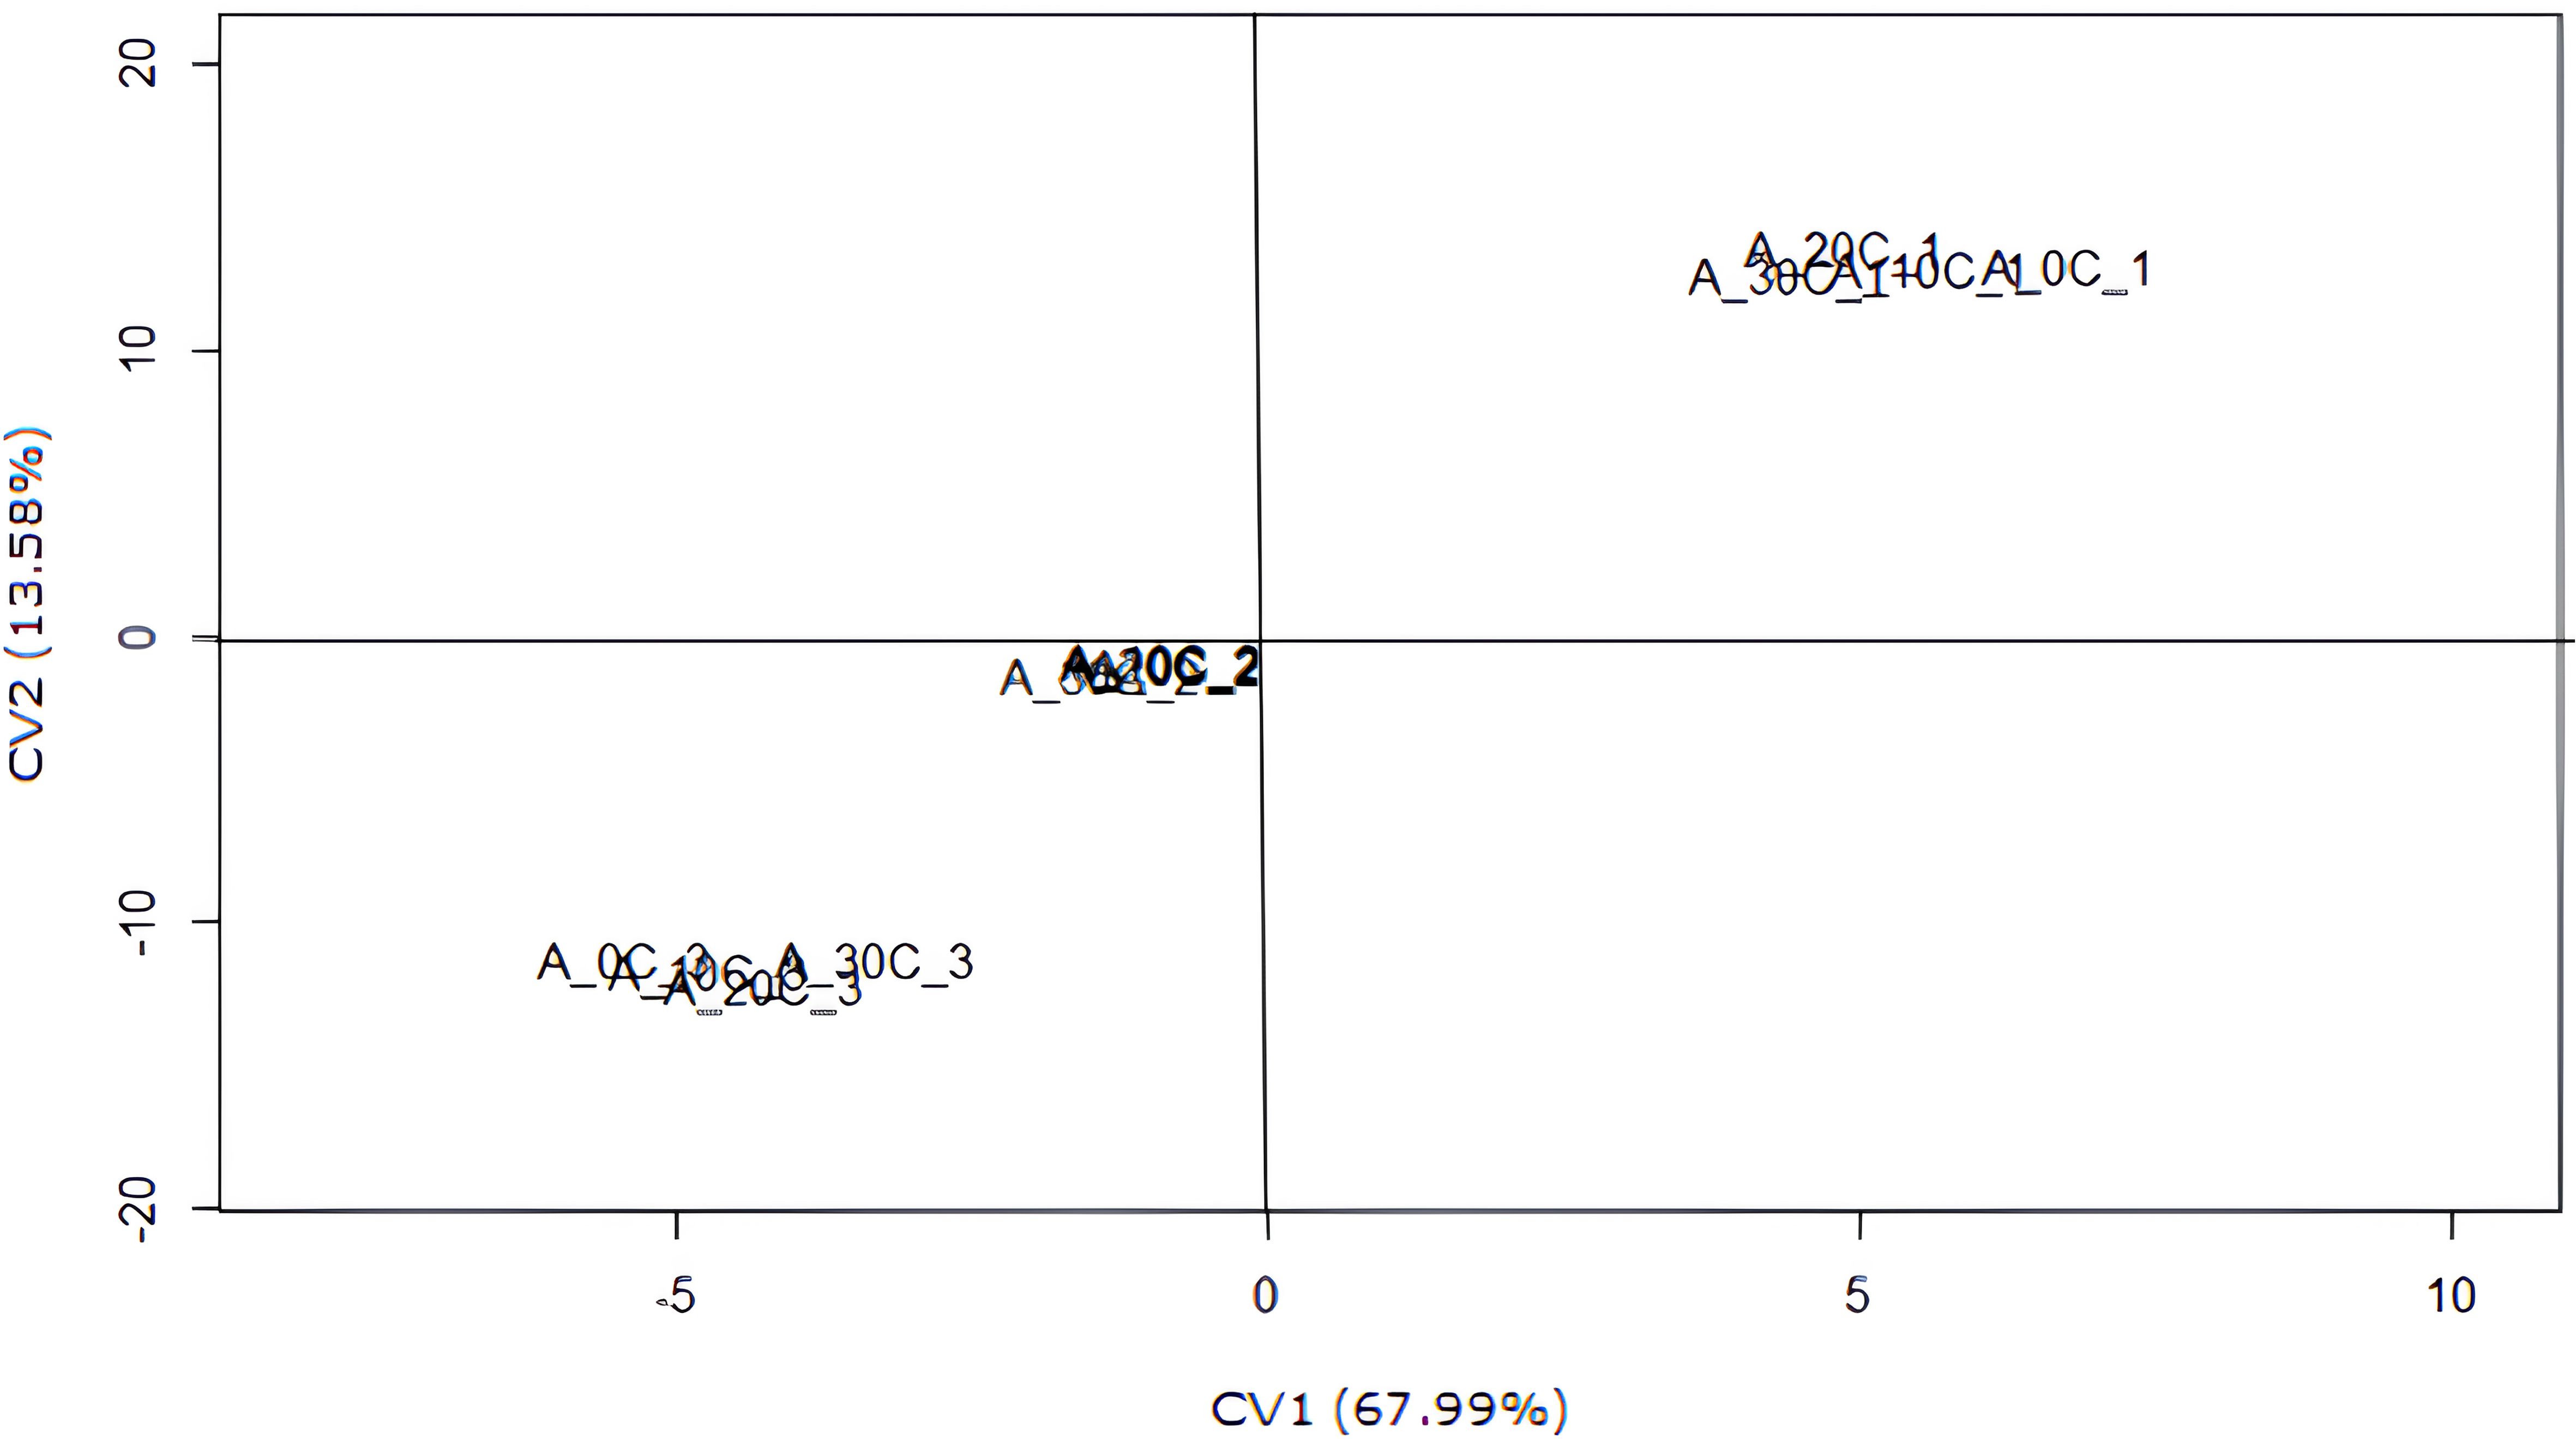
Figure 3. Scatter plot of scores for the first two canonical variables (CV1 and CV2) as a function of synthetic auxin (AUX) doses and production cycles.
The production variables showed negative correlations between CV1 and bunch weight, average hand weight, average fruit weight, and fruit curvature of the second hand but exhibited a positive correlation with the number of days from flowering to harvest. The CV2 group showed similar results.
In contrast, regarding the production cycles, treatments involving cycle 1 were found in the first quadrant, cycle 2 in the intermediate position, and cycle 3 in the third quadrant. When examining these results alongside the correlations between canonical variables and evaluated variables (Table 4), it became evident that cycle 1 exhibited the lowest estimates for bunch weight, average fruit weight, average hand weight, fruit curvature of the second hand, number of days from planting to harvest, and number of bunches per year. However, as the production cycles progressed, these estimates increased, reaching their peak values in the third cycle.
4 Discussions
The scatter plot (Figure 1) shows that the 0.5 g dose of PBZ for the first and second production cycles is located in the lower quadrant, with the lowest values for production variables such as NHB and NFB, as well as vegetative variables including TLA, PHF, and PCF. This suggests that PBZ inhibits floral differentiation and vegetative growth in ‘Prata-anã’ banana plants at this dosage. This effect is primarily attributed to the inhibition of gibberellin biosynthesis inhibition (Tesfahun, 2018; Chandra and Roychoudhury, 2020; Desta and Amare, 2021).
Banana plants will develop smaller leaves with likely compaction of the leaf rosette due to the reduction in pseudostem height as a result of increasing doses of PBZ (0.0, 0.5, 1.0, 1.5, and 2.0 g per plant) (Cavatte et al., 2012), which may increase the rate of self-shading. These conditions reduce the photosynthetically active area by decreasing the total leaf area, which affects light absorption efficiency. This reduces the photosynthetic efficiency of the plant, resulting in crop yield loss. An increase in leaf count does not necessarily correspond to an increase in leaf area or photosynthetic capacity (Cavatte et al., 2012).
Growth regulators reduce plant tissue growth, causing physical and metabolic effects at the cellular level owing to increased abscisic acid levels (McAdam et al., 2016). Application of PBZ results in increased endogenous levels of abscisic acid (ABA) (Chandra and Roychoudhury, 2020; Desta and Amare, 2021). The presence of ABA in roots also promotes water and ion flow, regulating turgor pressure by increasing the root absorption capacity (Zhang et al., 2016). This physiological response triggered in plant cells may have led to a decrease in the bunch count, fruit number, total leaf area, plant height at flowering, and pseudostem circumference at flowering during the first and second production cycles.
The reduction in vegetative growth, as evidenced by the effects on total leaf area, plant height, and plant circumference, is a widely reported phenomenon in the literature, both for banana crops (Cavatte et al., 2012) and other plant species (Tesfahun, 2018; Chandra and Roychoudhury, 2020; Desta and Amare, 2021). The higher doses of PBZ used in this study not only affected vegetative growth, but also impacted floral differentiation and inflorescence formation, resulting in fewer hands and fruits. However, the lowest dose of PBZ used (0.1 g of active ingredient), particularly in the third production cycle, that is, in the long term, led to an increase in several variables: number of hands, number of fruits, total leaf area, plant height at flowering, and pseudostem circumference at flowering. Thus, the response of the plant to PBZ appears to be linked to the duration of application and dosage used.
The initial production cycle typically results in reduced vegetative growth and plant vigor, leading to lower banana yields, as widely reported in the literature (Aeberli et al., 2023; Marques et al., 2018). This result confirmed that the most significant vegetative growth and yield increase did not occur during the first production cycle. Similar findings were reported by Almeida et al. (2024) and Arantes et al. (2017), who found that the first and second production cycles exhibited substantial differences in vegetative characteristics, with significant changes in plant size, vigor, and yield. The increases in vigor, height, and yield typically peaked in the third cycle, after which they stabilized.
However, it is worth noting that the adjusted yield was not significantly influenced by PBZ in the three evaluated cycles due to the low correlation estimates of this characteristic with the first two canonical variables (CV1 and CV2). This suggests that PBZ did not influence the increased yield of the Prata-Anã banana plant when adjusted for annual values. This occurred because despite the increase in bunch weight, PBZ also extended the production cycle (DPH).
Carbohydrates are produced through photosynthesis and their accumulation forms the foundation of fruit growth (Rossouw et al., 2024; Van Harsselaar et al., 2017). PBZ treatment enhances fruit growth and weight by increasing the carbohydrate content and stimulating enzymatic activities in substance metabolism (Desta and Amare, 2021; Wu et al., 2019).
The reduction in interval of days between bunches (IDB) observed in the first two production cycles may be due to the shortened reproductive period of the banana plants. Higher accumulation of photoassimilates in fruits can accelerate their metabolism, leading to earlier fruit ripening. Fruit development and growth rely on photosynthates transported from the leaves (Sha et al., 2021b; Covarrubias et al., 2021). Rice seedlings treated with PBZ (Dewi, 2016) and Cotton seedlings treated with PBZ (Lakshmanan et al., 2025) allocated fewer photosynthates to vegetative growth, directing more resources toward seed development than control plants. Chlorophyll, a key player in photosynthesis, plays a dual role in the aforementioned process, harvesting light energy and facilitating light-driven charge separation and electron transport.
The increase in chlorophyll content in PBZ-treated plants may result from reduced damage caused by reactive oxygen species (Saleem et al., 2024; Tesfahun, 2018). Regarding total chlorophyll content (A + B), PBZ application in Capsicum annuum and Capsicum chinense plants resulted in 35% higher total chlorophyll levels than in untreated plants (Ferreira et al., 2023). Dewi (2016) observed that black rice plants treated with 25 or 50 ppm PBZ exhibited greener leaves and delayed senescence compared with the control group. This may be attributed to increased levels of oxidative enzymes, which inhibit cellular maturation (Desta and Amare, 2021).
Extended leaf retention can lead to an increased production of photoassimilates, resulting from the expansion of the photosynthetic area of the leaves. This accelerated fruit growth and ripening. In the second production cycle, the plants exhibited enhanced growth and vegetative vigor, resulting in increased leaf area and shorter bunch intervals. However, this leads to greater soil shading and increased competition between the plant clusters. This increased competition may slow the growth of the banana suckers responsible for producing the third bunch (third cycle) owing to shading, thus extending the IDB for the third cycle.
The residual effect of PBZ in soil persists for up to 300 d after application (Silva et al., 2017). This is due to the clay texture of the soil, which can retain this substance for a longer period. Silva et al. (2017) observed PBZ residues in medium-textured soils five months after application. This period is considered the half-life of the product in clay soils. However, in this study, even the lowest dose (0.1 g of active ingredient per plant) showed long-term beneficial effects.
In this study, a PBZ dose of 0.5 g the active ingredient led to a reduction in yield components during the first cycle of ‘Prata-Anã’ banana. In a study conducted by Cavatte et al. (2012) on ‘Prata-Anã’ bananas, five PBZ concentrations were tested (0.0, 0.5, 1.0, 1.5, and 2.0 g per plant). These researchers observed that a dose of 0.48 g of active ingredient produced fruits classified as premium grades (diameter ≥ 34 mm). Cavatte et al. (2012) also noted that bunch weight in ‘Prata-Anã’ banana plants treated with 2.0 g of paclobutrazol plant-1 decreased by approximately 530 g per bunch compared with the control.
The shortest IDB observed in the second production cycle at the 0.5 g dose suggests an acceleration in vegetative growth and fruit development. There was likely a change in source–sink translocation patterns, directing more photosynthates toward fruit growth, leading to earlier fruit harvest or even increased vegetative growth and vigor. This shift in translocation pattern has been previously reported in other species (Desta and Amare, 2021). The PBZ dose that yielded the highest production values was 0.1 g a.i. (active ingredient) per plant in the third cycle. This dosage also positively affected plant growth, increased leaf area, and consequently enhanced photosynthate production for fruit development, resulting in heavier fruits, hands, and bunches.
No relevant effects of auxin on the studied variables were observed. The reproductive cycle pattern (number of days between flowering and harvest) indicates the impact of production cycles, and consequently, the optimal growth and fruiting conditions of the plant clusters in reducing the interval between flowering and harvest. Over time, soil fertility improves owing to regular fertilization, and the transplant shock in fruit-bearing seedlings is reduced.
The first two production cycles showed differences in vegetative and productive characteristics, resulting in increased plant size, vigor, and yield. This increase in vegetative and production characteristics typically peaks by the fourth cycle, at which point it stabilizes (Marques et al., 2018) or declines depending on cultivation conditions, requiring renewal of the banana plantation in subsequent cycles.
5 Conclusions
As the production cycles progressed, there was an increase in bunch weight, average hand weight, average fruit weight, fruit curvature of the second hand, days from flowering to harvest, days from planting to harvest, and number of bunches per year, along with a decrease in the interval between bunches. The recommended paclobutrazol dose for Prata-Anã banana production is 0.1 g of active ingredient per plant. There is no consistency or reproducibility in the effects of paclobutrazol products across production cycles. The 2,4-D doses did not affect fruit production characteristics.
Data availability statement
The raw data supporting the conclusions of this article will be made available by the authors, without undue reservation.
Author contributions
LC: Methodology, Supervision, Writing – original draft, Writing – review & editing. VM: Methodology, Supervision, Writing – original draft, Writing – review & editing. AM: Methodology, Supervision, Writing – original draft, Writing – review & editing. EA: Methodology, Supervision, Writing – original draft, Writing – review & editing. SL: Supervision, Writing – review & editing. MC: Writing – review & editing.
Funding
The author(s) declare that financial support was received for the research and/or publication of this article. The authors would like to thank the financial support provided by the Minas Gerais Research Foundation (FAPEMIG), the National Council for Scientific and Technological Development (CNPq), and the Coordination for the Improvement of Higher Education Personnel (CAPES) through grants and funding. This work was carried out under the postgraduate program Semiarid Plant Production.
Conflict of interest
The authors declare that the research was conducted in the absence of any commercial or financial relationships that could be construed as a potential conflict of interest.
Generative AI statement
The author(s) declare that no Generative AI was used in the creation of this manuscript.
Publisher’s note
All claims expressed in this article are solely those of the authors and do not necessarily represent those of their affiliated organizations, or those of the publisher, the editors and the reviewers. Any product that may be evaluated in this article, or claim that may be made by its manufacturer, is not guaranteed or endorsed by the publisher.
References
Aeberli A., Phinn S., Johansen K., Robson A., and Lamb D. W. (2023). Characterisation of banana plant growth using high-spatiotemporal-resolution multispectral UAV imagery. Remote Sens. 15, 679. doi: 10.3390/rs15030679
Akour I., Rahamneh A. A. L., Al Kurdi B., Alhamad A., Al-Makhariz I., Alshurideh M., et al. (2023). Using the canonical correlation analysis method to study students’ levels in face-to-face and online education in Jordan. Inf. Sci. Lett. 12, 901–910. doi: 10.18576/isl/120229
Almeida F. P. D., Santos M. R. D., Coelho E. F., Donato S. L. R., Oliveira P. M. D., Reis J. B. R. D. S., et al. (2024). Irrigation of ‘Prata-anã’ Banana with partial root-zone drying in a semi-arid environment. Agronomy 14, 1820–17. doi: 10.3390/agronomy14081820
Arantes A. M., Donato S. L. R., Silva T. S., Rodrigues Filho V. A., and Amorim E. P. (2017). Agronomic evaluation of banana plants in three production cycles in southwestern state of Bahia. Rev. Bras. Fruticultura 39, 1–12. doi: 10.1590/0100-29452017990
Cavatte R. P. Q., Salomão L. C. C., Siqueira D. L., Peternelli L. A., and Cavatte P. C. (2012). Redução do porte e produção das bananeiras ‘Prata-Anã’ e ‘FHIA-01’ tratadas com paclobutrazol [Size reduction and production of ‘Prata-Anã’ and ‘FHIA-01’ banana trees treated with paclobutrazol. Rev. Bras. Fruticultura 34, 356–365. doi: 10.1590/S0100-29452012000200007
Chandra S. and Roychoudhury A. (2020). Penconazole paclobutrazol, and triacontanol in overcoming environmental stress in plants, in Protective Chemical Agents in the Amelioration of Plant Abiotic Stress: biochemical and molecular perspectives, 510–534. doi: 10.1002/9781119552154.ch26
Chen S., Wang X. J., Tan G. F., Zhou W. Q., and Wang G. L. (2020). Gibberellin and the plant growth retardant Paclobutrazol altered fruit shape and ripening in tomato. Protoplasma 257, 853–861. doi: 10.1007/s00709-019-01471-2
Covarrubias M. P., Lillo-Carmona V., Melet L., Benedetto G., Andrade D., Maucourt M., et al. (2021). Metabolite fruit profile is altered in response to source–sink imbalance and can be used as an early predictor of fruit quality in nectarine. Front. Plant Sci. 11. doi: 10.3389/fpls.2020.604133
Desta B. and Amare G. (2021). Paclobutrazol as a plant growth regulator. Chem. Biol. Technol. Agric. 8, 1–15. doi: 10.1186/s40538-020-00199-z
Dewi K. (2016). Effects of blue light and paclobutrazol on seed germination, vegetative growth and yield of black rice (Oryza Sativa L. ‘Cempo Ireng’). Biotropia 23, 85–96. doi: 10.11598/btb.2016.23.2.478
Donato S. L. R., Borém A., and Rodrigues M. G. V. (2021a). “Banana: do plantio à colheita [Banana: from planting to harvest,” in Aspectos da ecofisiologia, fenologia e produção [Aspects of ecophysiology, phenology and production. Eds. Borges A. L. and Cordeiro Z. J. M. C. (Belo Horizonte: EPAMIG), 45–76.
Donato S. L. R., Borém A., and Rodrigues M. G. V. (2021b). “Banana: do plantio à colheita [Banana: from planting to harvesting,” (Belo Horizonte: Epamig).
Fenn M. A. and Giovannoni J. J. (2021). Phytohormones in fruit development and maturation. Plant J. 105, 446–458. doi: 10.1111/tpj.15112
Ferreira T., dos S., Pêgo R. G., Silva K. A. L., Xavier M. C. G., and do Carmo M. G. F. (2023). Efeitos do Paclobutrazol na produção e qualidade de pimenteiras de vaso com potencial ornamental [Effects of Paclobutrazol on the production and quality of potted pepper trees with ornamental potential. DELOS: Desarrollo Local Sostenible 16, 1382–1401. doi: 10.55905/rdelosv16.n44-025
Fuentes L., Figueroa C. R., and Valdenegro M. (2019). Recent advances in hormonal regulation and cross-talk during non-climacteric fruit development and ripening. Horticulturae 5, 45. doi: 10.3390/horticulturae5020045
Gollagi S. G., Jasmitha B. G., and Sreekanth H. S. (2019). A review on: Paclobutrazol a boon for fruit crop production. J. Pharmacognosy Phytochem. 8, 2686–2691. Available at: https://www.researchgate.net/publication/343610558. (Accessed January 07, 2025).
Lakshmanan S., Somasundaram S., Shri Rangasami S., Anantharaju P., Vijayalakshmi D., Ragavan T., et al. (2025). Managing cotton canopy architecture for machine picking cotton via high plant density and plant growth retardants. J. Cotton Res. 8, 2. doi: 10.1186/s42397-024-00202-0
Majda M. and Robert S. (2018). The role of auxin in cell wall expansion. Int. J. Mol. Sci. 19, 951. doi: 10.3390/ijms19040951
Manmohan L., Yachna S., Amanpreet K., and Amit K. (2023). Effectiveness of paclobutrazol to augment fruits production – A review. Environ. Ecology. 41, 13–22.
Marques P. R. R., Donato S. L. R., José A. R. S., and Rosa R. C. C. (2018). Gas exchange and yield of Prata-type banana plants with fertilizer sources for organic management. Afr. J. Agric. Res. 13, 272–280. doi: 10.5897/AJAR2017.12896
McAdam S. A., Brodribb T. J., and Ross J. J. (2016). Shoot-derived abscisic acid promotes root growth. Plant Cell Environment Oxford 39, 652–659. doi: 10.1111/pce.12669
Rademacher W. (2018). 12 Chemical regulators of gibberellin status and their application in plant production. Annu. Plant Rev. Online 49, 359–403. doi: 10.1002/9781119312994.apr0541
R Core Team (2019). A language and environment for statistical computing (Vienna, Austria: R Foundation for Statistical Computing). Available at: http://www.Rproject.org/. (Accessed July 22, 2024).
Rossouw G. C., Orr R., Bennett D., and Bally I. S. (2024). The roles of non-structural carbohydrates in fruiting: a review focusing on mango (Mangifera indica). Funct. Plant Biol. 51. doi: 10.1071/FP23195
Saleem K., Asghar M. A., Raza A., Pan K., Ullah A., Javed H. H., et al. (2024). Alleviating drought stress in strawberry plants: unraveling the role of paclobutrazol as a growth regulator and reducer of oxidative stress induced by reactive oxygen and carbonyl species. J. Plant Growth Regul. 43, 3238–3253. doi: 10.1007/s00344-023-11120-x
Santos H. G., Jacomine P. K. T., Anjos L. H. C., Oliveira V. A., Lumbreras J. F., Coelho M. R., et al. (2018). Brazilian soil classification system. 5. ed (Brasília, DF: Embrapa).
Sha J., Ge S., Zhu Z., Du X., Xhang X., Ge T., et al. (2021a). Paclobutrazol regulates hormone carbon-nitrogen nutrition of autumn branches, improves fruit quality enhances storage nutrition in ‘Fuji’ apple. Scientia Hortic. 282, 16–27. doi: 10.1016/j.scienta.2021.110022
Sha J., Wang F., Chen Q., Jia Z., Du X., Ge S., et al. (2021b). Characteristics of photoassimilates transportation and distribution to the fruits from leaves at different branch positions in apple. J. Plant Growth Regul. 40, 1222–1232. doi: 10.1007/s00344-020-10182-5
Silva P. T. S., Souza L. S. S., Rodrigues Neta C. R., Mouco M. A., Simoes W., and Ferraz A. (2017). Análise de paclobrutrazol em solos de áreas cultivadas com variedades de mangueira no Vale do São Francisco empregando QuEcHers e CLAE [Analysis of paclobrutrazol in soils from areas cultivated with different mango varieties in the São Francisco Valley using QuEcHers and CLAE. Scientia Plena 13. doi: 10.14808/sci.plena.2017.097201
Tesfahun W. (2018). A review on: Response of crops to paclobutrazol application. Cogent Food Agric. 4, 1–9. doi: 10.1080/23311932.2018.1525169
Tian S., Zhang Z., Qingenji Z., and Xu Q. (2023). Parthenocarpy in cucurbitaceae: advances for economic and environmental sustainability. Plants 12, 3462. doi: 10.3390/plants12193462
Van Harsselaar J. K., Lorenz J., Senning M., Sonnewald U., and Sonnewald S. (2017). Genome-wide analysis of starch metabolism genes in potato (Solanum tuberosum L.). BMC Genomics 18, 1–18. doi: 10.1186/s12864-016-3381-z
Wu Y., Sun M., and Yipining X. (2019). Differential effects of paclobutrazol on the bulblet growth of oriental lily cultured in vitro: growth behavior, carbohydrate metabolism, and antioxidant capacity. J. Plant Growth Regul. 38, 359–372. doi: 10.1007/s00344-018-9844-5
Zhang J., Yu H., Zhang Y., Wang Y., Maoying L., Zhang J., et al. (2016). Increased abscisic acid levels in transgenic maize overexpressing AtLOS5 mediated root ion fluxes and leaf water status under salt stress. J. Exp. Bot. 67, 1339–1355. Available at: https://academic.oup.com/jxb/article/67/5/1339/2885042. (Accessed June 10, 2024).
Keywords: Musa spp., growth regulator, plant hormone, production, fruit quality
Citation: Maia LCB, Maia VM, Azevedo AM, Ferreira EA, Donato SLR and Pereira MCT (2025) ‘Prata Anã’ banana under application of paclobutrazol on soil and 2,4-D in the inflorescence in three production cycles: multivariate approach. Front. Agron. 7:1568126. doi: 10.3389/fagro.2025.1568126
Received: 28 January 2025; Accepted: 16 May 2025;
Published: 09 June 2025.
Edited by:
Anchal Dass, Indian Council of Agricultural Research (ICAR), IndiaReviewed by:
Prabhu Govindasamy, National Research Centre for Banana (ICAR), IndiaRishi Raj, Indian Agricultural Research Institute (ICAR), India
Copyright © 2025 Maia, Maia, Azevedo, Ferreira, Donato and Pereira. This is an open-access article distributed under the terms of the Creative Commons Attribution License (CC BY). The use, distribution or reproduction in other forums is permitted, provided the original author(s) and the copyright owner(s) are credited and that the original publication in this journal is cited, in accordance with accepted academic practice. No use, distribution or reproduction is permitted which does not comply with these terms.
*Correspondence: Leonardo Carvalho Brant Maia, bGVvbmFyZG9icmFudDAxQGdtYWlsLmNvbQ==
†ORCID: Leonardo Carvalho Brant Maia, orcid.org/0000-0001-5125-3268
Victor Martins Maia, orcid.org/0000-0002-6624-8805
Alcinei Mistico Azevedo, orcid.org/0000-0001-5196-0851
Evander Alves Ferreira, orcid.org/0000-0003-4701-6862
Sérgio Luiz Rodrigues Donato, orcid.org/0000-0002-7719-4662
Marlon Cristian Toledo Pereira, orcid.org/0000-0003-1691-0466