 Thanet Khomphet
 Yong Zhao
- 1School of Agricultural Technology and Food Industry, Walailak University, Nakhon Si Thammarat, Thailand
- 2Food Technology and Innovation Research Center of Excellence, School of Agricultural Technology and Food Industry, Walailak University, Nakhon Si Thammarat, Thailand
- 3College of Food Science and Technology, Shanghai Ocean University, Shanghai, China
Salinity is one of the most detrimental environmental stresses, significantly reducing rice yield and quality. Salinity tolerant varieties are crucial for rice production in Southern Thailand. The objectives of this study were: 1) to examine the response on growth, yield, and leaf nutrient composition of 10 indigenous rice varieties from Nakhon Si Thammarat Province under salinity conditions, and 2) to identify varieties capable of surviving and producing yield under saline conditions. The experiment was designed as a factorial arrangement in a completely randomized design with two factors. The first factor was the salinity level of irrigation water, consisting of 0.0%, 0.4%, and 0.8% salinity. The second factor was the indigenous rice varieties, which included Dok Kha, Hom Bon, Dawk Pa-yawm, Luk Lai, Leb Nok, Leuang, Banpeang, Chorlumpee, Sang Yot (Tha Sala), and Sang Yot (Bang Khan). Significant differences were observed across salinity levels and among rice varieties for most traits. All rice varieties experienced substantial reductions in growth when exposed to higher salinity levels. The principal component analysis revealed that rice varieties exhibited varying responses in agronomic traits, yield traits, and leaf nutrients under different salinity conditions. Based on their ability to survive in saline environments and yield production, Luk Lai, Leb Nok, and Sang Yot (Bang Khan) are recommended for farmers for future production on saline soils.
1 Introduction
Rice (Oryza sativa L.) is one of the world’s most vital crops, feeding approximately half of the global population. It holds immense global significance, providing over 21% of the calories consumed by humans and up to 76% of the caloric intake in Southeast Asia (Hussain et al., 2021; Mohidem et al., 2022). In Asia alone, more than 2 billion people derive 80% of their energy from rice. Nutritionally, rice comprises 80% carbohydrates, 7-8% protein, 3% fat, and 3% fiber (Chaudhari et al., 2018). As one of the leading rice producers globally, Thailand harvested 19.5 million metric tons of rice in the 2021/22 market year, reflecting a 4% increase from the previous year. This growth was largely attributed to favorable seasonal rains that supported early planting and crop development (Foreign Agricultural Service, 2021). Thailand cultivates a diverse range of over 100 rice varieties, including hybrid, lowland, indigenous, and upland types.
Nakhon Si Thammarat Province is the largest rice-growing region in southern Thailand, accounting for approximately 27,671 hectares of rice cultivation—28.56% of the total rice-growing area in the southern region, which spans about 100,000 hectares (Office of Agricultural Economics, 2022). The primary rice-growing region in Nakhon Si Thammarat is the Pak Phanang River Basin, where indigenous rice has been cultivated for over a century (Summpunn et al., 2022). However, rice cultivation in this province has faced several challenges in recent years, including flooding during the rainy season, water shortages during the dry season, low soil fertility due to imbalanced nutrient management, and soil salinization from seawater intrusion.
Salinity is one of the most severe environmental stresses, significantly reducing agricultural productivity and quality worldwide. More than 20% of the world’s arable land is affected by salinity, and this figure continues to grow due to both natural and anthropogenic factors (Hasanuzzaman and Fujita, 2022). Salt stress disrupts plant growth and development by increasing osmotic pressure and promoting the accumulation of harmful sodium ions. Similar to other abiotic stressors, salinity can impair plant development and reproduction, resulting in ion toxicity, oxidative and osmotic stress, nutrient and hormonal imbalances, and increased susceptibility to diseases (Zhao et al., 2021). In rice, salinity stress significantly impacts growth, development, and grain yield, making the enhancement of salt tolerance a critical strategy for meeting the rising global demand for food. Approximately 50% of irrigated soils are affected by sodium (Na+) and chloride (Cl−) ions, which are the primary contributors to salt toxicity. Plant responses to salinity are complex, involving ionic homeostasis, osmotic adjustment, reactive oxygen species scavenging, and nutrient balance, occurring at the organismic, cellular, and molecular levels (Liu et al., 2022).
The current study aims to 1) assess the response on growth, yield, and leaf nutrient composition of 10 indigenous rice varieties from Nakhon Si Thammarat Province under salinity conditions, and 2) identify varieties that can survive and produce yield under such conditions. The findings of this study will provide recommendations to rice farmers in salt-affected coastal areas of Thailand and offer valuable insights for breeders and researchers engaged in future breeding programs.
2 Materials and methods
2.1 Experimental details
The experiment was done at the greenhouse of School of Agricultural Technology and Food Industry (8°38’44.1”N 99°54’04.7”E), Walailak University, Nakhon Si Thammarat Province. The investigation was arranged as a factorial experiment in a completely randomized design with 2 factors. The first factor was the salinity level of irrigation water including 1) 0.0% salinity (electrical conductivity (at 25°C): EC = 0.13 dS m-1), 2) 0.4% salinity (EC = 1.42 dS m-1), and 0.8% salinity (EC = 2.85 dS m-1). The second factor was indigenous rice varieties including 1) Dok Kha (V1), 2) Hom Bon (V2), 3) Dawk Pa-yawm (V3), 4) Luk Lai (V4), 5) Leb Nok (V5), 6) Leuang (V6), 7) Banpeang (V7), 8) Chorlumpee (V8), 9) Sang Yot (Tha Sala) (V9), and 10) Sang Yot (Bang Khan) (V10). There were 30 experimental units in all, with 10 replications per unit. The rice varieties were selected according to their popularity and planting areas. Rice seeds were sown in the 12-inch plastic plot with holes at the base to allow free drainage and clay loam soil from rice planting field in Nakhon Si Thammarat Province was used as a planting medium. Soil properties were clay = 38%, silt =27%, sand =35%, pH = 6.5, organic matter = 2.9%, EC = 0.18 dS m-1, sodium absorption ratio = 6, exchangeable sodium percentage = 12.3%, total nitrogen = 0.38%, available phosphorus = 12.56 mg kg-1, and exchangeable potassium = 192.12 mg kg-1. A month following germination, rice seedlings were applied irrigation water with different salinity levels three times a day (8 am, 2 pm, and 5 pm), one litter at a time, using a drip irrigation system. Sodium chloride solution was used to regulate salinity. The water quality was pH = 7, electrical conductivity = 0.2 dS m-1, total dissolve solid = 300 mg L-1, sodium absorption ratio = 7.2, and temperature = 31°C. The experiment was conducted between January and April 2024. During the experiment, January was observed to be the highest rainfall, relative humidity, and lowest temperature at 137.2 mm, 86.3%, and 33.5°C, respectively, while April was lowest of rainfall, relative humidity, and highest temperature at 0.0 mm, 75.6%, and 38.4°C, respectively.
2.2 Dada collection and analysis
Data collection encompassed agronomic traits, yield traits, and nutrient accumulation in leaves. The agronomic traits were record at the first day of flowering stage (~60 days after planting) included plant height, stem diameter, leaf width, leaf length, tiller number, panicle number, and panicle length. The yield traits were assessed from mature panicle (~30 days after flowering) through seed count per panicle, percentage of viable seeds, seed weight per panicle, 1,000-seed weight, and seed yield per plant. Nutrient accumulation in mature leaves from flowering stage was analyzed using a micro-X-ray Fluorescence (micro-XRF) Spectrometer, model M4 Tornado (Bruker Co. Ltd.). Data variation was analyzed through ANOVA. The correlation coefficient and principal component analysis were performed using the psych and ggbiplot packages (Revelle, 2024; Vu et al., 2024). Mean comparisons were conducted using Duncan’s multiple range test with the agricolae package (De Mendiburu, 2023), and significance levels reported at p<0.05 or p<0.01. All statistical analyses were done by R program version 4.2.3.
3 Results
3.1 Analysis of variance results
Analysis of variance for agronomic and yield traits of indigenous rice is presented in Table 1. Significant differences were observed across salinity levels for most traits, with the exception of panicle number. Among rice varieties, significant differences were also noted for most traits, except for plant height, stem diameter, leaf length, and 1,000-seed weight. A significant interaction between salinity levels and rice varieties was found for leaf width, tiller number, panicle number, panicle length, seeds per panicle, percentage of viable seeds, seed weight per panicle, and seed yield per plant. The coefficient of variation (CV) ranged from 7.49% to 38.24%, with the lowest and highest CVs observed for percentage of viable seeds and seed yield per plant, respectively.
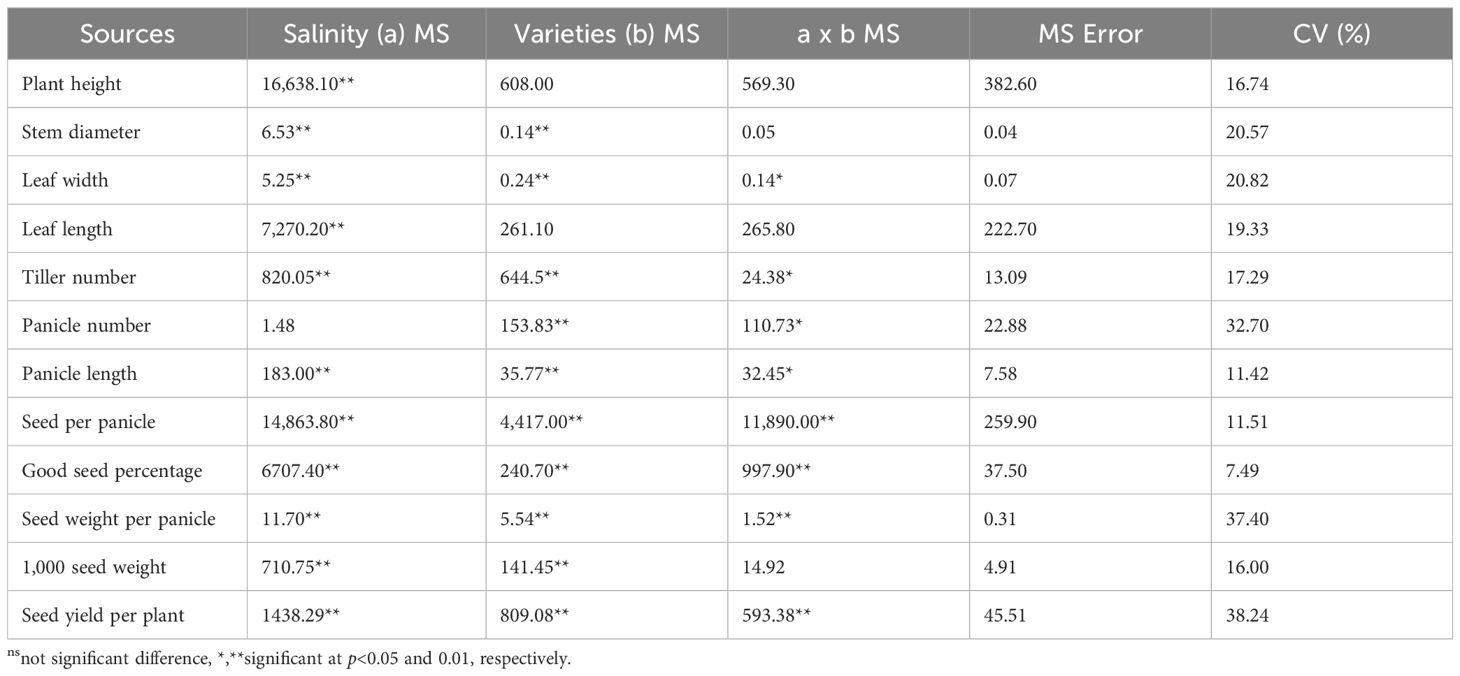
Table 1. Analysis of variance of agronomic and yield traits of indigenous rice planted under different salinity levels.
Analysis of variance for leaf nutrient accumulation is presented in Table 2. All measured leaf nutrients—phosphorus, sulfur, chlorine, potassium, calcium, manganese, iron, and nickel—showed significant differences among salinity levels (p<0.01) and rice varieties (p<0.01). Additionally, a highly significant interaction between salinity levels and rice varieties was observed for all leaf nutrients (p<0.01).
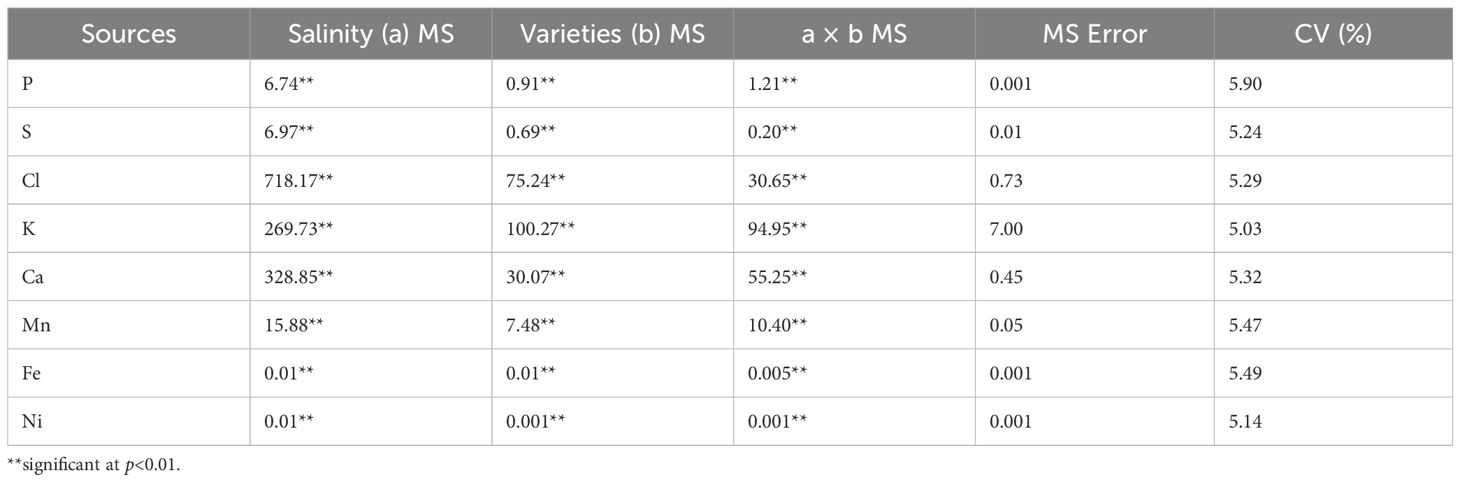
Table 2. Analysis of variance of leaf nutrients of indigenous rice planted under different salinity levels using micro-XRF Spectrometer.
3.2 Agronomic traits of indigenous rice
The comparison of agronomic traits for indigenous rice varieties is presented in Table 3, while Figure 1 illustrated the rice characteristics at the vegetative stage under varying salinity levels. All rice varieties were drastically reduced in their growth when treated with higher salinity levels. On average, plant height across 10 rice varieties was greater at salinity levels of 0.0% (129.50 cm) and 0.4% (125.13 cm) compared to 0.8% salinity (95.94 cm). The tallest variety, Hom Bon, reached 147.36 cm at 0.0% salinity, whereas the shortest variety, Dawk Pa-yawm, measured 63.20 cm at 0.8% salinity. At the 0.4% salinity level, plant height decreased by 2.71%, with Sang Yot (Bang Khan) showing the greatest reduction (-13.87%). In contrast, Luk Lai (8.65%), Leuang (3.78%), and Chorlumpee (10.56%) exhibited an increase in plant height. At the 0.8% salinity level, plant height decreased significantly by 20.65%, with Hom Bon (-26.23%) and Sang Yot (Bang Khan) (-26.98%) showing the highest percentage reductions compared to the 0.0% salinity level. Similarly, the average stem diameter was highest at 0.0% salinity (1.38 cm), followed by 0.4% (1.03 cm), with the smallest stem diameter recorded at 0.8% salinity (0.65 cm). Variety Leuang at 0.0% salinity exhibited the largest stem diameter (1.6 cm), while Dawk Pa-yawm at 0.8% salinity had the smallest (0.35 cm). At the 0.4% salinity level, stem diameter decreased by 22.78%, with Dawk Pa-yawm (-32.91%) and Leuang (-33.97%) recording the largest reductions. At the 0.8% salinity level, stem diameter further decreased by 48.29%, with Dawk Pa-yawm (-57.09%) and Banpeang (-58.57%) showing the highest percentage decreases relative to the 0.0% salinity.
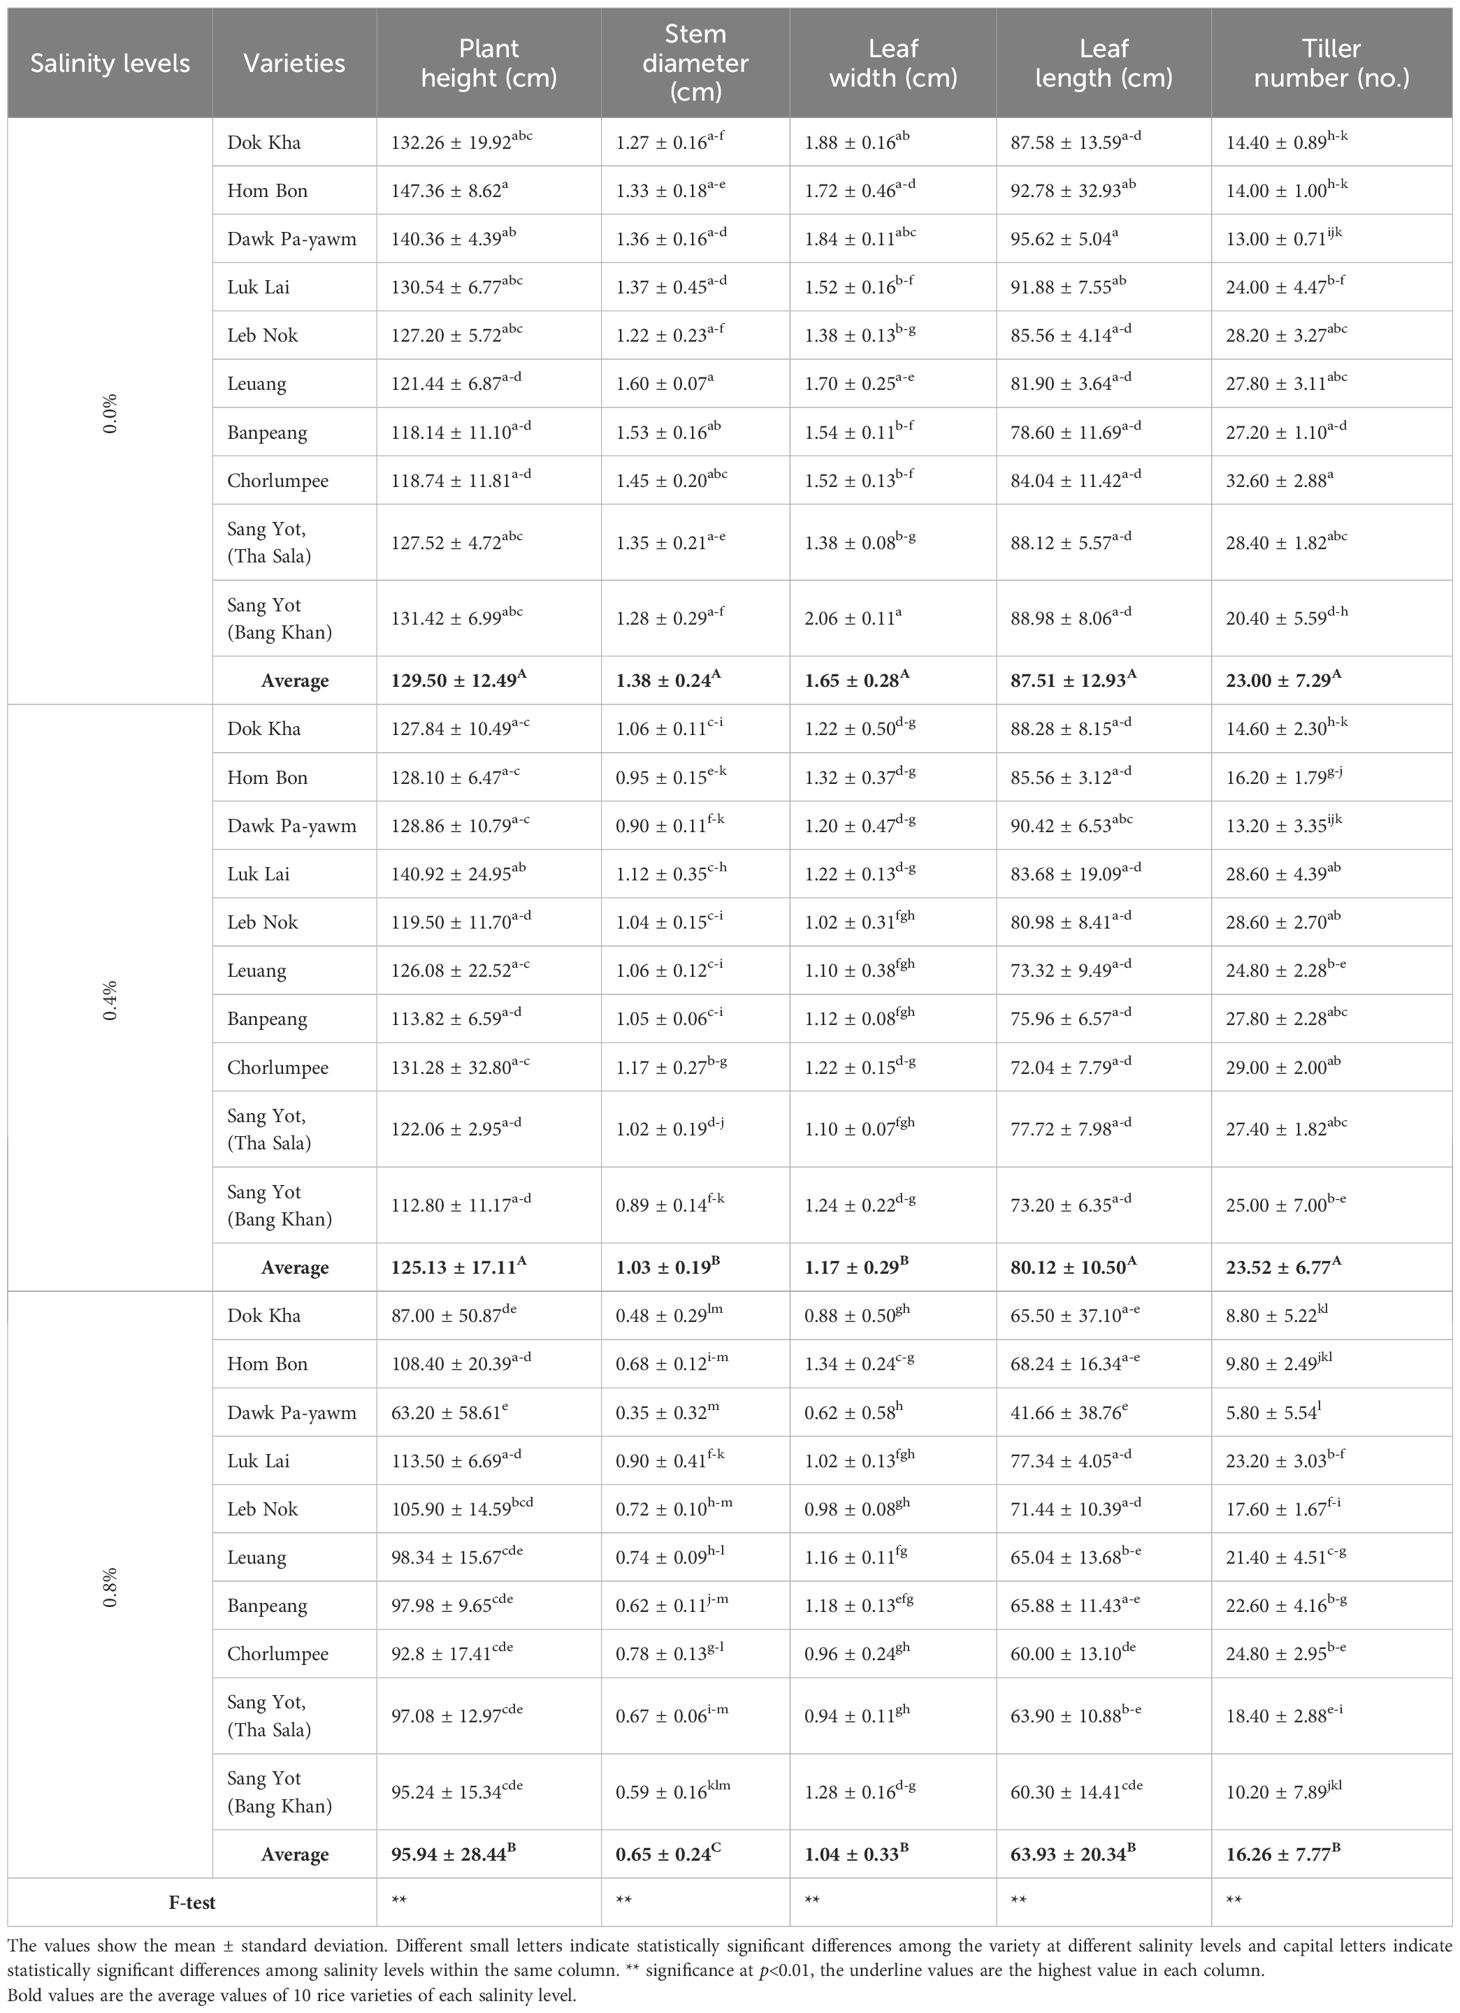
Table 3. Mean comparison on agronomic traits of indigenous rice planted under different salinity levels.
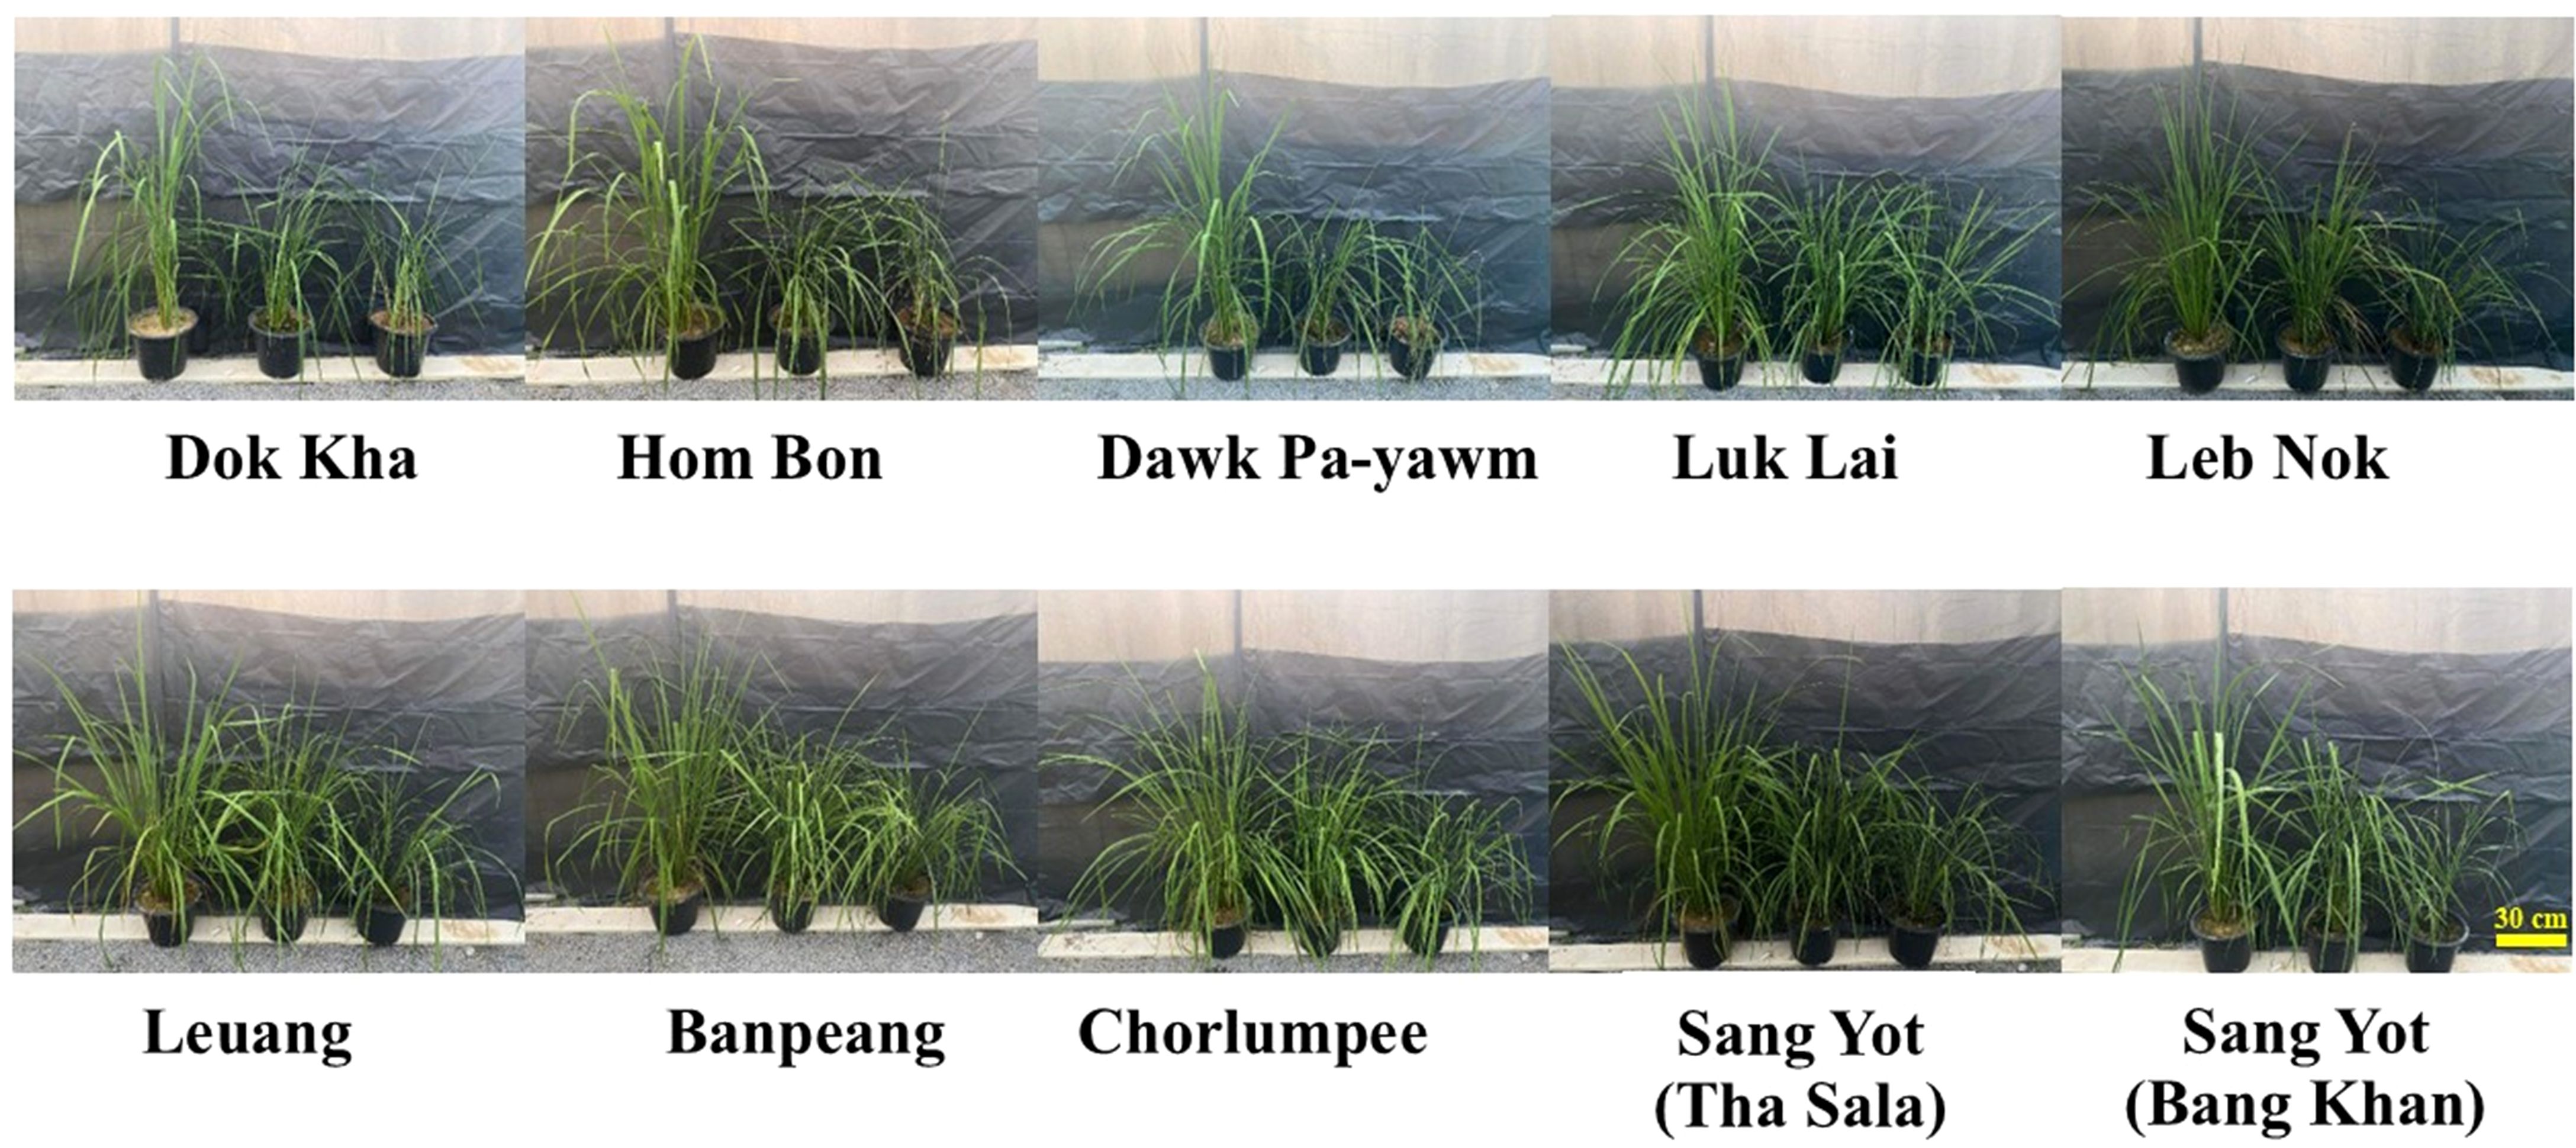
Figure 1. Indigenous rice characteristics at vegetative stage (1 month old) planted under different salinity levels. Left: 0.0% salinity, middle: 0.4% salinity, and right: 0.8% salinity.
Leaf width was also influenced by salinity, with the average leaf width being largest at 0.0% salinity (1.65 cm). The leaf widths at 0.4% and 0.8% salinity were 1.17 cm and 1.04 cm, respectively. At the 0.4% salinity level, leaf width declined by 26.48%, with Dok Kha (-34.98%), Dawk Pa-yawm (-34.34%), and Sang Yot (Bang Khan) (-39.73%) having the greatest reductions. Similarly, at the 0.8% salinity level, leaf width decreased by 31.59%, with Dok Kha (-39.91%), Dawk Pa-yawm (-40.03%), and Sang Yot (Bang Khan) (-37.68%) showing the largest decline compared to the 0.0% salinity. Variety Sang Yot (Bang Khan) at 0.0% salinity exhibited the widest leaf (2.06 cm), while Dawk Pa-yawm at 0.8% salinity had the narrowest (0.62 cm). In terms of leaf length, the average at 0.0% (95.62 cm) and 0.4% salinity (91.17 cm) was longer than at 0.8% salinity (63.93 cm). The longest leaf was observed in Dawk Pa-yawm at 0.0% salinity (95.62 cm), while the shortest was also in Dawk Pa-yawm at 0.8% salinity (41.66 cm). At the 0.4% salinity level, leaf length decreased by 6.14%, with Chorlumpee (-13.10%) and Sang Yot (Bang Khan) (-17.23%) showing the highest percentage reductions, while Dok Kha (2.60%) and Hom Bon (9.49%) exhibited slight increases in leaf length. At the 0.8% salinity level, leaf length decreased by 19.27%, with Chorlumpee (-27.01%), Sang Yot (Tha Sala) (-27.40%), and Sang Yot (Bang Khan) (-31.24%) recording the largest reductions compared to the 0.0% salinity.
Finally, tiller number was highest at 0.0% (23.00) and 0.4% salinity (23.52), compared to 16.26 at 0.8% salinity. Variety Chorlumpee at 0.0% salinity had the highest tiller number (32.60), while Dawk Pa-yawm at 0.8% salinity had the lowest (5.80). At the 0.4% salinity level, tiller number increased by 4.97%, with Hom Bon (16.72%), Luk Lai (19.84%), and Sang Yot (Bang Khan) (27.36%) showing the greatest increases, while Leuang (-9.31%) and Chorlumpee (-10.39%) recorded reductions. However, at the 0.8% salinity level, tiller number decreased markedly by 27.01%, with Leb Nok (-36.50%), Sang Yot (Tha Sala) (-34.85%), and Sang Yot (Bang Khan) (-42.50%) showing the highest percentage decreases relative to the 0.0% salinity.
3.3 Yield traits of indigenous rice
The comparison of yield traits for indigenous rice varieties is shown in Table 4. At 0.8% salinity, all rice varieties experienced dehydration and died during the flowering stage. At 0.4% salinity, only varieties Luk Lai, Leb Nok, and Sang Yot (Bang Khan) survived. Across all yield traits, the average performance of the 10 varieties was higher at 0.0% salinity compared to 0.4%, with the exception of panicle number, where no significant difference was observed between the two salinity levels. The highest panicle numbers were recorded for Luk Lai (18.20), Leb Nok (16.60), Leuang (20.60), and Sang Yot (Bang Khan) (20.20) at 0.0% salinity, and for Leb Nok (18.00) and Sang Yot (Bang Khan) (21.00) at 0.4% salinity. The lowest panicle numbers were observed in Banpeang (6.80) and Chorlumpee (6.60) at 0.0% salinity, and in Luk Lai (6.00) at 0.4% salinity.
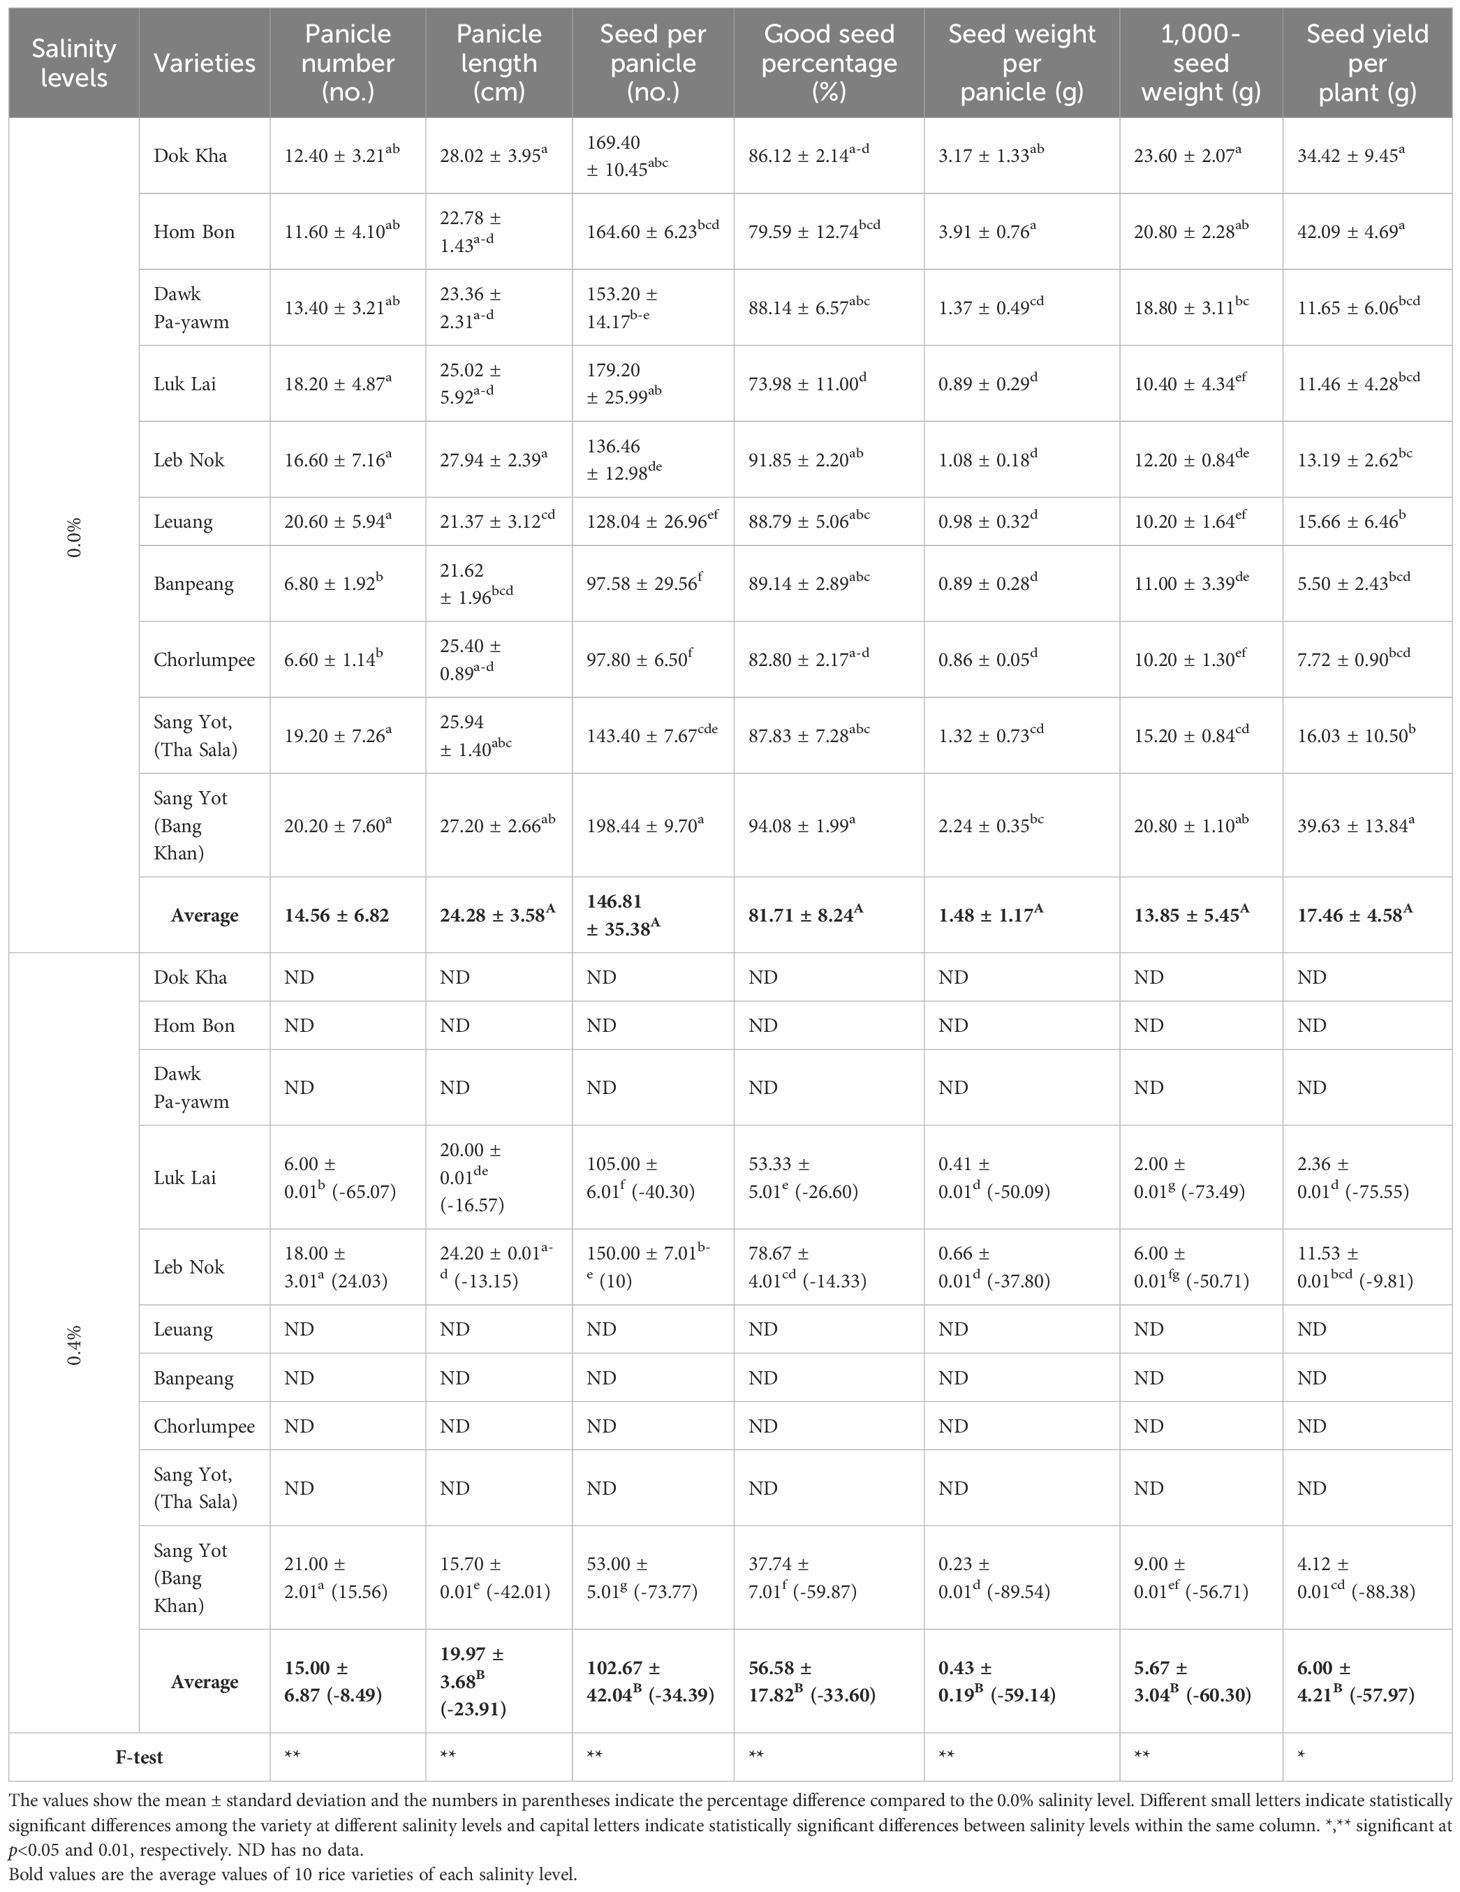
Table 4. Mean comparison on yield traits of indigenous rice planted under different salinity levels.
At 0.0% salinity, Leb Nok exhibited the longest panicle length (27.94 cm), while the shortest was recorded for Sang Yot (Bang Khan) (15.70 cm) at 0.4% salinity. The highest number of seeds per panicle was observed in Sang Yot (Bang Khan) (198.44) at 0.0% salinity, whereas the lowest was also from Sang Yot (Bang Khan) (53.00) at 0.4% salinity. Sang Yot (Bang Khan) recorded the highest percentage of viable seeds (94.08%) at 0.0% salinity, while the lowest percentage (37.76%) was also seen in Sang Yot (Bang Khan) at 0.4% salinity. The heaviest seed weight per panicle was noted in Hom Bon (3.91 g) at 0.0% salinity, with the lowest in Sang Yot (Bang Khan) (0.23 g) at 0.4% salinity. Sang Yot (Bang Khan) achieved the highest 1,000-seed weight (23.60 g) at 0.0% salinity, while the lowest weight (2.00 g) was observed in Luk Lai at 0.4% salinity. In terms of seed yield per plant, Dok Kha (34.42 g), Hom Bon (42.09 g), and Sang Yot (Bang Khan) (39.63 g) at 0.0% salinity had the highest yields, while the lowest yield was recorded in Luk Lai (2.36 g) at 0.4% salinity.
At the 0.4% salinity level, panicle number decreased by 8.49%, with Luk Lai exhibiting the highest reduction (-65.07%). In contrast, Leb Nok (24.03%) and Sang Yot (Bang Khan) (15.56%) showed increases in panicle number. Panicle length decreased by 23.91%, with Sang Yot (Bang Khan) (-23.91%) recording the greatest reduction, followed by Luk Lai (-16.57%) and Leb Nok (-13.15%). The number of seeds per panicle declined by 34.39%, with Sang Yot (Bang Khan) (-73.77%) showing the largest decrease, followed by Luk Lai (-40.30%). Conversely, Leb Nok recorded an increase of 10.00% in seeds per panicle. The percentage of good seeds decreased by 33.60%, with Sang Yot (Bang Khan) (-59.87%) showing the greatest reduction, followed by Luk Lai (-26.60%) and Leb Nok (-14.33%). Seed weight per panicle dropped by 59.14%, with Sang Yot (Bang Khan) (-89.54%) having the highest percentage reduction, followed by Luk Lai (-50.09%) and Leb Nok (-37.80%). The 1,000-seed weight decreased by 60.30%, with Luk Lai (-73.49%) showing the largest reduction, followed by Sang Yot (Bang Khan) (-56.71%) and Leb Nok (-50.71%). Seed yield per plant declined by 57.97%, with Sang Yot (Bang Khan) (-88.38%) exhibiting the highest percentage decrease, followed by Luk Lai (-75.55%) and Leb Nok (-9.81%).
3.4 Leaf nutrient analysis using micro-XRF
Figure 2 shows the leaf nutrient levels of indigenous rice planted under different salinity conditions, while Table 5 presents the mean comparison of these nutrient levels. The average leaf phosphorus content across 10 varieties was highest at 0.0% salinity (1.66%), compared to 0.4% and 0.8% salinity (0.82% and 0.86%, respectively). Variety Sang Yot (Bang Khan) recorded the highest phosphorus percentage at 0.0% salinity (2.70%), while the lowest was observed in Sang Yot (Tha Sala) at 0.8% salinity (0.25%). For leaf sulfur, the highest average percentage was at 0.0% salinity (2.14%), with the lowest at 0.4% salinity (1.27%). Luk Lai at 0.0% salinity exhibited the highest sulfur content (2.88%), while the lowest was seen in Dok Kha (0.86%) and Banpeang (0.84%) at 0.4% salinity, as well as Dok Kha at 0.8% salinity (0.86%).
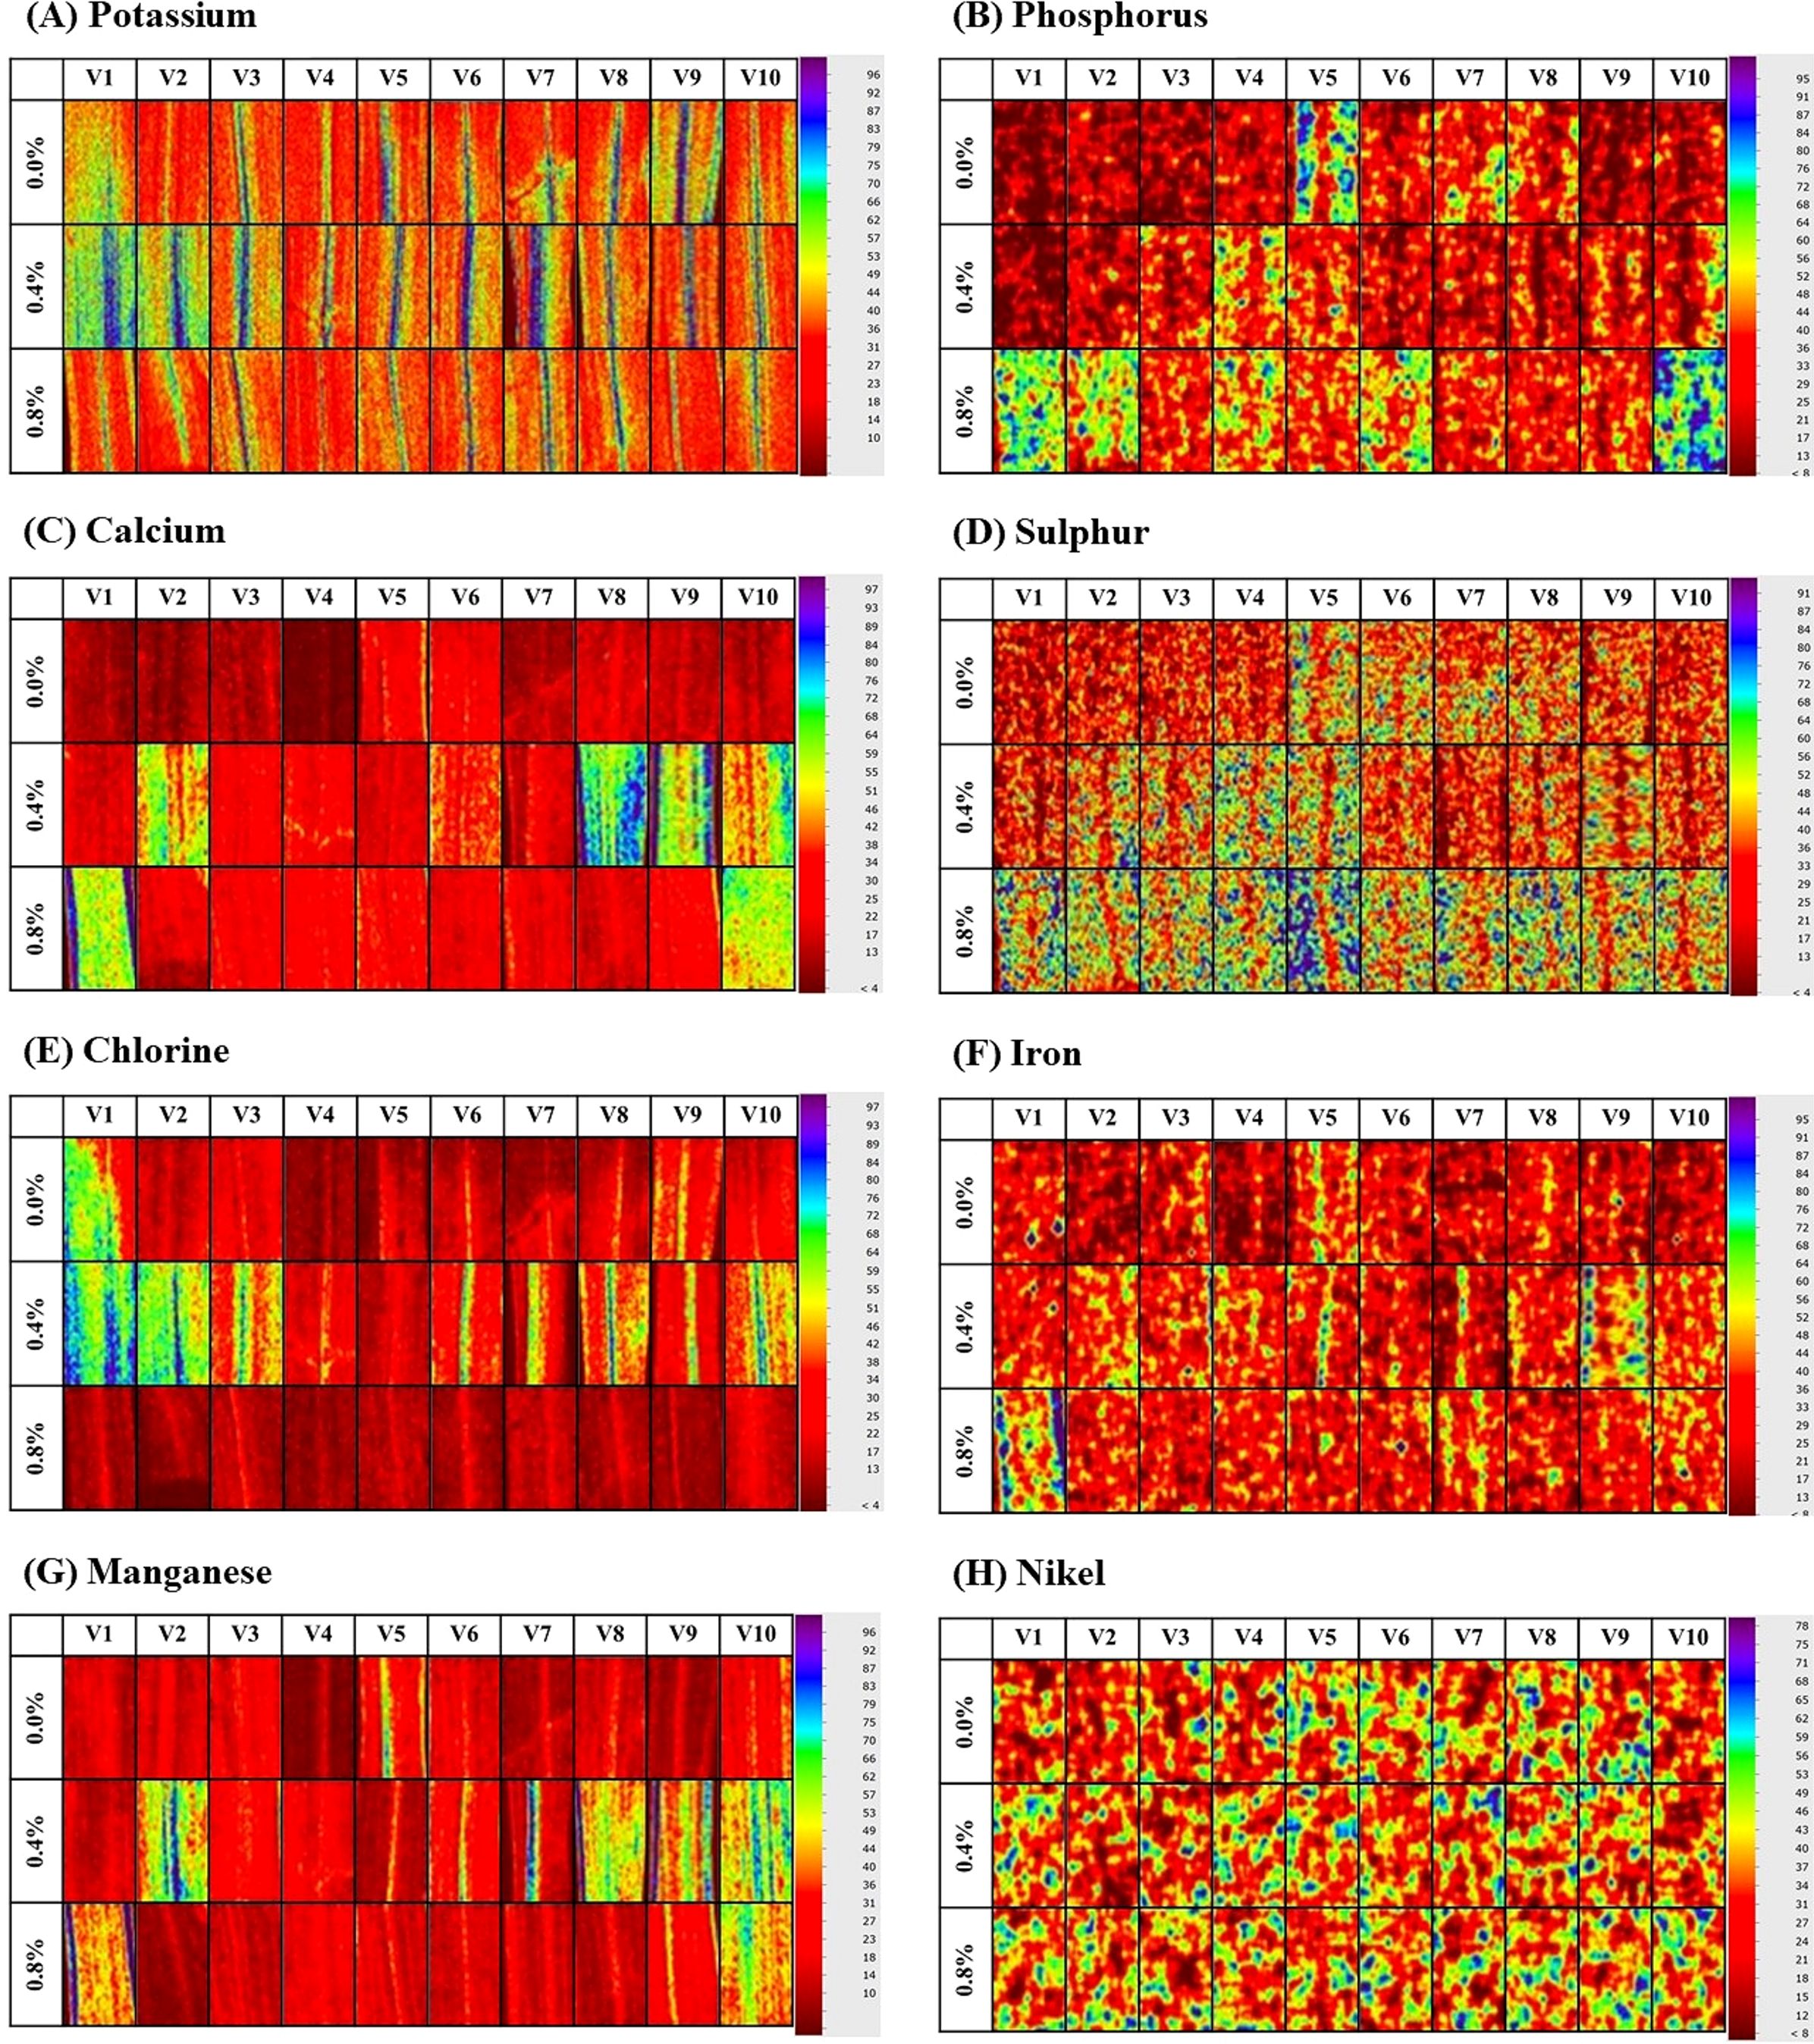
Figure 2. Leaf nutrients of indigenous rice planted under different salinity levels. (A–H) are potassium, phosphorus, calcium, sulfur, chlorine, iron, manganese, and nickel, respectively. V1: Dok Kha, V2: Hom Bon, V3: Dawk Pa-yawm, V4: Luk Lai, V5: Leb Nok, V6: Leuang, V7: Banpeang, V8: Chorlumpee, V9: Sang Yot, (Tha Sala), and V10: Sang Yot (Bang Khan).
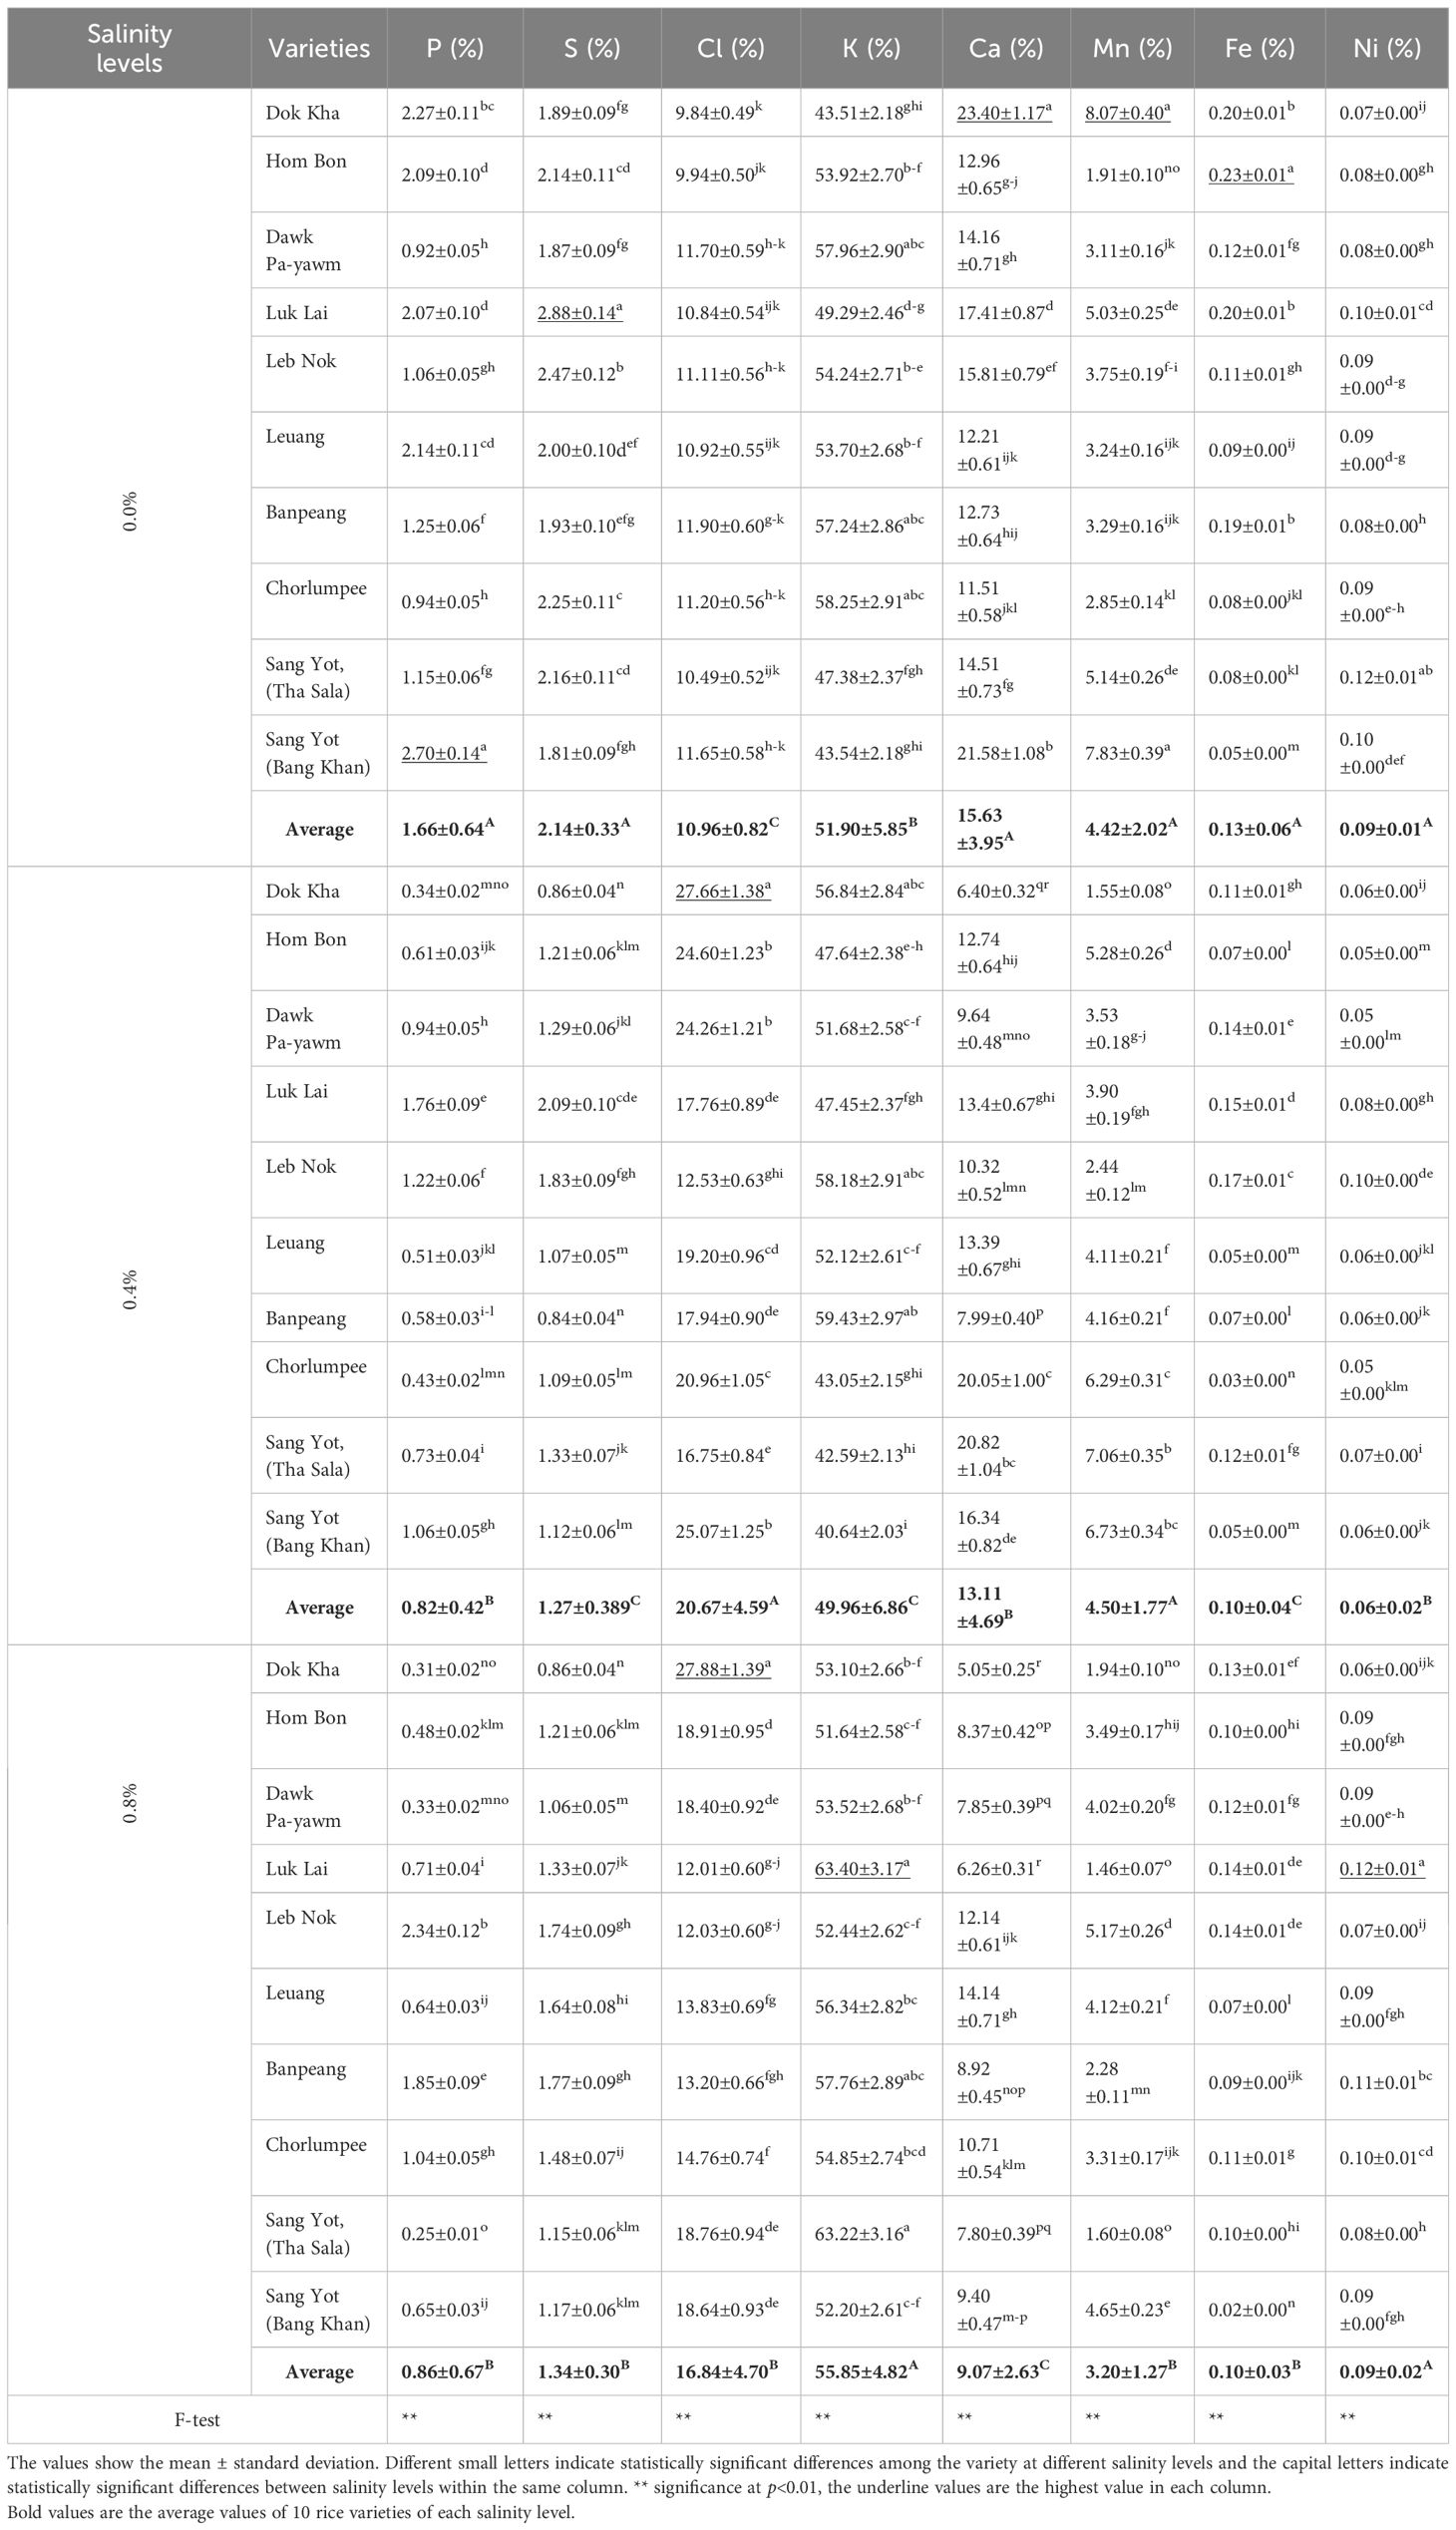
Table 5. Mean comparison on leaf nutrients of indigenous rice planted under different salinity levels.
The average leaf chlorine content was highest at 0.4% salinity (20.67%) and lowest at 0.0% salinity (10.96%). The highest chlorine percentage was recorded in Dok Kha at 0.4% and 0.8% salinity (27.66% and 27.88%, respectively), with the lowest observed in Dok Kha at 0.0% salinity (9.84%). In terms of potassium, the average leaf content was highest at 0.8% salinity (55.85%) and lowest at 0.4% salinity (49.96%). Luk Lai (63.40%) and Sang Yot (Tha Sala) (63.22%) at 0.8% salinity exhibited the highest potassium levels, while Sang Yot (Bang Khan) at 0.4% salinity had the lowest (40.64%). The average calcium content in leaves was highest at 0.0% salinity (15.63%) and lowest at 0.8% salinity (9.07%). Dok Kha recorded the highest calcium percentage at 0.0% salinity (23.40%), while the lowest percentages were observed in Dok Kha (5.05%) and Luk Lai (6.26%) at 0.8% salinity.
Leaf manganese levels were higher at 0.0% and 0.4% salinity (4.42% and 4.50%, respectively) compared to 0.8% salinity (3.20%). The highest manganese content was found in Dok Kha (8.07%) and Sang Yot (Bang Khan) (7.39%) at 0.0% salinity, while the lowest was in Dok Kha at 0.4% salinity (1.55%) and Luk Lai (1.46%) and Sang Yot (Tha Sala) (1.60%) at 0.8% salinity. For leaf iron, the average content was highest at 0.0% salinity (0.09%) and lowest at 0.4% salinity (0.10%). Hom Bon exhibited the highest iron percentage at 0.0% salinity (0.23%), while Chorlumpee had the lowest at 0.4% salinity (0.03%). Lastly, the average nickel content in leaves was higher at 0.0% and 0.8% salinity (both 0.09%) than at 0.4% salinity (0.06%). Luk Lai at 0.8% salinity had the highest nickel percentage (23.40%), while the lowest was observed in Hom Bon at 0.4% salinity (0.05%).
Figure 3 illustrates the correlation plot among leaf nutrients of indigenous rice grown under different salinity levels, based on Pearson’s correlation coefficient. A strong positive correlation was observed between calcium and manganese (0.84***), phosphorus and sulfur (0.68***), and sulfur and nickel (0.54***). Conversely, a strong negative correlation was found between potassium and manganese (-0.77***), chlorine and sulfur (-0.76***), calcium and potassium (-0.65***), and chlorine and phosphorus (-0.61***).
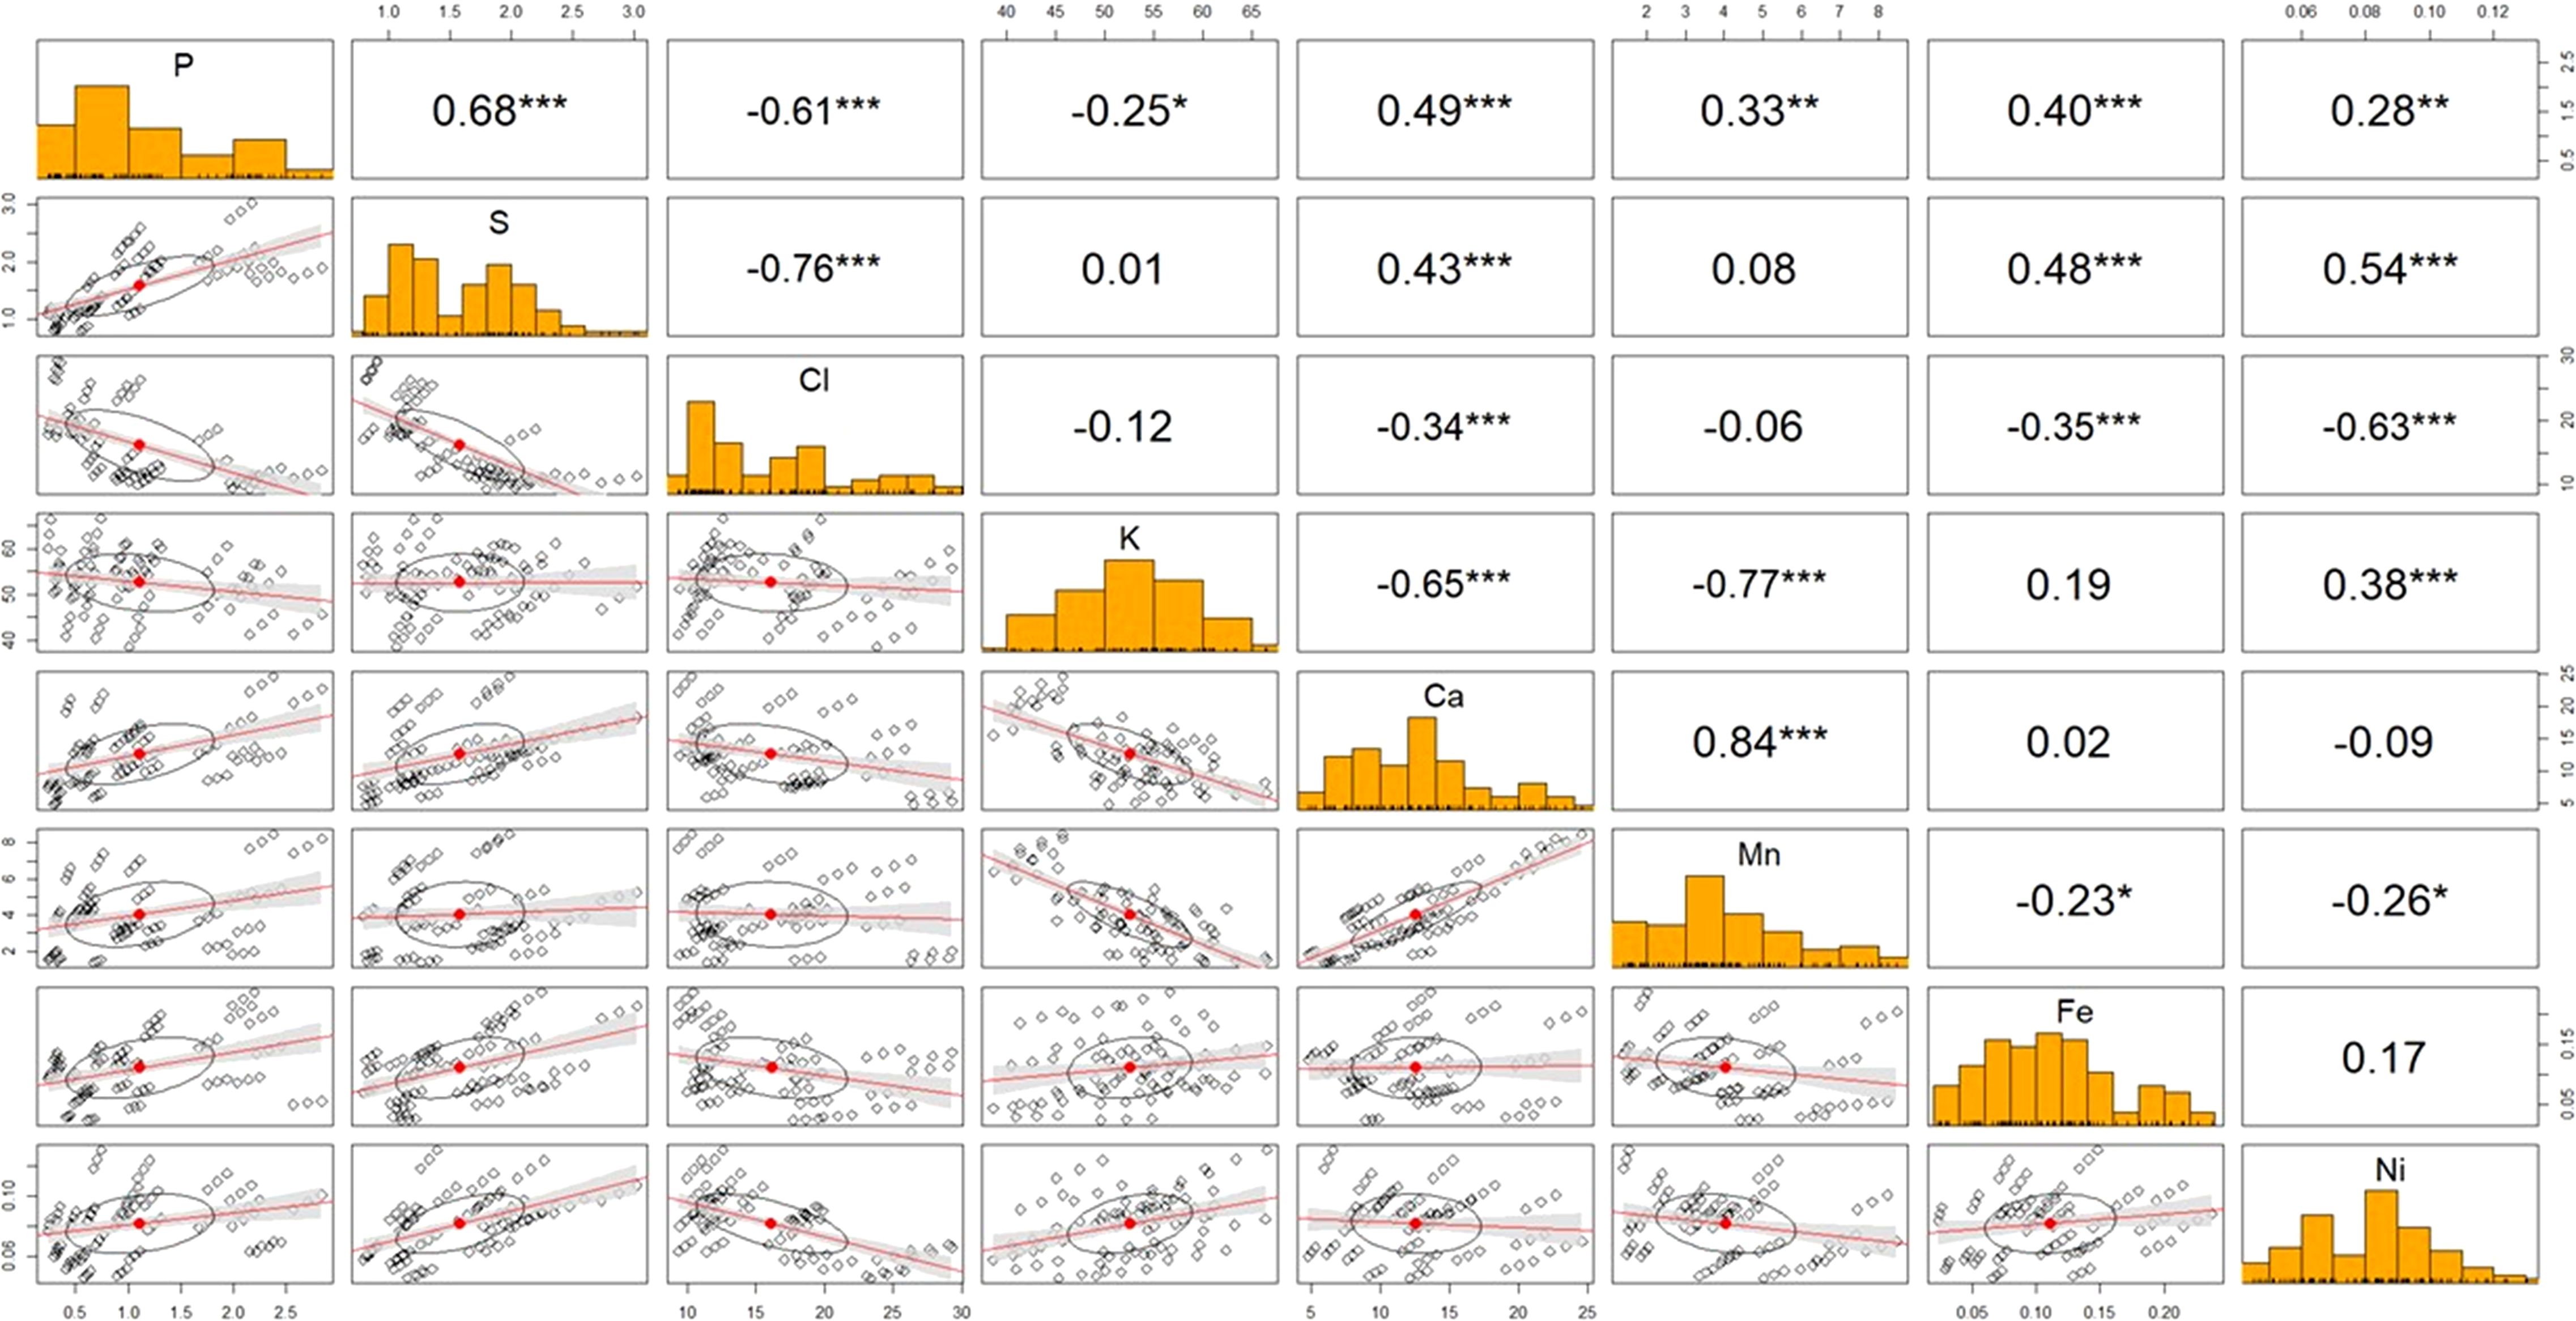
Figure 3. Correlation plot among leaf nutrients of indigenous rice planted under different salinity levels according to Pearson’s correlation coefficient. *,**,*** are correlation at p<0.05, 0.01, and 0.001, respectively.
3.5 Principal component analysis
The biplots for the first two principal components of indigenous rice agronomic traits, yield traits, and leaf nutrients are illustrated in Figures 4–6. The biplot for agronomic traits revealed that the first two principal components accounted for 50.0% and 22.3% of the variation, respectively. The cluster at 0.0% salinity is positioned on the left side of the y-axis, aligning with traits such as stem diameter, plant height, leaf length, and leaf width. In contrast, the 0.8% salinity cluster is located on the right side of the y-axis, showing an inverse relationship with most agronomic traits. Varieties Hom Bon, Luk Lai, and Sang Yot (Bang Khan) at 0.0% salinity were dominant in plant height, leaf length, and leaf width, while Leuang, Chorlumpee, Sang Yot (Tha Sala), and Sang Yot (Bang Khan) at 0.0% salinity, along with Luk Lai at 0.4% salinity, were dominant in stem diameter. Varieties Banpeang and Chorlumpee at 0.0% salinity, as well as Luk Lai, Leb Nok, and Chorlumpee at 0.4% salinity, were dominant in tiller number.
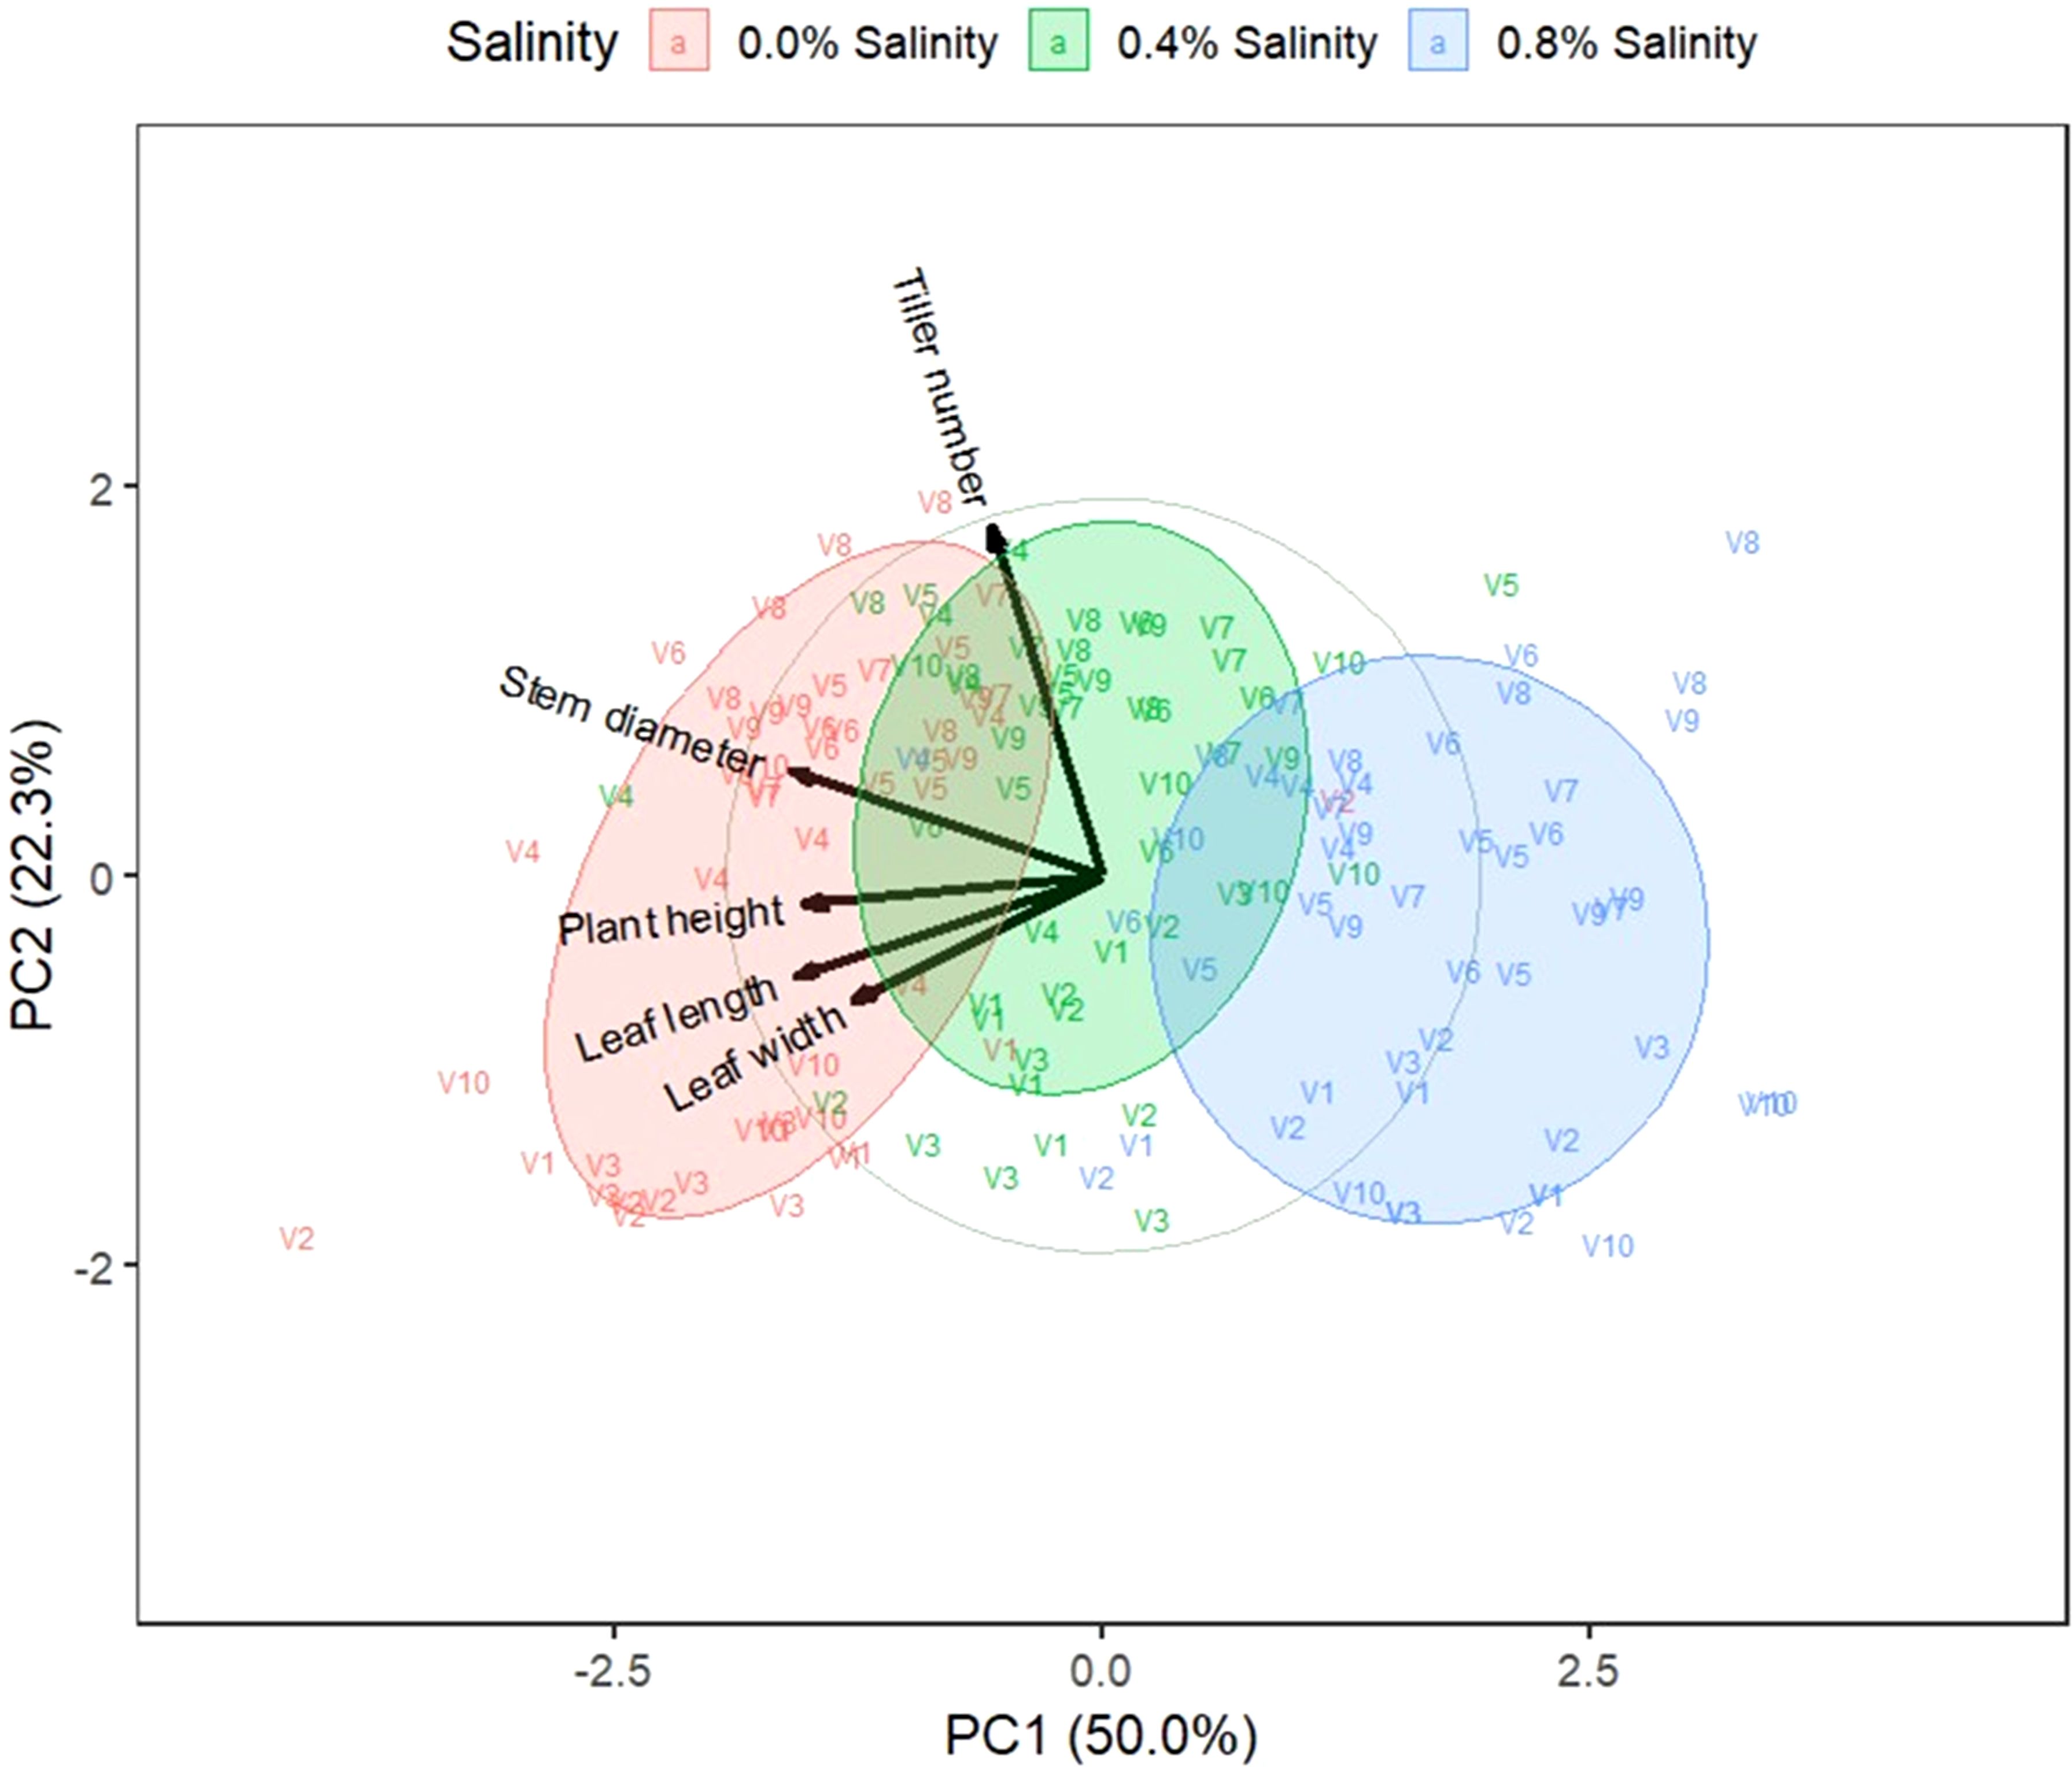
Figure 4. Biplot on the first two principal components of indigenous rice agronomic traits. 0.0%, 0.4%, and 0.8% are salinity levels. V1: Dok Kha, V2: Hom Bon, V3: Dawk Pa-yawm, V4: Luk Lai, V5: Leb Nok, V6: Leuang, V7: Banpeang, V8: Chorlumpee, V9: Sang Yot, (Tha Sala), and V10: Sang Yot (Bang Khan).
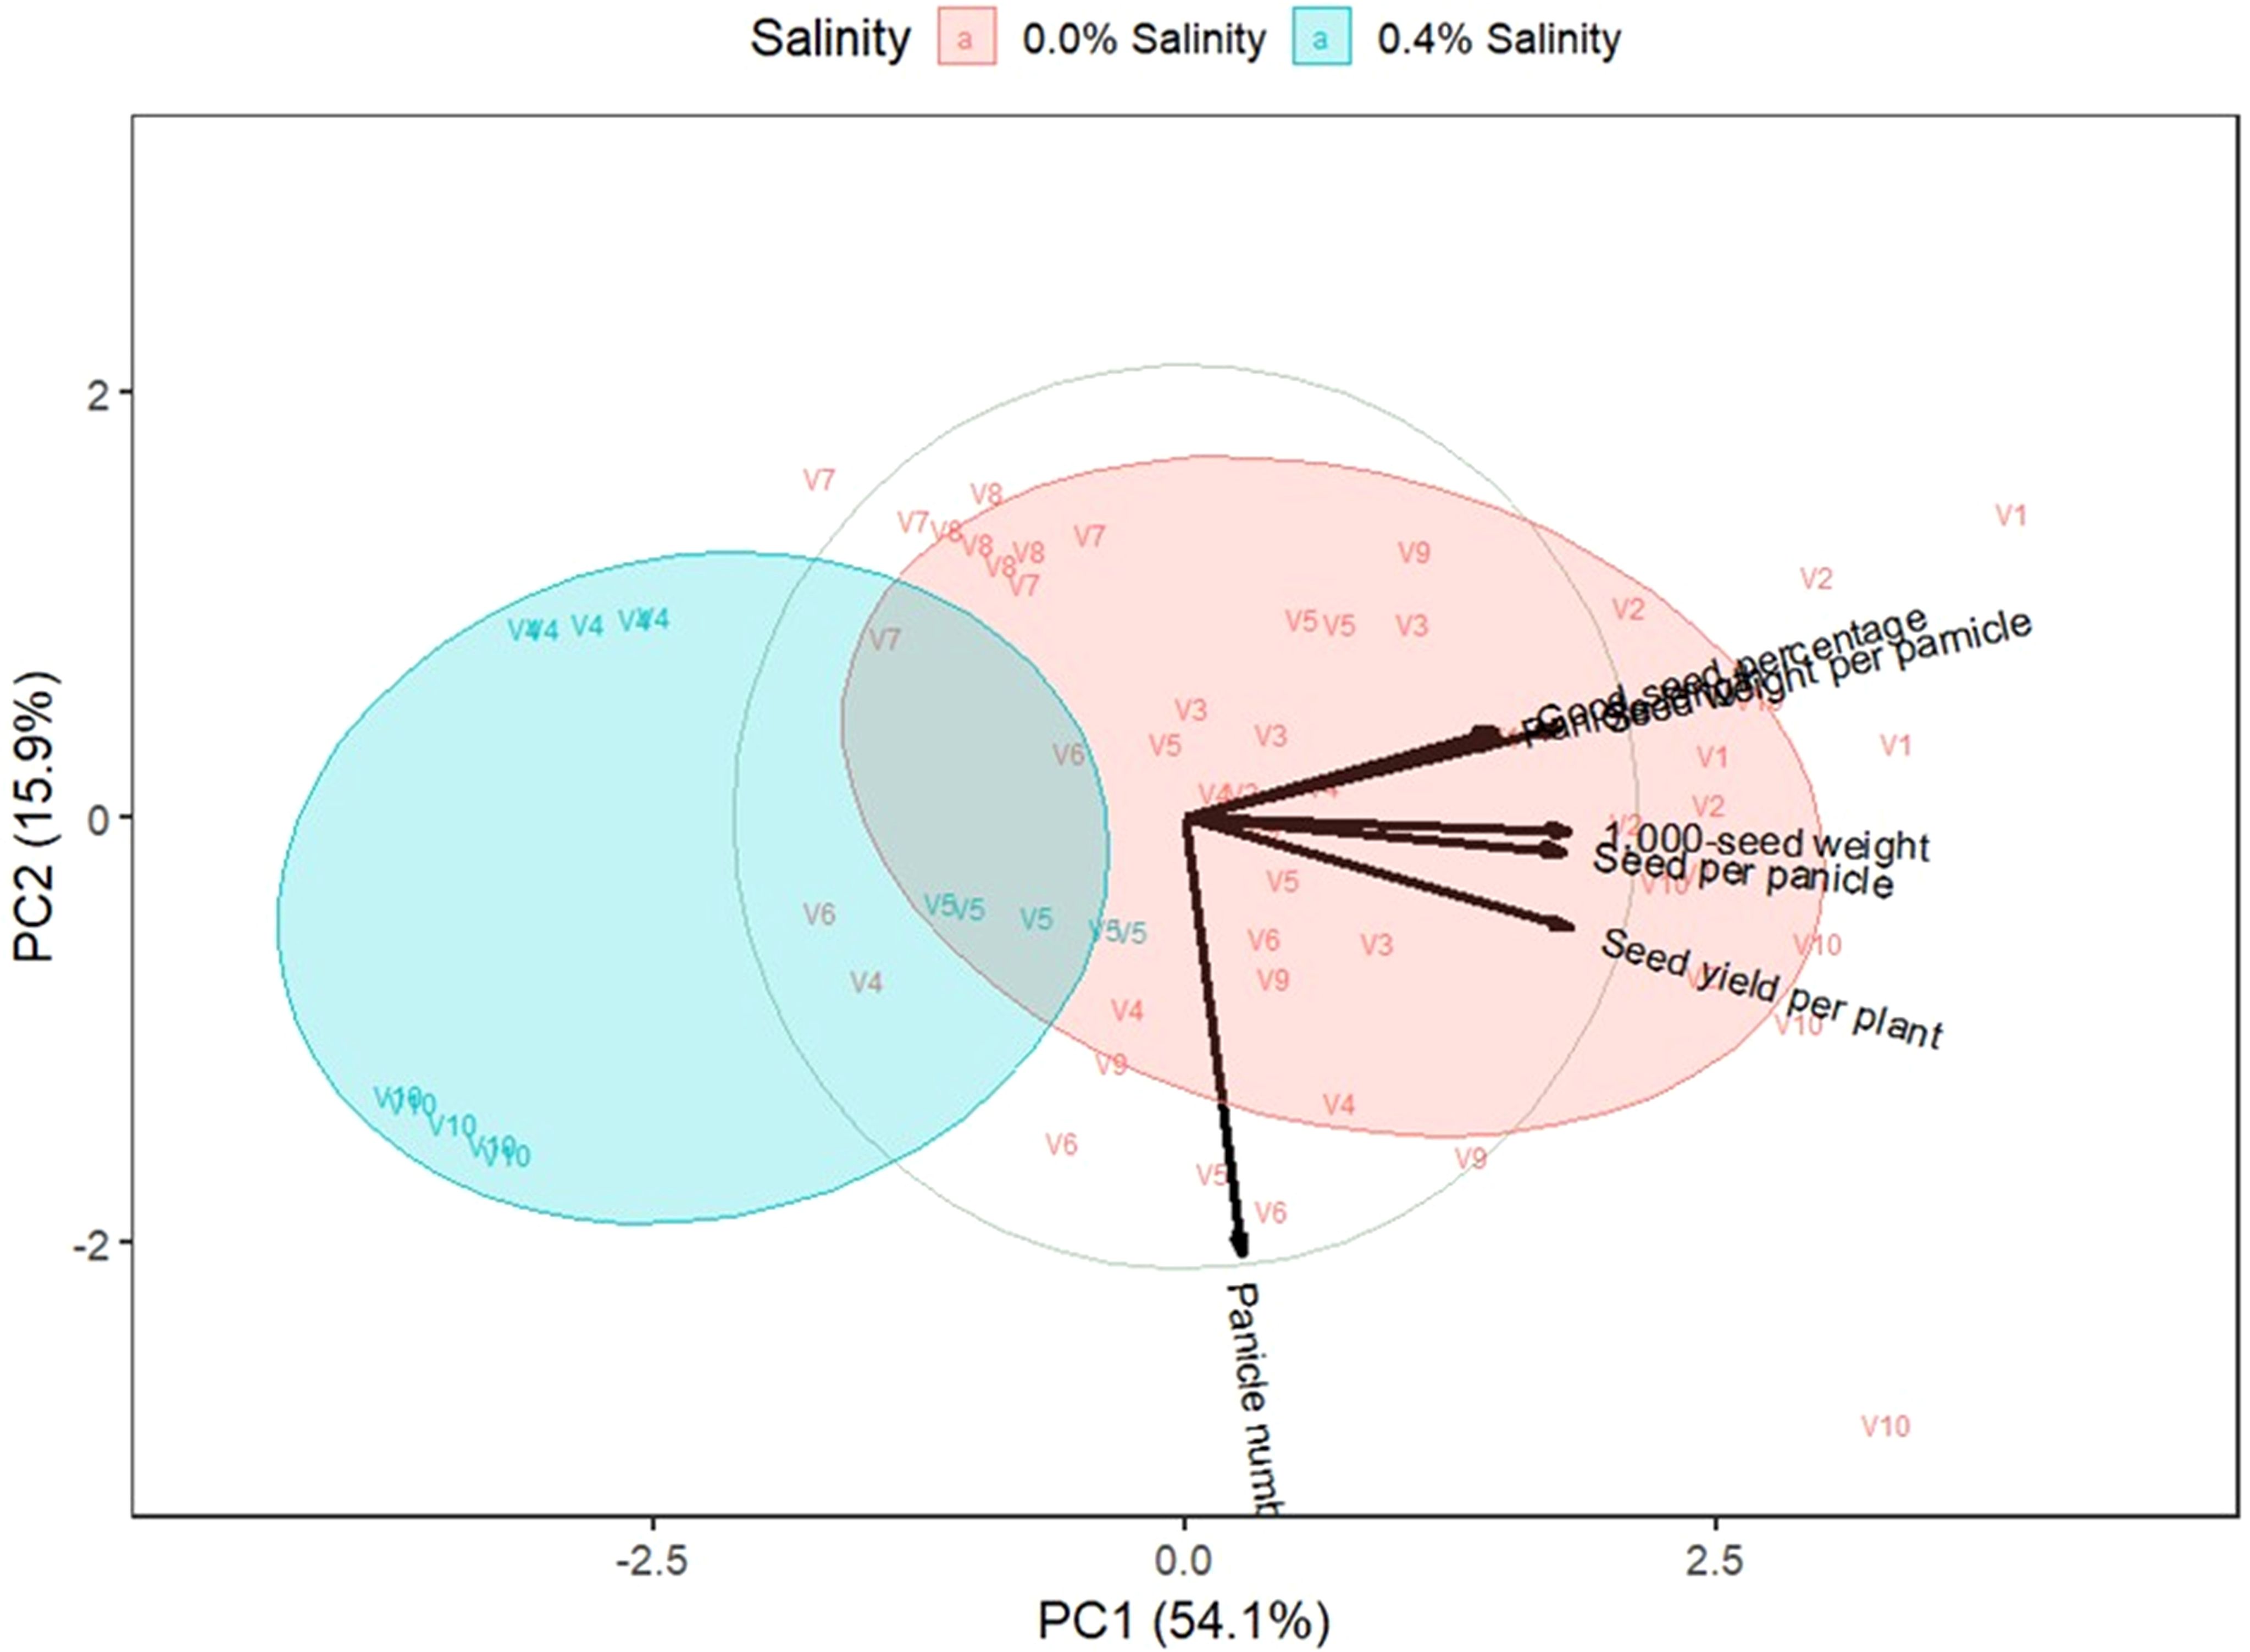
Figure 5. Biplot on the first two principal components of indigenous rice yield traits. 0.0% and 0.4% are salinity levels. V1: Dok Kha, V2: Hom Bon, V3: Dawk Pa-yawm, V4: Luk Lai, V5: Leb Nok, V6: Leuang, V7: Banpeang, V8: Chorlumpee, V9: Sang Yot, (Tha Sala), and V10: Sang Yot (Bang Khan).
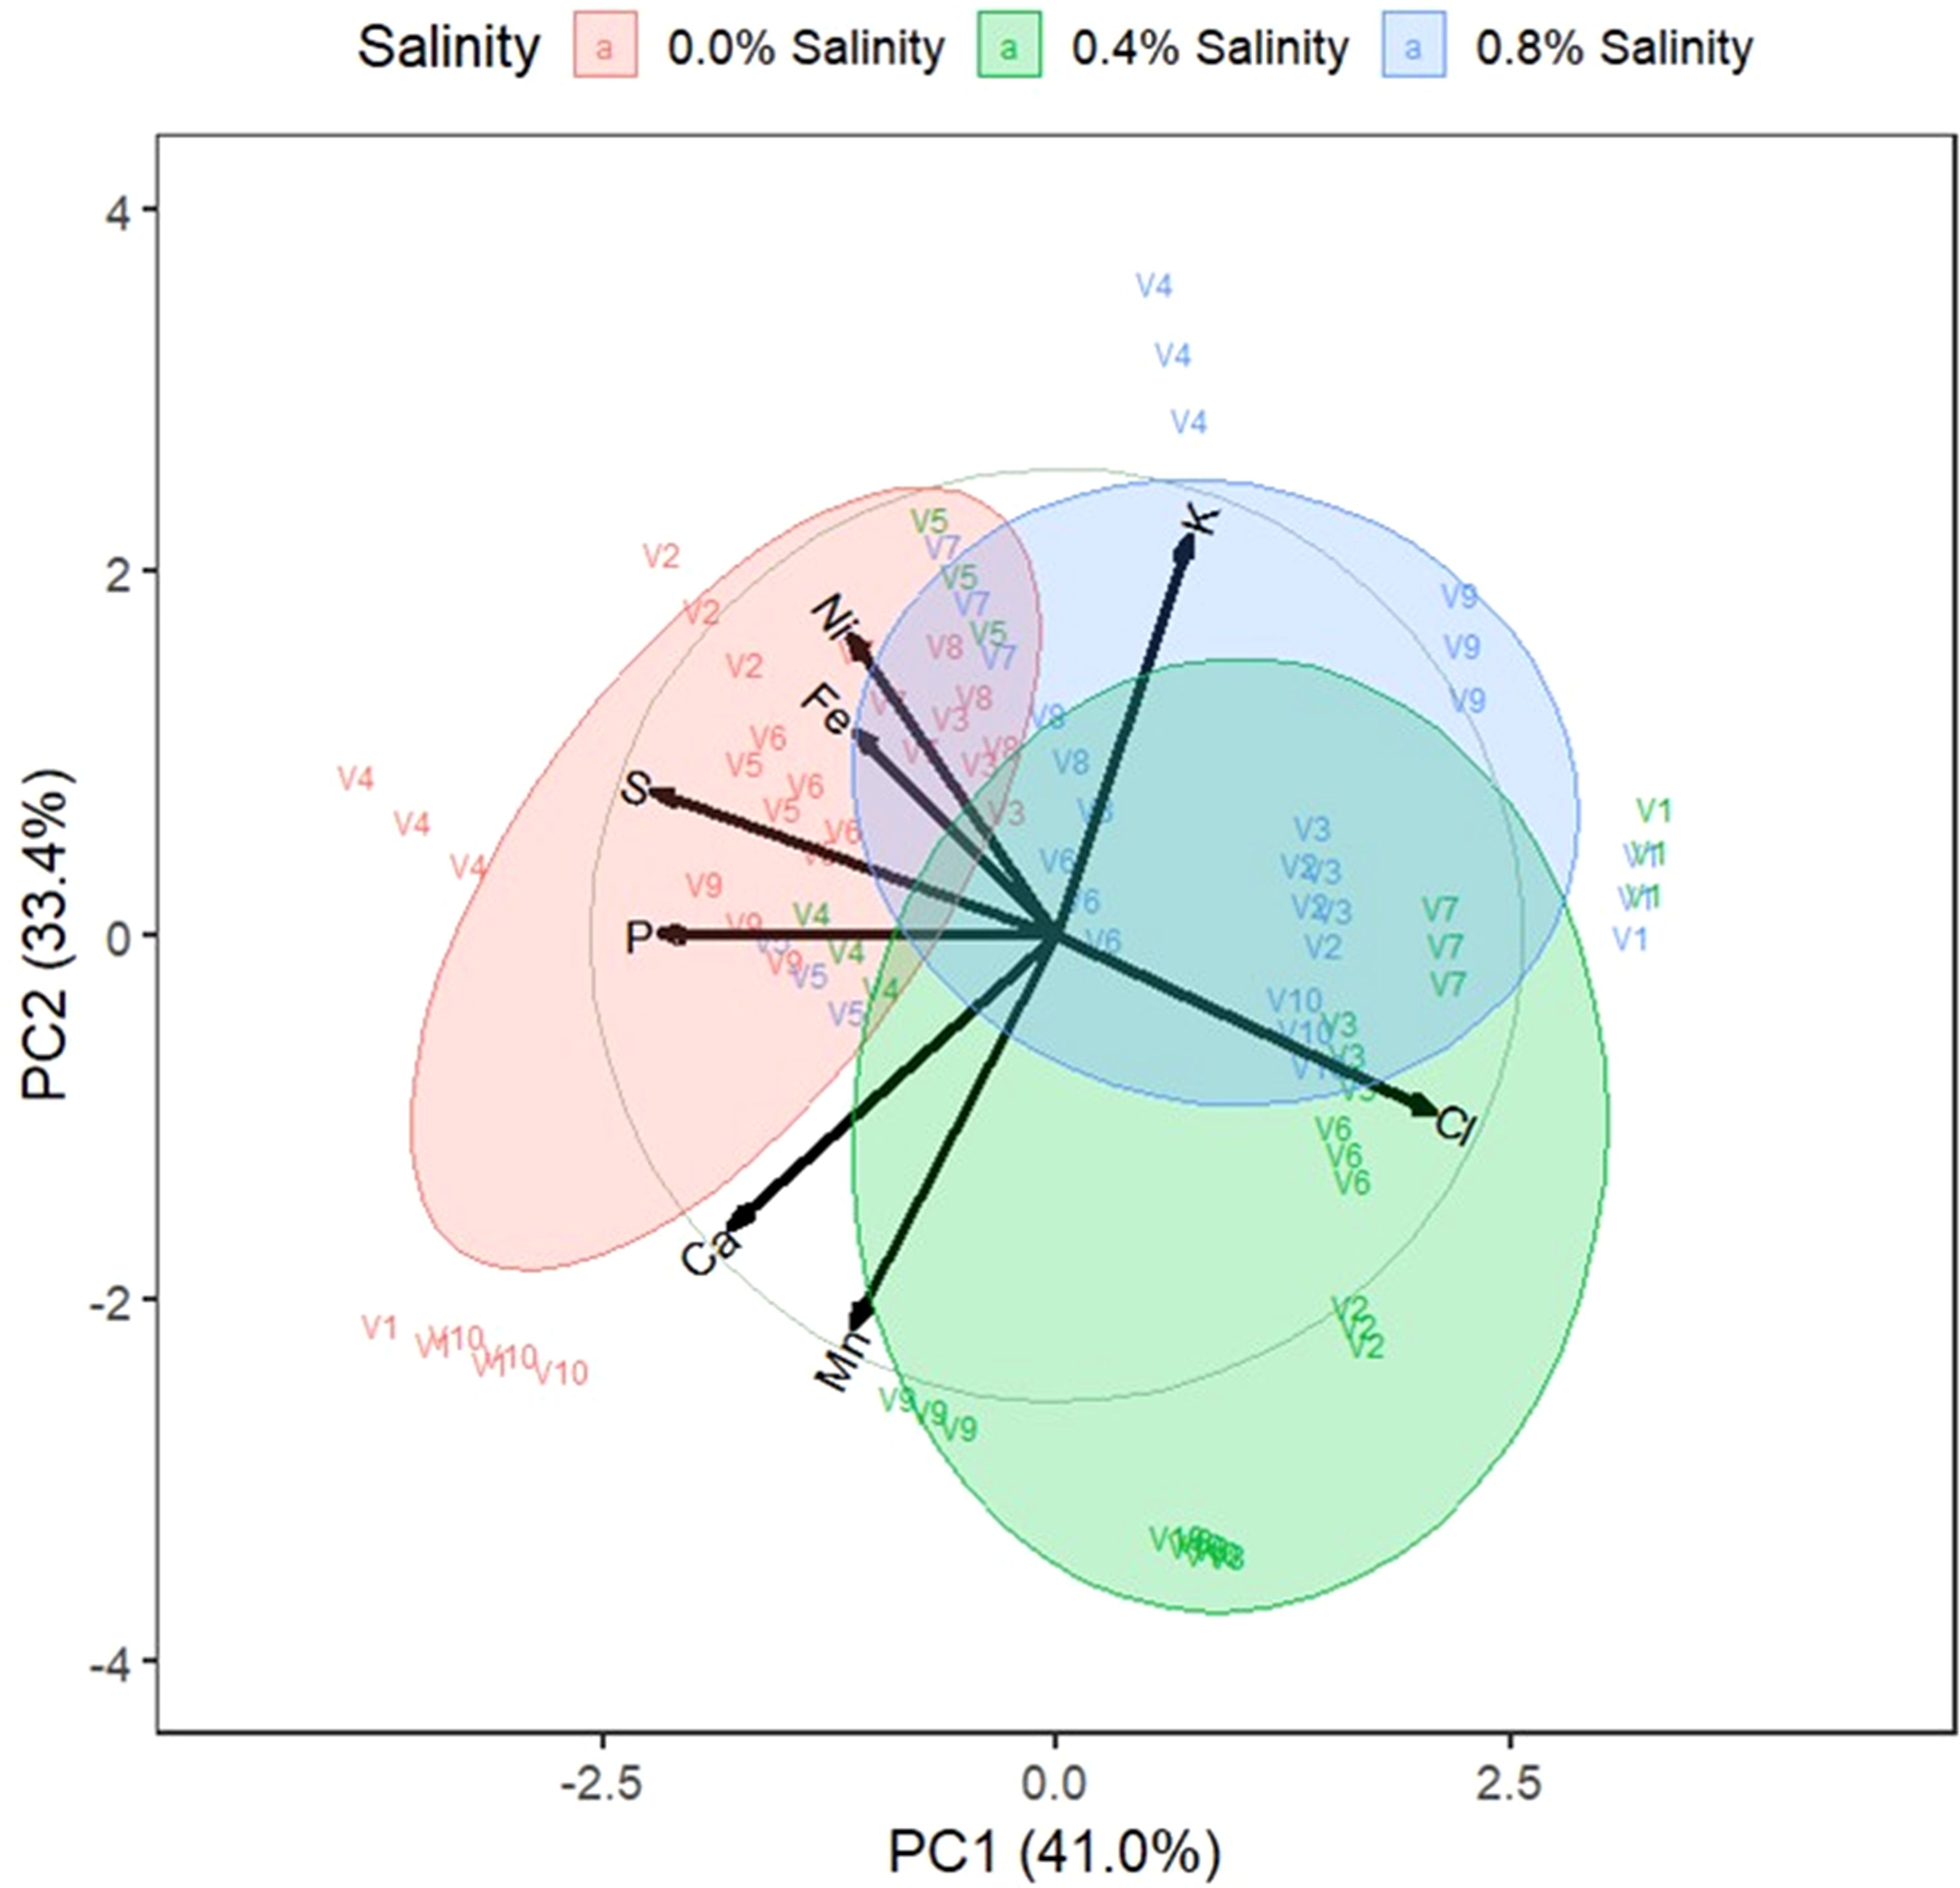
Figure 6. Biplot on the first two principal components of indigenous rice leaf nutrient. 0.0%, 0.4%, and 0.8% are salinity levels. V1: Dok Kha, V2: Hom Bon, V3: Dawk Pa-yawm, V4: Luk Lai, V5: Leb Nok, V6: Leuang, V7: Banpeang, V8: Chorlumpee, V9: Sang Yot, (Tha Sala), and V10: Sang Yot (Bang Khan).
For yield traits, the biplot indicated that the first two principal components explained 54.1% and 15.9% of the variation. Most of the points within the 0.0% salinity cluster are situated on the right side of the y-axis, correlating with traits such as panicle length, seeds per panicle, good seed percentage, seed weight per panicle, 1,000-seed weight, and seed yield per plant. In contrast, the 0.4% salinity cluster is located on the left side of the y-axis, with an opposite relationship to most yield traits. Varieties Luk Lai, Leb Nok, Leuang, and Sang Yot (Tha Sala) at 0.0% salinity were dominant in panicle number, while varieties Dok Kha, Hom Bon, and Sang Yot (Bang Khan) at 0.0% salinity dominated traits such as panicle length, seeds per panicle, good seed percentage, seed weight per panicle, 1,000-seed weight, and seed yield per plant.
The biplot for leaf nutrients revealed that the first two principal components accounted for 41.0% and 33.4% of the variation. The 0.0% salinity cluster was associated with calcium, phosphorus, sulfur, iron, and nickel, while the 0.4% salinity cluster was aligned with potassium, and the 0.8% salinity cluster corresponded with chlorine and manganese. Varieties Dok Kha and Sang Yot (Bang Khan) at 0.0% salinity were dominant in calcium, while Luk Lai at 0.0% salinity was dominant in phosphorus and sulfur. Varieties Hom Bon, Leb Nok, Leuang, and Banpeang at 0.0% salinity, Leb Nok at 0.4% salinity, and Chorlumpee at 0.8% salinity dominated in iron and nickel. Luk Lai at 0.8% salinity was dominant in potassium, and varieties Dawk Pa-yawm, Leuang, and Banpeang at 0.4% salinity, along with Hom Bon, Dawk Pa-yawm, and Sang Yot (Bang Khan) at 0.8% salinity, dominated in chlorine.
4 Discussion
Salt stress is one of the major constraints in agricultural soils, significantly reducing growth and productivity in rice and other crops. Several complex processes in rice, including cell wall modifications, cytoskeletal modulation, gene regulation, stress defense mechanisms, ion homeostasis, salt sensing, and ROS signaling, are involved in the plant’s response to salt stress (Hasan et al., 2023). In this study, we found that the agronomic traits, yield characteristics, and leaf nutrient profiles of ten indigenous rice varieties from Nakhon Si Thammarat were influenced by varying salinity levels. Specifically, stem diameter and leaf length were significantly reduced at 0.4% salinity, while plant height, leaf length, and tiller number were notably reduced at 0.8% salinity.
In terms of yield traits, all rice varieties subjected to 0.8% salinity exhibited severe dehydration and perished during the flowering stage, whereas only the rice varieties Luk Lai, Leb Nok, and Sang Yot (Bang Khan) survived at 0.4% salinity. According to Sari et al. (2019), several traits such as flag leaf length, tiller number per plant, panicle number per plant, days to flowering, panicle length, number of filled grains per panicle, spikelet fertility, grain weight per panicle, and 1,000-grain weight are strongly correlated with grain yield. When these traits are affected by salinity stress, rice is unable to produce normal yields. Furthermore, Ninsuwan et al. (2013) examined the salt tolerance of Thai native rice seedlings and improved varieties using 103 mM NaCl. They found that the survival rate differed among rice varieties and that all tested varieties displayed distinct visual symptoms following salinity stress.
The detrimental effects of salinity—such as soil compaction, osmotic stress from reduced water availability, nutrient deficiencies due to impaired uptake of essential elements like calcium, phosphorus, potassium, and nitrogen, and ion toxicity—further inhibit rice growth (Razzaq et al., 2020). Factors such as the intensity and duration of salt exposure, the growth stage of the plant, and the susceptibility of the rice variety are key determinants of the extent to which rice production and quality are reduced by salt stress. For example, grain yield in salt-sensitive rice varieties has been reported to decrease by 52.5–67.7% compared to tolerant varieties under 3-6% irrigated salinity. Furthermore, increases in salt concentration have been shown to decrease nitrogen uptake by 20.6–50.8%, reduce seed protein content by 6.66–8.15%, and lower amylose content by 17.74–25.48% (Li et al., 2023).
The use of micro-XRF spectrometry provided valuable insights into the nutrient status and compartmentalization in the leaves of indigenous rice varieties grown under different salinity conditions. Micro-XRF spectrometry is a well-established, non-destructive analytical technique for both qualitative and quantitative elemental analysis, making it suitable for in vivo plant studies (Rodrigues et al., 2018). This method is effective for timely plant nutrition monitoring, offering highly accurate, cost-effective analysis for multiple elements simultaneously (R2>0.99) with no significant variation between certified and measured values at a 99% confidence level (Rallos et al., 2023).
In this study, micro-XRF spectrometry revealed that leaf contents of phosphorus, sulfur, calcium, manganese, iron, and nickel decreased significantly with increasing salinity levels, while chlorine and potassium levels increased. Potassium, the third most essential macronutrient, plays a crucial role in physiological and metabolic processes such as stomatal movement, enzyme activation, photosynthesis, osmoregulation, and stress resistance (Praveen and Singh, 2024). Hom Bon, Chorlumpee, Sang Yot (Tha Sala), and Sang Yot (Bang Khan) had increased calcium and manganese accumulation at 0.4% salinity, and Dok Kha and Sang Yot (Bang Khan) had increased calcium and manganese accumulation at 0.8% salinity. Calcium is considered to be essential for improving plants’ ability to tolerate stress. Calcium acts as a secondary messenger in a variety of stress signal transduction pathways, including drought, salinity, cold, heat and heavy metal stress. It greatly aids in reducing abiotic stress, whether used alone or in combination with exogenous plant hormones (Gupta et al., 2023). By enhancing ionic and osmotic homeostasis by reducing Na+ influx and raising water status, respectively, manganese assisted the plants in partially recovering from the chlorosis and growth inhibition. By raising the levels of phenolic compounds, flavonoids, and ascorbate as well as the activities of catalase, superoxide dismutase, dehydroascorbate reductase, and monodehydroascorbate reductase in the salt-treated seedlings, exogenous Mn administration enhanced reactive oxygen species detoxification (Rahman et al., 2016). Chloride accumulation in rice leaves tended to increase at 0.4% salinity levels and decrease at 0.8% salinity level. Chloride ions, a key micronutrient, support water use efficiency, photosynthesis, and stomatal regulation, and are essential cofactors in photosynthetic light reactions and electron transport within the chloroplast (Wang et al., 2020).
The correlation analysis revealed several strong positive relationships among leaf nutrients, including calcium and manganese, phosphorus and sulfur, and sulfur and nickel. Conversely, strong negative correlations were observed between potassium and manganese, chlorine and sulfur, calcium and potassium, and chlorine and phosphorus. These findings suggest that variations in certain leaf nutrients can significantly influence the levels of other correlated nutrients (Khomphe et al., 2022; Khomphet, 2024).
Principal component analysis (PCA) effectively distinguished the indigenous rice varieties based on agronomic traits, yield characteristics, and leaf nutrient content. PCA is a valuable tool for cluster analysis and is widely used to measure the contribution of each component to the total variance (Popet et al., 2023). The results of PCA for agronomic traits indicated that increasing salinity levels reduced plant height, stem diameter, leaf width, leaf length, and tiller number. PCA for yield traits showed that salinity levels negatively impacted panicle length, seed per panicle, good seed percentage, seed weight per panicle, 1,000-seed weight, and seed yield per plant, although panicle number remained unaffected. PCA for leaf nutrients revealed that higher salinity levels reduced phosphorus, sulfur, calcium, iron, and nickel content in the leaves, while chlorine and potassium levels increased.
Based on their performance under salinity stress, the indigenous rice varieties Luk Lai, Leb Nok, and Sang Yot (Bang Khan) are recommended for further cultivation in saline soils. All three rice varieties survived, exhibited high levels of certain growth characteristics, such as the tiller number, and were able to produce a yield in saline soil. Additionally, these varieties hold potential as valuable genetic resources for future rice breeding programs aimed at improving salinity tolerance.
5 Conclusions
There were significant differences among rice varieties and salinity levels for most of growth and yield traits, and leaf nutrient. Higher saline levels at 0.4 and 0.8% significantly inhibited the development of all varieties of rice. Rice varieties responded differently to varied salinity conditions in terms of growth, yield traits, and leaf nutrients, according to the principal component analysis. The high level of potassium, chlorine, and manganese was observed in the rice leaves under salinity conditions. The indigenous varieties of rice Luk Lai, Leb Nok, and Sang Yot (Bang Khan) are suggested for farmers to plant in the future on saline soils due to their capacity to thrive in salty conditions and produce well. The field experiment is suggested for further study.
Data availability statement
The original contributions presented in the study are included in the article/supplementary material. Further inquiries can be directed to the corresponding author.
Author contributions
TK: Conceptualization, Formal Analysis, Funding acquisition, Methodology, Project administration, Supervision, Visualization, Writing – original draft, Writing – review & editing. YZ: Validation, Writing – review & editing.
Funding
The author(s) declare financial support was received for the research and/or publication of this article. This research was funded by Plant Genetic Conservation Project Under the Royal Initiative of Her Royal Highness Princess Maha Chakri Sirindhorn (Fiscal year 2023). This work was partially supported by Walailak University under the international research collaboration scheme (WU-CIA-04007/2024).
Acknowledgments
The authors would like to thank the School of Agricultural Technology and Food Industry and the Center for Scientific and Technology Equipment, Walailak University for supporting the greenhouse, laboratory, and other facilities. We are thankful to Absotec company limited, Thailand for supporting micro-XRF analysis. We are thankful to all rice farmers in Nakhon Si Thammarat Province for supporting rice seeds used in this study.
Conflict of interest
The authors declare that the research was conducted in the absence of any commercial or financial relationships that could be construed as a potential conflict of interest.
Generative AI statement
The author(s) declare that no Generative AI was used in the creation of this manuscript.
Any alternative text (alt text) provided alongside figures in this article has been generated by Frontiers with the support of artificial intelligence and reasonable efforts have been made to ensure accuracy, including review by the authors wherever possible. If you identify any issues, please contact us.
Publisher’s note
All claims expressed in this article are solely those of the authors and do not necessarily represent those of their affiliated organizations, or those of the publisher, the editors and the reviewers. Any product that may be evaluated in this article, or claim that may be made by its manufacturer, is not guaranteed or endorsed by the publisher.
References
Chaudhari P. R., Tamrakar N., Singh L., Tandon A., and Sharma D. (2018). Rice nutritional and medicinal properties: A review article. J. Pharmacogn. Phytochem. 7, 150–156.
De Mendiburu F. (2023). Package ‘agricolae’: Statistical procedures for agricultural research. Available online at: https://cran.r-project.org/web/packages/agricolae/index.html (Accessed May 16, 2024).
Foreign Agricultural Service (2021). Thailand rice: recent dry conditions after a promising start; optimism still remains for this crop season. Available online at: https://ipad.fas.usda.gov/ (Accessed July 24, 2024).
Gupta S., Kaur N., Kant K., Jindal P., Ali A., and Naeem M. (2023). Calcium: A master regulator of stress tolerance in plants. S. Afr. J. Bot. 163, 580–594. doi: 10.1016/j.sajb.2023.10.047
Hasan M. M., Rahman M. A., Corpas F. J., Rahman M. M., Jahan M. S., Liu X., et al. (2023). Salt stress tolerance in rice (Oryza sativa L.): A proteomic overview of recent advances and future prospects. Plant Stress. 11, 100307. doi: 10.1016/j.stress.2023.100307
Hasanuzzaman M. and Fujita M. (2022). Plant responses and tolerance to salt stress: Physiological and molecular interventions. Int. J. Mol. Sci. 23, 4810. doi: 10.3390/ijms23094810
Hussain N., Ahmed M., Duangpan S., Hussain T., and Taweekun J. (2021). Potential impacts of water stress on rice biomass composition and feedstock availability for bioenergy production. Sustainability. 13, 10449. doi: 10.3390/su131810449
Khomphet T. (2024). Genetic variability, correlation and path analysis of agronomic traits and yield components of Thai sweet corn. Indian J. Agric. Res. 59 (2), 198–205. doi: 10.18805/IJARe.AF-886
Khomphe T., Intana W., Promwee A., and Islam S. S. (2022). Genetic variability, correlation, and path analysis of Thai commercial melon varieties. Int. J. Agron. 2022, 7877239. doi: 10.1155/2022/7877239
Li Y., Ai Z., Mu Y., Zhao T., Zhang Y., Li L., et al. (2023). Rice yield penalty and quality deterioration is associated with failure of nitrogen uptake from regreening to panicle initiation stage under salinity. Front. Plant Sci. 14. doi: 10.3389/fpls.2023.1120755
Liu C., Mao B., Yuan D., Chu C., and Duan M. (2022). Salt tolerance in rice: Physiological responses and molecular mechanisms. Crop J. 10, 13–25. doi: 10.1016/j.cj.2021.02.010
Mohidem N. A., Hashim N., Shamsudin R., and Che M. H. (2022). Rice for food security: Revisiting its production, diversity, rice milling process and nutrient content. Agriculture. 12, 741. doi: 10.3390/agriculture12060741
Ninsuwan U., Pornsirikarn P., Jundee N., and Puima N. (2013). Identification of salt tolerance in Thai indigenous rice on the basis of the Na/K ratio and salt stress responses. Asian J. Plant Sci. 12, 247–251. doi: 10.3923/ajps.2013.247.251
Office of Agricultural Economics (2022). Agricultural economic data. Available online at: https://www.oae.go.th/view/1/Home/EN-US (Accessed July 24, 2024).
Popet P., Eksomtramage T., Anothai J., and Khomphet T. (2023). Principal component analysis of agronomic and yield traits of six tenera oil palm progenies in Southern Thailand. Acta Agronomica 71, 416–422. doi: 10.15446/acag.v71n4.98032
Praveen A. and Singh S. (2024). The role of potassium under salinity stress in crop plants. Cereal Res. Commun. 52, 315–322. doi: 10.1007/s42976-023-00393-3
Rahman A., Hossain M. S. 0., Mahmud J. A., Nahar K., Hasanuzzaman M., and Fujita M. (2016). Manganese-induced salt stress tolerance in rice seedlings: Regulation of ion homeostasis, antioxidant defense and glyoxalase systems. Physiol. Mol. Biol. Plants. 22, 291–306. doi: 10.1007/s12298-016-0371-1
Rallos R. V., Palattao B. L., Dicen G. P., and Labides J. L. R. (2023). Rapid plant mineral nutrition monitoring through X-ray fluorescence and mass spectrometry. Philipp. J. Sci. 153, 135–147.
Razzaq A., Ali A., Safdar L. B., Zafar M. M., Rui Y., Shakeel A., et al. (2020). Salt stress induces physiochemical alterations in rice grain composition and quality. J. Food Sci. 85, 14–20. doi: 10.1111/1750-3841.14983
Revelle W. (2024). “Psych: procedures for psychological, psychometric, and personality research,” in R package version 2.4.12 (Northwestern University, Evanston, Illinois). Available online at: https://CRAN.R-project.org/package=psych (Accessed May 16, 2024).
Rodrigues E. S., Gomes M. H. F., Duran N. M., Cassanji J. G. B., da Cruz T. N. M., Neto S. A., et al. (2018). Laboratory microprobe X-ray fluorescence in plant science: Emerging applications and case studies. Front. Plant Sci. 9 1588. doi: 10.3389/fpls.2018.01588
Sari W. K., Nualsri C., Junsawang N., and Soonsuwon W. (2019). Path analysis for yield and its components in F1 upland rice hybrids and their parental lines. Songklanakarin J. Sci. Technol. 41, 1419-1425.
Summpunn P., Panpipat W., ManurakChinakorn S., Bhoopong P., Cheong L. Z., and Chaijan M. (2022). Comparative analysis of antioxidant compounds and antioxidative properties of Thai indigenous rice: Effects of rice variety and processing condition. Molecules. 27 5180. doi: 10.3390/molecules27165180
Vu V. Q., Friendly M., and Tavadyan A. (2024). Package ‘ggbiplot’: A grammar of graphics implementation of biplots. Available online at: https://cran.r-project.org/web/packages/ggbiplot/index.html (Accessed May 16, 2024).
Wang L., Xu J., Jia W., Chen Z., and Xu Z. (2020). Chloride salinity in a chloride-sensitive plant: Focusing on photosynthesis, hormone synthesis and transduction in tobacco. Plant Physiol. Biochem. 153, 119–130. doi: 10.1016/j.plaphy.2020.05.021
Keywords: leaf nutrient composition, micro-XRF spectrometry, plant physiological response, salinity stress, Thai indigenous rice
Citation: Khomphet T and Zhao Y (2025) Comparative analysis of Thai indigenous rice on growth, yield, and leaf nutrient under salinity conditions. Front. Agron. 7:1568758. doi: 10.3389/fagro.2025.1568758
Received: 30 January 2025; Accepted: 01 August 2025;
Published: 19 August 2025.
Edited by:
Khurram Shahzad, Lasbela University of Agriculture, Water and Marine Sciences, PakistanReviewed by:
Sadia Bibi, University of Agriculture, Faisalabad, PakistanQuan Lien, Can Tho University, Vietnam
Andi Isti Sakinah, Hasanuddin University, Indonesia
Copyright © 2025 Khomphet and Zhao. This is an open-access article distributed under the terms of the Creative Commons Attribution License (CC BY). The use, distribution or reproduction in other forums is permitted, provided the original author(s) and the copyright owner(s) are credited and that the original publication in this journal is cited, in accordance with accepted academic practice. No use, distribution or reproduction is permitted which does not comply with these terms.
*Correspondence: Thanet Khomphet, dGhhbmV0LmtoQG1haWwud3UuYWMudGg=