 Sachin Rathour1*
 Meera Kumari2
 Prakash Singh Badal1
 Virendra Kamalvanshi1
 Saket Kushwaha1
 Hanuman Singh Jatav3
 S. R. Devegowda4*
- 1Department of Agricultural Economics, Institute of Agricultural Sciences, Banaras Hindu University, Varanasi, Uttar Pradesh, India
- 2Department of Agricultural Economics, Bihar Agricultural University, Sabour Bhagalpur, Bihar, India
- 3Department of Soil Science & Agricultural Chemistry, Sri Karan Narendra Agriculture University, Jobner -Jaipur, Rajasthan, India
- 4Department of Agricultural Economics, Rajiv Gandhi University (A Central University), Doimukh, Arunachal Pradesh, India
Rapeseed-mustard (Brassica spp.) is one of the most significant oilseed crops globally, with India being a major contributor, accounting for 11% of world production. Despite advancements in mustard cultivation practices, there remains a lack of comprehensive analysis integrating resource efficiency and input interactions to optimize yields sustainably. Furthermore, limited studies have employed advanced methodologies to assess the impacts of input uncertainties on yield stability and risk management. Therefore, the study evaluated the resource use efficiency in mustard cultivation through the Cobb-Douglas production function, Monte Carlo simulations, offering insights into input utilization and yield variability under uncertain conditions and sensitivity analysis for specific inputs’ contribution to yield. Results revealed imbalances in resource utilization; land and soil qualities are underutilized, while labor, plant protection chemicals, and machinery are overutilized. Fertilizer and seed inputs emerged as significant positive influencers of yield, with sulphur and fertilizer identified as critical factors through sensitivity analysis. Monte Carlo demonstrates yield stability, predicting a 100% probability of achieving at least 6 quintals per acre (1483 Kg/ha) under current input conditions. Policymakers can design targeted interventions to reduce regional productivity disparities and foster sustainable growth in the rapeseed-mustard sector. Findings also underscore the need for optimizing input utilization to balance economic, agronomic, and environmental outcomes, as well as adopting better practices for India’s oilseed sector.
1 Introduction
Rapeseed-mustard (Brassica spp.) stands as one of the most economically vital oilseed crops globally and occupies a pivotal position in the agricultural framework of India. It serves as a critical source of edible oil, significantly bolstering the domestic supply. Globally, rapeseed-mustard ranks as the third-largest source of edible oil, following soybean and palm oil (FAOSTAT, 2022). Beyond its oil production, the crop has diverse applications, including culinary, medicinal uses, and as fodder for livestock. India, the third-largest producer of rapeseed-mustard globally (Khatun et al., 2016; Devegowda et al., 2020; Rathour et al., 2023), contributes approximately 11% of global production, trailing Canada and China.
The geographic distribution of rapeseed-mustard cultivation in India is extensive, with notable concentrations in Rajasthan (46.63%), Madhya Pradesh (14.36%), and Haryana (11.63%), as reported by ICAR-DRMR. India’s rapeseed-mustard cultivation spans diverse agro-climatic regions, ranging from irrigated zones in Rajasthan and Haryana to rainfed systems in Madhya Pradesh and Uttar Pradesh. The crop demonstrates a remarkable adaptability to various soil types, thriving in light loam soils and performing well on sandy loam and clay loam soils (ICAR-DRMR, 2018). It plays a critical role in rural economies, particularly in Rajasthan, Madhya Pradesh, and Haryana, by providing employment and supporting livelihoods. Within this context, the state of Bihar, which serves as the focus of this study, underscores the importance of rapeseed-mustard as a key oilseed crop. In Bihar, rapeseed-mustard accounts for 0.08 million hectares of cultivated area, yielding 0.11 million tons (Rathour et al., 2022) with an average productivity of 1123 kg/ha (DES, Government of Bihar, 2021–22). These regions span diverse agro-climatic zones, from arid to semi-arid conditions, which underscore the need for efficient resource management practices to enhance productivity. With nearly 74% of the cultivated area under irrigation, efficient water management emerges as a critical determinant for optimizing yields (GoI, 2021). Despite its vital role, mustard yield in India is constrained by several challenges, including suboptimal input utilization, resource allocation inefficiencies, and climatic variability (Sarker et al., 2010; Khatun et al., 2016; Singh et al., 2017; Kumari, 2019; Rathour et al., 2023; Tiwari et al., 2024). The national average yield of rapeseed-mustard is approximately 1499 kg/ha (GoI (Government of India), 2021), significantly lower than the attainable potential under optimal agronomic practices (Verma et al., 2015). Input variations, encompassing land, labor, fertilizers, irrigation, and mechanization, contribute substantially to yield discrepancies. These inconsistencies not only limit productivity but also impact profitability and the long-term sustainability of mustard farming.
The productivity of mustard cultivation is heavily influenced by several biophysical factors, including soil fertility, nutrient management, and pest control. Soil nutrient deficiencies, particularly in sulphur, nitrogen, and phosphorus, are prevalent in many mustard-growing regions (Asiwal et al., 2013). Proper nutrient management, particularly the balanced use of fertilizers, has demonstrated significant potential to enhance yields (Alam et al., 2014). However, excessive or inefficient fertilizer application can lead to environmental degradation, increased production costs, and diminished returns. The integration of organic amendments, such as manures, with judicious chemical fertilizer application warrants further investigation to achieve a sustainable balance between productivity and environmental stewardship (Singh et al., 2014; Das and Sharma, 2018; Pawar et al., 2020; Gayathri and Chakrabarty, 2021).
Challenges such as inefficient input utilization, inadequate pest management, and climate variability further complicate mustard yield optimization (Tomar, 2019; Shukla and Gupta, 2020; Rathour et al., 2023). Inputs like labor, seed, fertilizers, and machinery show high variability in efficiency, requiring systematic analysis to understand their relationship with yield performance. Additionally, the study identifies critical research gaps and proposes risk management strategies to mitigate the effects of climate and economic uncertainties in mustard cultivation. Therefore, it employs advanced quantitative methods to clarify the links between input factors and mustard yield. For example, the use of the Cobb-Douglas production function models how effectively resources such as land, labor, and fertilizers are used in rapeseed-mustard cultivation (Chand and Singh, 2016). Meanwhile, Monte Carlo simulations offer a comprehensive framework for quantifying how input uncertainties impact yield distribution, helping to better understand associated risks and resource allocation opportunities. The research was to quantify the individual contributions of essential inputs specifically land, labor, fertilizers, irrigation, and machinery to rapeseed-mustard yields through the application of sensitivity analysis. Furthermore, the study rigorously evaluated the robustness, reliability, and stability of these results. This research highlights the paramount importance of optimizing resource utilization within rapeseed-mustard farming to mitigate the disparity between actual and potential yields. It strongly advocates for the implementation of sustainable agricultural practices that center on enhanced efficiency, economic viability, and environmental responsibility, which is indispensable for fortifying the resilience and global competitiveness of India’s rapeseed-mustard production.
2 Methodology
The study area was purposively selected as Begusarai district of Bihar state, India, which holds the distinction of being the top producer of mustard annually. Primary data were collected from two blocks within the district, chosen based on the high concentration of mustard growers (Sampa et al., 2021; Rathour et al., 2023). To ensure a representative sample, farmers were selected randomly with the support of agricultural extension officers from the respective blocks and Gram Panchayat officials. The data collection of 120 respondents were conducted through interviews using a pre-tested semi-structured questionnaire, designed to capture relevant cross-sectional data in 2022-23. After the data were gathered, they were organized and processed in Microsoft Excel, where they underwent necessary modifications, such as editing and coding to ensure the data were in the correct format for analysis. The subsequent statistical analysis was carried out using R Studio, which facilitated the data processing and modeling for the study.
2.1 Cobb-Douglas production function
To examine resource productivity and resource use efficiency across various types of production functions, the Cobb-Douglas production function in its logarithmic form was employed, as shown below:
Where,
Y = Yield of mustard or Output (Quintals Acre-1); X1= Land area under mustard cultivation (in Acre); X2 = Labor input (in hours); X3 = Seed (Costs in Rs.); X4 = Manures/FYM (Costs in Rs.); X5 = Sulphur (Costs in Rs.); X6 = Fertilizer (Costs in Rs.); X7 = PPC (Costs in Rs.); X8 = Irrigation (Costs in Rs.); X9 = Machinery (Costs in Rs.); X10 = Soil quality factors (based on a scale of 0 to 100); β0= Constant or intercept term; β1, β2, β3 ……. β10 is Coefficients of the respective input variables; Ui = Error term
The Cobb-Douglas production function was transformed into the following double-logarithmic (log-linear) form to facilitate solution using the least squares method:
Where ln represents the natural logarithm.
The explanatory variables in this study were chosen based on their expected influence on yield, as these factors are anticipated to have the greatest impact on mustard production. Additionally, previous literature (Sarker et al., 2010; Dhakal et al., 2015; Khatun et al. (2016); Sampa et al., 2021; Khatun et al., 2019; Tiwari et al., 2024) provided valuable guidelines for the selection of these variables.
2.2 Marginal productivity and value
The marginal productivity of a resource reflects the additional value generated by increasing the input of that resource by one unit, while holding other inputs constant. To calculate the Marginal Value Product (MVP) (Equations 2, 3), the Marginal Physical Product (MPP) (Equation 1), of an input is multiplied by the price of the output. The MPP & MVP for a given input was computed as:
or
Where, βi = Regression coefficient per variables; ȳ = Geometric mean of output (referred Table 1); = Geometric mean of inputs (referred Table 1); Pyi = Price of per unit of output; MFC = Price of per unit of input (This approach ensures that the MFC reflects the cost of using an additional unit of the input in terms of its contribution to output value) to get MFC simply divide MVP by MPP.
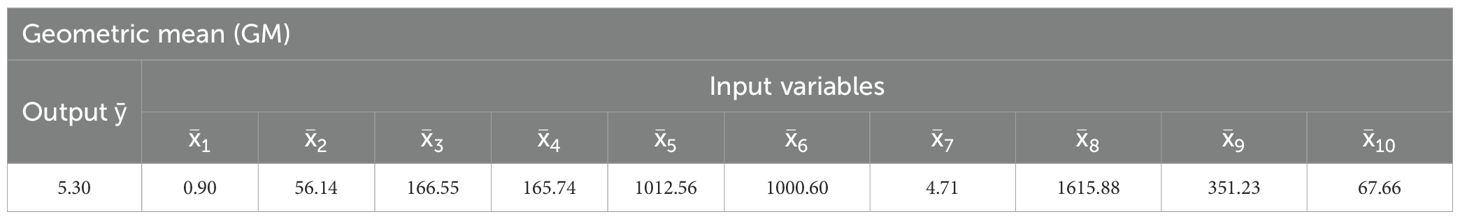
Table 1. Geometric means of output and input variables in rapeseed-mustard.
2.3 Resource use efficiency
RUE is defined as the ratio of the Marginal Value Product (MVP) to the Marginal Factor Cost (MFC) for each input used. This ratio helps determine whether the resource is being utilized optimally and is calculated as:
The RUE is tested to determine whether the value is greater than, equal to, or less than 1, which has important implications for resource allocation. The interpretation of RUE values is as follows:
If RUE > 1, it means the resource is underutilized and more of this input should be used to increase profit.
If RUE < 1, it indicates overutilization of the resource, suggesting that reducing its use could lead to cost savings.
If RUE=1, the resource is being optimally used, achieving maximum efficiency.
2.4 Monte Carlo simulation and sensitivity analysis
The study aimed to evaluate the impact of uncertainties in input levels such as land area, labor hours, and fertilizers on mustard yield using Monte Carlo Simulation. The simulation was designed to identify risks, assess the probabilities of different outcomes, and provide insights for better decision-making. The elasticity coefficients (βi) (Table 2) derived from the Cobb-Douglas production function served as parameters for the simulation. Geometric means (Table 1) of each input variable were used as baseline values, and variability was introduced to reflect real-world uncertainties, with inputs assumed to vary within ±10% of their mean values. Inputs followed specific probability distributions, including normal distribution for continuous variables like land, labor, and fertilizers, uniform distribution for costs with uncertain ranges such as plant protection chemicals and machinery, and triangular distribution for subjective factors like soil quality. The yield function was defined using the regression Equation 4:
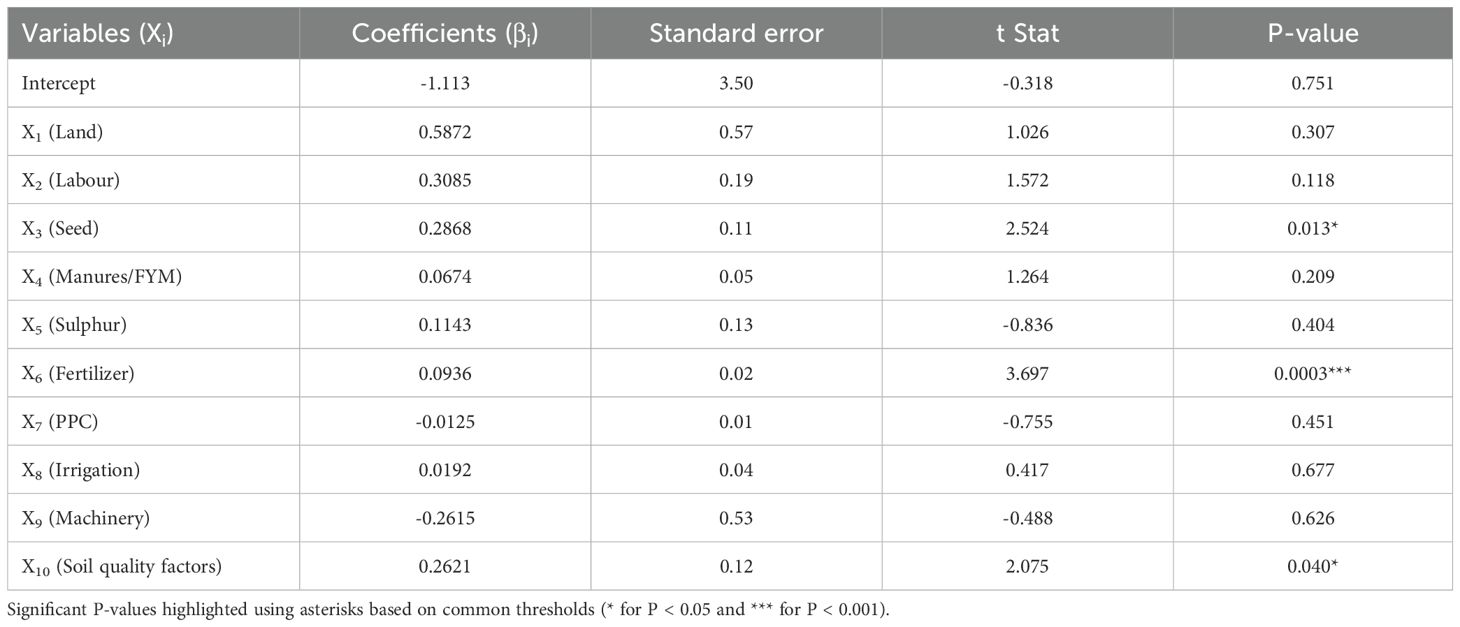
Table 2. Regression results for Cobb-Douglas production function in rapeseed-mustard cultivation.
Where, β0 is the intercept, βi are coefficients, and Xi are inputs.
Random variability was introduced for each input using the specified probability distributions, and yield calculations were repeated over a large number of iterations to generate a distribution of simulated yields. Summary statistics such as mean, standard deviation, and percentiles were calculated to evaluate the results, and probabilities of exceeding specific yield or profit thresholds were estimated. The analysis was conducted using R Studio packages such as Sensitivity, Monte Carlo, and lhs. The simulation also incorporated the calculation of the marginal physical product (MPP) and the marginal value product (MVP). Contribution (Equation 5) to yield was expressed as
Sensitivity analysis was conducted to assess the impact of individual inputs on yield by examining how output varies with changes in each input. Skewness and kurtosis were calculated assuming a normal distribution (Figure 1) unless stated otherwise, and confidence intervals were estimated as Mean ± 1.96 × SD/√n, ……… (vi), where ‘n’ is the sample size and SD is the standard deviation. The unit of measurement for farm area was defined as an acre, approximately equal to 0.4047 hectares (1acre ≈ 0.4047ha), and 1 quintal equals 100 kilograms (kg).
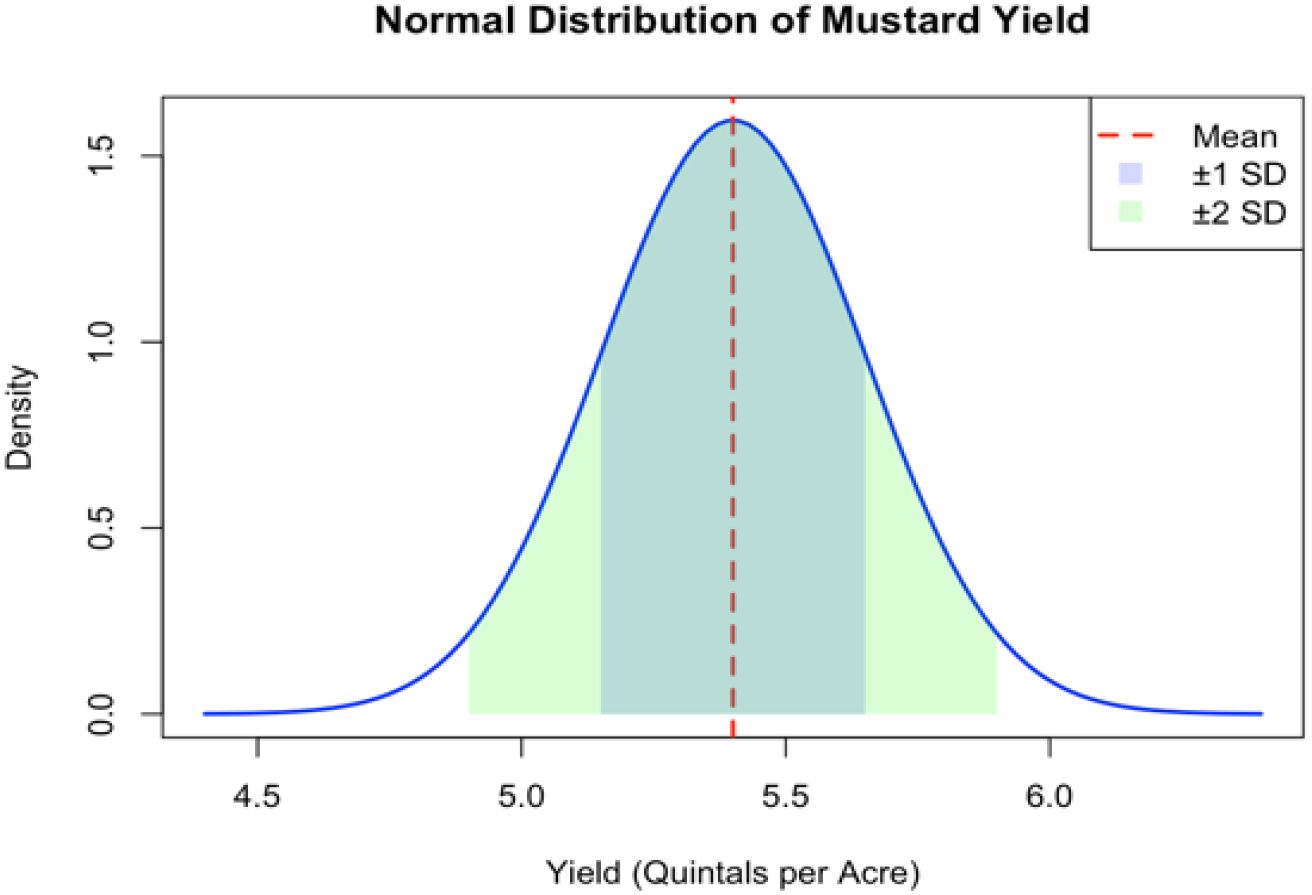
Figure 1. Probability density function of mustard yield under the normal distribution assumption.
3 Results and discussion
3.1 The resource use efficiency
The Resource Use Efficiency (RUE) values (Table 3) provided insights into the optimal use of resources in mustard farming. A high RUE above 1 indicates underutilization, suggesting that increasing the use of such a resource can lead to higher profits. In the present study, land with an RUE of 3.463 is underutilized, indicating that expanding mustard cultivation can significantly enhance yield and profitability. This aligns with findings by Sarker et al. (2010), which highlighted the importance of optimal land utilization in increasing agricultural output. In contrast, labor with an RUE of 0.005 is significantly overutilized, suggesting that reducing labor hours could lower costs without negatively affecting yields. This is consistent with the observations of Dhakal et al. (2015), who reported diminishing returns from excessive labor in smallholder agricultural systems. Similarly, seeds, with an RUE of 0.097, are also overutilized. Optimizing seed usage can improve cost efficiency while maintaining productivity, as supported by Khatun et al. (2016), who emphasized the importance of proper seed rates in mustard production. The overapplication of manures, reflected by an RUE of 0.068, indicates that reducing their usage can enhance cost efficiency. Excessive reliance on inputs like sulphur (RUE=0.019) and fertilizers (RUE=0.095) also suggests the need for optimization to minimize costs and avoid wastage. Similar conclusions were drawn by Dhakal et al. (2015), who highlighted the adverse effects of overusing micronutrients on profitability. Plant Protection Chemicals (PPC) show a negative RUE (-2.676), indicating counterproductive usage that reduces profits. Overuse of PPCs can have detrimental economic and environmental impacts (Tiwari et al., 2024; Khatun et al., 2019), recommended reducing such inputs for sustainable agriculture. Irrigation, with an RUE of 0.003, is another overutilized resource. Reducing water usage can improve cost efficiency while preventing issues like waterlogging, which negatively affect crop growth, as highlighted in Dhakal et al. (2015).
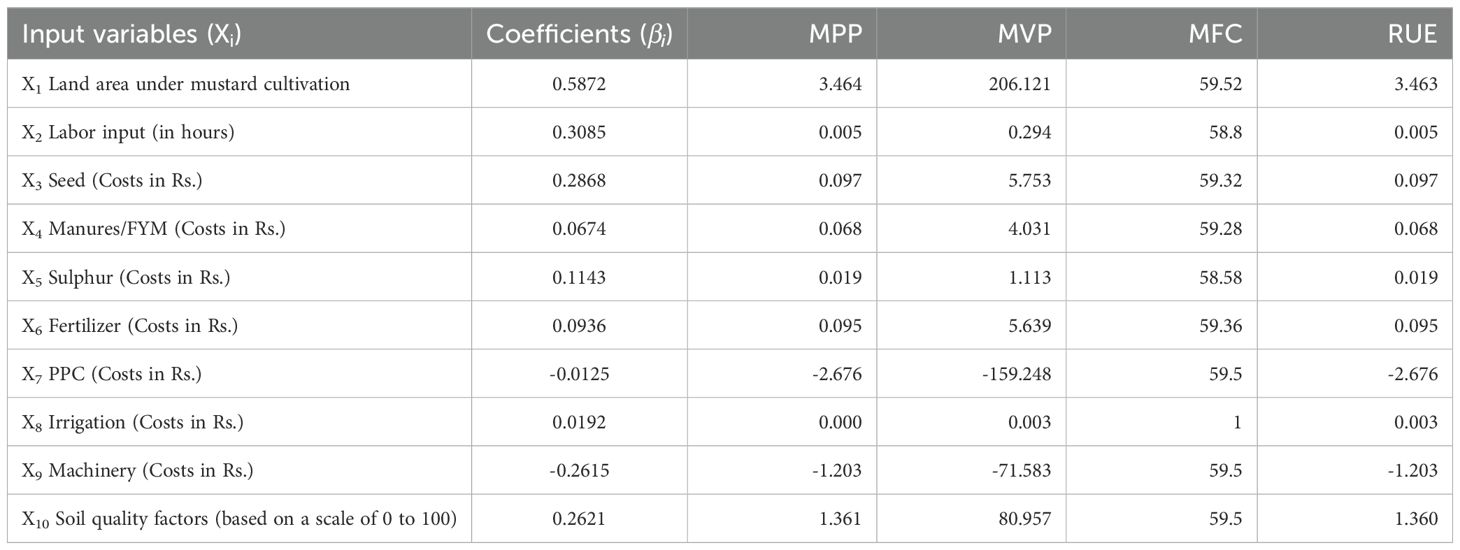
Table 3. The resource use efficiency (RUE) in rapeseed-mustard cultivation.
Machinery, with a negative RUE (-1.203), is overutilized, leading to reduced profits and potentially counterproductive outcomes in mustard cultivation. This finding suggests that current levels of machinery application such as tractors for land preparation, threshers, or irrigation pumps exceed optimal thresholds, resulting in high fixed and operational costs that outweigh yield benefits. In smallholder systems like those in Begusarai district, Bihar, where average farm sizes are small (Table 1), machinery overuse can lead to inefficiencies such as soil compaction, uneven application, or mismatched scale, ultimately diminishing marginal returns and contributing to negative yield impacts (Dubey et al., 2014; Murti, 2020). For instance, Dubey et al. (2014) reported in a cost-return analysis of rapeseed-mustard in Bharatpur, Rajasthan, that machine labor costs constituted 10-15% of total variable costs across farm sizes, with net returns declining on larger farms due to disproportionate mechanization expenses, implying similar inefficiencies in resource-scarce regions like Bihar. Soil quality factors, with an RUE of 1.360, are underutilized. Improving soil health through measures like organic amendments and soil testing can significantly enhance productivity. Tiwari et al. (2024) emphasized that soil quality is a critical determinant of resource productivity and profitability in mustard farming. This study carries significant implications for policymakers and agricultural stakeholders. By pinpointing high-impact inputs like fertilizers and soil quality while addressing inefficiencies in resource utilization, such as machinery and plant protection chemicals (PPC) (Verma et al., 2015; Sahu et al., 2018; Sharma et al., 2018). These results collectively highlight the need for optimized resource use to enhance efficiency and profitability in mustard cultivation.
The regression results highlight several significant variables (Table 2) that influence mustard yield. Fertilizer usage shows a highly significant positive relationship with yield, with a coefficient of 0.0937 and a P-value of 0.0003, indicating that an increase in fertilizer use leads to a substantial increase in yield. This finding aligns with the works of Sarker et al. (2010), which identified fertilizers as a major factor in enhancing crop productivity. Furthermore, the seed variable also demonstrates a significant positive impact (coefficient = 0.2868, P-value = 0.013). This suggests that optimized seed usage plays a crucial role in improving mustard yield, corroborating the conclusions drawn by Khatun et al. (2016) and Begum et al. (2020), who emphasized the importance of quality seeds in achieving higher agricultural output.
In contrast, soil quality factors also significantly affect yield, with a coefficient of 0.2621 and a P-value of 0.040. This result highlights the importance of soil health and its direct effect on crop performance. Dhakal et al. (2015) observed similar findings, indicating that soil conditions are integral to agricultural success.
However, several variables did not significantly influence mustard yield. Land area (coefficient = 0.5873, P-value = 0.307), labor (coefficient = 0.3085, P-value = 0.118), and manures (coefficient = 0.0674, P-value = 0.209) showed positive coefficients (see Table 2) but were not statistically significant, suggesting that, at current levels, these factors might not drastically impact yield (Verma et al., 2024). Interestingly, PPC (plant protection chemicals) displayed a negative coefficient of -0.0126, although it was statistically insignificant (P-value = 0.451). This finding may indicate that excessive reliance on plant protection chemicals could lead to inefficiencies, a result consistent with Sarker et al. (2010), who cautioned against overuse of chemical inputs. Additionally, the negative impact of machinery (-0.2615) with a high P-value (0.626) implies that overutilization of machinery might be counterproductive, possibly due to inefficiencies or costs outweighing the benefits (Verma et al., 2015).

Table 4. Statistical summary of the estimated production function.
The Multiple R value of 0.8421 indicates (Table 4) a strong positive linear relationship between the observed and predicted values. This suggests a high correlation between the variables. The R Square value of 0.7092 implies that 70.92% of the variation in the output is explained by the input variables in the model, indicating a good fit. The Adjusted R Square of 0.6796 adjusts for the number of predictors in the model, suggesting that around 67.96% of the variance in the output is explained by the inputs after considering the model’s complexity. The Standard Error of 0.47 shows the average distance that observed values fall from the regression line, with a relatively small value indicating that the model’s predictions are fairly precise. Returns to scale was 1.67, this indicates increasing returns to scale, as the sum is greater than 1 (Singh et al., 2017; Sarkar et al., 2020; Layek et al., 2021).
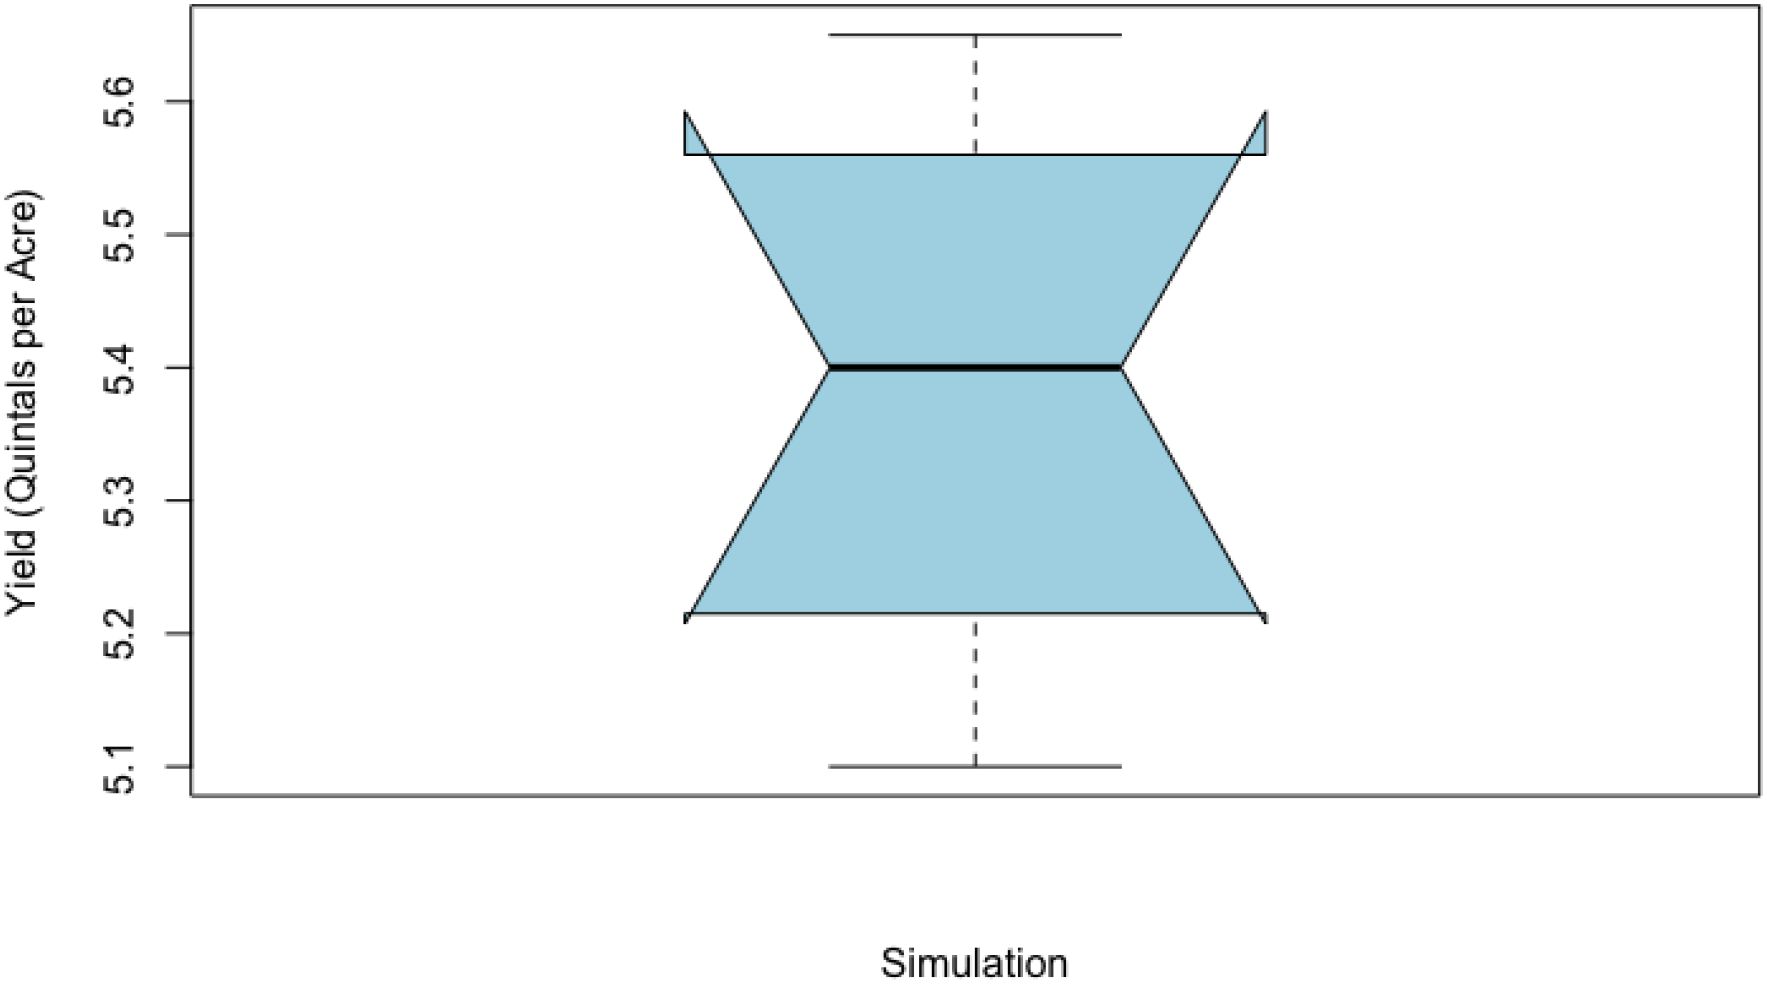
Figure 2. Box plot representing yield distribution for Rapeseed-Mustard. Median (5.4): Represented by the central line in the box. IQR (5.28 to 5.52): The box’s boundaries show the central 50% of the data. Whiskers (4.85 to 5.95): Indicate the range of expected yields assuming normality( ± 2 SD). Outliers (if any): Points outside the whiskers, representing rare yield outcomes.
3.2 Simulation of yield under uncertain input conditions and their contribution, summary statistics and visualizations
The Monte Carlo simulation offers an in-depth analysis of the potential yield distribution for mustard under uncertain input conditions (Jain et al., 2005; Kumrawat and Yadav, 2018). By introducing variability in key factors such as land area ( ± 10%), labor ( ± 15%), and seed costs ( ± 10%), and modeling soil quality with a triangular distribution centered at 70, the simulation allows for a comprehensive understanding of yield outcomes. The mean yield of 5.4 quintals per acre represents the expected output, indicating the average performance under these modeled conditions. The standard deviation of 0.25 quantifies the extent of variability, reflecting a stable system with relatively small fluctuations in yield. Analyzing the percentile values (Table 5b) offers further granularity:
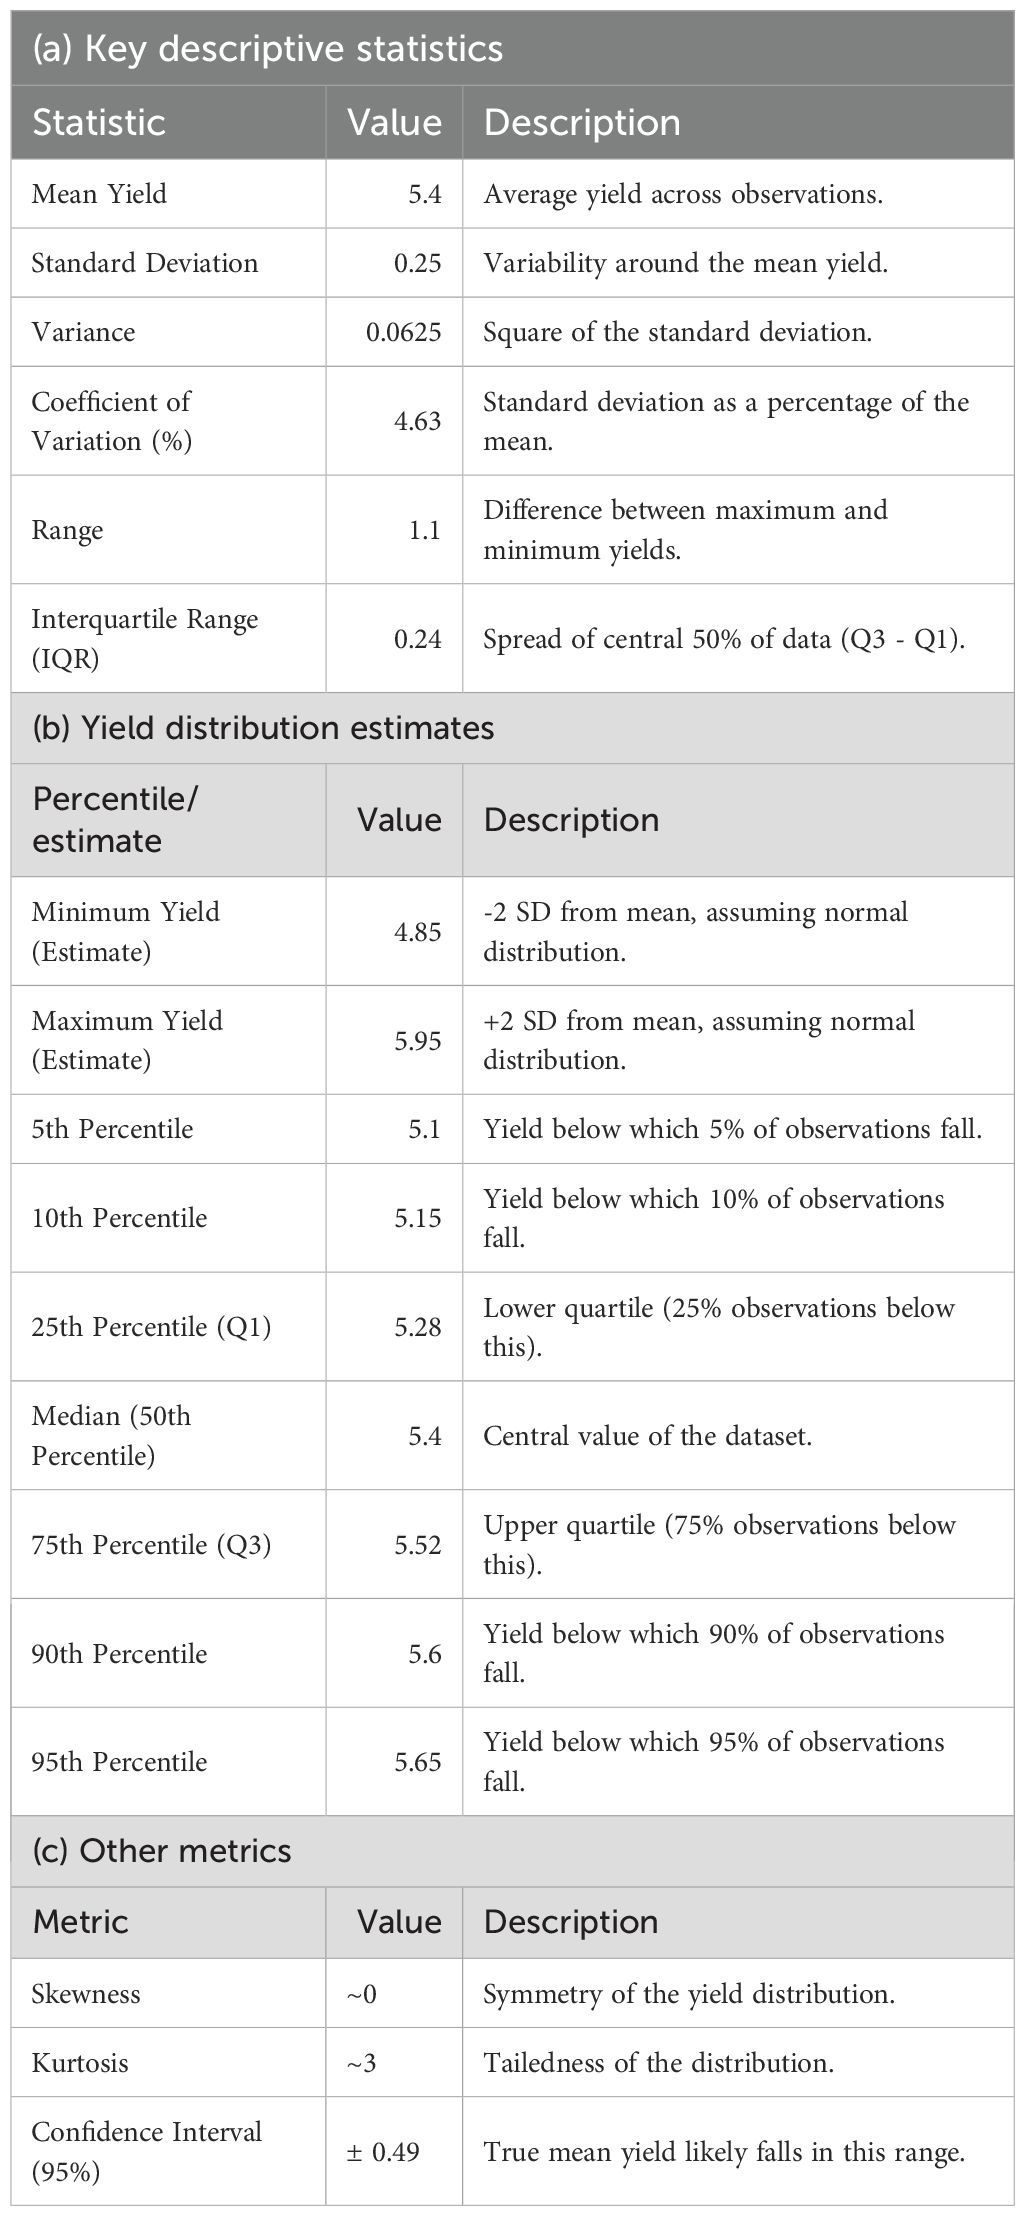
Table 5. Summery statistics for Monte Carlo yield distribution and normal distribution. Values in (Quintals per Acre).
The 5th percentile yield of 5.1 indicates that only 5% of simulations yielded values lower than this threshold, providing a conservative estimate of performance.
The 50th percentile (median) yield of 5.4 confirms that half the simulated outcomes were above this value, reinforcing it as the central tendency (Figure 2).
The 95th percentile yield of 5.65 suggests that 95% of the outcomes fall below this level, capturing a high-performance boundary.
The interquartile range (IQR) of 0.24 demonstrates that the middle 50% of yield outcomes are tightly clustered, further supporting the system’s stability.
The histogram visualization (Figure 3 of simulated yields provides a clear picture of the distribution, emphasizing its spread and central tendencies. The 100% likelihood of achieving at least 6 quintals per acre underscores the robustness of the inputs and model design (Figure 3). The probability of achieving the target yield of 1482 kg/ha was 100% (Figure 3), demonstrating the robustness of the current input levels under simulated uncertainties (Jain et al., 2005; Prasad et al., 2020). However, optimizing inputs like sulphur and fertilizer can further enhance yield potential, while reducing inefficiencies in machinery use could mitigate losses.
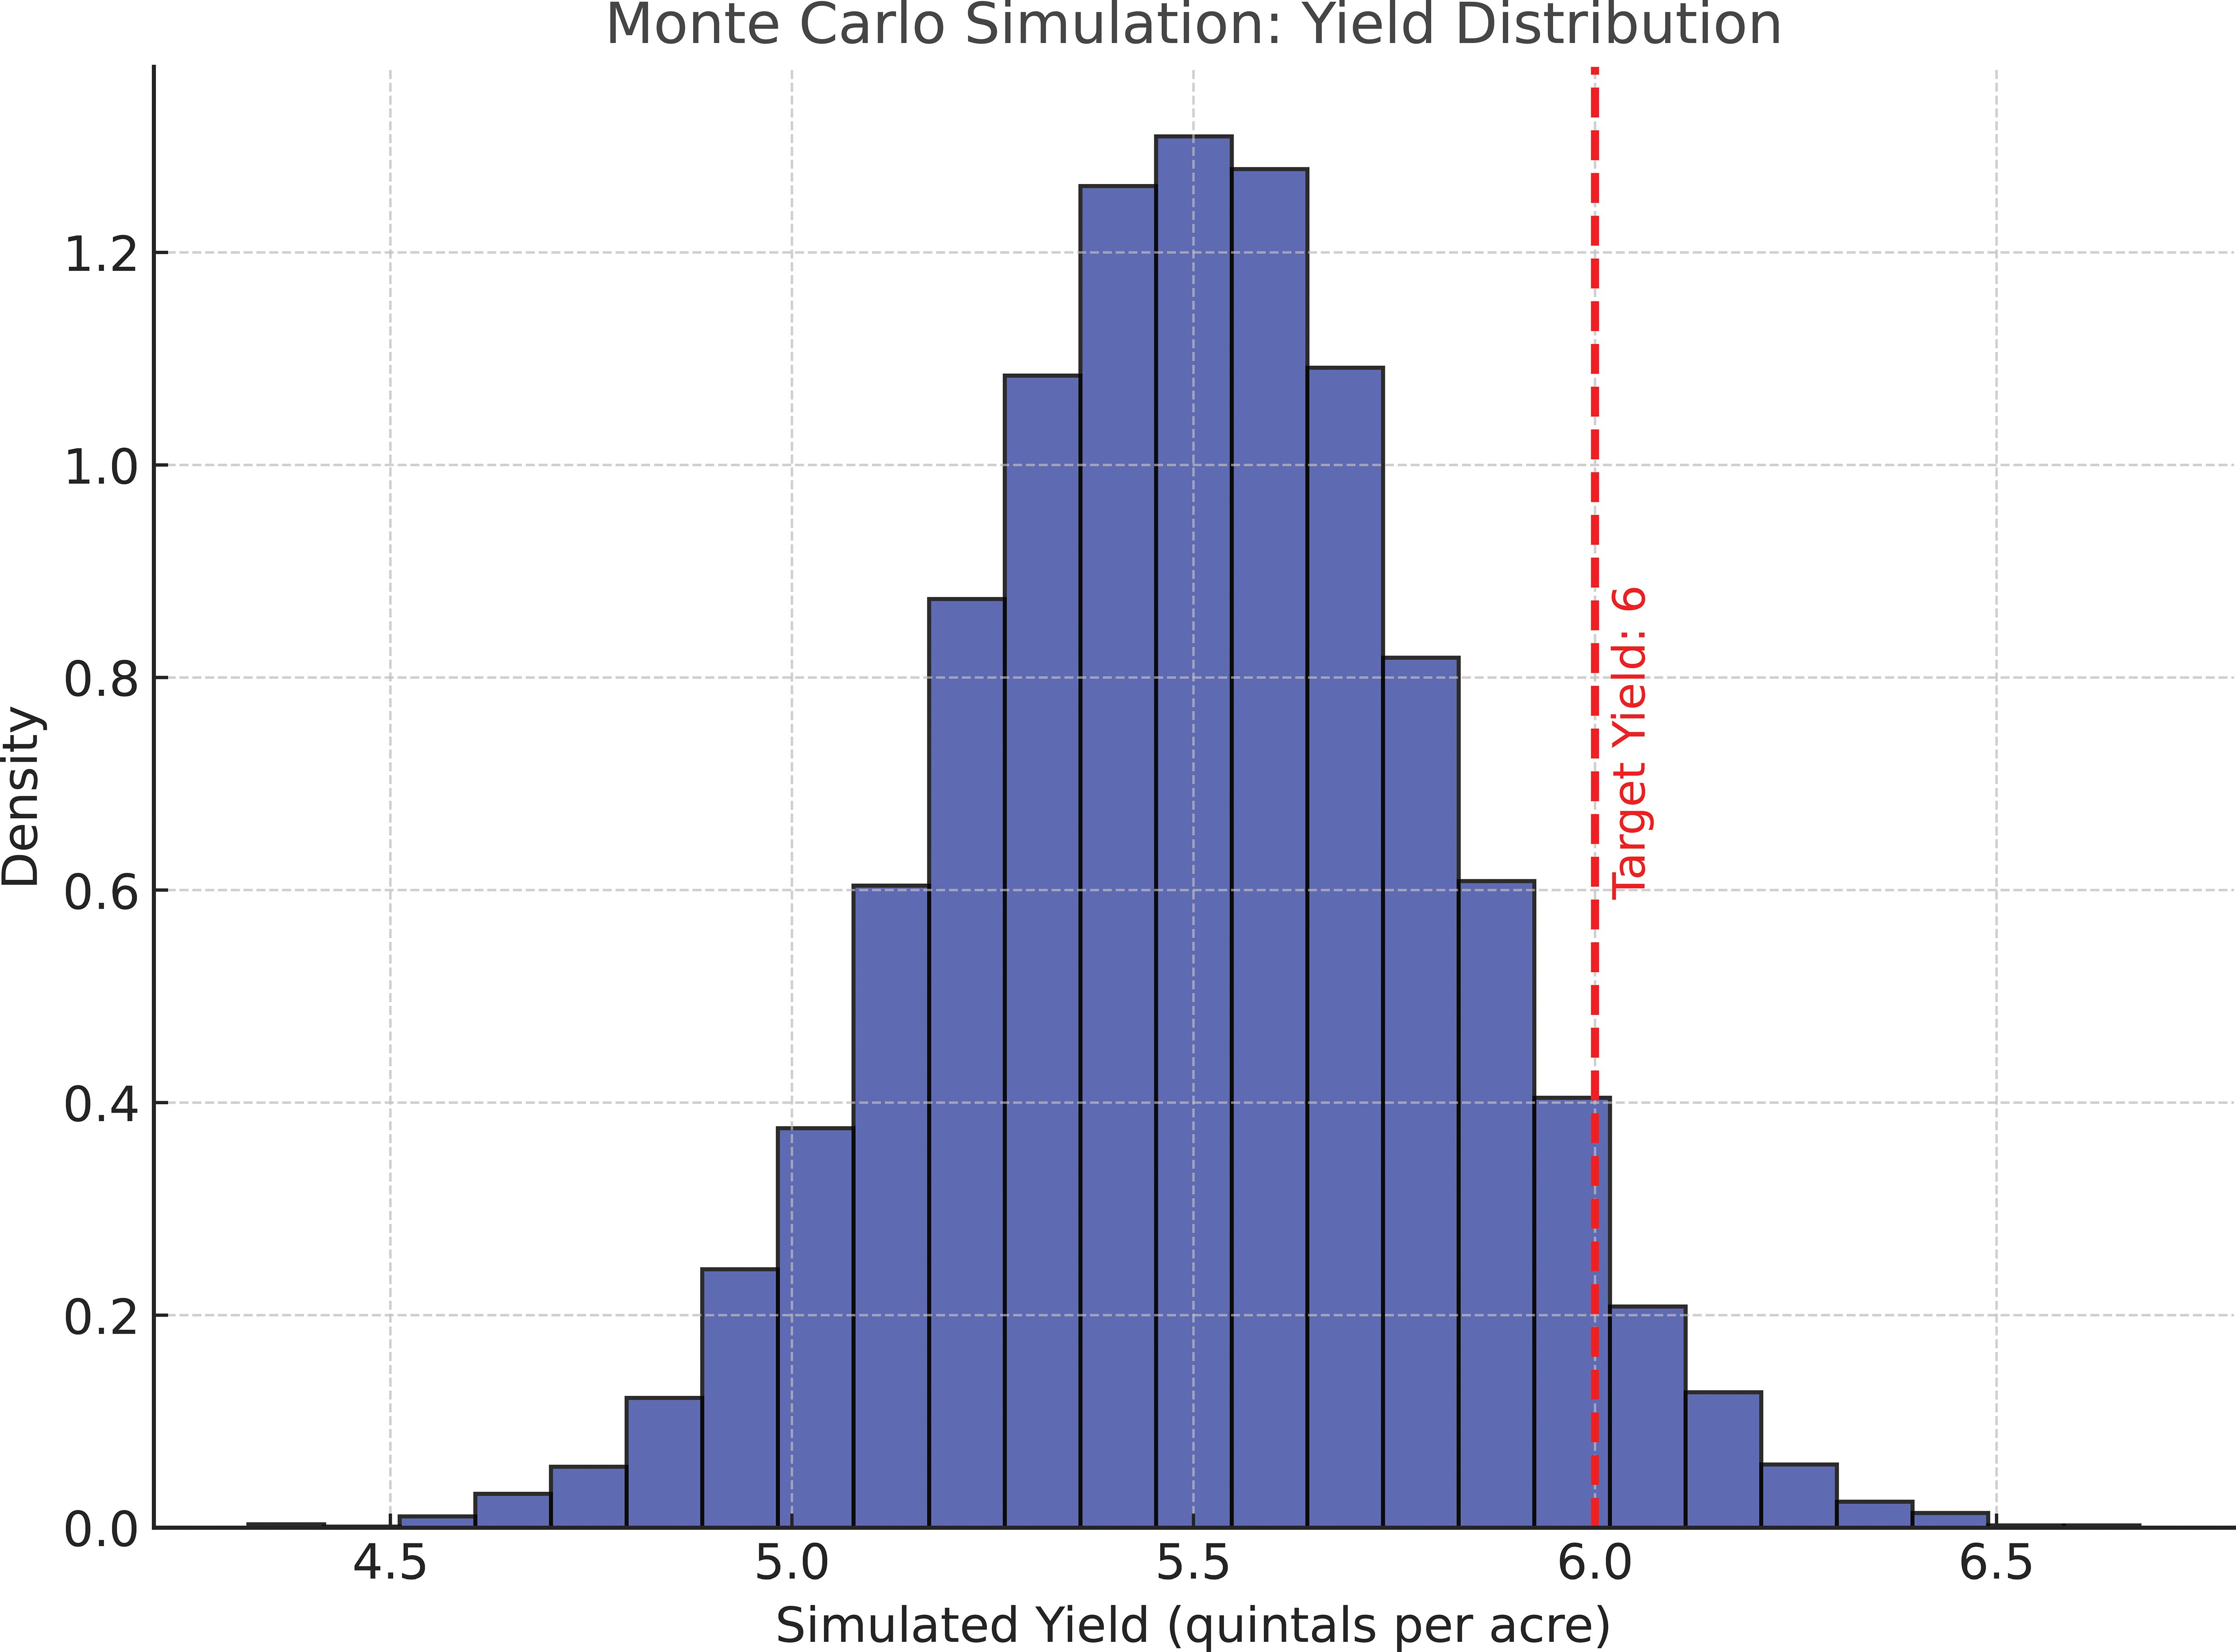
Figure 3. Monte Carlo simulation-based yield distribution with target threshold.
Insights derived from the simulation include an assessment of risks, where the probability of yields falling below key thresholds can guide strategic decisions. This simulation also enables scenario planning by identifying the inputs contributing most to variability, thereby suggesting areas where adjustments could optimize performance. By leveraging these insights, policies and interventions can be designed to minimize risks, enhance stability, and ensure consistent productivity.
Key sensitivity analysis highlighted (Table 6, Figure 4) the relative contribution of inputs to yield variability. Sulphur emerged as the most significant positive contributor to yield, accounting for 27.11% of the total variability, followed by fertilizer at 21.94%. These inputs demonstrated high marginal physical products (MPP), indicating their critical role in maximizing yield. This finding aligns with prior research emphasizing the importance of balanced nutrient management for crop productivity (Dhakal et al., 2015; Kumari, 2019; Khatun et al., 2019).
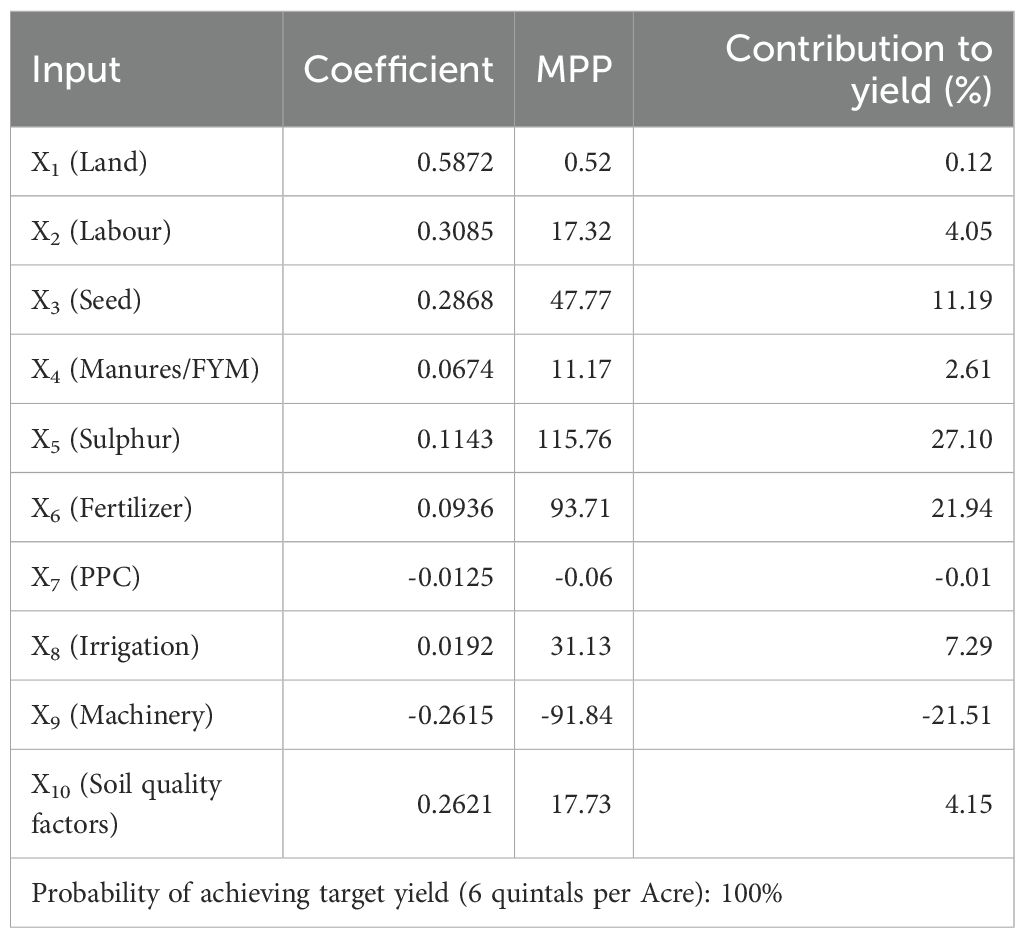
Table 6. The sensitivity results.
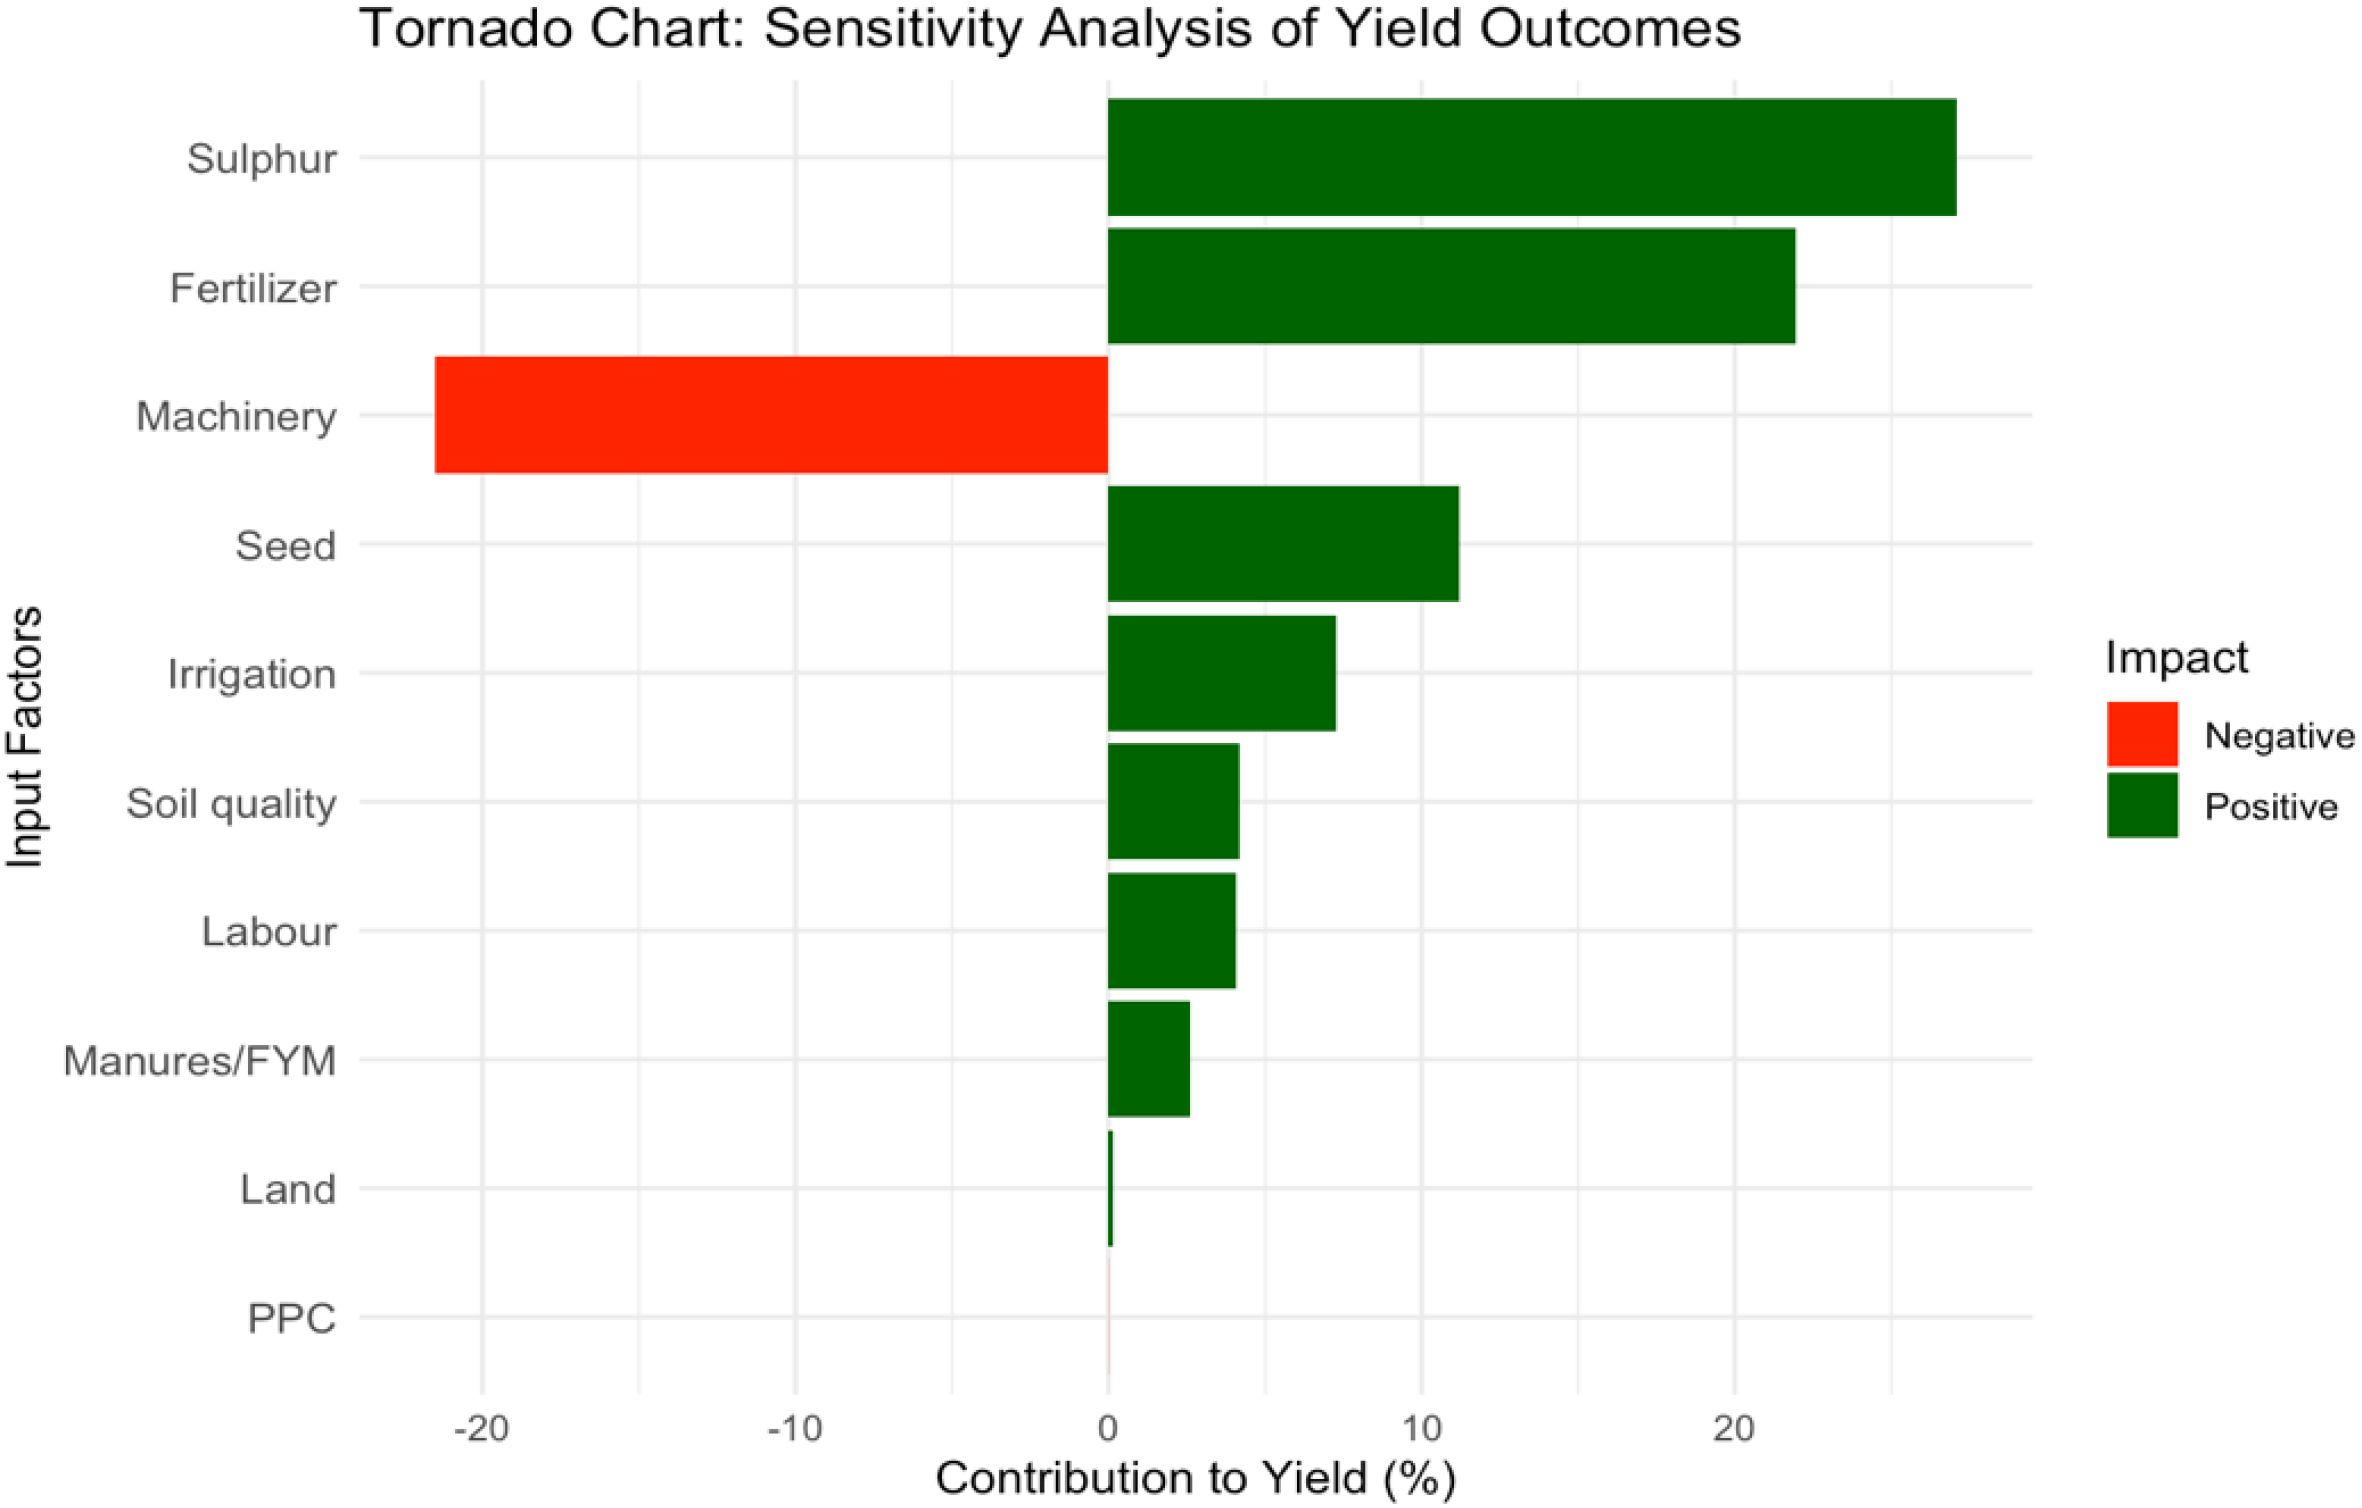
Figure 4. The bar plot of sensitivity.
Seed usage contributed 11.19% to the yield, highlighting its role in ensuring optimal crop establishment. Irrigation accounted for 7.29% of the yield variability, reflecting its importance in mitigating water stress and ensuring consistent growth. Land, despite being essential, had a relatively lower contribution (0.12%) (Table 6, Figure 4), suggesting that the current land allocation is near optimal and has limited scope for further impact under the simulated conditions.
Conversely, machinery use showed a significant negative impact on yield (-21.51%), indicating inefficiencies or overuse. This negative contribution underscores the need for a nuanced analysis of machinery’s role, as overutilization in simulated scenarios amplified yield variability under input uncertainties (10-15% variation). While machinery inefficiencies can reduce predicted yields by 5-10% in smallholder contexts (Murti, 2020), literature emphasizes multi-perspective solutions as economic (cost-benefit optimization), agronomic (scale-appropriate tech), and policy-driven (subsidies for efficient tools) to harness its inevitable benefits in modern rapeseed-mustard systems (Verma et al., 2015). This suggests the need to reevaluate machinery operations to minimize losses, aligning with findings from previous studies on cost efficiency in mustard farming (Dubey et al., 2014; Verma et al., 2015; Kumrawat and Yadav, 2018; Kumar et al., 2023). Similarly, PPC had a negligible and slightly negative impact (-0.01%) (Sarker et al., 2010) (see Table 6, Figure 4), indicating its limited or detrimental role in the current production system.
The results showed strong robustness, reliability, and stability, confirming consistent performance across diverse environmental and operational conditions. This ensures dependable yield predictions and accurate efficiency measurements, which can guide long-term decisions in mustard cultivation. The stability of outcomes under different scenarios further reinforced the trustworthiness of the findings.
4 Conclusion
The study highlighted the need to optimize fertilizer application, seed utilization, and soil management to enhance mustard yield. Efficient use of key inputs particularly sulphur and fertilizers along with improved management of machinery and plant protection chemicals was found to substantially increase productivity and profitability. Inefficiencies in machinery use and variability in input performance were identified as critical factors influencing resource allocation and risk management. The findings provide valuable insights for policymakers, who can design targeted strategies to reduce regional yield disparities, promote sustainable growth in the rapeseed–mustard sector, and advance climate-resilient farming practices. Such measures equip farmers with the tools and knowledge necessary to ensure efficient resource use and strengthen resilience against environmental challenges.
5 Recommendations and policy implications drawn from this study
The findings of this study highlight key policy directions to enhance resource use efficiency and sustainability in mustard cultivation. The positive RUE for land suggests that expanding cultivated land can boost profitability. Policymakers should promote land consolidation, affordable leasing, and financial support for marginal farmers. Overutilized inputs such as labor, seeds, manures, fertilizers, sulphur, PPC, irrigation, and machinery indicate inefficiencies that can be mitigated through targeted training on optimal input use and integrated nutrient management.
Improving soil health, with its RUE greater than one, should be a priority through subsidized organic amendments and widespread promotion of soil testing services. Negative RUE for PPC and machinery highlights the need to reassess subsidies and explore more efficient alternatives, such as integrated pest management and customized mechanization strategies for small-scale farmers. Efficient irrigation practices, including micro-irrigation systems, should be incentivized to reduce water wastage and enhance resource efficiency.
Inputs like sulphur and fertilizers, which significantly contribute to yield, should be prioritized in subsidy programs to ensure affordability while promoting bio-based alternatives to reduce dependency on chemical inputs. The adoption of precision agriculture technologies, such as GIS-based soil mapping and automated irrigation, can optimize resource use and minimize variability. Public-private partnerships should drive innovation and accessibility in these areas.
Yield variability can be addressed through yield-indexed insurance schemes, providing a safety net while encouraging best practices. Research and development investments are essential to refine the use of PPC and machinery, fostering evidence-based solutions for efficiency. These measures collectively aim to balance profitability and sustainability, ensuring resource-efficient mustard farming.
Data availability statement
The raw data supporting the conclusions of this article will be made available by the authors, without undue reservation.
Ethics statement
Ethical approval was not required for the study involving humans in accordance with the local legislation and institutional requirements. Written informed consent for participation was not required from the participants as the study did not involve the collection of sensitive personal data or interventions affecting participants’ rights, safety, or well-being. All research activities were carried out with integrity, ensuring respect for confidentiality, voluntary participation, and compliance with ethical standards for responsible scientific conduct.
Author contributions
SR: Conceptualization, Data curation, Formal analysis, Software, Writing – original draft. MK: Resources, Supervision, Validation, Writing – review & editing, Visualization. PS: Methodology, Supervision, Validation, Writing – review & editing, Visualization. VK: Validation, Writing – review & editing, Visualization. SK: Supervision, Validation, Writing – review & editing, Investigation, Resources. HJ: Formal analysis, Software, Writing – review & editing. SD: Data curation, Formal analysis, Software, Writing – review & editing.
Funding
The author(s) declare that no financial support was received for the research and/or publication of this article.
Acknowledgments
The authors would like to thank the participants for their involvement in this study.
Conflict of interest
The authors declare that the research was conducted in the absence of any commercial or financial relationships that could be construed as a potential conflict of interest.
Generative AI statement
The author(s) declare that no Generative AI was used in the creation of this manuscript.
Any alternative text (alt text) provided alongside figures in this article has been generated by Frontiers with the support of artificial intelligence and reasonable efforts have been made to ensure accuracy, including review by the authors wherever possible. If you identify any issues, please contact us.
Publisher’s note
All claims expressed in this article are solely those of the authors and do not necessarily represent those of their affiliated organizations, or those of the publisher, the editors and the reviewers. Any product that may be evaluated in this article, or claim that may be made by its manufacturer, is not guaranteed or endorsed by the publisher.
References
Agricultural Statistics at a Glance (2022). Ministry of Agriculture and farmers welfare, Government of India.
Alam M. M., Begum F., and Roy P. (2014). Yield and yield attributes of rapeseed – mustard (Brassica) genotypes grown under late sown condition. Bangladesh J. Agric. Res. 39, 311–336. doi: 10.3329/bjar.v39i2.20434
Asiwal B. L., Singh S., and Sharma N. K. (2013). Adoption gap and constraints in adoption of imptroved mustard production technology in semi-arid region of Rajasthan. Ind. J. Extn. Educ. R.D. 21, 105–108.
Begum M. E. A., Miah, Matin M. A., Easmin F., and Hossain M. I. (2020). Socioeconomic determinants of BARI mustard-14 adoption at farm level in selected areas of Bangladesh. J. Bangladesh Agric. University. 18, 180–188. doi: 10.5455/JBAU.94761
Chand R. and Singh S. (2016). Agricultural transformation in India: the role of policy and investments. Indian J. Agric. Econ. 71, 290–304.
Das K. K. and Sharma A. (2018). Effects on input use on rapeseed and mustard production in Nagaon district of Assam, India. Int. J. Curr. Microbiol. Appl. Sci. 7, 629–634. doi: 10.20546/ijcmas.2018.705.077
DES (Directorate of Economics and Statistics), Government of Bihar Patna (2018-19). Agricultural Statistics 2018-19 (Bihar: Department of Agriculture).
Devegowda S. R., Badal P. S., and Sharma A. (2020). Analysis on export competitiveness of oilseeds with BRICS countries. J. Oilseeds Res. 37, 259. doi: 10.56739/jor.v37iSpecialissue.141327
Dhakal C. P., Regmi A. P., and Thapa S. (2015). Resource productivity and efficiency in mustard production: Evidence from Nepal. Int. J. Appl. Sci. Biotechnol. 3, 604–608. doi: 10.3126/ijasbt.v3i4.13525
Directorate of Economics and Statistics, Government of Bihar (2024). Area, Production & Yield of Oil Seeds during year 2018-19 (1)Farmers Welfare, Government of India).
Dubey L. R., Pal H. R., and Singh S. P. (2014). A study of costs and returns for rapeseed-mustard on the sample farms of Bharatpur district of Rajasthan. Agric. Sci. Digest. 34, 257–262. doi: 10.5958/0976-0547.2014.01015.5
FAOSTAT (2022).Crops and livestock products. Available online at: http://fao.org/faostat/en/data/QCL (Accessed August 10 2025).
Gayathri H. and Chakrabarty Y. S. (2021). Economics of rapeseed-mustard in Imphal west district of Manipur. Indian Res. J. Ext. Edu. 21, 83–86.
GoI (Government of India) (2021). Agricultural Statistics at a Glance (Ministry of Agriculture and Farmers Welfare, Government of India). Available online at: https://desagri.gov.in/wp-content/uploads/2021/07/Agricultural-Statistics-at-a-Glance-2021-English-version.pdf.
ICAR-DRMR (Indian Council of Agricultural Research - Directorate of Rapeseed-Mustard Research) (2018). Annual Report 2018-2019 (Bharatpur, Rajasthan: Directorate of Rapeseed-Mustard Research).
Khatun M., Hossain T. M., Miah M. M., Khandoker S., and Rashid M. A. (2016). Profitability of sunflower cultivation in some selected sites of Bangladesh. Bangladesh J. Agric. Res. 41, 599–623. doi: 10.3329/bjar.v41i4.30694
Khatun M., Rashid M. A., Khandoker S., Kundu N. D., and Matin M. A. (2019). Resource use efficiency analysis in strawberry production in selected areas of Bangladesh. SAARC J. Agriculture. 17, 189–200. doi: 10.3329/sja.v17i1.42771
Kumar S., Rathour S., Anand A., Wadhwan M. K., and Rahaman M. (2023). Cost of cultivation and constraints analysis of soybean production in Khagaria district of Bihar state: An exploratory study. Agro Economist - Int. J. 10, 333–339. doi: 10.30954/2394-8159.04.2023.5
Kumari P. (2019). Identification of factors influencing yield gap of rapeseed and mustard in Bihar (India) - A micro level analysis. Int. J. Pure Appl. Bioscience. 7, 429–432. doi: 10.18782/2320-7051.7743
Kumrawat M. and Yadav M. (2018). Trends in area, production, and yield of mustard crop in Bharatpur Region of Rajasthan. Int. J. Eng. Dev. Res. 6, 315–321.
Jain P. K., Singh I. P., and Kumar A. (2005). Risk in output growth of oilseeds in the Rajasthan state: A policy perspective. Agril. Econ. Res. Rev. 18, 115–133.
Layek N., Mula G., Sarkar A., and Roy B. (2021). Economics of mustard seed production - an analytical study from Terai zone of west Bengal. Indian J. Extension Education. 57, 78–85.
Murti M. (2020). Mechanisation and its effect on the productivity and employment in Bihar. Int. J. Appl. Res. 6, 441–443.
Pawar N., Mehla V., Devi M., and Malik D. P. (2020). Economic dimensions and resource use efficiency of mustard crop under sprinkler irrigation in Southern Haryana. J. Pharmacognosy Phytochemistry. 9, 1449–1452.
Prasad R. P., Shekhar D., Kundu M. S., Rakesh A. P., Kumari A., and Kumar C. (2020). Yield gap Analysis of Rapeseed- Mustard through Cluster Front Line Demonstrations in Darbhanga District of Bihar, India. Int. J. Curr. Microbiol. Appl. Sci. 9, 170–175. doi: 10.20546/ijcmas.2020.906.022
Rathour S., Kumari M., and Anil G. A. (2023). Rapeseed-mustard farming in Begusarai, Bihar, India: A holistic exploration of growth, economic viability, and hindrances. Int. J. Environ. Climate Change 13, 1611–1622. doi: 10.9734/ijecc/2023/v13i113316
Rathour S., Kumari M., Kumar S., Panda C. K., and Nahakpam S. (2022). Economics of rapeseed and mustard production in Begusarai district of Bihar. Economic Affairs. 67, 25–29. doi: 10.46852/0424-2513.1.2022.5
Sahu P. K., Kant K., Pratap H., and Singh C. (2018). Cost of cultivation of mustard crop in Fatehpur district of Uttar Pradesh. Int. J. Curr. Microbiol. Appl. Sci. 7, 3356–3361. doi: 10.20546/ijcmas.2018.708.359
Sampa A., Sarker F., Rahman M., and Begum R. (2021). Profitability and resource use efficiency of mustard cultivation. SAARC J. Agric. 18, 195–206. doi: 10.3329/sja.v18i2.51119
Sarkar M. A., Rahman H., Haque M. R., Islam S., and Sultana R. (2020). An economic study of the oilseed mustard variety binasarisha-4 production in some selected areas of Bangladesh. Saudi J. Econ Finance 4 (11), 506–512. doi: 10.36348/sjef.2020.v04i11.001
Sarker M. A. R., Alam K., and Gow J. (2010). Assessing the efficiency of resource use in mustard farming in Bangladesh. J. Agric. Science. 18, 192–200.
Sharma S., Raghuwanshi J. S., and Srivastava S. C. (2018). An economic analysis of costs and returns of rapeseed and mustard production in Morena district of Madhya Pradesh. J. Community Mobilization Sustain. Dev. 13, 475–482.
Shukla P. and Gupta J. K. (2020). Study of cost and profit strategies for the mustard crop in Madhya Pradesh. Curr. J. Appl. Sci. Technology. 39, 79–87. doi: 10.9734/cjast/2020/v39i2730922
Singh K. K., Kumar P., Singh R., Singh S. P., and Singh Y. P. (2017). An economic analysis of production and marketing in rapeseed-mustard crop in Meerut district of Uttar Pradesh India. Int. J. Curr. Microbiol. Appl. Sci. 6, 703–709.
Singh R., Sheikh F. M., and Singh R. (2014). Zero tillage of rapeseed and mustard cultivation in Thoubal district of Manipur : an economic analysis. Economic Affairs. 59, 335–343.
Tiwari A., Singh A., Tiwari R., and Khan N. (2024). Assess resource utilization efficiency in mustard cultivation on different size of sample farms. Int. J. Agric. Extension Soc. Dev. 7, 260–263. doi: 10.33545/26180723.2024.v7.i9l.1154
Tomar P. (2019). Cost and return structure of mustard crop in Bharatpur region of Rajasthan. Asian Resonance. 8, 2349–9443. E: ISSN No. 2349-9443.
Verma A., Gupta S., Singh I. J., Singh S. P., and Kumar A. (2015). Study the cost of cultivation and Net income of Mustard in different farm size groups on the fields. Plant Archives. 15, 841–842.
Keywords: rapeseed-mustard, resource use efficiency, input uncertainty, yield determinants, input contribution
Citation: Rathour S, Kumari M, Singh Badal P, Kamalvanshi V, Kushwaha S, Jatav HS and Devegowda SR (2025) Resource use efficiency and yield determinants in rapeseed-mustard cultivation: an integrated approach using Cobb-Douglas, Monte Carlo, and sensitivity analysis. Front. Agron. 7:1570033. doi: 10.3389/fagro.2025.1570033
Received: 02 February 2025; Accepted: 28 September 2025;
Published: 20 October 2025.
Edited by:
Simone Erotildes Teleginski Ferraz, Federal University of Santa Maria, BrazilReviewed by:
Victor Idowu Olugbemiga Olowe, Federal University of Agriculture, Abeokuta, NigeriaAnkita Rajendra Parab, University of Science Malaysia (USM), Malaysia
Yue Li, Kunming University of Science and Technology, China
Copyright © 2025 Rathour, Kumari, Singh Badal, Kamalvanshi, Kushwaha, Jatav and Devegowda. This is an open-access article distributed under the terms of the Creative Commons Attribution License (CC BY). The use, distribution or reproduction in other forums is permitted, provided the original author(s) and the copyright owner(s) are credited and that the original publication in this journal is cited, in accordance with accepted academic practice. No use, distribution or reproduction is permitted which does not comply with these terms.
*Correspondence: Sachin Rathour, c2FjaGlucnQ2MzhAYmh1LmFjLmlu; S. R. Devegowda, ZGV2ZWdvd2RhLnNyQHJndS5hYy5pbg==