 Alexander Wezel1,2
 Paola Migliorini2,3*
 Anna Brumer1Tommaso Gaifami2,4Angelica Marchetti2Geoffrey Floymont1Garance Guizard1Elsa Michel1Marie-Alix Renaud1
 Karla Škorjanc2Nicolas Allard5
 Stefano Bocchi4
 Alain Peeters2,5,6
- 1Agroecology and Environment Research Unit, ISARA, Lyon, France
- 2Agroecology Europe, Brussels, Belgium
- 3University of Gastronomic Science, Pollenzo, Italy
- 4Department of Environmental Science and Policy, University of Milan, Milan, Italy
- 5Natural Resources, Human Environment and Agronomy (RHEA) Research Centre, Corbais, Belgium
- 6Terres Vivantes, Corbais, Belgium
European agriculture faces major challenges in adapting and transforming current farming and food systems to become more sustainable. Agroecology is one transition pathway. However, what is lacking is assessing this transition with adequate tools and methodology. Here, we present the Original Agroecological Survey and Indicator System (OASIS) tool and apply it to farms in Belgium, France, and Italy as an illustration of its functionalities. In total, 53 conventional and organic farmers of three farming systems [crop production (CP); livestock production (LP), and mixed crop–livestock production (CLP)] were interviewed and data were collected for a large range of indicators (scoring from 1 to 5) across five dimensions: agroecological farming practices, economic viability, socio-political aspects, environment and biodiversity, and resilience. Overall, organic farms had slightly higher scores compared to conventional farms for the five dimensions. However, for the adoption of different agroecological practices, a clear difference was found, often with clearly higher scores for organic farms. There were also similar differences regarding most biodiversity and environment indicators and indicators for revenue and income sources. Farms that had higher overall farm scores also obtained a generally significantly higher mark for economic viability. Farmers described many parameters among the socio-political aspects dimension criteria, including several constraints that resulted in lower scores. Contrasting results for different criteria were found for the dimension of resilience, with some farms scoring higher for autonomy and independence from inputs and market, while others scored lower. As an operational result, overall, the OASIS tool proved applicable and useful in assessing agroecology at the farm level and some links beyond. However, further development could improve the tool.
1 Introduction
European agriculture faces major challenges in adapting and transforming current farming and food systems toward to be more sustainable, environmentally friendly, resource-use efficient, climate change resilient, economically viable, socially just, and culturally acceptable. Pathways identified and being promoted include the reduced and more efficient use of pesticides and fertilizers (European Commission, 2020a) and the elimination of synthetic ones through the development of organic farming. They halt and reverse biodiversity loss (European Commission, 2020b); integrate biodiversity conservation and enhancement at genetic, species, and agricultural landscape levels (European Commission, 2021); decrease dependence on global supply chains that can hamper food production and provisioning under crises such as the COVID-19 pandemic (Altieri and Nicholls, 2020; IPES-FOOD, 2020); and reduce vulnerability to increasingly frequent climate disasters (IPCC, 2022).
For the implementation and extension of those strategies in different countries in Europe, agroecology is seen as a promising path. It applies a systems and a local context-specific approach to provide sustainable agriculture and food systems that are socially just by providing work and employment in rural areas, economic benefits to farmers so that they can live decently from their work, and environmental services such as biodiversity conservation and the wise use of natural resources and external inputs (IPES-FOOD, 2016, IPES-FOOD, 2018; Poux and Aubert, 2018; Agroecology Europe, 2019; Bocchi, 2023). Moreover, it relies on 13 principles that cover several issues and themes, such as improving efficiencies with input reduction at the field level; enhancing soil and animal health, biodiversity conservation, and economic diversification at the agroecosystem level; land and natural resources governance, participation, fairness, social value and diets, and co-creation of knowledge at the farm and food system levels (HLPE, 2019; Wezel et al., 2020). Agroecology is now mentioned in the new CAP policies and more specifically under the eco-schemes (European Commission, 2021), but still needs to be translated into concrete measures and actions at the national level. The call for a transition to agroecology is widespread and the proposed and investigated transitions include different pathways, types, and levels of transitions, and multi-scale and multi-temporal dimensions (Duru et al., 2015; IPES-FOOD, 2016; Elzen et al., 2017; HLPE, 2019; Tittonell, 2020; Sachet et al., 2021; Meynard et al., 2023; Fonseca et al., 2024). They range from transition at the practice level, e.g., improving certain practices and making them more efficient (referring to level 1 of transition – Gliessman, 2007), or substituting practices (referring to transition level 2). Transition levels 1–3 are based on Hill and MacRae (1995) and included in the transition pathway framework presented by Gliessman (2007), which consists of five levels. At the farm level, it includes transitions with the redesign of the farming system, which also often includes multiple changes in practices or adaptation, new or diversified production systems, and step-by-step design (transition level 3; Meynard et al., 2023). Moreover, a full transition to agroecology would also need a transition at the territorial and food system levels. At the territorial level, this can include the development of a territorial-based agriculture through interaction with stakeholders such as farmers, supply chain actors, and local natural resources management actors (Duru et al., 2015), or development towards Agroecology Territories (Wezel et al., 2016) and bio-districts (Dara Guccione et al., 2024). At the food systems level, this can include reconnecting consumers and producers through the development of alternative food networks, and transforming the food system by building a new global food system (transition levels 4 and 5 – Gliessman, 2007, respectively).
The transition at the practice and farming system levels (levels 1–3 mentioned above) would apply to thousands of farmers in Europe. Although there is knowledge and methodologies to assess the current situation of farms, the agroecological system is so large, complex, and dynamic that the main current indicators used are not able to cover it fully. Using multiple indicators, ranging from agroecological practices to connection to consumers or markets, could cover this better to assess the concrete implementation of agroecology, and to what extent farms are engaged in this.
Different countries in Europe are increasingly developing and implementing national policies for agroecology (e.g., in France, UK, Germany) (Ajates Gonzalez et al., 2018; Bocchi, 2019; Lampkin et al., 2020; Wezel and David, 2020), and there are broader European level policies for agroecology (European Commission, 2023), alongside the recently launched European partnership in agroecology (European Commission, 2024a) and the recent Strategic Dialogue for the Future of Agriculture (European Commission, 2024b). On the world stage, agroecology has received international recognition in recent years from the FAO (Loconto and Fouilleux, 2019) and the Committee for World Food Security (HLPE, 2019) because new policies and global development are needed regarding world food production and distribution under the present global challenges of climate change, increasing world population, and world-wide loss of biodiversity and natural habitats.
At the farm level, many European farmers are already using different agroecological practices (although in most cases, they do not call them this). Currently, they are more often characterized as organic agriculture (Migliorini and Wezel, 2017), and sometimes fall within the conservation agriculture approach (Kassam et al., 2019) (in Europe this approach can include the use or non-use of herbicides for cover crop destruction, and outside Europe in addition can be combined with GMO crops), or with practices requested to receive the High Environmental Value (HEV) farming label in France, for example (Ministère de l’Agriculture, de l’Agroalimentaire et de la Forêt, 2016, 2023). Conventional farmers (non-organic certified) also have implemented different agroecological practices such as diversified crop rotations, intercropping, cover crops, and agroforestry, for example (Wezel et al., 2014; Moraine et al., 2016; Garini et al., 2017; Röös et al., 2022; Brumer et al., 2023), but regional, national, and European statistics are lacking on this topic, and is thus another research gap related to the real implementation of agroecological practices in Europe. However, transitions towards sustainable food systems must encompass more than one or two agroecology principles or practices, and should entail a systemic redesign of farming and food systems, taking into account environmental, economic, social, and cultural aspects (Wezel et al., 2020).
To be able to assess where a farm or a farming system is regarding the use of more sustainable practices or farm sustainability, assessment tools and methodologies are necessary. Some examples are MESMIS (Marco de Evaluación de los Sistemas de Manejo con Indicadores de Sustentabilidad) (Masera et al., 1999; López-Ridaura et al., 2002), MOTIFS (Monitoring Tool for Integrated Farm Sustainability) (Meul et al., 2008), the IDEA method (Indicateurs de Durabilité des Exploitations Agricoles or Farm Sustainability Indicators) (Zahm et al., 2008), Agroecoystems Sustainability Assessment (Sarandón and Flores, 2009), SAFA (Sustainability Assessment of Food and Agriculture Systems) (FAO, 2014), ISS (Integrated Sustainability Score) (Migliorini et al., 2018), and a combination of three sustainability assessment tools (SMART Farm Tool, Cool Farm Tool, COMPAS) (Landert et al. (2020), but there are also others such as TAPE (Tool of Agroecology Performance Evaluation) (FAO, 2019; Mottet et al., 2020), OASIS (Original Agroecological Survey and Indicator System) (Peeters et al., 2018, Peeters et al., 2021; Škorjanc et al., 2021), a farm-level version of the Agroecology Criteria Tool (F-ACT) Biovision (n.d.b), and a farm-level agroecology score using the GTAE methodology (Levard, 2023) that have been recently developed. Further approaches and tools have been reviewed (Geck et al., 2023). These methodologies and tools differ according to the specific goal, list of indicators, and farming systems targeted. Regarding the assessment of the implementation of agroecology, TAPE, F-ACT, GTAE farm level score, and OASIS seem to be of particular interest because they were specifically developed for this objective, and they also take into account the research gaps mentioned above regarding the implementation of agroecology. Whereas the TAPE tool is already documented for use in different countries (e.g., Namirembe et al., 2022; Gomori-Ruben and Reid, 2023; Lucantoni et al., 2023), this documentation is still lacking for other tools. In this paper, the focus will be on the OASIS tool, including an evaluation of the usefulness and applicability of the tool by an external evaluator.
The major objective of this paper is to document and test the use of the OASIS methodology and tool to investigate the implementation of agroecological practices and approaches, including aspects beyond the farm gate, such as connection to consumers or markets, by using a broad diversity of indicators. To this end, we conducted a case study involving a diverse range of farms in Belgium, France, and Italy, each facing unique circumstances in their adoption of agroecological practices and approaches. Further, we aim to assess the constraints and barriers in each of the five dimensions (agroecological farming practices, economic viability, socio-political aspects, environment and biodiversity, and resilience) that hinder farmers from advancing toward a more systemic implementation of agroecological approaches. Moreover, a third operational objective is to evaluate potential improvements of the OASIS methodology and tool. By applying OASIS to multiple farming systems, namely, crop production (CP), livestock production (LP), and combined crop-livestock production (CLP), including both certified organic and conventional farms, we aim to assess the tool’s limitations and potential and highlight aspects for future development.
2 Materials and methods
2.1 Method
In this research, the OASIS methodology is used for the assessment of selected farms in three countries. This tool was developed by the non-profit organization Agroecology Europe (Peeters et al., 2021; Škorjanc et al., 2021), with the involvement of different researchers. OASIS is a tool to assess the level of agroecological transition of a farm. It was designed to be widely applicable, not too time-consuming, and easy to apply. The first version was used in Kyrgyzstan (Peeters et al., 2018) and a second further developed version was applied to farms in Croatia and Greece (Škorjanc, 2020). The third version of the OASIS methodology description can be found in Peeters et al. (2021) and Škorjanc et al. (2021). It is currently composed of 56 criteria and 25 indicators, covering the five main dimensions of agroecology: agroecological practices, economic viability, socio-political aspects, environment and biodiversity, and resilience. The full list of the criteria and indicators in the five dimensions are listed in Annex 1. Indicators and criteria were selected from already existing tools for farm and sustainability assessment tools or frameworks and new indicators were developed for a broader coverage of the different dimensions of agroecology.
OASIS has been developed according to a hierarchical framework (Van Cauwenbergh et al., 2007). It is structured into a general objective, specific objectives, principles, criteria, indicators, and quantification method.
● General objective: Supporting the transition towards agroecology.
● Specific objectives: Assessing the farm’s current situation and potential future farm progress; Mapping the state of development of agroecological practices in a geographical area and collecting statistical data; Providing a tool to farmers for self-assessment; Helping decision makers, advisors, researchers, students, and citizens interested in agroecology.
● Principles: the 13 principles of agroecology as described in HLPE (2019).
● Criteria: Indicate the normative direction (what is and what is not desirable) that corresponds to one or several agroecological principles, and serve as the basic level of evaluation per single farm, but also allowing a comparison between farms. There are 56 criteria.
● Indicators: Measure the level of implementation of various practices or approaches, which are the practical implementation of the principles and strategies of agroecology.
● Quantification method: Each of the 56 criteria and the 25 indicators is evaluated on a semi-quantitative 1–5 scale, with 1 being the lowest and 5 the highest score. For example, a score of 1 corresponds to a conventional practice or baseline situation, 2 is a slightly improved conventional practice (for instance pesticide reduction on the basis of advice of a warning service), 3 is a practice revealing a significant transition, 4 is a practice revealing an advanced transition, and 5 is the full implementation of the agroecological practice. All criteria are evaluated directly with one indicator, except for three criteria for which several indicators are used and their scores aggregated (average of all indicator scores) to one score for the respective criterion. In total, there are 56 criteria and 25 indicators (Annex 1). Only some criteria are assessed by indicators. The way each score for each criterion is assessed is defined in OASIS “Methodology and guidelines for the assessor” (Škorjanc et al., 2021), translated into five languages1, where there are also specific interview question examples for each of the 56 criteria.
● Score per dimension reflects the average score of all the criteria scores under the respective dimension.
● No ranking or weighing between criteria.
● Agroecological practices are referred to as practices, as presented and defined in Wezel et al. (2014) and other examples can be found in Wezel (2017).
OASIS has some similarity to the TAPE methodology (FAO, 2019; Mottet et al., 2020), but focuses on farm assessment only, while TAPE also focuses on farm-level results, but within a certain territory, and uses participatory discussion and the validation of results. OASIS also includes a participatory discussion with farmers for the validation of the assessment. It offers the possibility for farmers to make comments on the tool and the opportunity to implement their remarks to improve the criteria. However, OASIS also takes the farming context in the region into account, but differently from TAPE, with some criteria assessed using regional averages. Both tools have different indicators and criteria and use different assessment methods. For instance, OASIS data collection does not require the existence of detailed farm accounting.
2.2 Materials
Data were collected from 53 farms located in Belgium (31 farms), France (13 farms), and Italy (9 farms). The French farms were located in western and south-eastern France, the Belgian farms in central and eastern Belgium, and the Italian farms in the Lombardy region (northern Italy). The farms were selected from networks of farms with which the authors were already working or had personal contacts. The aim was not to have a representative sampling of different farm types, but to gain initial insight into the application of OASIS in different farming and production systems and countries. Therefore, the farms sampled represented a large variety of farm types and crop and livestock productions to investigate OASIS’s applicability and limitations in these different systems. Three different types of farming systems were sampled: cropping (21 farms with purely CP), livestock production (16 farms dominated by LP), and mixed crop-livestock production (16 farms with CLP) (Table 1). The crop production farms included arable farms (winter and spring cereals and other arable crops), and those with horticulture and permanent crops, according to the European farm typology (Eurostat, 2022). Livestock systems include farms that specialize in animal production, which use any cultivated crops to feed animals (if there are crops). Mixed systems rely on cereals, other arable crops, vegetables, fruit, and animal production for income generation. In total, 29 out of the 53 farms were certified organic (8 in France, 15 in Belgium, and 6 in Italy). For a more detailed analysis, the farms were categorized according to both their farming system type and their organic or conventional farming management.
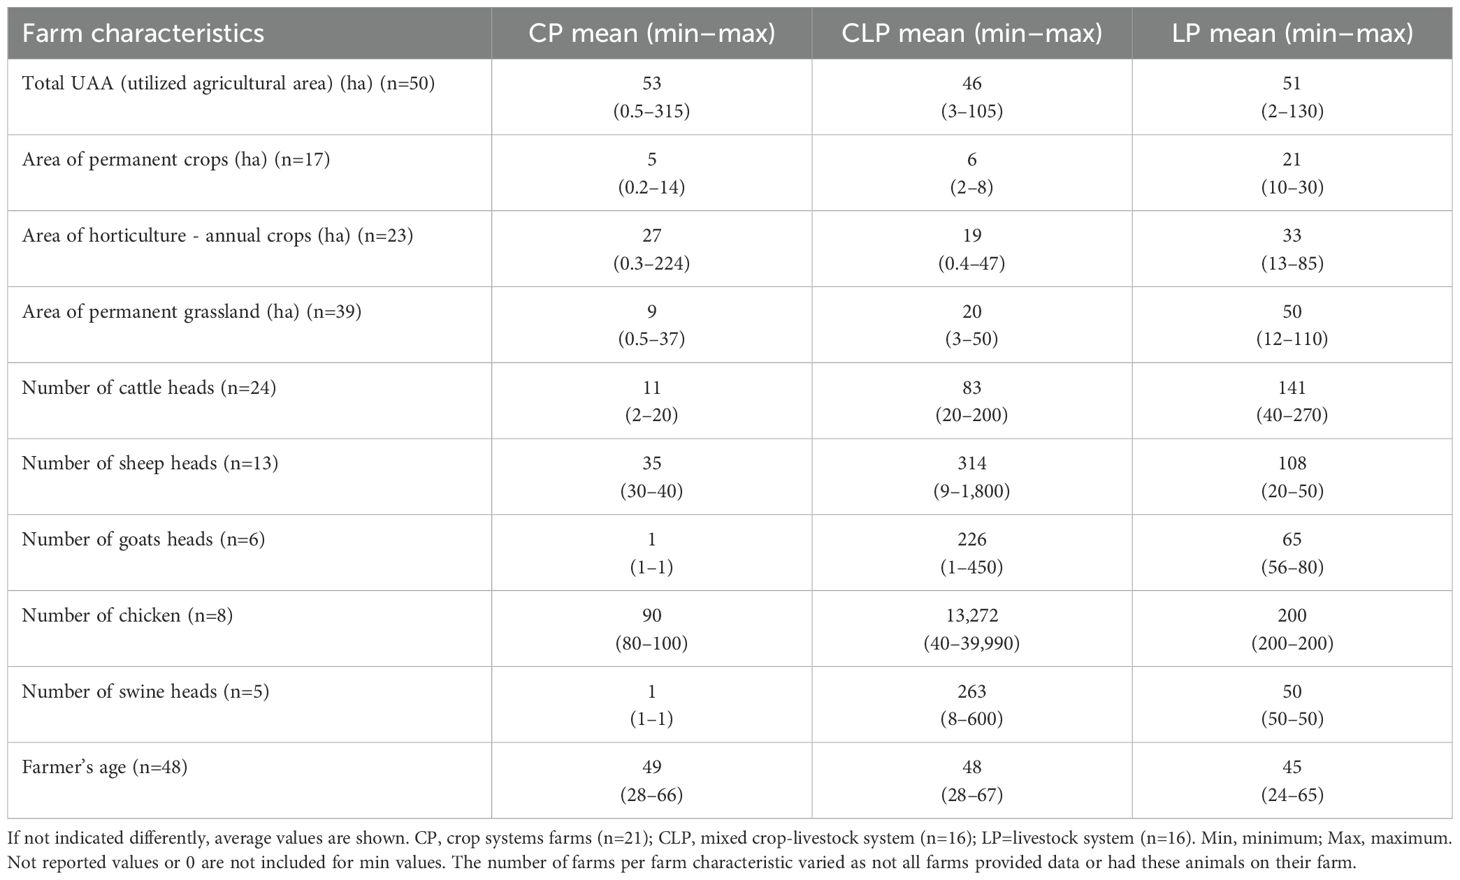
Table 1. Characteristics of the investigated farms in Belgium, France, and Italy.
Semi-structured interviews and in-person data collection were conducted for the 9 Italian farms and 24 Belgian farms. However, due to restrictions imposed by the COVID-19 pandemic, interviews with 13 French farmers and 7 Belgian farmers were conducted remotely using platforms such as Skype and Zoom. For the latter, Google Earth images and farm maps provided by the farmers were used for the spatial analysis and land use assessment of these farms, whereas this was done directly during the physical visits to the other farms. Interviews were carried out by the different authors of this paper, either by one or two people together. After each interview, an Excel sheet was filled out, giving a score for each indicator, using a semi-quantitative assessment based on a scale ranging from 1 to 5, with 5 being the best score for the respective indicator. For comparative analysis, we categorized farms according to farming system type, as mentioned above (CP, LP, and CLP), and into organic and conventional farms to build average group scores. This resulted in the following six farm types: Con-CP (conventional crop production farms, n=8), Con-CLP (conventional mixed crop-livestock production farms, n=5), Con-LP (conventional livestock production farms, n=4), Org-CP (organic crop production farms, n=12), Org-CLP (organic mixed crop-livestock production farms, n=8), and Org-LP (organic livestock production farms, n=12).
Some basic descriptive statistics were used to examine the farm characteristic data and performance criteria. For the relationships between farm categories and economic performance criteria, Pearson correlation analysis was applied.
2.3 Farm characteristics
To provide an overview of the diversity of the farms we assessed, we provide information about some farm characteristics for the three major farming systems we distinguished (Table 1). The average utilized agricultural area for the farms that specialized in crops (CP) was 53 ha, and this was a bit lower for the mixed crop livestock farms (CLP=46 ha); however, the agricultural area of the sampled farms varied greatly. For example, three CP farms in France that mainly produce vegetables had a very small area, whereas an Italian CP farm that specialized in rice was the largest (315 ha). The LP farms had 51 ha on average, ranging from 2 to 130 ha.
Among the CP and CLP farms engaged in market-oriented crop production, we found a wide variety of crop production systems, for example, only vegetables, vegetables and fruits, vegetables/fruits/arable crops, vegetables and eggs, only cereals, or only medicinal plants. There were also two farms with rice or rice and vegetables, and three farms with vineyards, including one with table grapes. The last three had a variety of agricultural production, including animals, animal feed, vegetables, and cereals.
The average area of permanent crops was quite similar for the CP and CLP farms (5–6 ha), but it was much higher for the LP farms (21 ha). The area of horticulture and annual crops was a bit larger for the LP farms, a bit lower for the CP farms, and again lower for the CLP farms. A clear difference existed between permanent grassland area of the different farm types, with the LP farms having an average of 50 ha, whereas the CLP farms’ permanent grassland area was much lower and the CP farms’ was very low compared to the LP farms.
Most animals were found on the CLP farms, except for cattle on the LP farms. However, a very large difference existed between the farms that had animals, depending on the main animal production focus. Furthermore, a few CP farms had animals, but these respondents indicated that the animals were only of minor importance for their farm production. Two CP farms and one CLP farm reported having one goat or swine on their farm.
The farmers’ average age was quite similar for all three farm types (45–49), but encompassed a wide range, from 24 to 67 years.
3 Results
Overall, the 53 farms obtained scores ranging between 1.9 and 4.9 out of 5.0 for the different criteria. The scores obtained in each of the five dimensions for the three farming systems in the organic and conventional groups varied between 2.6 and 3.9. The differences between the scores for the different farm types for the five dimensions show that, overall, organic farms had higher scores compared to the conventional farms (Figure 1). The differences were smallest between organic and conventional crop production farms (Org-CP, Con-CP) and highest for the CLP farms, in particular for agroecological practices, with the highest score difference of 1.3 points for organic CLP farms. For LP farms, some differences were also very remarkable, with organic LP farms having almost 1 point more than conventional LP farms for the agroecological practices and the biodiversity and environment dimensions.
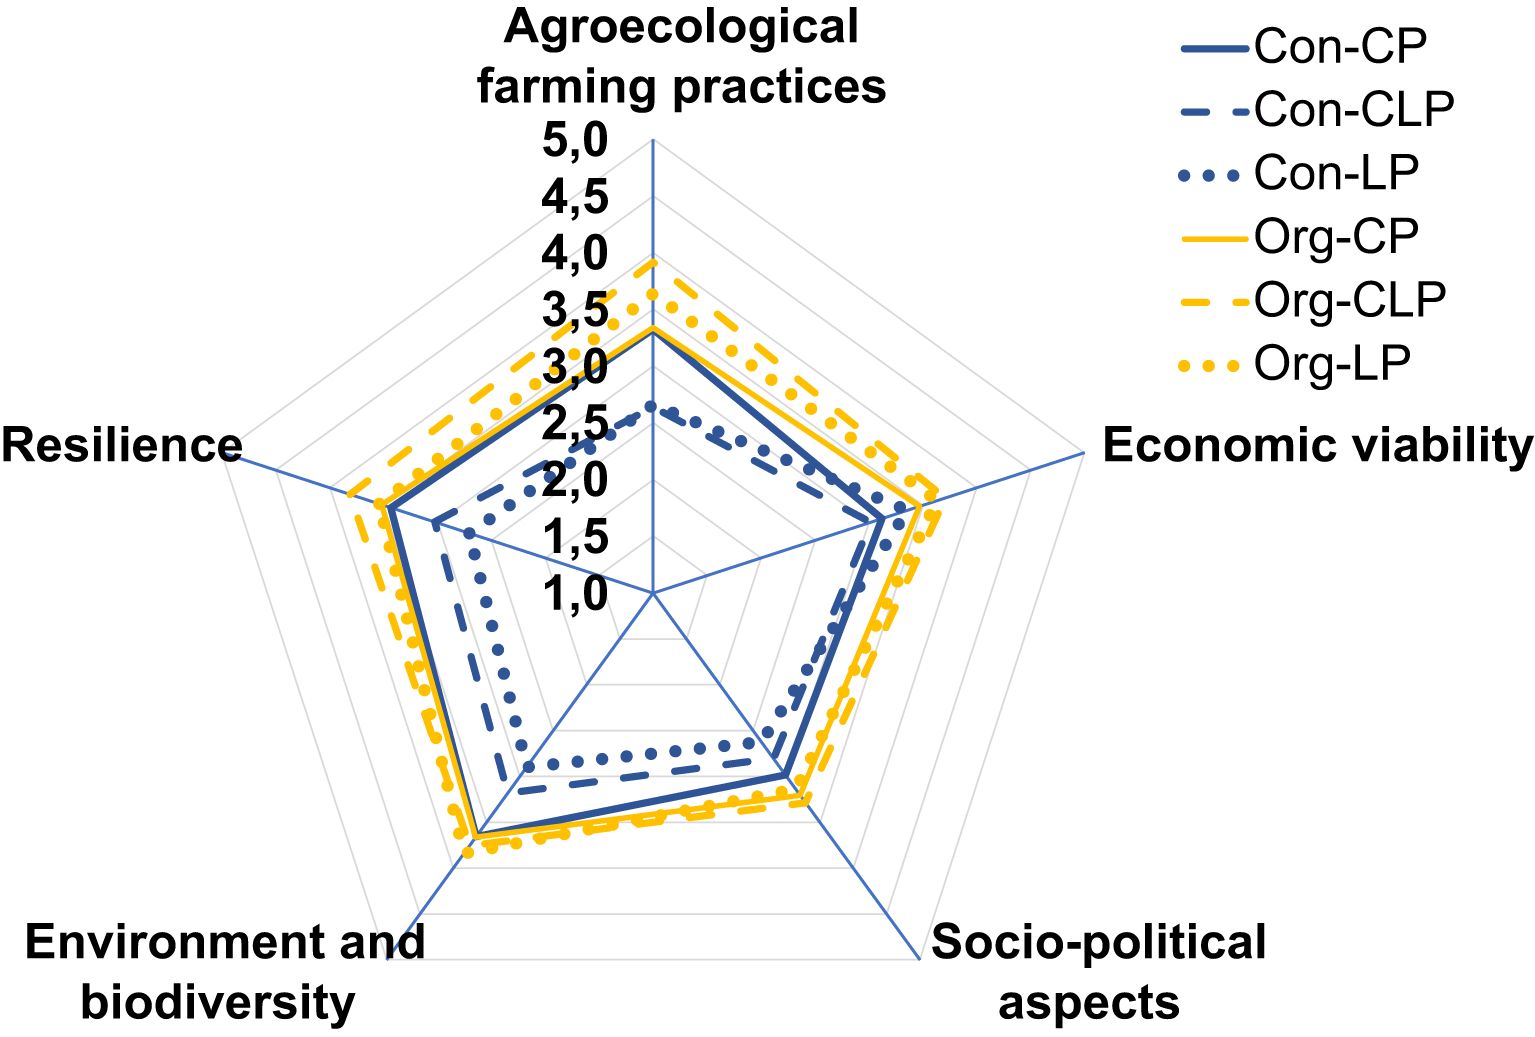
Figure 1. Average scores for different farming system types for the five dimensions for the farms in Belgium, France, and Italy. Con-CP, conventional crop production farms (n=8); Con-CLP, conventional mixed crop-livestock production farms (n=5); Con-LP, conventional livestock production farms (n=4); Org-CP, organic crop production farms (n=12); Org-CLP, organic mixed crop-livestock production farms (n=8); Org-LP, organic livestock production farms (n=12).
However, the analysis of the different criteria within each dimension revealed even more distinct differences between the three farming systems and the organic and conventional groups, as shown in Figures 2–6.
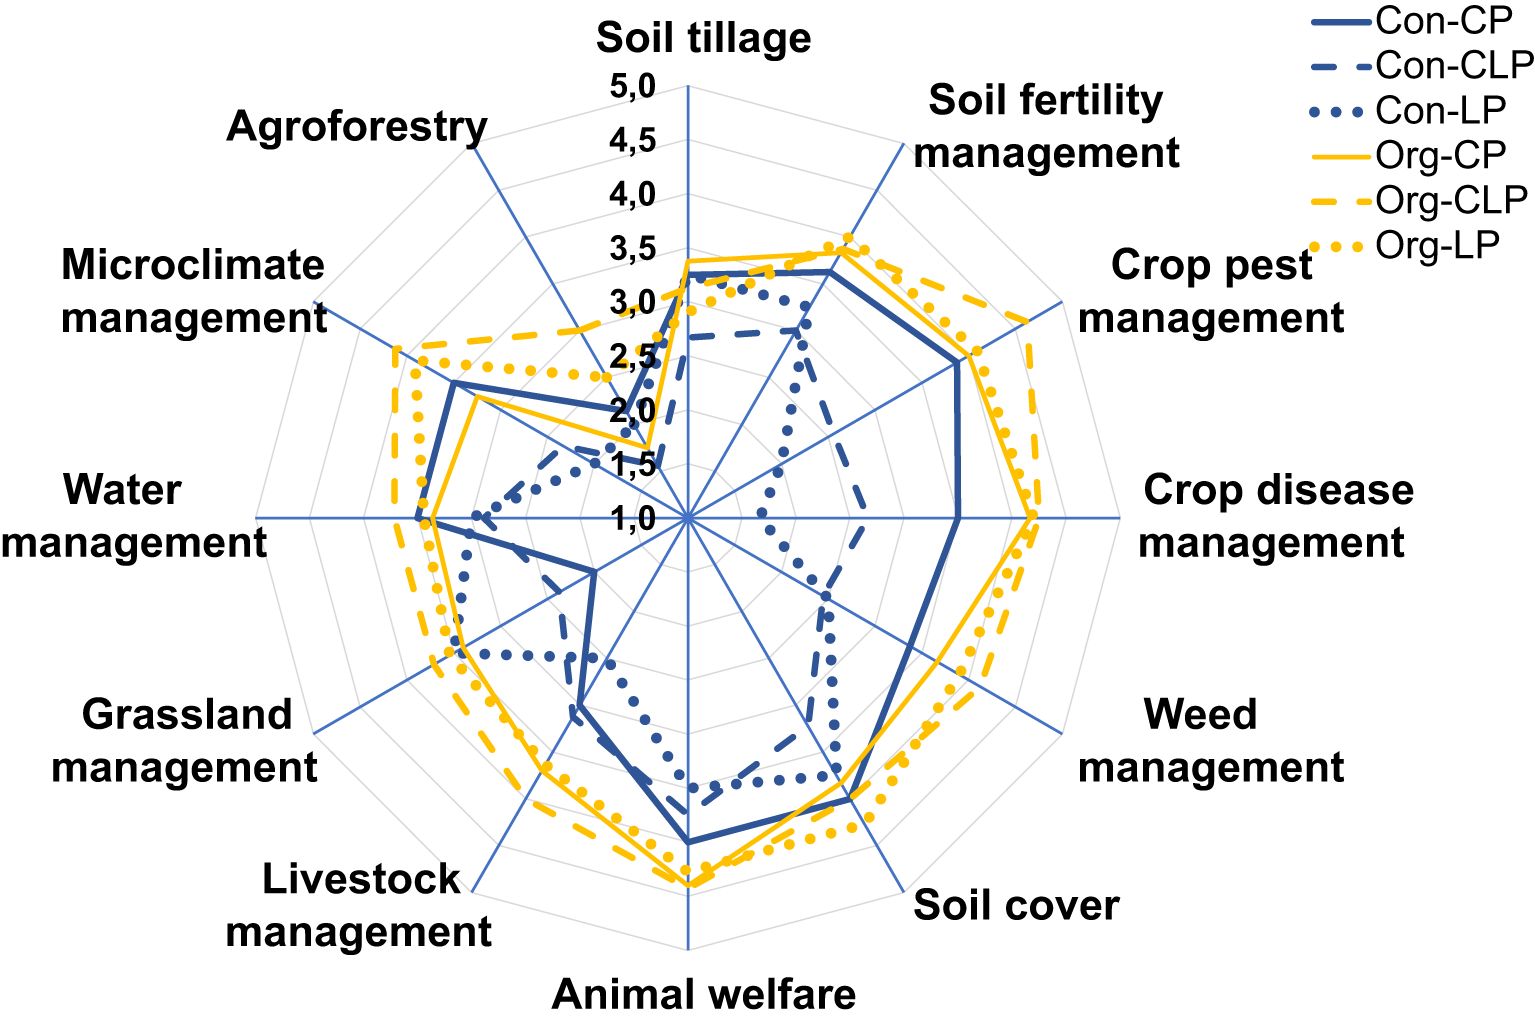
Figure 2. Average scores for the adoption of agroecological farming practices in different farming systems in Belgium, France, and Italy. Con-CP, conventional crop production farms (n=8); Con-CLP, conventional mixed crop-livestock production farms (n=5); Con-LP, conventional livestock production farms (n=4); Org-CP, organic crop production farms (n=12); Org-CLP, organic mixed crop-livestock production farms (n=8); Org-LP, organic livestock production farms (n=12).
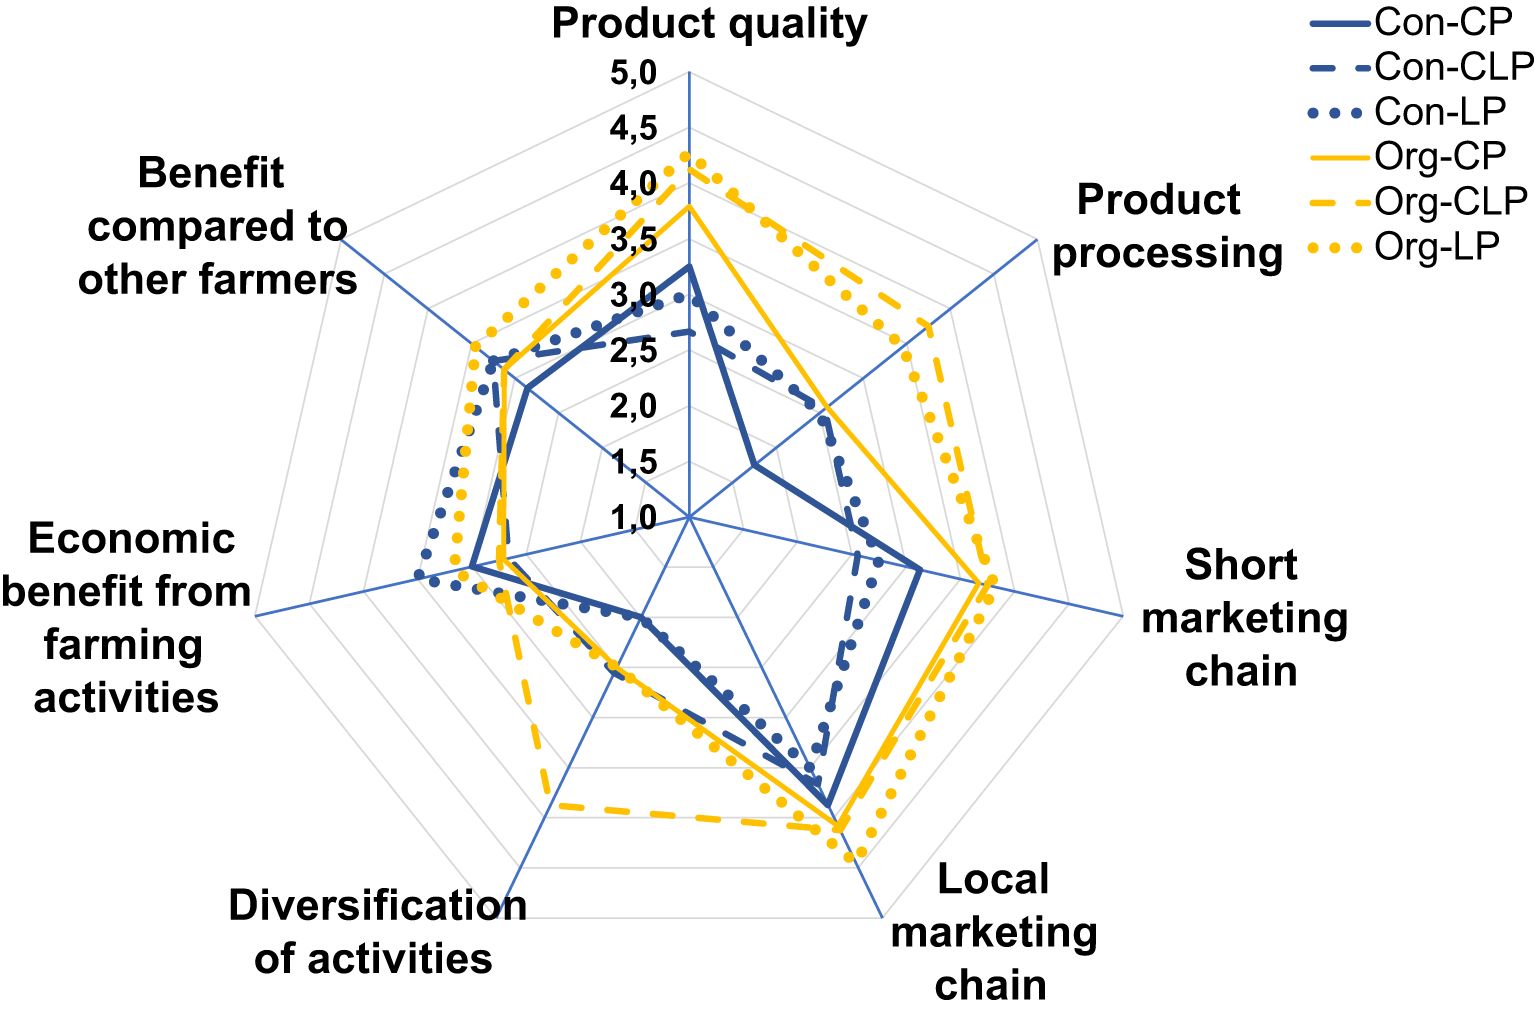
Figure 3. Importance of different revenue and income sources in the different farming systems in Belgium, France, and Italy. Con-CP, conventional crop production farms (n=8); Con-CLP, conventional mixed crop-livestock production farms (n=5); Con-LP, conventional livestock production farms (n=4); Org-CP, organic crop production farms (n=12); Org-CLP, organic mixed crop-livestock production farms (n=8); Org-LP, organic livestock production farms (n=12).
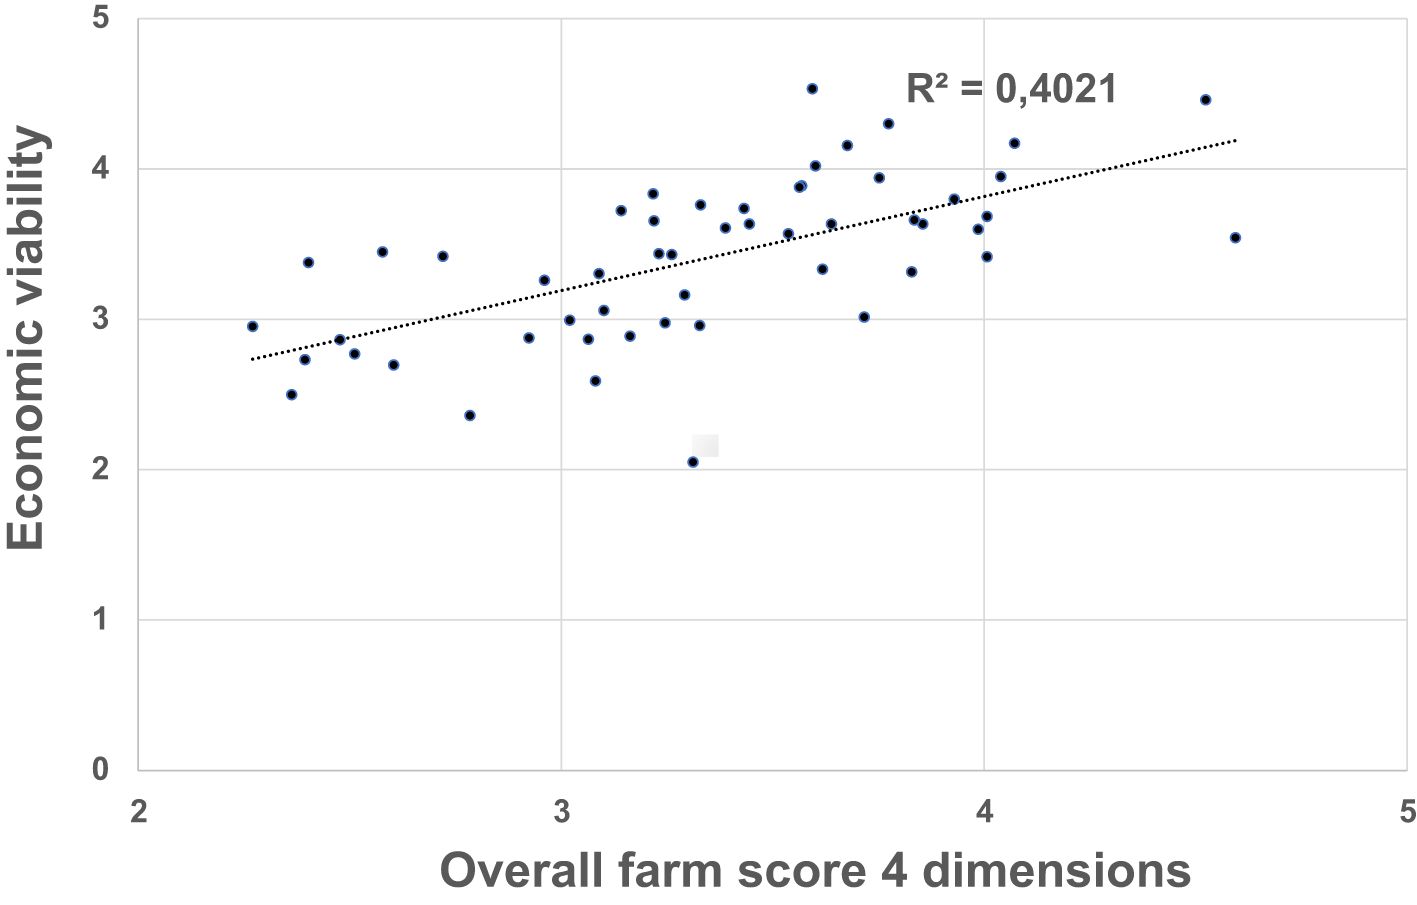
Figure 4. Economic viability score in relation to overall farm score in different farming systems in Belgium, France, and Italy. Note: overall farm score includes only four out of the five dimensions (agroecological farming practices, socio-political aspects, environment and biodiversity, and resilience), but not scores for economic viability, otherwise autocorrelation would exist.
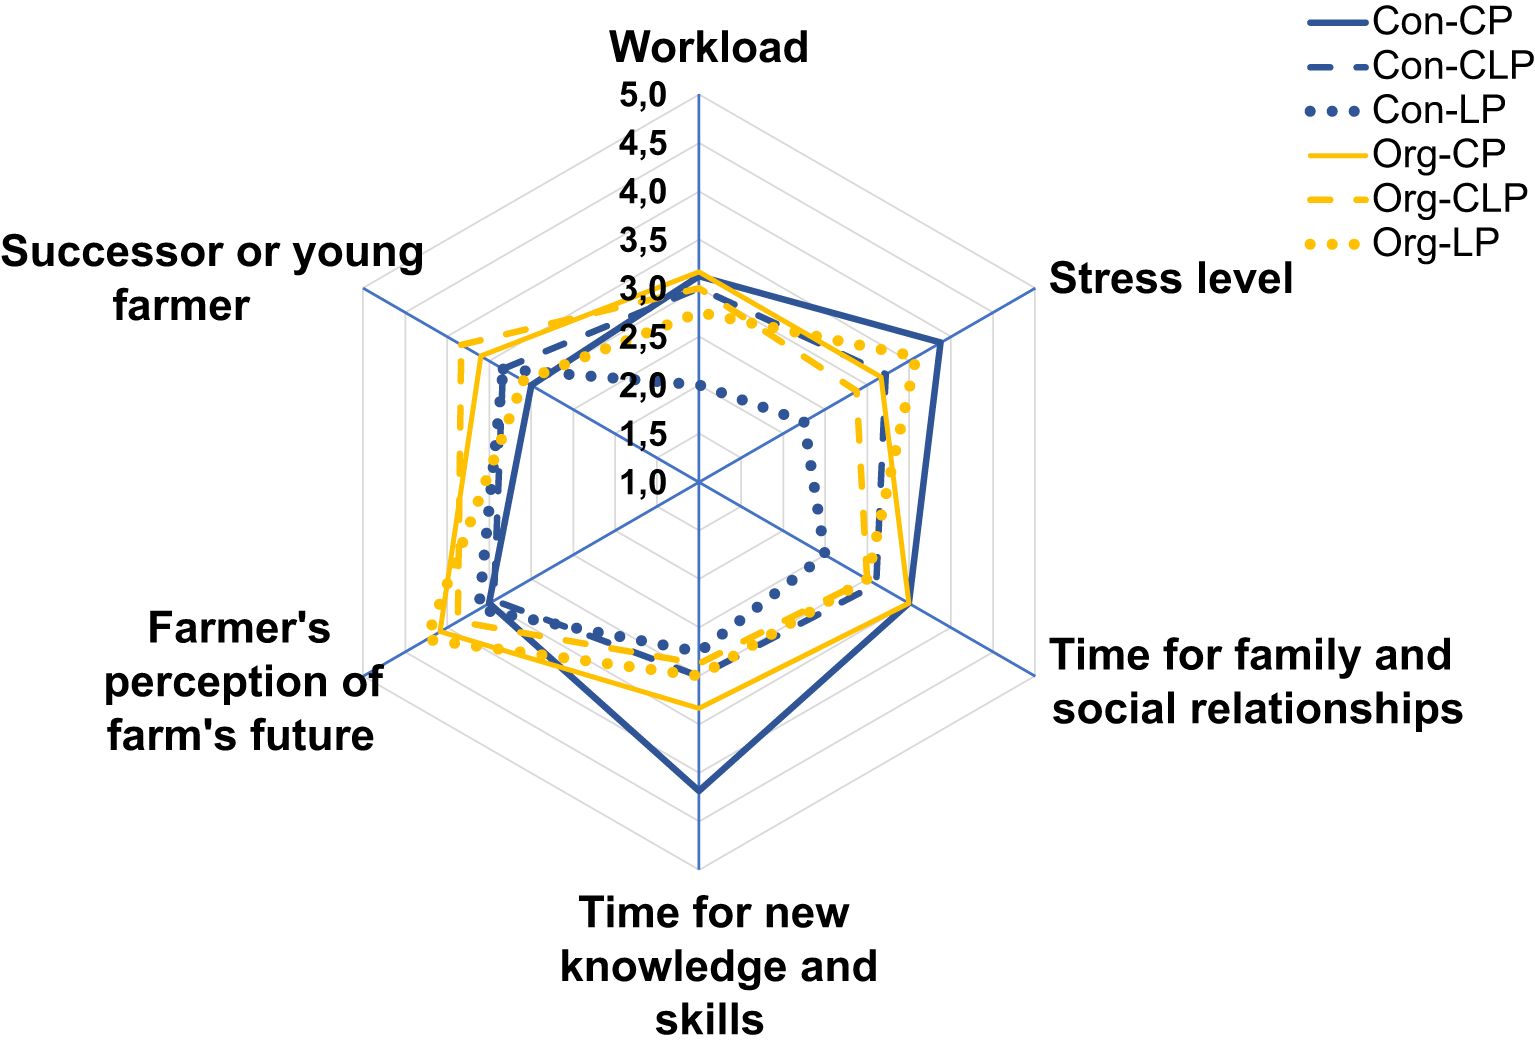
Figure 5. Scoring for work and time availability related indicators and future perspectives in different farming systems in Belgium, France, and Italy. Con-CP, conventional crop production farms (n=8); Con-CLP, conventional mixed crop-livestock production farms (n=5); Con-LP, conventional livestock production farms (n=4); Org-CP, organic crop production farms (n=12); Org-CLP, organic mixed crop-livestock production farms (n=8); Org-LP, organic livestock production farms (n=12).
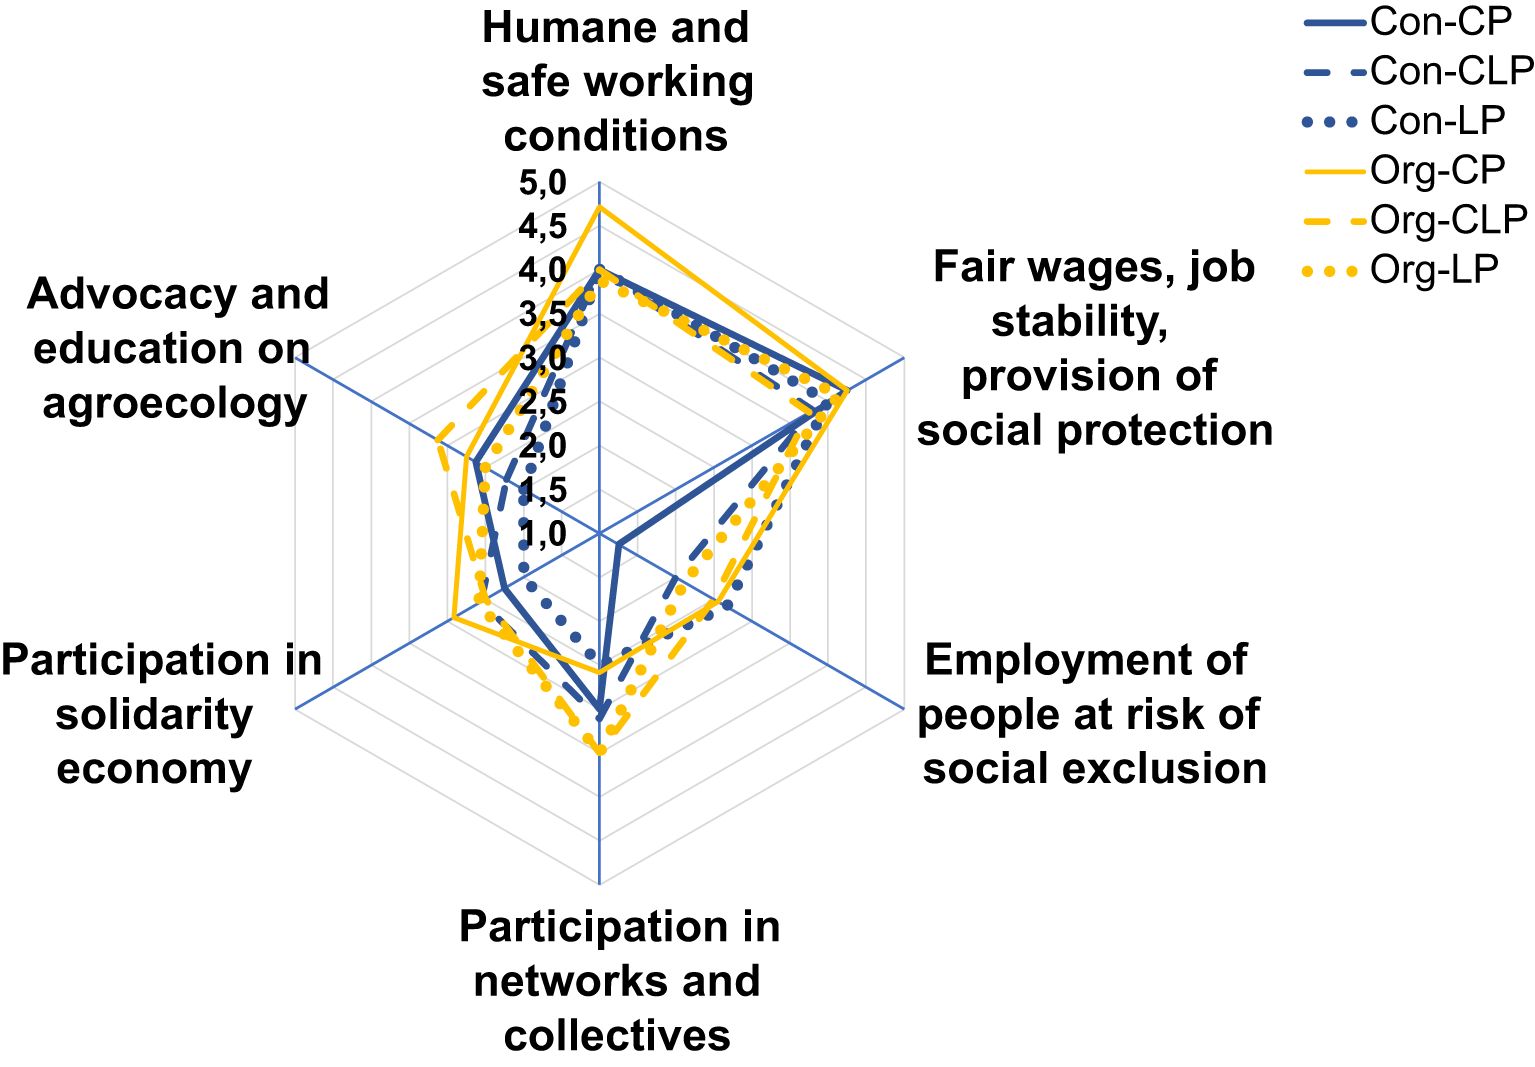
Figure 6. Average indicator scoring for different work and participation indicators and advocacy in different farming types in Belgium, France, and Italy. Con-CP, conventional crop production farms (n=8); Con-CLP, conventional mixed crop-livestock production farms (n=5); Con-LP, conventional livestock production farms (n=4); Org-CP, organic crop production farms (n=12); Org-CLP, organic mixed crop-livestock production farms (n=8); Org-LP, organic livestock production farms (n=12).
3.1 Agroecological farming practices
The level of adoption of agroecological farming practices differed strongly for most practices between the organic and conventional farms (Figure 2). The highest differences were found for crop pest, crop disease, and weed management, with Con-CP farms on average clearly higher than the other conventional farm types. The smallest differences were found for soil tillage and water management. Within the conventional farms, the Con-CP farms had the highest scores, while for the organic farms, it was the Org-CLP farms.
Crop fertilization (a soil fertility management indicator) in the LP and CLP farms was primarily organic, relying on livestock manure or compost (mainly horticulture CP farms), while conventional farms often combined organic and synthetic fertilizers. For soil tillage and soil cover management, the differences between organic and conventional farms were smaller, but Con-CLP farms always had slightly lower scores compared to the others. The practice of agroforestry was uncommonly implemented, but its level of adoption varied across farms and their location, with scores ranging from 1 to 5, but also with differences regarding countries. For example, many of the CP (organic or conventional) farms in Belgium, France, and Italy had implemented agroforestry to some degree in their systems, primarily in the form of hedges, but on only a small part of their farmland. For the other two groups (LP and CLP), agroforestry components were present on the farms but usually limited to older woody areas that had existed for decades on some farms (woodland pastures and hedgerows, thus no fully intentional establishment of an agroforestry system). Some farmers had chosen to plant new woody elements such as orchards.
Permanent grassland management varied between farm types, with organic farms and Con-CP farms scoring similarly higher compared to Con-CLP and Con-CP farms. Livestock management scores were higher for organic farms, as was animal welfare to a slightly lesser extent. Regarding the scores for the organic farms, there were only small differences in scores. Only a few farmers had implemented rotational grazing. Surprisingly, the CP farms (organic and conventional) had higher scores for animal welfare compared to the LP and CLP farms. However, this may be related to the fact that only some CP farms provided scores for this, whereas the majority of CP farms (14 out of 21) did not.
Small differences were found for water management, whereas greater differences were found for microclimate management. Only a few farms conserved water on the farm in basins or ponds, while the rest were connected to the local water providing system. The few investigated farms with market gardens used sprinkler irrigation and very few of them also used drip irrigation, mostly for vegetable production.
3.2 Economic viability
Regarding different revenue and income sources (Figure 3), the farmers interviewed stated that the local marketing chain was quite important for them, with slightly higher scores for the organic farms. Short marketing chains were also of importance for organic farms, but far less so for conventional farms. Product quality was clearly more important for organic farmers and their ability to generate revenue from different products or crop commodities. Two CP farmers mentioned choosing the vegetable cultivars they grew based on their taste, while several others chose depending on customer demand. Another possibility to enhance revenues was to diversify activities, but only Org-CLP farms had high scores here. A few farmers were involved in agritourism or educational activities.
The average to low scores for economic benefits from farming activities for all farm types indicate that many interviewed farmers do not believe that they economically benefit enough from their work, with LP farms scoring a bit higher. However, approximately one-third of the farmers (17 out of 53) reported economic benefits from farming activities, with average economic viability scores of 4. The farms with the lowest scores, suggesting that they were still struggling to become economically viable, had begun farming recently and produced vegetables (in the CP group). These farms were also the smallest in size (< 3 ha). However, the data analysis across all farms showed that farm size was not linearly linked to economic viability. Farmers’ economic benefits from their farming activities compared to other farmers had average middle scores, with slightly higher scores for Org-LP farmers and somewhat lower scores for Con-CP farmers.
Income sourced from product processing was much lower for conventional farms. The lowest overall were the scores for crop Con-CP farmers, and Org-CP farmers also had lower scores compared to the other two other organic farm types.
The farms that had higher overall farm scores (average of four dimensions) generally scored higher for economic viability (aggregated from different economically related indicators) (Figure 4). The regression curve for the conventional farms is a bit flatter than that shown in Figure 4, while the curve for the organic farms is steeper.
3.3 Socio-political aspects
Farmers described many parameters among the socio-political aspects indicators presented here, listing several constraints that sometimes resulted in lower scores (Figures 5, 6). Workload was reported to be problematic (represented by the low scores), but less so for Org-LP farms. The perception of stress level contrasted significantly between farmers. It was seen to be slightly less problematic for Con-CP farmers, highly contrasting with Con-LP farmers, who perceived it to be much lower (Figure 5). A repeated remark related to this issue by different farmers was that stress and high workload were part of the life they had chosen. Time available for the family and social relationships was again lowest for the Con-LP farmers, whereas it was better for CP farmers (organic and conventional). Time available for learning new knowledge and skills was seen as somewhat restricted in all farm type groups, except for the Con-LP farmers, for whom the scores were much higher.
Most farmers’ perspectives on the future of their farm were quite optimistic, with organic farmers slightly more so. Some farmers differentiated between the future of their farm and the general future of farming, which was seen in a very pessimistic way. Amongst the worries expressed, climate change and the COVID-19 situation were described as crises that will have a big impact on the future, but these challenges did not enter into consideration when the farmers talked of their own farm’s future. The average age of the farmers from all three farm types was 45–49 years, and older respondents worried about finding a successor, whereas younger farmers did not yet have this concern.
Most interviewed farmers worked alone or with their spouse and some hired seasonal workers. Only the wine producers hired many seasonal workers. Humane and safe working conditions, fair wages, and social protections are regulated at the national level and farmers reported that they followed these regulations, with all receiving relatively high scores for this dimension. Amongst the few farmers who employed workers, none mentioned placing particular attention on employing people at risk of social exclusion, which explains the low scores.
Participation in the circular economy was relatively low for farmers in all the farming types, and lower scores were reported by Con-LP and Org-CP farmers for participation in networks and collectives. Not much variation between the scores of different farm types for advocacy and education on agroecology was found, with all receiving quite low scores. For organic farms, it was slightly higher compared to conventional ones. A few farmers were sometimes involved in education and awareness raising actions, but most were not.
3.4 Environment and biodiversity
The three farming systems, and the organic and conventional groups, scored differently for most biodiversity and environment indicators, except for soil salinization (Figure 7). Pollution impact on the environment was judged lower for organic farms compared to conventional ones (as indicated by higher scores).
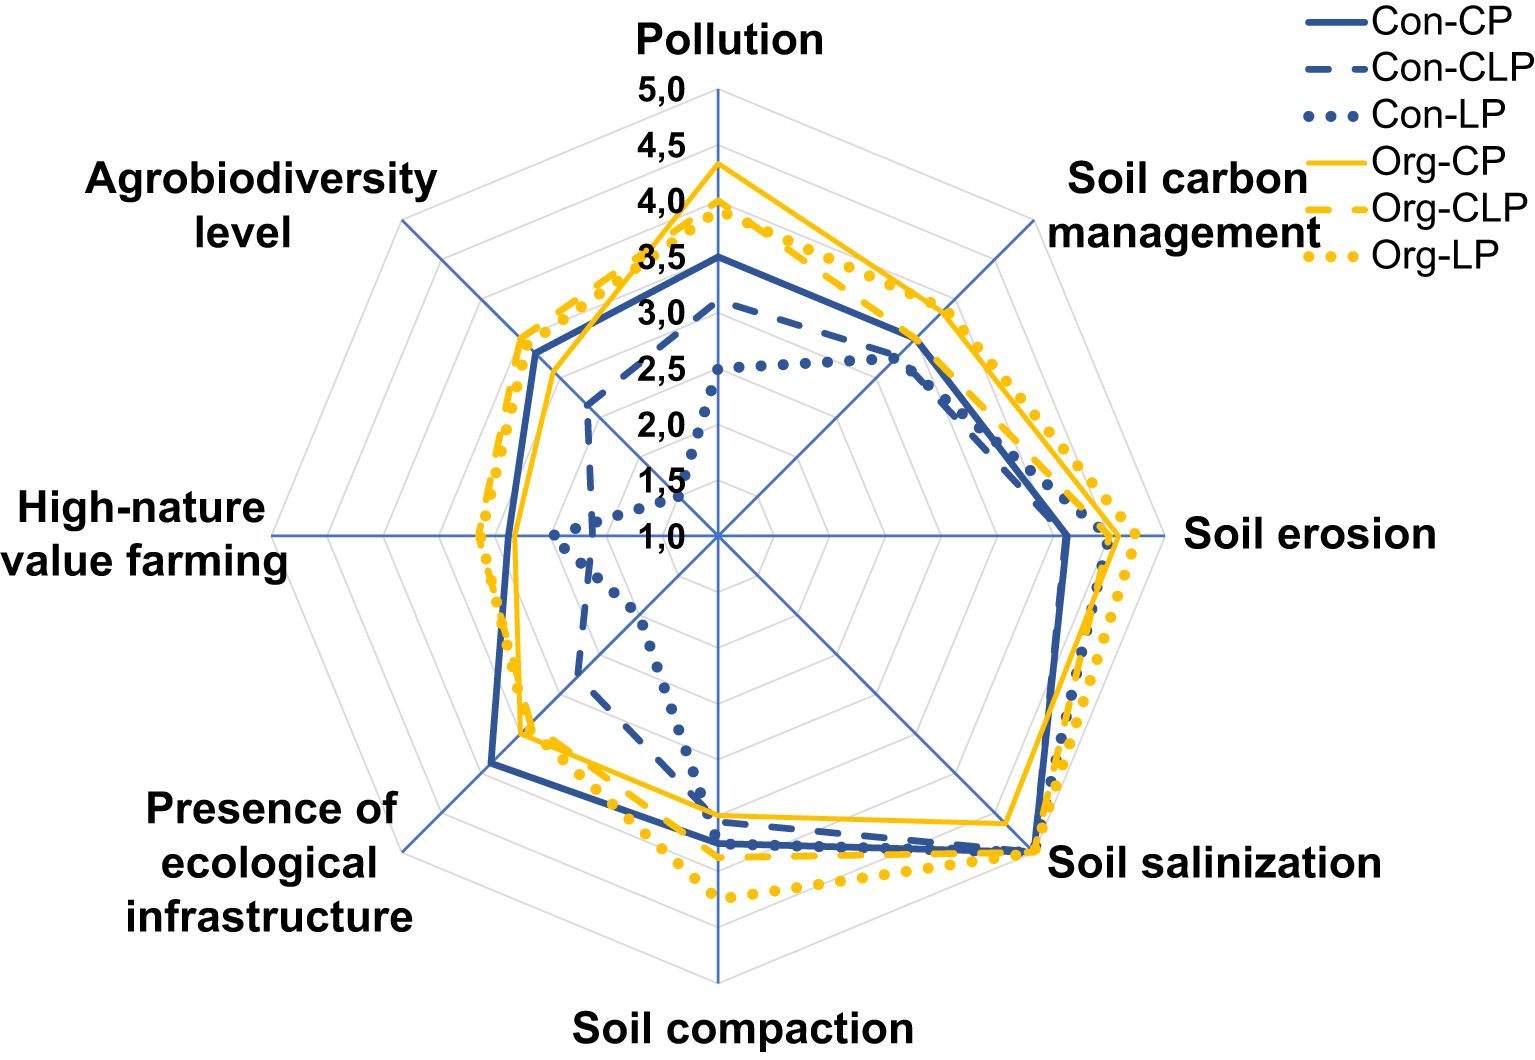
Figure 7. Average indicator scoring regarding biodiversity and environment indicators in different types of farms in Belgium, France, and Italy. Con-CP, conventional crop production farms (n=8); Con-CLP, conventional mixed crop-livestock production farms (n=5); Con-LP, conventional livestock production farms (n=4); Org-CP, organic crop production farms (n=12); Org-CLP, organic mixed crop-livestock production farms (n=8); Org-LP, organic livestock production farms (n=12).
On average, soil carbon management was seen to be moderate to good, and soil erosion management was good, with slightly higher scores for organic farms for both indicators. Soil salinization impact seemed to not be considered an issue by farmers of any type. Soil compaction was a certain issue for all farm types, but slightly less so for Org-LP farms.
Ecological infrastructure was more present on Con-CP farms and lowest for Con-LP farms. All organic farms were almost identical to the average score. The scores for high-nature value farming were mid-range for most farm types, but Con-LP and Con-CLP farms had low scores. The scores for agrobiodiversity levels on the farms were quite contrasting, with very low scores for Con-LP farms and low scores for Con-CLP farms, whereas all others scored in the middle range.
3.5 Resilience and autonomy
Regarding the dimension of resilience, one important focus of OASIS is to assess different indicators regarding autonomy of inputs, which are presented here. The farmers interviewed had good scores related to autonomy in water (Figure 8). Many of the CP and LP farmers do not irrigate their crops and use water from natural rivers or creeks to provide water to their animals. In the Lombardy region, northern Italy, farmers mentioned that they depended on water sources to irrigate spring crops such as rice and maize, but reported paying a very low price forfeit each year.
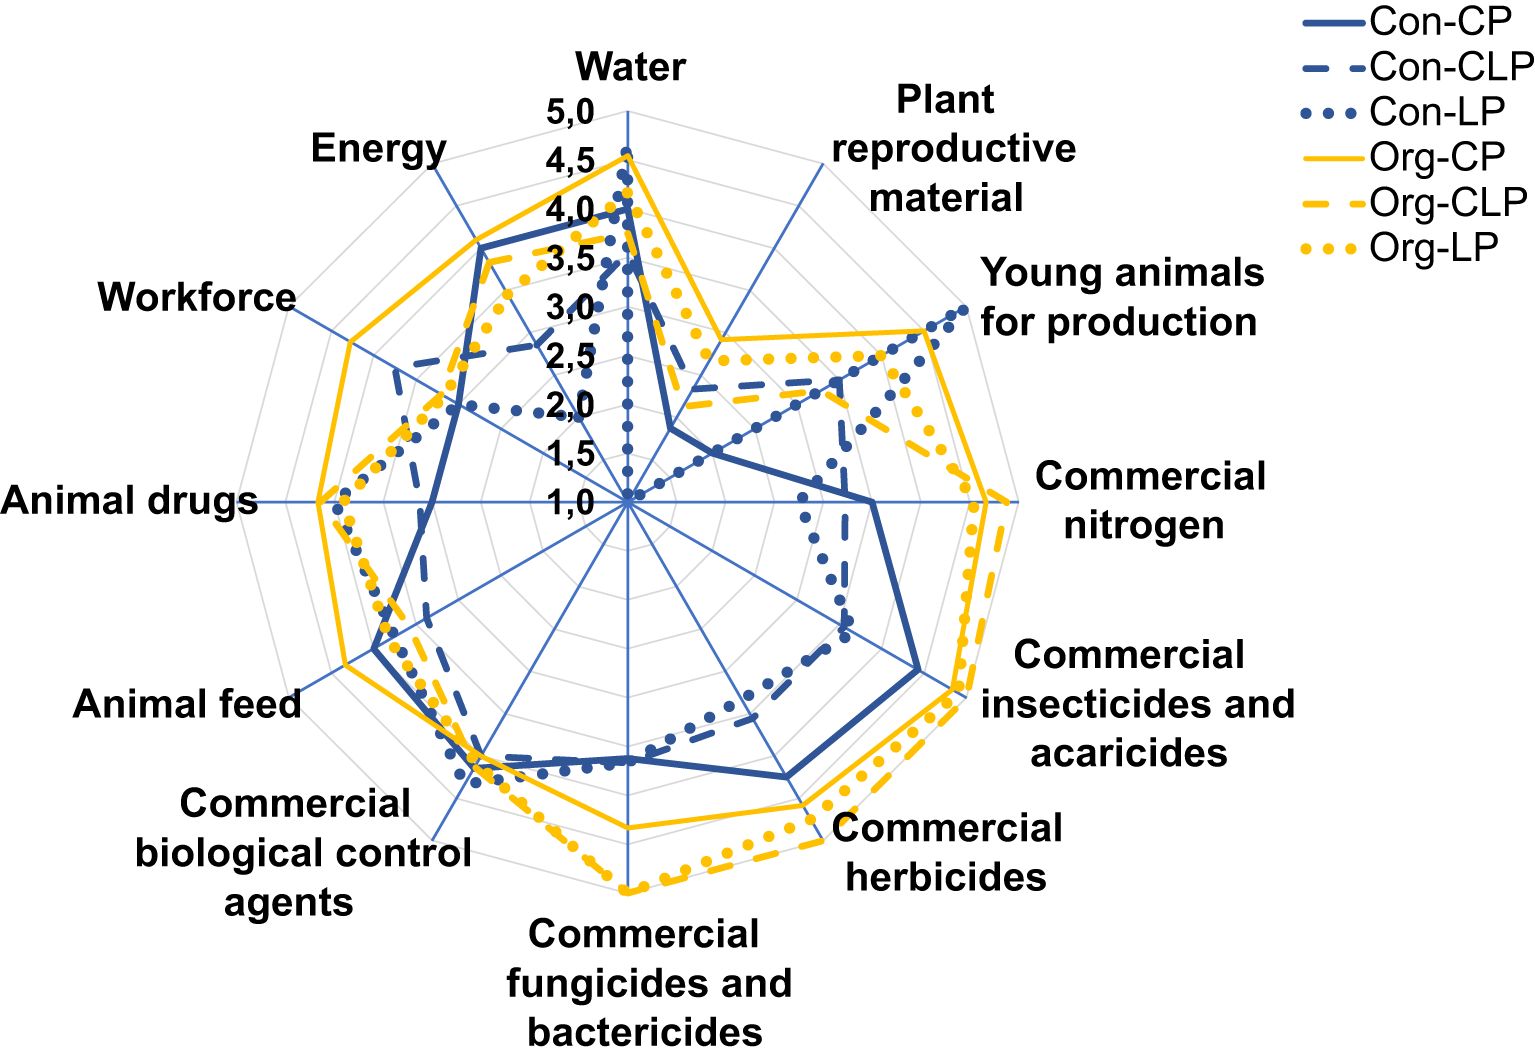
Figure 8. Level of autonomy regarding different resources used and dependency of the system for commercial inputs in three farming systems in Belgium, France, and Italy. Con-CP, conventional crop production farms (n=8); Con-CLP, conventional mixed crop-livestock production farms (n=5); Con-LP, conventional livestock production farms (n=4); Org-CP, organic crop production farms (n=12); Org-CLP, organic mixed crop-livestock production farms (n=8); Org-LP, organic livestock production farms (n=12).
For most commercial inputs, organic farms had higher scores, meaning that they perceive their farm to be less dependent on markets providing these inputs and resources. Most farms bought seeds or seedlings, which explains the low average score for plant reproductive material. These farmers were more interested in choosing high-yield varieties, which usually have a price premium to be paid and are difficult to reuse (e.g., hybrid cultivars).
As many of the farmers sampled were dependent on external animal feed, they scored middle or high for this indicator, except for the Con-CP farmers (some of them also have very few animals and do not depend on external feed). Autonomy to externally source young animals was very high for Con-LP farmers, as they reproduce them mainly on their farm. Org-CP and Con-CLP farms were more dependent on an external workforce compared to other farms types.
3.6 Difference between organic and conventional farms
As shown in Figure 9, organic farms had slightly higher scores for four out of the five dimensions (practices, economic viability, socio-political, and resilience). However, the differences between the scores for the conventional and organic farms were not large, as indicated by the standard deviation bars. The biggest differences were observed for economic viability and resilience (3.5 vs. 3.3).
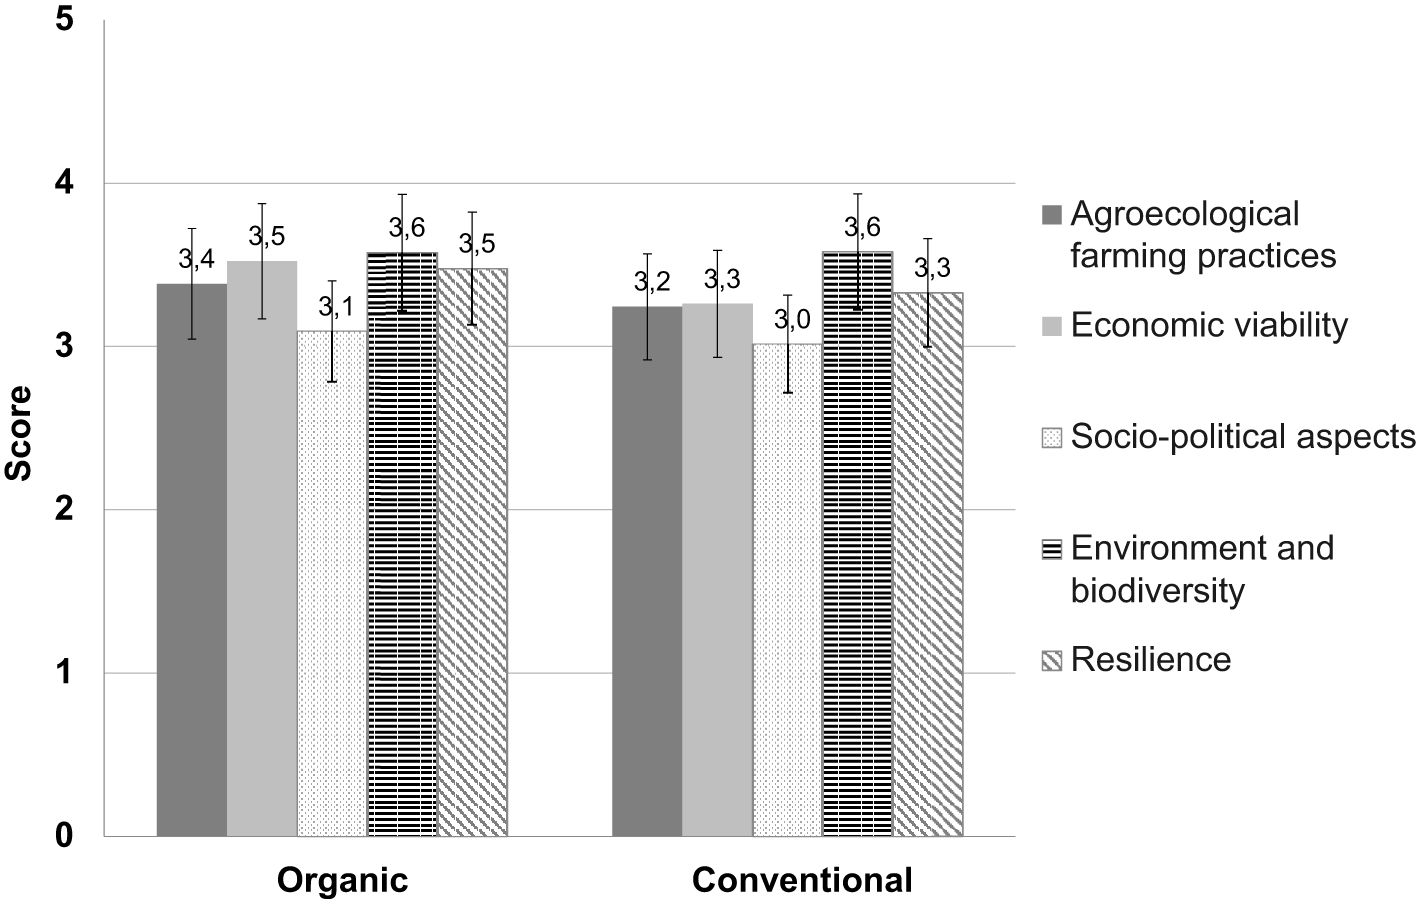
Figure 9. Comparison of dimension scores for the organic (n=29 farms) and conventional farms (n=24) in Belgium, France, and Italy. Error bars indicate the standard deviation.
4 Discussion
Here, we present the main findings from the research results and discuss them. Secondly, we discuss the operational results from the use of the OASIS tool, and finally present the limitations of the present study.
4.1 Agroecology-related performance—differences between farming systems
4.1.1 Differences between farming systems
The first major result is that we found different performance levels within the sampled farming systems (CP, CLP, and LP, and Org and CON), with greater differences between the organic and conventional farms for most indicators, and we analyzed the different farming system types by contrasting specific indicators within each dimension. The indicators with the greatest variation between farm types (those with a difference larger than 2.0 points between a farming type) were as follows: plant reproductive material (2.5), crop pest management (2.63), crop disease management (2.58), microclimate management (2.13), energy input (2.58), and commercial nitrogen input (2.13). It is striking that the lowest value was always found for Con-LP farms for all of these criteria.
In our study, criteria related to biodiversity (agrobiodiversity and high nature-value farming) were quite similar for all farm types, and, regarding the presence of ecological infrastructure, CP farms had the highest scores. In other studies, farms with livestock had higher levels of biodiversity compared to stockless farms (Migliorini et al., 2018; Bassignana et al., 2022). In these studies, livestock farms provided several ecosystem services. The significantly larger presence of woodland on livestock farms in comparison to stockless farms suggests a high level of biodiversity and a larger presence of ecological networks. Furthermore, the management of local livestock breeds plays a crucial role in maintaining genetic resources, reviving the network or pool of local knowledge, practices, and unique bio-cultural landscapes. Livestock farms tend to also have closed nitrogen cycle management due to the self-production of manure and large percentages of leguminous crops and legume-based temporary grasslands, and therefore, they provide a circularity of organic matter and agricultural produce that cannot be achieved on stockless farms.
A third important finding is related to differences between conventional and organic farms. The latter had higher scores for four out of five dimensions, but the differences were small. The biggest difference was observed for economic viability and resilience. Some of the interviews revealed that the conventional farmers were applying some of the “rules” linked to organic farming (e.g., using organic fertilization or no chemical pesticides) but did not want to convert to organic.
4.1.2 Economic situation and autonomy
Not many studies exist thus far on the economic situation of farms using an agroecological approach or practicing full agroecology. Although we did not conduct a detailed economic analysis of the farms, we found that farmers see their own economic benefit as equal or slightly higher compared to other farmers in the region (2.9–3.5), but there were strong differences found between the farms in this study(1–5 for CP farms and 2–4 for CLP and LP). Interestingly, the farms that had higher overall scores per dimension (and thus can be considered further on a pathway towards agroecology) also generally scored higher for economic viability (Figure 2). However, income satisfaction from farming activities was, on average, medium for all farm types (2.7–3.5).
D’Annolfo et al. (2017) found in their global review paper on the social and economic performance of agroecology that, in 73 cases investigated, farm profitability increased for 66% after the adoption of agroecological practices, for 11%, the impact was neutral, and for 23%, profitability decreased. This result is in line with our finding that farms with higher scores for agroecological practices also scored higher for economic viability (correlation: R²=0.40). van der Ploeg et al. (2019) found that agroecological farming (using different agroecological practices) provided higher farm incomes compared to conventional farming in almost all study cases. Landert et al. (2020), in their comparison of conventional farms and agroecological farms, found that 15% more of the latter (92% in total) generated positive net incomes with their farming activities over the last 5 years. However, subsidies contributed an important share of farm incomes. In a recent global study, Mouratiadou et al. (2024) investigated the socio-economic performance of farms using agroecological practices compared to conventional practices and found that 51% of outcomes were positive (better than conventional), 19% neutral or inconclusive, and 30% negative. Positive outcomes were, in particular, found for income and income stability, production costs, revenue, and autonomy, whereas the negative outcomes were more often found for labor requirements and labor costs. D’Annolfo et al. (2017) indicated increased labor productivity with agroecological practices for all three farms analyzed. However, they also documented increases in labor demand in three out of four farms investigated. In our study, workload was seen as problematic by the majority of the interviewed farmers.
4.2 Use of the OASIS methodology and tool
4.2.1 General use and limits
OASIS was found to be an efficient, complete, and systemic tool for indicating the agroecological performance at the farm level. It allowed individual farmers to see where they were on a pathway towards agroecology, if they intend to engage in it. With a limited number of radar charts, it can present the strengths and weaknesses of a single farm in the five dimensions (the radar charts in our study show the average of several farms per farm type). The OASIS system is thus revealed to be applicable, robust, and appropriate for assessing all the types of farms tested.
OASIS functions by placing each farmer in their present situation along a continuum of agroecological performance levels in the different dimensions and then evaluating in which direction and on which topic (criteria) progress could be made. Moreover, it allows a multi-temporal comparison for each farmer if applied again after 1 or several years. On the basis of these assessments, progress objectives can be defined for the next or following years. These objectives can be defined by the farmer themselves after a discussion in a workshop including other farmers and agronomists. These agronomists, appointed as coaches, can help the farmer reach these objectives in the next 12 months, for example. After this period, the process starts again and, year after year, for example, the farm can move forward in its transition. The most advanced farms can then become agroecological lighthouse farms (Nicholls and Altieri, 2018; Schulte, 2020; McGreevy et al., 2021; Sutherland and Marchand, 2021; Campodonico, 2024). These farms are efficient tools for speeding up the agroecological transition of a large number of farms in a region.
When comparing different farming systems, some differences in criteria were found between them, which are valuable for understanding the constraints or opportunities for further advancement towards agroecology. However, our analysis also showed that the differences between farming systems’ average indicator scores become smaller when more farms are sampled per category. For example, we first piloted the analysis with a dataset containing approximately half of the farms and then expanded it to include all 53 farms. In the analysis of only half of the farms, the difference between the average scores for the five dimensions for the different farm types were higher than when all the farms were included. In addition, an analysis of variation within farms of a certain type could also generate insights, as there was a wide diversity of farms within each type (e.g., in the case of CP farms). Comparisons that extend beyond differences in farming systems to understand territorial or regional differences may also be useful for informing policy development or assessing whether a certain policy supports transition towards agroecology at a certain geographical range or level.
A trained interviewer can collect the necessary information in approximately 1–1.5 hours per farm, but when farmers have much to share, it can go up to 2 hours. Then, it takes approximately 15–20 minutes for the interviewer to fill out an Excel table for all the criteria. The results, i.e., the radar charts, can then be presented to the farmer, who can then utilize them. The drafting of a report for the farmer that presents the 10 radar charts and some useful comments can take 1 or 2 hours. Drafting an extensive report for other users takes more time because it includes additional elements such as the farm description and history, which are not useful to the farm manager. The assessment of economic criteria requires more experience than other criteria. With the present indicators and criteria, the assessment can be completed in a reasonable time, as it is largely based on comparison with other farms of the same farm type and in the same region, but it cannot provide a more in-depth assessment of the economic situation. An analysis of farm accountancy data would be much more time-consuming, and is not intended with the present tool. However, during a possible coaching project, gross margin can be calculated, analyzed, and discussed per activity type with farmers.
A limitation of all indicator systems is the weighing of indicator values before calculating averages. In OASIS, the choice was made to give all indicators and criteria the same weight. This means that their values are multiplied by 1 and not by any other value. Choosing other multipliers for each indicator is possible and requires organizing panels of different stakeholders. The proportion of each stakeholder type should be balanced. Multipliers are chosen based on the values and priorities of each panel member. It is a difficult and often arbitrary process. However, an entity that is using OASIS to perform an evaluation for their community can develop its own weighting scores via a participatory process after the general procedure (that would allow for comparison), and show with the weighted scores which issues they believe deserve particular attention. Moreover, OASIS does not require any statistical tests to be used, which can be seen as a limitation, however, it does make it simpler to apply.
Further limitations of the present tool are the selection of the different criteria and indicators, as with other farm assessment tools. For OASIS, the 5th dimension (resilience) includes, thus far, reusing some criteria from other dimensions. In a future version, this could be eliminated or the criteria modified. Moreover, some criteria, such as biodiversity and ecological infrastructure, could be developed with more quantifiable measurements, e.g., using an additional agrobiodiversity indicator (crops and breed diversity per farm or farm production type). To make comparisons, such as those between the organic and conventional farms in our study, some criteria may need to be improved. For example, some conventional farmers had some organic pesticide-free claims, but these may be only valid for a specific season. Medium scores were sometimes found for these criteria, masking fundamental differences in systems and practice use over the years. Furthermore, an improved tool may include, as an option, direct observational data from expert inspections to be taken into account. Finally, the tool may profit from providing more information on the connection to consumers or markets in the different types of farming systems studied. Although there are some criteria already included, such as the ‘short and local marketing chain’, ‘diversification of activities (agroturism)’, ‘advocacy and education on agroecology’, and ‘transparent communication’, the tool may profit from adding one or two criteria or readapting the existing ones to gain deeper insight, as the consumer or market connections question is a crucial topic in agroecology and different from conventional farming.
4.2.2 OASIS and other tools
TAPE and OASIS are both tools that assess agroecological performance. They have some similarities in approaches, but also some clear differences regarding assessment and scope. Both use a large number of different indicators for assessment and a 5-point scale approach to score the different indicators for the characterization of agroecological performance levels (STEP 1 in TAPE). Furthermore, both methodologies use five dimensions to assess a farm’s agroecological performance. However, the dimensions are identified somewhat differently: TAPE categorizes the dimensions as governance, economy, health and nutrition, society and culture, and environment (FAO, 2019; Mottet et al., 2020), whereas OASIS distinguishes between agroecological farming practices, economic viability, socio-political aspects, environment and biodiversity, and resilience (Peeters et al., 2018, Peeters et al., 2021). The biggest difference between the tools lies in the performance assessment of the use of agroecological practices in OASIS, which TAPE does not assess. A further difference is that TAPE refers to their indicators using the 10 elements of agroecology (FAO, 2018; Barrios et al., 2020) and OASIS bases its indicators on both these 10 elements and the 13 principles of agroecology (HLPE, 2019; Wezel et al., 2020). Moreover, the time it takes to make a farm assessment with TAPE is slightly longer (based on the experience of one author of this study who used TAPE in another research study). A final difference between assessment tools is that OASIS limits its evaluation to the farm scale, whereas TAPE situates the farm-level results within the territory through a participatory discussion and validation of results. This process involves several producers and relevant stakeholders to jointly design/discuss further transition potential towards agroecology and to enhance the enabling environment.
OASIS adopted a five-level assessment system for each indicator and criterion. This system offers several advantages. A choice of quotation is most often easy. Sometimes, the assessor hesitates, but it is then between two values only. In a five-level system, there is a medium value that corresponds to the real start of the agroecological transition. A value of 1 corresponds to conventional agricultural practice. In further development of the tool, it could be taken into account that there is also a possibility of a nil or a negative value in cases where agroecological principles are significantly disregarded. This could be similar to red flags, proposed in a framework for the assessment of projects and programs with respect to their “agroecologicalness”, as proposed by Moeller et al. (2023). However, this would lead to a negative judgment value. Primarily, OASIS aims to assess the level of the agroecological transition of farms and not to define good and bad farms.
Whereas OASIS uses a five-level approach, the recently developed F-ACT uses a four-level scoring system from 0 to 3 for different agroecological practices that were selected for the 10 elements of agroecology and different categories such as soils, crops, livestock, pests and diseases, trees and other woody perennials, or energy (Biovision n.d.). While the focus of F-ACT is on farm management, other aspects, such as society, markets, and policies, are covered by the questions.
While TAPE, F-ACT and OASIS refer directly either to the 10 elements or 13 principles of agroecology, the GATE (Groupe de Travail sur les Transitions Agroecologiques) methodology (Levard, 2023) does not. They use qualitative scores from 0 to 3 (thus four-level scoring) for 19 sub-criteria, grouped into six criteria that are considered to be essential agroecology principles. Five of them directly relate to on-farm activities, e.g., crop and breed diversity, soil health, recycling, synergies, and system autonomy. The sixth criterion relates to the farm’s contribution to an agroecological transition on the territory level, thus expanding to the landscape and food system levels. The sum of the scores for each of the 19 sub-criteria is then used to calculate an overall farm-level agroecology score from A (strongly agroecological) to F (non-agroecological).
4.2.3 Farms without livestock and OASIS
Among the CP farms sampled, many did not raise any animals. There is a debate about whether a stockless farm can still be considered an agroecological farm, as it does not fully comply with some of the principles of agroecology (recycling, input reduction, and synergy) if the organic fertilizer does not come from manure or other animal products produced internally and recycled. The synergy principles that enhance positive ecological interactions, integration, and complementarity amongst the elements of agroecosystems (soil, plants, animals, trees, and water) are not fully met as the animal part is missing. However, to assess beyond the farm level, the cooperation and exchanges between farms (a straw for farmyard manure exchange, for instance) could be important as the farm may source inputs from nearby farms to create a circular economy that is not on-farm but in the region (Moraine et al., 2017; de Faccio Carvalho et al., 2021).
For the OASIS questions on the dimension of agroecological practices, a CP farm must appear without scores for the permanent grassland management, livestock management, animal welfare (Figure 2), animal drugs, animal feed, and young animals for production indicators (Figure 8). Data were replaced by the acronym ‘NA’ (not applicable) on the axis of these criteria for individual farms. Permanent grassland management scores for some CP farms may exist in the case of very low numbers of animals, such as horses for leisure. In our study, we had such farms, and so average values appear in the radar charts for these animal-related criteria.
4.3 Limitations of the study
The farms in this study were not selected using a stratified sampling technique regarding farming types and countries. We carried out an explorative study to provide new insights into using OASIS to investigate the agroecology-related performance of farms with different criteria. Therefore, differences in the results between farming types can only indicate trends from our farm sample, and for the use of agroecological practices, which cannot be used to make estimations about the current implementation of these practices on farms in different countries. Moreover, some farmers could only be interviewed online due to the pandemic at this time, whereas others were interviewed during farm visits. For the latter, we expect that we may have slightly more precise data, as any potential incomprehension in answers could be minimized in the direct interviews, and later also having seen parts of the farm.
5 Conclusion
Agroecology is seen as a transition pathway to address major challenges in European agriculture and transform the current farming and food systems towards more sustainable ones. The OASIS could be a tool to be used for transition pathway analyses, mainly at the practice and farming system levels. The tool was developed over the last 5 years, and in this study, we applied it to different organic and conventional farms in Belgium, France, and Italy with the main aim of testing the methodology but also, in a second step, to investigate where farms are performing regarding different dimensions of the agroecology assessment and the different criteria. This dataset has thus been used for testing and illustrating the functioning, applicability, and relevance of the OASIS tool for farmers and farm assessment.
Overall, the OASIS tool was shown to be a well-applicable, complete, and systemic tool for assessing the current level of agroecological performance at the farm level, permitting individual farms to see where they are in a potential transition towards a higher level implementation of agroecology. It creates an overall picture of the farm’s level of agroecology, and also makes it possible to locate each farmer in their present situation along a continuum of agroecological performance regarding a large variety of criteria and then evaluate where progress can be made and constraints overcome.
However, there are different limitations of the tool that could or should be improved upon in further development of a new version, as outlined in the Discussion section, e.g., readjusting some criteria or indicators for more quantifiable assessment, or make them more suitable for comparison, such as that between organic and conventional agriculture.
OASIS was shown to be a comparatively efficient tool for stimulating discussion and knowledge exchange between farmers and between farmers and agronomists, an experience also found beyond the present study with other farmers in Belgium, where OASIS is already more broadly used. Through these discussions, farmers can be coached in their further engagement to agroecology, thereby reducing risk during the first hazardous years of this period and accelerating the transition process. If a farm is assessed each year, progress objectives for the following year can be defined in a participatory way, according to the farmer’s objectives and preferences. This would then also allow them to assess their transition to agroecology at a farming system level.
The limited number of samples and the non-random selection of farms and farming systems prevent us from making any strong conclusions regarding the comparison of different levels of agroecological performance of different farming systems. Moreover, different people were carrying out the interviews, hence their subjectivity needs to be considered. These interviewers, especially in France and Italy, used OASIS for the first time. They sometimes had questions and doubts. In Belgium, the interviews were conducted by more experienced people.
However, our analysis allowed us to assess trends and differences between organic and non-organic farms and the three farming systems sampled and analyzed. We therefore consider this a good sample exercise to test the performance of the OASIS methodology. However, to have more representative findings, a much larger farm sample per farming type and country would be needed to get applicable results for other farming situations in Europe.
From our research on different farming systems in different countries, we revealed several noteworthy findings. First, the overall farm score varied for the five different dimensions of the tool. Thus, there was a large difference regarding the level of agroecology-related performance for the different farms investigated.
Second, organic farms only had slightly higher scores for four out of five dimensions, compared to the scores for conventional farms. Therefore, the agroecological performance levels of the studied farms did not indicate dependence on certification.
The third important finding was that there were differences in the adoption of agroecological farming practices. A clear difference was found, with often clearly higher scores for organic farms, in particular for the Org-CLP farms. Similarly, higher scores for organic farms were found for most biodiversity and environment indicators and for criteria related to revenue and income sources.
Fourth, the farms that had a higher overall farm score in the four dimensions, i.e., without economic viability, also had generally higher scores for the economic viability dimension. This finding may support other farmers in their decision to engage with or further transition towards agroecology, as, thus far, there is no large study about the economic performance of agroecology.
The fifth main finding was that farmers described many parameters among the socio-political dimension parameters and reported several constraints, some of them associated with clearly lower scores. This is of high importance, as constraints do not apply similarly to farmers, and farmer- and context-specific barriers need to be taken into account to make the transition towards more sustainable agriculture.
And finally, for the dimension of resilience, contrasting results for different indicators were found between the three farming systems, with some having higher scores related to autonomy and dependence on inputs and market, but others scoring much lower, depending on the farming system. This also showed the high diversity among farms, and the potential future engagement of individual farmers in a transition to agroecology needs to be considered carefully.
Data availability statement
The raw data supporting the conclusions of this article will be made available by the authors, without undue reservation.
Author contributions
AW: Data curation, Funding acquisition, Investigation, Writing – original draft, Writing – review & editing. PM: Conceptualization, Methodology, Writing – original draft, Writing – review & editing. AB: Investigation, Writing – original draft, Writing – review & editing. TG: Investigation, Writing – original draft, Writing – review & editing. AM: Investigation, Writing – original draft, Writing – review & editing. GF: Investigation, Writing – original draft, Writing – review & editing. GG: Investigation, Writing – original draft, Writing – review & editing. EM: Investigation, Writing – original draft, Writing – review & editing. M-AR: Investigation, Writing – original draft, Writing – review & editing. KŠ: Conceptualization, Methodology, Writing – original draft, Writing – review & editing. NA: Investigation, Writing – original draft, Writing – review & editing. SB: Writing – original draft, Writing – review & editing. AP: Conceptualization, Methodology, Writing – original draft, Writing – review & editing.
Funding
The author(s) declare that financial support was received for the research and/or publication of this article. We gratefully acknowledge funding from FAO (contract GF.REUTD.RA50403000000) for the development of the first version of the OASIS indicator system, of the LIFE Program of the European Union, the Fondation de France, and the Groupe Bruxelles Lambert (GBL).
Acknowledgments
We are highly thankful to the farmers for providing their time and sharing information and data with us. We further thank S. Madsen for improving the language quality of the paper. We further thank the three reviewers for their comments and suggestions for corrections, which significantly helped to improve the manuscript.
Conflict of interest
Author AP is part of the company Terres Vivantes.
The remaining authors declare that the research was conducted in the absence of any commercial or financial relationships that could be construed as a potential conflict of interest.
Generative AI statement
The author(s) declare that no Generative AI was used in the creation of this manuscript.
Publisher’s note
All claims expressed in this article are solely those of the authors and do not necessarily represent those of their affiliated organizations, or those of the publisher, the editors and the reviewers. Any product that may be evaluated in this article, or claim that may be made by its manufacturer, is not guaranteed or endorsed by the publisher.
Supplementary material
The Supplementary Material for this article can be found online at: https://www.frontiersin.org/articles/10.3389/fagro.2025.1581667/full#supplementary-material
Footnotes
References
Agroecology Europe (2019). Our understanding of agroecology. Available online at: https://www.agroecology-europe.org/our-approach/our-understanding-of-agroecology/ (Accessed November 14, 2024).
Ajates Gonzalez R., Thomas J., and Chang M. (2018). Translating agroecology into policy: the case of France and the United Kingdom. Sustainability 10, 2930. doi: 10.3390/su10082930
Altieri M. A. and Nicholls C. I. (2020). Agroecology and the reconstruction of a post-COVID-19 agriculture. J. Peasant Stud. 47, 881–898. doi: 10.1080/03066150.2020.1782891
Barrios E., Gemmill-Herren B., Bicksler A., Siliprandi E., Brathwaite R., Moller S., et al. (2020). The 10 Elements of Agroecology: Enabling transitions towards sustainable agriculture and food systems through visual narratives. Ecosyst. People 16, 230–247. doi: 10.1080/26395916.2020.1808705
Bassignana C. F., Merante P., Rosi Belliére S., Vazzana V., and Migliorini P. (2022). Assessment of agricultural biodiversity in organic livestock farms in Italy. Agronomy 12, 607. doi: 10.3390/agronomy12030607
Biovision Farm-level agroecology criteria tool. Available online at: https://www.agroecology-pool.org/fact (Accessed September 2024).
Bocchi S. (2019). Is there any Italian specific model for Agroecology? Ed. Chiappero E. (Milan: Le Ricerche di Fondazione Feltrinelli. Rules of Utopia Policies), pp.151–pp.166.
Bocchi S. (2023). “The ecology of agri-food system,” in Global Health Essentials, Springer Nature Sustainable Dev. Ed. Raviglione, et al (Cham: Goals Series, SDG 3), 485–489.
Brumer A., Wezel A., Dauber J., Breland T. A., and Grard B. (2023). Development of agroecology in Austria and Germany. Open Res. Europe 3, 25. doi: 10.12688/openreseurope.15431.1
Campodonico G. (2024). One year into the Mission Soil: key takeaways and recommendations for the Living Lab community. doi: 10.5281/zenodo.14170711
D’Annolfo R., Gemmill-Herren B., Graeub B., and Garibaldi L. A. (2017). A review of social and economic performance of agroecology. Int. J. Agric. Sustain. 15, 632–644. doi: 10.1080/14735903.2017.1398123
Dara Guccione G., Vigano L., Sturla A., Vaccaro A., Colombo L., Pirelli T., et al. (2024). Insights into the agroecological transition: the case of two Italian bio-districts. Ital. Rev. Agric. Economics (REA) 79, 97–111. doi: 10.36253/rea-14241
de Faccio Carvalho P. C., de Albuquerque Nunes P. A., Pontes-Prates A., Szymczak L. S., de Souza Filho W., Moojen F. G., et al. (2021). Reconnecting grazing livestock to crop landscapes: reversing specialization trends to restore landscape multifunctionality. Front. Sustain. Food Syst. 5. doi: 10.3389/fsufs.2021.750765
Duru M., Therond O., and Fares M. (2015). Designing agroecological transitions; A review. Agron. Sustain. Dev. 35, 1237–1257. doi: 10.1007/s13593-015-0318-x
Elzen B., Augustyn A. M., Barbier M., and van Mierlo B. (Eds.) (2017). AgroEcological transitions (The Netherlands: Changes and breakthroughs in the making. Wageningen University and Research), 304 p.
European Commission (2020a). Farm to Fork Strategy – for a fair, healthy and environmentally-friendly food system. Available online at: https://ec.europa.eu/food/farm2fork_en (Accessed November 14, 2024).
European Commission (2020b). EU Biodiversity strategy for 2030. Available online at: https://ec.europa.eu/info/strategy/priorities-2019-2024/european-green-deal/actions-being-taken-eu/eu-biodiversity-strategy-2030_en (Accessed November 14, 2024).
European Commission (2021). Commission publishes list of potential eco-schemes. Available online at: https://agriculture.ec.europa.eu/news/commission-publishes-list-potential-eco-schemes-2021-01-14_en (Accessed November 14, 2024).
European Commission (2023). EU Policies on “Agroecology”. Available online at: https://knowledge4policy.ec.europa.eu/global-food-nutrition-security/topic/agroecology/navigation-page/eu-action-agroecology/eu-policies-agroecology_en (Accessed November 14, 2024).
European Commission (2024a). European R&I partnership on agroecology living labs and research infrastructures. Available online at: https://research-and-innovation.ec.europa.eu/research-area/agriculture-forestry-and-rural-areas/ecological-approaches-and-organic-farming/partnership-agroecology_en (Accessed November 14, 2024).
European Commission (2024b). Strategic Dialogue on the future of EU agriculture. Available online at: https://agriculture.ec.europa.eu/common-agricultural-policy/cap-overview/main-initiatives-strategic-dialogue-future-eu-agriculture_en (Accessed November 14, 2024).
Eurostat (2022). Glossary: Standard output. Available online at: http://ec.europa.eu/eurostat/statistics-explained/index.ph/Glossary:Standard_output_%28SO%29 (Accessed November 14, 2024).
FAO (2014). SAFA: Sustainability Assessment of Food and Agriculture Systems (Guidelines) (Rome: Food and Agriculture Organization of the United Nations).
FAO (2018). The 10 Elements of Agroecology: Guiding the transition to sustainable food and agricultural systems. Available online at: http://www.fao.org/3/i9037en/i9037en.pdf (Accessed November 14, 2024).
FAO (2019). TAPE: Tool for Agroecology Performance Evaluation. Process of Development and Guidelines for Application (test version) (Rome: Food and Agriculture Organization of the United Nations).
Fonseca A. F., Polita F., and Madureira L. (2024). How agroecological transition frameworks are reshaping agroecology: A Review. Land 13, 1930. doi: 10.3390/land13111930
Garini C. S., Vanwindekens F., Scholberg J. M. S., Wezel A., and Groot J. C. J. (2017). Drivers of adoption of agroecological practices for winegrowers and influence from policies in the province of Trento, Italy. Land Use Policy 68, 200–211. doi: 10.1016/j.landusepol.2017.07.048
Geck M. S., Crossland M., and Lamanna C. (2023). Measuring agroecology and its performance: An overview and critical discussion of existing tools and approaches. Outlook Agric. 52, 349–359. doi: 10.1177/00307270231196309
Gliessman S. R. (2007). Agroecology: the ecology of sustainable food systems (New York, USA: CRC Press, Taylor & Francis), 384 p.
Gomori-Ruben L. and Reid C. (2023). Using TAPE to assess agroecology on women-led farms in the U.S.: Support for environmental and social practices. J. Agriculture Food Systems Community Dev. 13, 129–150. doi: 10.5304/jafscd.2023.131.003
Hill S. B. and MacRae R. J. (1995). Conceptual framework for the transition from conventional to sustainable agriculture. J. Sustain. Agric. 7, 81–87. doi: 10.1300/J064v07n01_07
HLPE (2019). Agroecological approaches and other innovations for sustainable agriculture and food systems that enhance food security and nutrition (Rome: Committee on World Food Security, High Level Panel of Experts on Food Security and Nutrition, FAO Rome).
IPCC (2022). “Climate change 2022: impacts, adaptation, and vulnerability,” in Contribution of Working Group II to the Sixth Assessment Report of the Intergovernmental Panel on Climate Change. Eds. Pörtner H.-O., Roberts D. C., Tignor M., Poloczanska E. S., Mintenbeck K., Alegría A., Craig M., Langsdorf S., Löschke S., Möller V., Okem A., and Rama B. (Cambridge: Cambridge University Press). Available at: https://www.ipcc.ch/report/sixth-assessment-report-working-group-ii/ (Accessed October 10, 2023).
IPES-FOOD (2016). From Uniformity to Diversity: A paradigm shift from industrial agriculture to diversified agroecological systems. Available online at: https://www.ipes-food.org/_img/upload/files/UniformityToDiversity_FULL.pdf (Accessed November 14, 2024).
IPES-FOOD (2018). Breaking away from industrial food and farming systems: Seven case studies of agroecological transition. Available online at: https://www.ipes-food.org/_img/upload/files/CS2_web.pdf (Accessed November 14, 2024).
IPES-FOOD (2020). COVID-19 and the crisis in food systems: Symptoms, causes, and potential solutions. Available online at: https://www.ipes-food.org/_img/upload/files/COVID-19_CommuniqueEN.pdf (Accessed November 14, 2024).
Kassam A., Friedrich T., and Derpsch R. (2019). Global spread of conservation agriculture. Int. J. Environ. Stud. 76, 29–51. doi: 10.1080/00207233.2018.1494927
Lampkin N., Schwarz G., and Bellon S. (2020). Policies for agroecology in Europe, building on experiences in France, Germany and the United Kingdom. Landbauforschung – J. Sustain. Organic Agric. Syst. 70, 103–112. doi: 10.3220/LBF1611684471000
Landert J., Pfeifer C., Carolus J., Schwarz G., Albanito F., Muller A., et al. (2020). Assessing agro-ecological practices using a combination of three sustainability assessment tools. Landbauforschung – J. Sustain. Organic Agric. Syst. 70, 129–144. doi: 10.3220/LBF1612794225000
Levard L. (2023). “Guide pour L’évaluation de L’agroécologie,” in Méthode Pour Apprécier ses Effets et les Conditions de son Développement (Versailles, France: Éditions du Gret and Éditions Quæ).
Loconto A. and Fouilleux E. (2019). Defining agroecology: Exploring the circulation of knowledge in FAO’s Global Dialogue. Int. J. Sociology Agric. Food 25, 116–137.
López-Ridaura S., Masera O., and Astier M. (2002). Evaluating the sustainability of complex socio-environmental systems. The MESMIS framework. Ecol. Indic. 2, 135–148. doi: 10.1016/S1470-160X(02)00043-2
Lucantoni D., Sy M. R., Goïta M., Veyret-Picot M., Vicovaro M., Bicksler A., et al. (2023). Evidence on the multidimensional performance of agroecology in Mali using TAPE. Agric. Syst., 204, 103499. doi: 10.1016/j.agsy.2022.103499
Masera O., Astier M., and López-Ridaura S. (1999). “Sustentabilidad y manejo de recursos naturales,” in El marco de evaluación MESMIS (Mundi Prensa – GIRA – UNAM, México), 101 p.
McGreevy S. R., Tamura N., Kobayashi M., Zollet S., Hitaka K., Nicholls C., et al. (2021). Amplifying agroecological farmer lighthouses in contested territories: navigating historical conditions and forming new clusters in Japan. Front. Sustain. Food Syst. 5. doi: 10.3389/fsufs.2021.699694
Meul M., Van Passel S., Nevens F., Dessein J., Rogg E., Mulier A., et al. (2008). MOTIFS: A monitoring tool for integrated farm sustainability. Agron. Sustain. Dev. 28, 321–332. doi: 10.1051/agro:2008001
Meynard J.-M., Cerf M., Coquil X., Durant D., Le Bail M., Lefèvre A., et al. (2023). Unravelling the step-by-step process for farming system design to support agroecological transition. Eur. J. Agron. 150, 126948. doi: 10.1016/j.eja.2023.126948
Migliorini P., Galioto F., Chiorri M., and Vazzana C. (2018). An integrated sustainability score based on agro-ecological and socioeconomic indicators. A case study of stockless organic farming in Italy. Agroecology Sustain. Food Syst. 42, 859–884. doi: 10.1080/21683565.2018.1432516
Migliorini P. and Wezel A. (2017). Converging and diverging principles and practices of organic agriculture regulations and agroecology. A review. Agron. For Sustain. Dev. 37, 63. doi: 10.1007/s13593-017-0472-4
Ministère de l’Agriculture, de l’Agroalimentaire et de la Forêt (2016). Bio et Haute Valeur Environnementale: deux modes de valorisation complémentaires. Available online at: https://agriculture.gouv.fr/bio-et-haute-valeur-environnementale-deux-modes-de-valorisation-complementaires (Accessed November 14, 2024).
Ministère de l’Agriculture et de la Souveraineté l’Alimentaire (2023). Les chiffres clés de la Haute Valeur Environnementale (HVE). Available online at: https://agriculture.gouv.fr/les-chiffres-cles-de-la-haute-valeur-environnementale-hve (Accessed November 14, 2024).
Moeller N. I., Geck M., Anderson C., Barahona C., Broudic C., Cluset R., et al. (2023). Measuring agroecology: Introducing a methodological framework and a community of practice approach. Elem Sci. Anth 11, 1. doi: 10.1525/elementa.2023.00042
Moraine M., Duru M., and Therond O. (2017). A social-ecological framework for analyzing and designing integrated crop–livestock systems from farm to territory levels. Renew. Agric. Food Syst. 32, 43–56. doi: 10.1017/S1742170515000526
Moraine M., Lumbroso S., and Poux X. (2016). A comprehensive outlook on the diversity of agroecological initiatives in Europe. Deliverable project Ten Years For Agroecology. Available at: http://www.efncp.org/news/news20160701.php (Accessed March 2, 2023).
Mottet A., Bicksler A., Lucantoni D., De Rosa F., Scherf B., Scopel E., et al. (2020). Assessing transitions to sustainable agricultural and food systems: A Tool for Agroecology Performance Evaluation (TAPE). Front. Sustain. Food Syst. 4, 579154. doi: 10.3389/fsufs.2020.579154
Mouratiadou I., Wezel A., Kamilia K., Marchetti A., Paracchini M. L., and Bàrberi P. (2024). The socio-economic performance of agroecology. A review. Agron. Sustain. Dev. 44, 19. doi: 10.1007/s13593-024-00945-9
Namirembe S., Mhango W., Njoroge R., Tchuwa F., Wellard K., and Coe R. (2022). Grounding a global tool—Principles and practice for agroecological assessments inspired by TAPE. Elementa 10, 22. doi: 10.1525/elementa.2022.00022
Nicholls C. and Altieri M. (2018). Pathways for the amplification of agroecology. Agroecology Sustain. Food Syst. 42 (10), 1170–1193. doi: 10.1080/21683565.2018.1499578
Peeters A., Semenova T., Diusheev E., Wezel A., and Migliorini P. (2018). Identification of agroecological farming and other agroecology related activities in Kyrgyzstan (Brussels: Report, Agroecology Europe), 84 p. Available online at: https://www.agroecology-europe.org/oasis-brochure/ (Accessed November 14, 2024).
Peeters A., Škorjanc K., Wezel A., and Migliorini P. (2021). “OASIS, the original agroecological survey indicator system,” in A simple and comprehensive system for agroecological transition assessment (Agroecology Europe, Brussels, Belgium), 82 p. Available at: https://www.agroecology-europe.org/oasis-brochure/ (Accessed November 14, 2024).
Poux X. and Aubert P. M. (2018). “An agroecological Europe in 2050: multifunctional agriculture for healthy eating,” in Findings from the Ten Years For Agroecology (TYFA) modelling exercise (Iddri-AScA, Study N°09/18, Paris, France), 74 p.
Röös E., Mayer A., Muller A., Kalt G., Ferguson S., Erb K. H., et al. (2022). Agroecological practices in combination with healthy diets can help meet EU food system policy targets. Sci. Total Environ. 847, 157612. doi: 10.1016/j.scitotenv.2022.157612
Sachet E., Mertz O., Le Coq J.-F., Cruz-Garcia G. S., Francesconi W., Bonin M., et al. (2021). Agroecological transitions: A systematic review of research approaches and prospects for participatory action methods. Front. Sustain. Food Syst. 5. doi: 10.3389/fsufs.2021.709401
Sarandón S. J. and Flores C. C. (2009). Evaluación de la sustentabilidad en agroecosistemas: una propuesta metodológica. Rev. Agroecología Vol 4, 19–28.
Schulte R. (2020). Lighthouse farms. Ready to meet the challenge of 2050. Irish Farmer’s Journal. Available online at: https://www.farmersjournal.ie/agribusiness/agribusiness-report/agbiz-report-lighthouse-farms-ready-for-sustainability-challenges-of-2050-544235 (Accessed December 2, 2024).
Škorjanc K. (2020). Contributions to the development of a framework for the evaluation of farms’ agroecological transition level. International Centre for Advanced Mediterranean Agronomic Studies (CIHEAM), Bari, Italy and Mediterranean Agronomic Institute of Chania (MAICh, Chania, Crete, Greece, 209 p.
Škorjanc K., Peeters A., Wezel A., and Migliorini P. (2021). “OASIS, the original agroecological survey indicator system,” in Methodology and guidelines for the assessor (Agroecology Europe, Brussels, Belgium), 115 p. Available at: https://www.agroecology-europe.org/oasis-brochure/ (Accessed November 14, 2024).
Sutherland L. A. and Marchand F. (2021). On-farm demonstration: enabling peer-to-peer learning. J. Agric. Educ. Extension. 7 (5), 573–590. doi: 10.1080/1389224X.2021.1959716
Tittonell P. (2020). Assessing resilience and adaptability in agroecological transitions. Agric. Syst. 184, 102862. doi: 10.1016/j.agsy.2020.102862
Van Cauwenbergh N., Biala K., Bielders C., Brouckaert V., Franchois L., Garcia Cidad V., et al. (2007). SAFE—A hierarchical framework for assessing the sustainability of agricultural systems. Agriculture Ecosyst. Environ. 120, 229–242. doi: 10.1016/j.agee.2006.09.006
van der Ploeg J. D., Barjolle D., Bruil J., Brunori G., Costa Madureira L. M., Dessein J., et al. (2019). The economic potential of agroecology: Empirical evidence from Europe. J. Rural Stud. 71, 46–61. doi: 10.1016/j.jrurstud.2019.09.003
Wezel A. (2017). Agroecological practices for sustainable agriculture: principles, applications, and making the transition (New Jersey, USA: World Scientific), 485 p.
Wezel A., Brives H., Casagrande M., Clément C., Dufour A., and Vandenbroucke P. (2016). Agroecology Territories: places for sustainable agricultural and food systems and biodiversity conservation. Agroecology Sustain. Food Syst. 40, 132–144. doi: 10.1080/21683565.2015.1115799
Wezel A., Casagrande M., Celette F., Vian J. F., Ferrer A., and Peigné J. (2014). Agroecological practices for sustainable agriculture. A review. Agron. Sustain. Dev. 34, 1–20. doi: 10.1007/s13593-013-0180-7
Wezel A. and David C. (2020). Policies for agroecology in France: implementation and impact in practice, research and education. Landbauforschung – J. Sustain. Organic Agric. Syst. 70, 66–76. doi: 10.3220/LBF1608660604000
Wezel A., Gemmill Herren B., Bezner Kerr R., Barrios E., Gonçalves A. L. R., and Sinclair F. (2020). Agroecological principles and elements and their implications for transitioning to sustainable food systems. A review. Agron. Sustain. Dev. 40, 40. doi: 10.1007/s13593-020-00646-z
Keywords: agroecological practices, agroecological transition, farm assessment, organic agriculture, multiple indicator analysis, agroecology
Citation: Wezel A, Migliorini P, Brumer A, Gaifami T, Marchetti A, Floymont G, Guizard G, Michel E, Renaud M-A, Škorjanc K, Allard N, Bocchi S and Peeters A (2025) Application of the Original Agroecological Survey and Indicator System tool (OASIS) to organic and conventional farms in Belgium, France, and Italy. Front. Agron. 7:1581667. doi: 10.3389/fagro.2025.1581667
Received: 22 February 2025; Accepted: 28 May 2025;
Published: 23 June 2025.
Edited by:
Philippe Jeanneret, Agroscope, SwitzerlandReviewed by:
Pablo Torres-Lima, Metropolitan Autonomous University, MexicoJoseph George Ray, Mahatma Gandhi University, India
Copyright © 2025 Wezel, Migliorini, Brumer, Gaifami, Marchetti, Floymont, Guizard, Michel, Renaud, Škorjanc, Allard, Bocchi and Peeters. This is an open-access article distributed under the terms of the Creative Commons Attribution License (CC BY). The use, distribution or reproduction in other forums is permitted, provided the original author(s) and the copyright owner(s) are credited and that the original publication in this journal is cited, in accordance with accepted academic practice. No use, distribution or reproduction is permitted which does not comply with these terms.
*Correspondence: Paola Migliorini, cC5taWdsaW9yaW5pQHVuaXNnLml0