 Abeyou W. Worqlul
 Akmal Akramkhanov
 Zafar Gafurov3
- 1International Center for Agricultural Research in the Dry Areas (ICARDA), Tunis, Tunisia
- 2International Center for Agricultural Research in the Dry Areas (ICARDA), Tashkent, Uzbekistan
- 3International Water Management Institute (IWMI), Central Asia Office, Tashkent, Uzbekistan
The water footprint of crops (WFP) is crucial to understand how efficiently water is used in a farming system. This study evaluated the green and blue water footprints of selected crops in the Chirakchi Watershed, located in southern Uzbekistan. The sustainability of water use in the region’s agriculture is a growing concern due to its arid climate and increasing reliance on irrigation. Understanding the spatial and temporal dynamics of crop water use is essential for improving productivity and ensuring long-term water resource sustainability. The study evaluates the sustainability of water use in the region agricultural practices by integrating two biophysical simulation models, SWAT (Soil and Water Assessment Tool) and APEX (Agricultural Policy Environmental eXtender), to assess water consumption patterns of cotton, wheat, carrot, and potato between 2000 and 2023. The result of the study indicated a significant variation in water use among the selected crops, with cotton water use being the highest among the selected crops. The findings also revealed a declining trend in rainfall (green water) and increasing dependence on irrigation (blue water), particularly for cotton and wheat. This pattern highlights the water-intensive nature of the region's dominant cropping system. These trends are alarming, given the region's arid climate and increasing water scarcity driven by climate change. The study highlights the urgent need for improved irrigation efficiency and the adoption of water-saving practices, such as mulching or precision irrigation, to mitigate unsustainable water consumption. This research offers valuable insights into improving water productivity and can inform policy and management strategies in Uzbekistan's agricultural sector.
1 Introduction
Over the past century, global freshwater use has increased more than fourfold (Gleick, 2000), with agriculture being the largest freshwater user, accounting for a significant portion (Hoekstra and Mekonnen, 2012). Freshwater demand is expected to increase further due to the effects of climate change, growing demand of the industry and population, and changing diet preferences. Therefore, improving water productivity in agriculture can contribute to reducing the pressure on global freshwater resources.
In Uzbekistan, agriculture plays a central role in the economy, and it is a major consumer of freshwater resources, channeling > 90% to irrigated agriculture (Aminova and Abdullayev, 2009; Mussatayev et al., 2024). Irrigated agriculture, primarily cotton and wheat production, is water-intensive, largely due to the country arid and semi-arid environment. This heavy reliance on irrigation has placed significant pressure on water resources, particularly in the southern regions of Uzbekistan, including the Chirakchi Watershed in Kashkadarya (Djumaboev et al., 2017). Therefore, understanding the existing irrigation practices and improving water productivity in Uzbekistan is crucial for sustainable water management and food security in the region.
The water footprint (WFP), also known as “virtual water content” provides a measurable indicator of water productivity by quantifying the volume of water consumed per unit of harvested yield (i.e., m3 ton-1), and serves as a common metric for evaluating water productivity (Hoekstra et al., 2009; Hoekstra et al., 2011). The concept and framework to evaluate WFP were introduced by Hoekstra and Hung (2003). The WFP of a cropping system represents the combined consumptive use of green water (soil moisture derived from precipitation, blue water (irrigation supplied from surface or groundwater, as well as capillary rise), and grey water (the volume of water required to dilute agro-pollutants to concentration below the accepted standards) (Xiong et al., 2022). According to Martínez-Alcalá et al. (2018), the grey water footprint is often considered insignificant compared to the blue and green footprint, and it is not widely applied in the Uzbekistan context. Therefore, green and blue WFPs are considered in evaluating water productivity and efficiency, which can serve as an indicator of sustainable water management.
There are various methods for estimating WFP, including field-level assessment, biophysical simulation models, remote sensing-based data analysis, or a combination of the above two or three methods (Romaguera et al., 2010; Ercin and Hoekstra, 2014; Luan et al., 2018; Jiang et al., 2023). Each method has its own limitations and advantages. For instance, while field-level studies offer the highest accuracy, they are limited to the local conditions and are challenging to scale up. Biophysical simulation models estimate WFP by analyzing soil water balance components using observed data, such as soil properties, crop management practices, climate conditions, agronomic information, and hydrological data. The limitation of the biophysical simulation models lies in their inability to fully capture certain factors that limit crop growth and yield, such as pests and diseases, and their difficulty in setting up in data-scarce regions (Van Dijk et al., 2017; Gupta et al., 2022). Remote sensing techniques provide a valuable opportunity for large-scale WFP assessment using satellite imagery to estimate various parameters, such as evapotranspiration, soil moisture, and crop growth, which are essential for calculating WFP. Remote sensing can cover extensive areas and provide data in regions where there are no ground-based observations. However, the accuracy of remote sensing data can be affected by factors such as cloud cover, sensor resolution, and the need for ground-truthing to calibrate and validate the satellite estimation. In this study, we applied a mix of biophysical simulation models and remote sensing to supplement input data to evaluate the green and blue WFP of selected dominant crops in the Chirakchi Watershed in the Kashkadarya Region of Uzbekistan.
Biophysical models, such as the Soil and Water Assessment Tool (SWAT) and the Agricultural Policy Environmental eXtender (APEX) are among the prominent models used to assess soil water balance and water footprint at various scales (Luan et al., 2018; Mabhaudhi et al., 2023). The SWAT and APEX models are semi-distributed, physically based models applied at watershed and field levels, respectively. Both models use similar input data, including topographic information, climate, land use, soil, and agricultural management practices. The SWAT model can assess the different water balance components, while the APEX can evaluate the effects of agricultural management practices on productivity and environmental sustainability. Both models combined can be utilized to understand the effects of agricultural/watershed management practices on crop growth, productivity, and environmental sustainability (Ahmadzadeh et al., 2016; Ashraf Vaghefi et al., 2017; Worqlul et al., 2018; Zhang et al., 2018).
Previous studies on water footprint were on coarse spatial resolutions that treat the entire world, continents, or countries as a whole (Yang and Cui, 2014; Mekonnen and Hoekstra, 2015; Veettil and Mishra, 2020; Tuyishimire et al., 2022). Due to the global nature of water footprint assessments, a critical gap remains in high-resolution, locally contextualized analyses for informing site-specific water management decisions. This study focuses on evaluating the water footprint of a cropping system across the Chirakchi Watershed in Kashkadarya, Uzbekistan. The gap was addressed by integrating the SWAT and APEX models to evaluate the spatial and temporal variation of green and blue WFP of four selected crops over 2000 – 2023. Unlike global assessments that often rely on coarse data or default parameters (Romaguera et al., 2010; Mekonnen and Hoekstra, 2011; Veettil and Mishra, 2020), this study incorporates locally sourced crop management data, region-specific calibration, and model integration tailored to the Chirakchi Watershed—an understudied but agriculturally significant area of southern Uzbekistan. We aimed to assess the green and blue WFP of crops in a spatially explicit way, taking into account the local climate, soil conditions, and agricultural management practices. The outputs of this study can offer insights into the patterns of agricultural water consumption and can serve as input for further virtual water trade studies and water footprint assessments.
2 Materials and methods
2.1 Study area
The study was conducted in the Chirakchi Watershed located in the Kashkadarya region of southern Uzbekistan. Geographically, the watershed is located between 38° 40.55’N, 66° 36.31’E and 39° 21.69’N, 67° 41.39’E (Figure 1). The watershed covers a total area of 4,396 km2, occupying 16% of the Kashkadarya region. Elevation within the watershed varies from 516 to 4,380 m above mean sea level (amsl). The topography is notably complex, consisting of rugged mountains, rolling hills, and broad valleys, with a standard deviation of 907 m. The average slope of the watershed is ~27%, estimated from a 30 m Digital Elevation Model (DEM) obtained from the National Aeronautics and Space Administration (NASA) (Farr et al., 2007). The Chirakchi Watershed is a tributary to the Kashkadarya River, which provides essential water for agriculture, industry, and local communities. Within the watershed, significant agricultural activity focuses on the production of cotton, wheat, barley, maize, and various fruits and vegetables, utilizing both rainfed and irrigation systems.
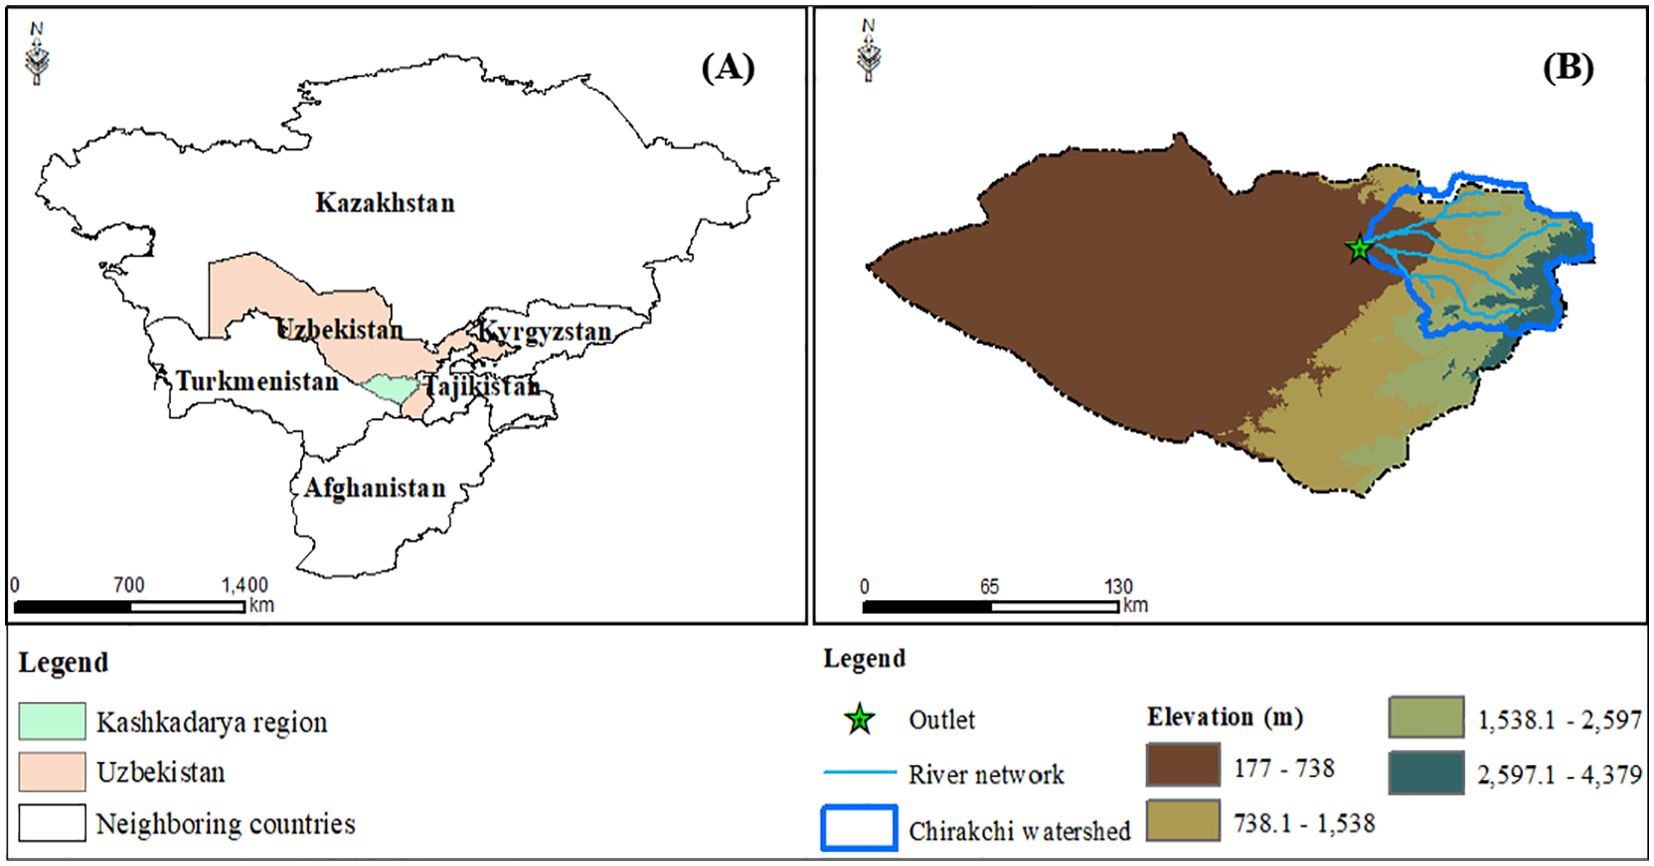
Figure 1. Location of the study area, river network, and watershed outlet: (A) location of Uzbekistan and Neighbouring countries, including Kashkadarya Region; and (B) Kashkadarya Region and Chirakchi watershed with a 30 m resolution DEM as a background.
The watershed climate is typically continental and partly arid. In the summer, the watershed is extremely hot, with temperatures often exceeding 35 °C in July and August. Winter is relatively cold, with temperatures frequently dropping below freezing temperature in January and February.
2.2 Methods
The blue and green water footprints of the selected crops were estimated by integrating the SWAT and APEX models. The integration of the models was necessary due to the lack of sufficient field-level data, such as streamflow, to calibrate the APEX model. The following steps were followed to estimate the green and blue water footprints of the major crops in the Chirakchi watershed of Uzbekistan:
i. The SWAT model was set up to capture the observed flow of the watershed and estimate the spatial distribution of the water balance components across the watershed. At the end of the first step, the spatial distribution of the water balance components (i.e., surface runoff, actual evaporation, percolation, and baseflow) at the subbasin level was estimated.
ii. The APEX model was set up in one of the SWAT subbasins, which is dominated by agricultural practices and crop water requirements, and the associated yield was estimated.
The APEX model simulation was calibrated with simulated streamflow of the respective SWAT streamflow and for the observed crop yield. Lastly, the actual evapotranspiration estimated by the APEX model was then partitioned into components derived from rainfall and irrigation. On a daily basis, when rainfall occurred without irrigation, evapotranspiration was attributed entirely to rainfall. Conversely, when irrigation was applied without rainfall, evaporation was attributed to irrigation. In conditions where both rainfall and irrigation occurred, their contributions to evaporation were proportionally weighted based on the amount of water provided by each water source. The portion of evapotranspiration attributed to rainfall was classified as green water, while the portion of water attributed to irrigation was classified as blue water. Finally, the blue and green water footprints for irrigated and rainfed crops were estimated by dividing the cumulative actual evapotranspiration over the growing period by the corresponding crop yield (m3 kg-1), in accordance with Hoekstra et al. (2011). The methodological framework followed to estimate the WFP of selected crops is shown in Figure 2.
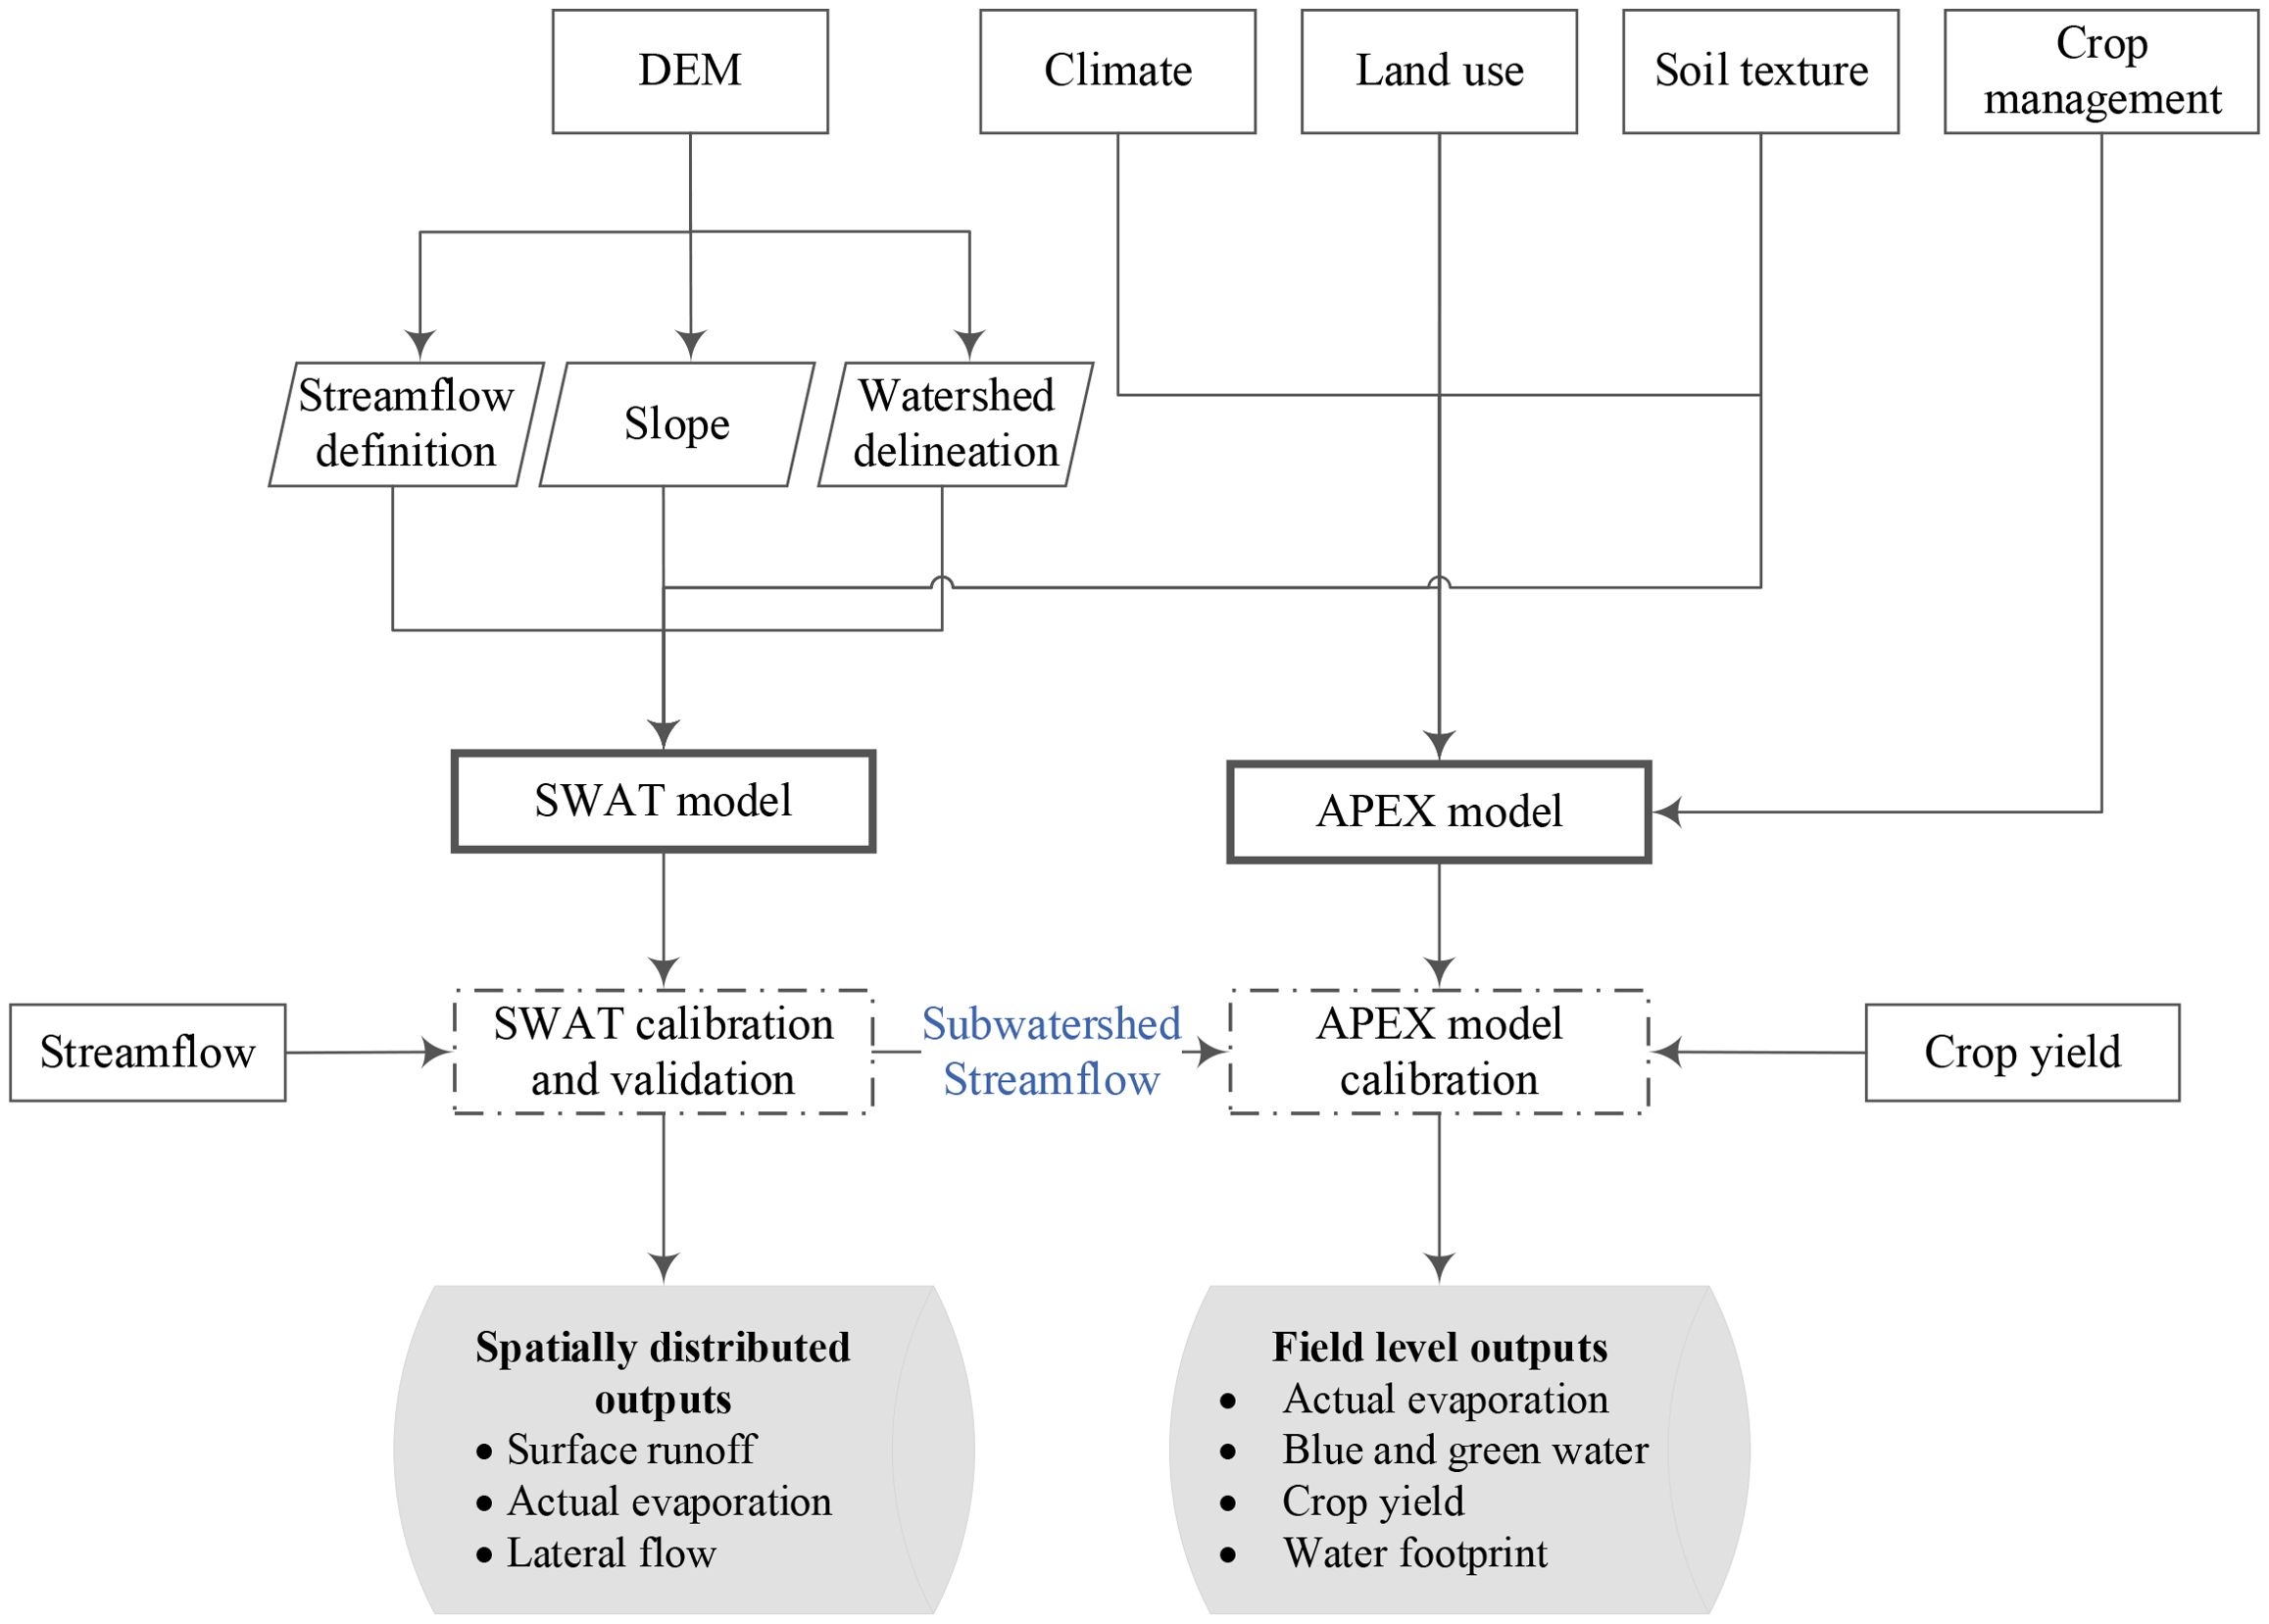
Figure 2. The methodological framework of SWAT–APEX integration to estimate the water footprint of selected crops.
2.2.1 Spatiotemporal data availability
2.2.1.1 Hydro-climatic data
Hydro-climatic data, including daily climate data and streamflow, are required to set up, calibrate, and validate both SWAT and APEX models. However, due to the limited availability of ground-based daily climate data, we utilized satellite-based rainfall data from CHIRPS (Climate Hazards Group InfraRed Precipitation with Stations), and other climate variables, such as minimum and maximum temperature, solar radiation, and relative humidity, were collected from CFSR (Climate Forecast System Reanalysis). CHIRPS is a global rainfall data estimated from satellite data merged with station-based observations (Funk et al., 2015). The data is available from 1981 to the present with a spatial resolution of 5.5 km (~0.05 degrees), and it offers reliable rainfall estimates in regions where ground-based data is sparse or unavailable (Peña-Guerrero et al., 2022; Gulakhmadov et al., 2023). CFSR, on the other hand, provides comprehensive global weather and climate data by blending observations with model simulations, ensuring a continuous, high-quality dataset to support climate and hydrological modeling efforts (Dile and Srinivasan, 2014; Rodda et al., 2019). CFSR data has a spatial resolution of ~ 38 km (0.3125 degrees) and provides global climate data since 1979. These datasets provide the necessary inputs for robust model performance when there is incomplete in-situ data. The watershed average annual rainfall across the watershed varies between 325 and 910 mm, with a standard deviation of 160 mm (2000 – 2023, Figure 3). Streamflow is observed daily with an automatic river gauging station. Figure 4 shows the average monthly rainfall (primary y-axis) and observed streamflow at the watershed outlet (secondary y-axis) (2000 – 2023).
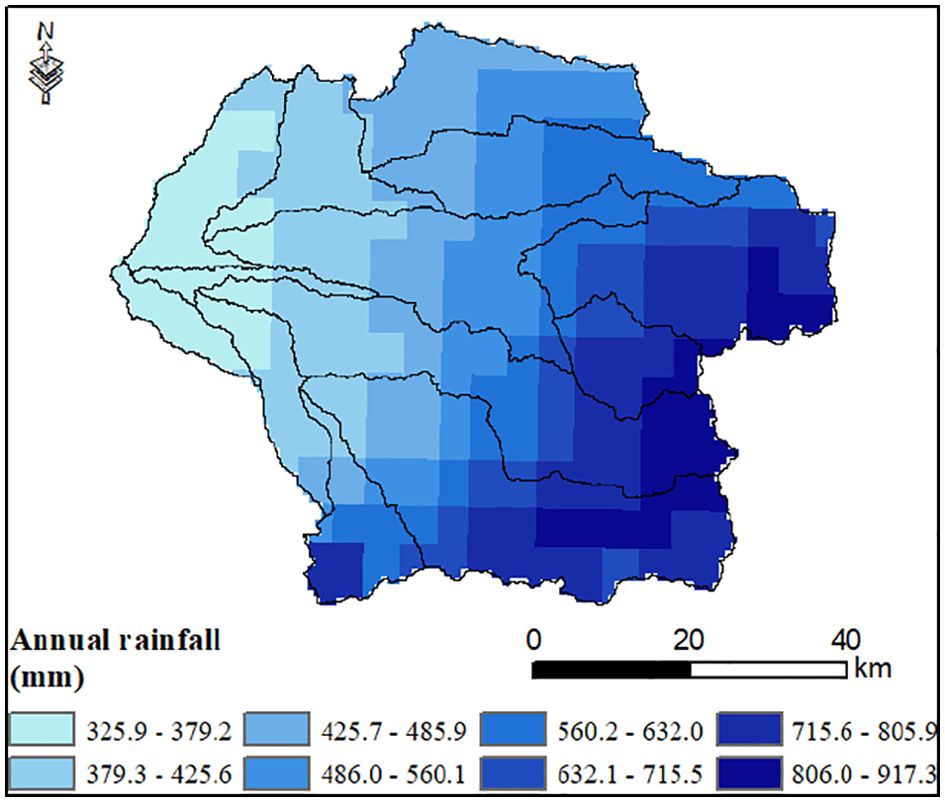
Figure 3. The spatial distribution of annual average rainfall (2000 – 2023).
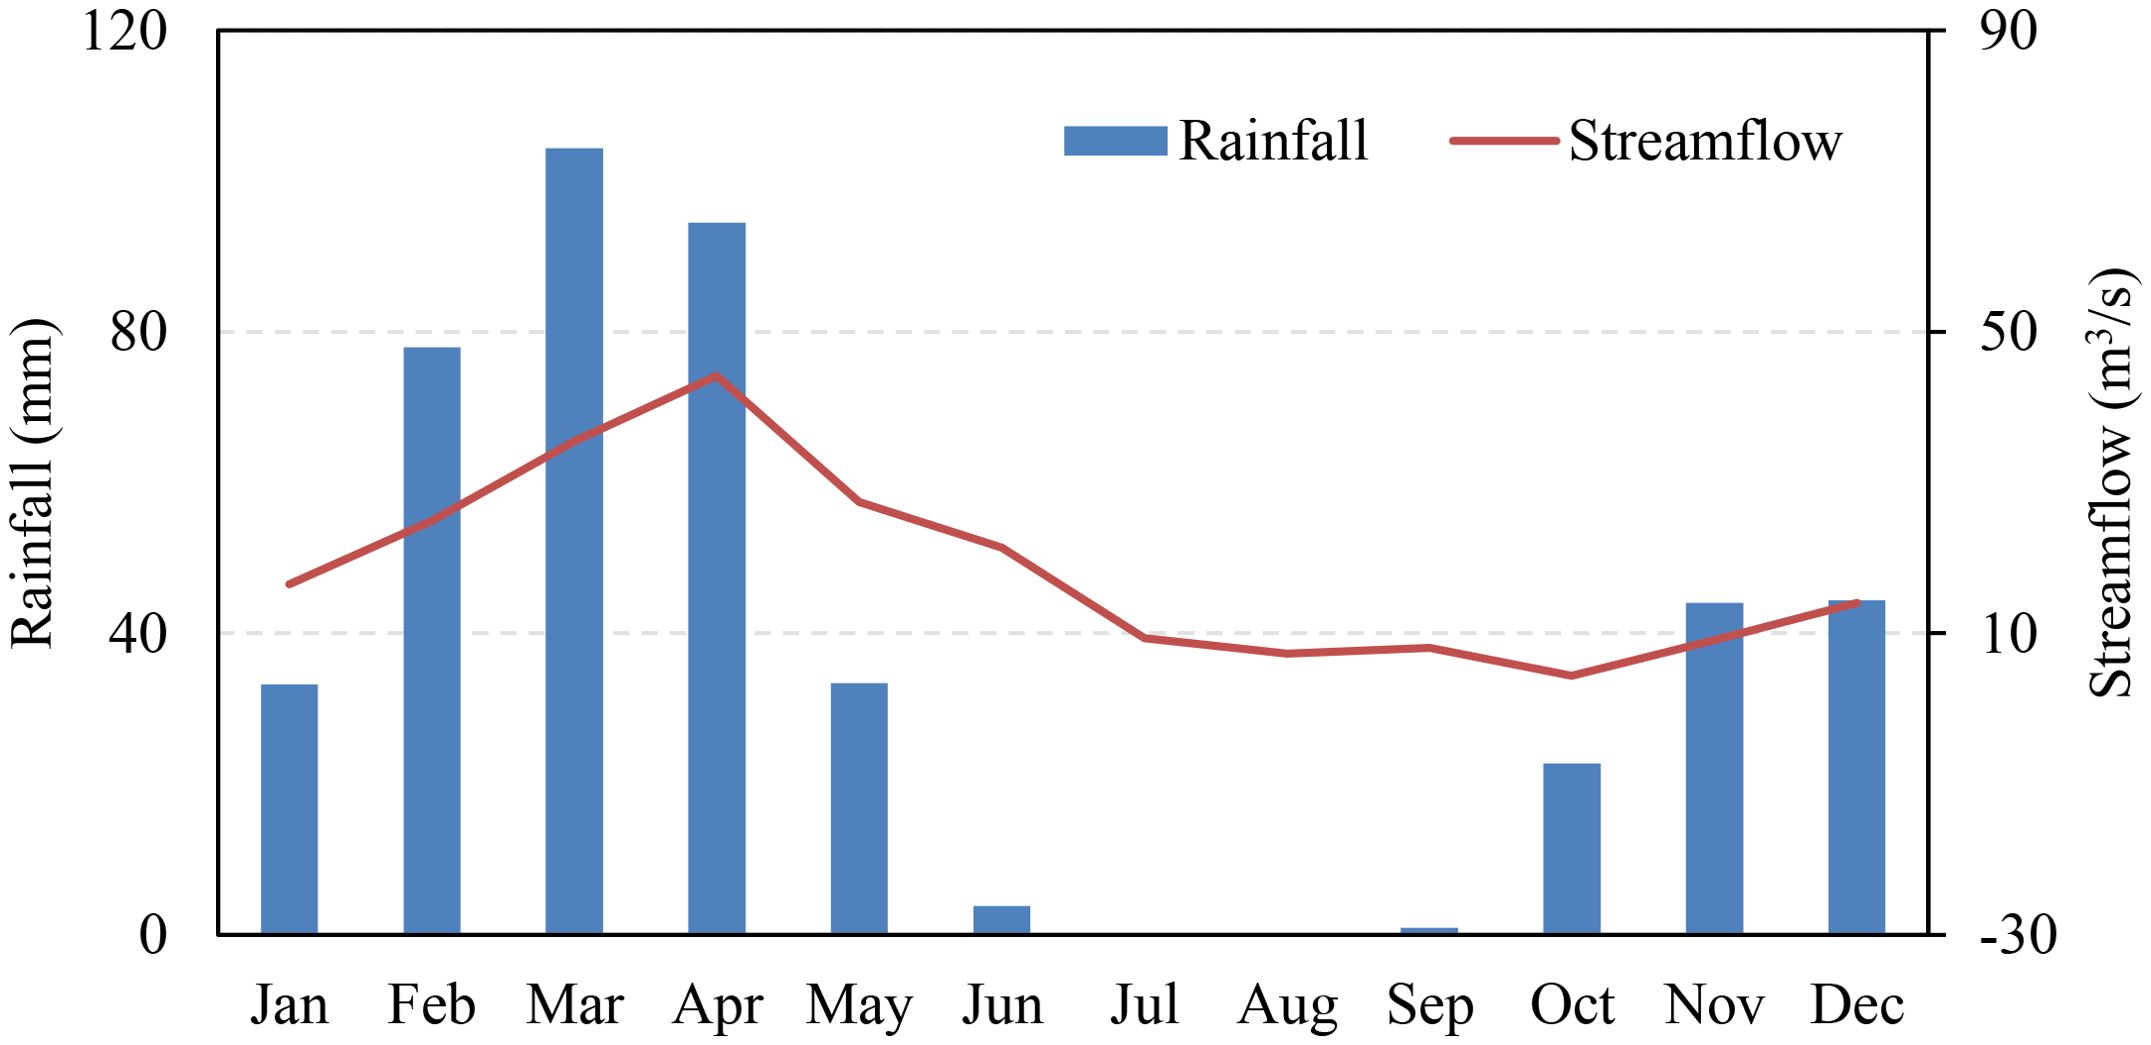
Figure 4. The areal average monthly rainfall and streamflow (secondary y-axis) of the watershed for 2000 - 2023.
2.2.1.2 Spatial data
The land use, soil, and digital elevation model (DEM) of the study area were obtained from the European Space Agency (ESA), FAO Harmonized World Soil Database (HWSD), and NASA, respectively (Farr et al., 2007; Wieder et al., 2014; Karra et al., 2021). The land use data collected from ESA was estimated from the Sentinel-2 satellite, which has a 10 m resolution. The land use data has undergone multiple processes for land use classification using machine learning supervised classification, which includes radiometric, geometric, and atmospheric corrections. The land use spatial data is available annually from 2017 to 2021; for this study, the land use data of 2020 was used. The land use data indicate that the majority of the watershed is covered by rangeland (70%), followed by cropland (16%), urban areas (8%), and bare ground (4%), with the remaining 2% comprising water bodies, forests, and snow.
The watershed boundary, drainage pattern, and other watershed characteristics were estimated using a 30 m resolution DEM. The topographic information indicated that 24% of the watershed has a slope of less than 8%, making it suitable for surface irrigation. The soil data collected from HWSD indicated that the majority of the watershed has loamy soil texture.
2.2.1.3 Crop yield and crop management
The APEX model was set up with local climate, soil, and management data to simulate the observed yield. Calibrating and validating the APEX model requires detailed crop management and yield data; the required data extends from the land preparation date and tilling depth to the harvesting date and yield. The key management practices include fertilization and irrigation schedule and amount, and yield information was collected from 2021 to 2023 from statistical reports compiled by local authorities, as well as interviews with farmers and local agricultural experts. The data was collected across farms of various sizes. Table 1 presents the agricultural management schedule for selected crops, averaged across various farms.
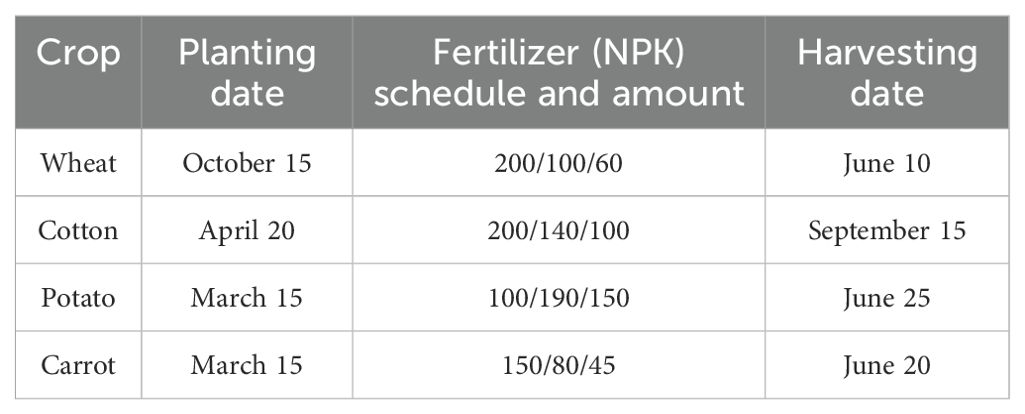
Table 1. Agricultural management schedule of the selected crops.
The primary crops cultivated in the watershed include wheat, cotton, potato, and carrot. With the exception of cotton, most of these crops were harvested in June (see Table 1). Wheat was planted in October, and potato and carrot were planted in March.
2.2.2 SWAT and the APEX model
The study relied on the SWAT2012 version due to its proven applicability both regionally and globally, as well as its seamless integration with the APEX model. The SWAT and APEX models were developed from the Environmental Policy Integrated Climate (EPIC) model to work at various scales. They are developed to evaluate the effect of agricultural management practices on productivity and environmental suitability across various scales, such as field to watershed level (Worqlul et al., 2019; Wolfe et al., 2021). They also share similar attributes, such as similar input requirements and a common database in various formats, allowing for straightforward integration. To ensure consistent and accurate estimation of potential evaporation in both the SWAT and APEX models, we applied the Penman-Monteith method, which is one of the most accurate approaches available within these models, as it accounts for multiple climatic factors influencing evaporation (Earls and Dixon, 2008; Jung et al., 2016). In the SWAT model, the watershed is divided into subwatersheds using a topographic map and disaggregated into multiple hydrologic response units (HRUs) that are assumed to be homogeneous in soil, land use, and slope. Since SWAT assigns a single set of climate data to each sub-watershed, we estimated the areal average of all climate variables across each sub-watershed rather than using point or grid values. The resulting averages were then assigned to the centroid of the respective sub-watersheds. This approach minimizes spatial bias introduced by resolution differences between datasets, while ensuring the climate input remains representative of local conditions. The SWAT model was used to capture the spatial variability of hydrological components through model calibration using observed streamflow data at the outlet of the Chirakchi watershed. The APEX model is a field-level simulation model that divides the watershed into homogeneous units known as subareas. It can assess the effects of various agricultural management practices, such as fertilization, irrigation, crop rotation, and tillage, on productivity, soil health, and environmental outcomes. The study used the APEX model to estimate actual evaporation and crop yield for the selected crops. The APEX model was set up in one of the SWAT subwatersheds dominated by agricultural practices and calibrated to capture the SWAT simulated streamflow, followed by calibrating the respective crop parameters to capture the observed crop yield. The two steps of the APEX model calibration for hydrology and crop yield are essential to ensure accurate simulation of soil water dynamics and their impact on crop growth.
2.2.2.1 Model calibration and validation
The SWAT model was set up at the outlet of the Chirakchi watershed to capture the observed streamflow for the period 2000–2023 through model calibration. Sensitivity analysis, model calibration, and validation were done using the Generalized Likelihood Uncertainty Estimation (GLUE) available under SWAT Calibration and Uncertainty Procedures (SWAT-CUP). Using the GLUE model, five thousand iterations were performed, randomly selecting model parameters within the model parameter space to identify the best-performing parameter sets that produce equally acceptable results. For the APEX model, calibration was done manually through trial and error to capture the observed yield with minor adjustments to the selected default crop parameters. The performance of the simulation for both models was evaluated using multiple objective functions, including Nash-Sutcliffe Efficiency (NSE, Nash and Sutcliffe, 1970), percent bias (PBIAS), Root Mean Square Error (RMSE), and coefficient of determination (R-squared).
3 Results and discussion
3.1 Performance of the SWAT model
A sensitivity analysis of the selected 18 SWAT model parameters was accomplished with the SWAT CUP using GLUE operation. The sensitivity of the model parameters was measured with t-stat and p-value; they help identify the most significant parameters that affect the output variable (streamflow). t-stat measures the level of model parameter sensitivity and the relationship with the simulated variable. The higher absolute value of the t-stat indicates a stronger influence on the simulated variable. Meanwhile, the p-value signifies the statistical significance of the parameters impact on the simulated variable. The smaller p-value, usually less than 5%, indicates the statistical significance of the parameter influence on the simulated variable. Among the selected parameters, 14 of them had a p-value of less than 5%, showing their significant influence on the simulated variable. Table 2 presents the performance of the SWAT model during the calibration and validation periods, including the ranks of the most sensitive parameters with their respective t-stat and p-value. The sensitivity analysis indicated that CN2, ALPHA_BNK, and ESCO were the top three sensitive model parameters affecting the simulated variable.
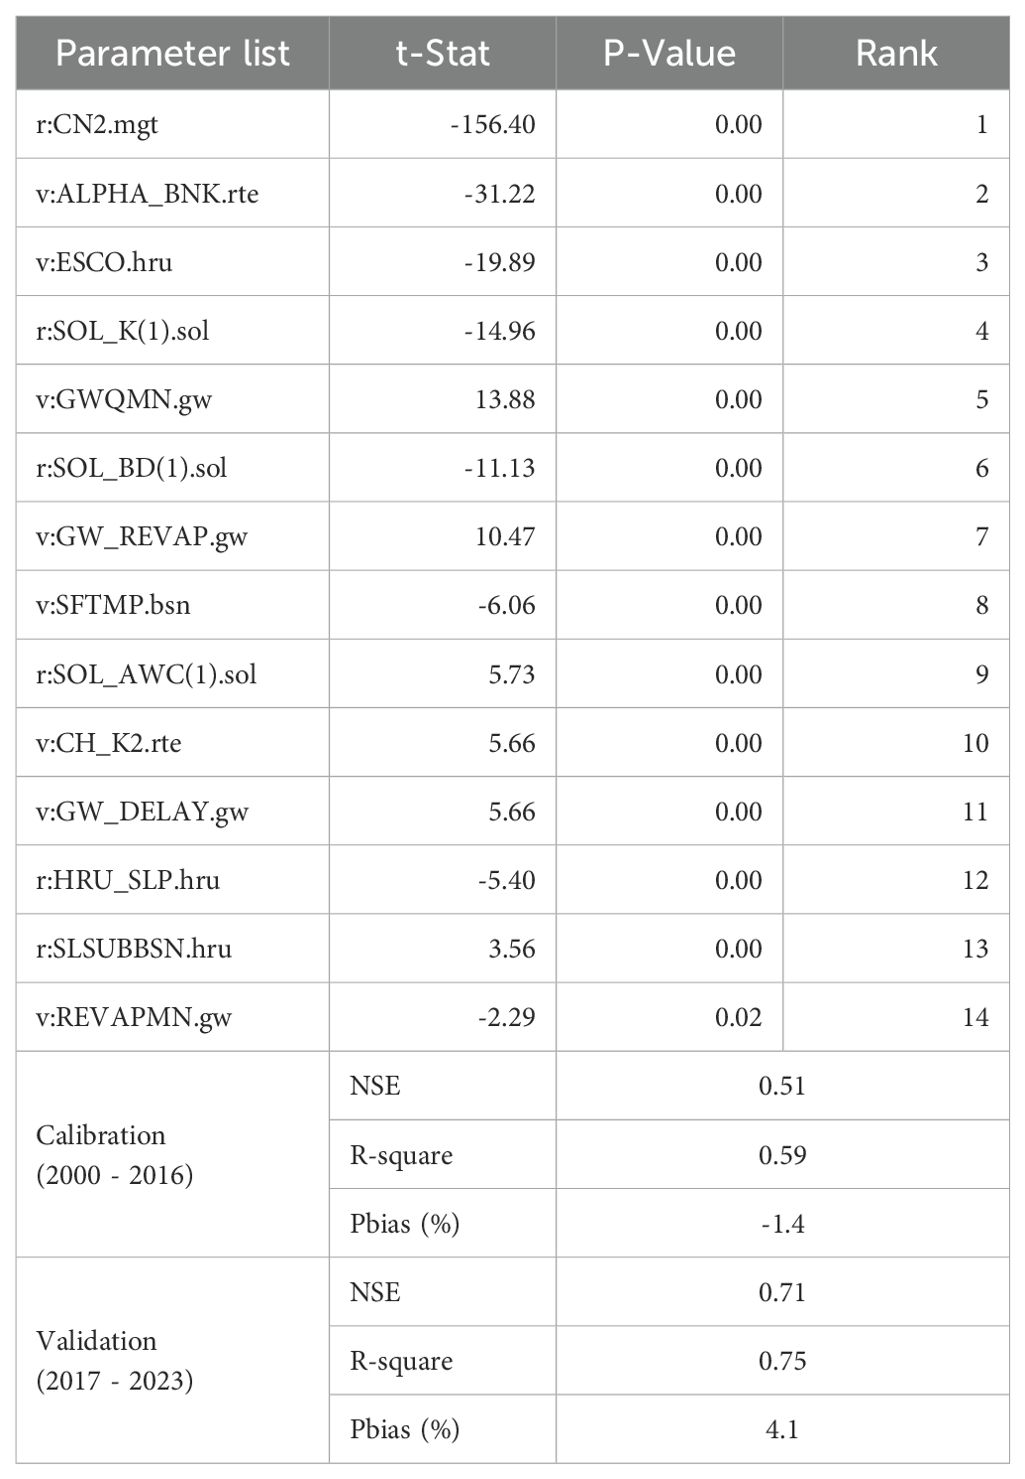
Table 2. Sensitivity and rank of the most sensitive model parameters with the model performance indicator during the calibration and validation period.
Among 5,000 iterations, only 20 model parameter sets provided optimal solutions (NSE > 0.5); among them, the one that performed highest NSE is presented. The performance of the selected model parameter sets during calibration and validation periods is presented in Figure 5. During the calibration period, the model performance was acceptable with NSE of 0.51, R-square of 0.59, and PBIAS of -1.4 (Figure 5a). When validated with independent input data, the model demonstrated acceptable performance, with NSE, R-square, and PBIAS values of 0.71, 0.75, and 4.1%, respectively (Figure 5b). According to the model performance guidelines by Moriasi et al. (2007), the performance of the model during the calibration period is rated as ‘satisfactory’, while the performance during the validation period is rated as ‘good’.
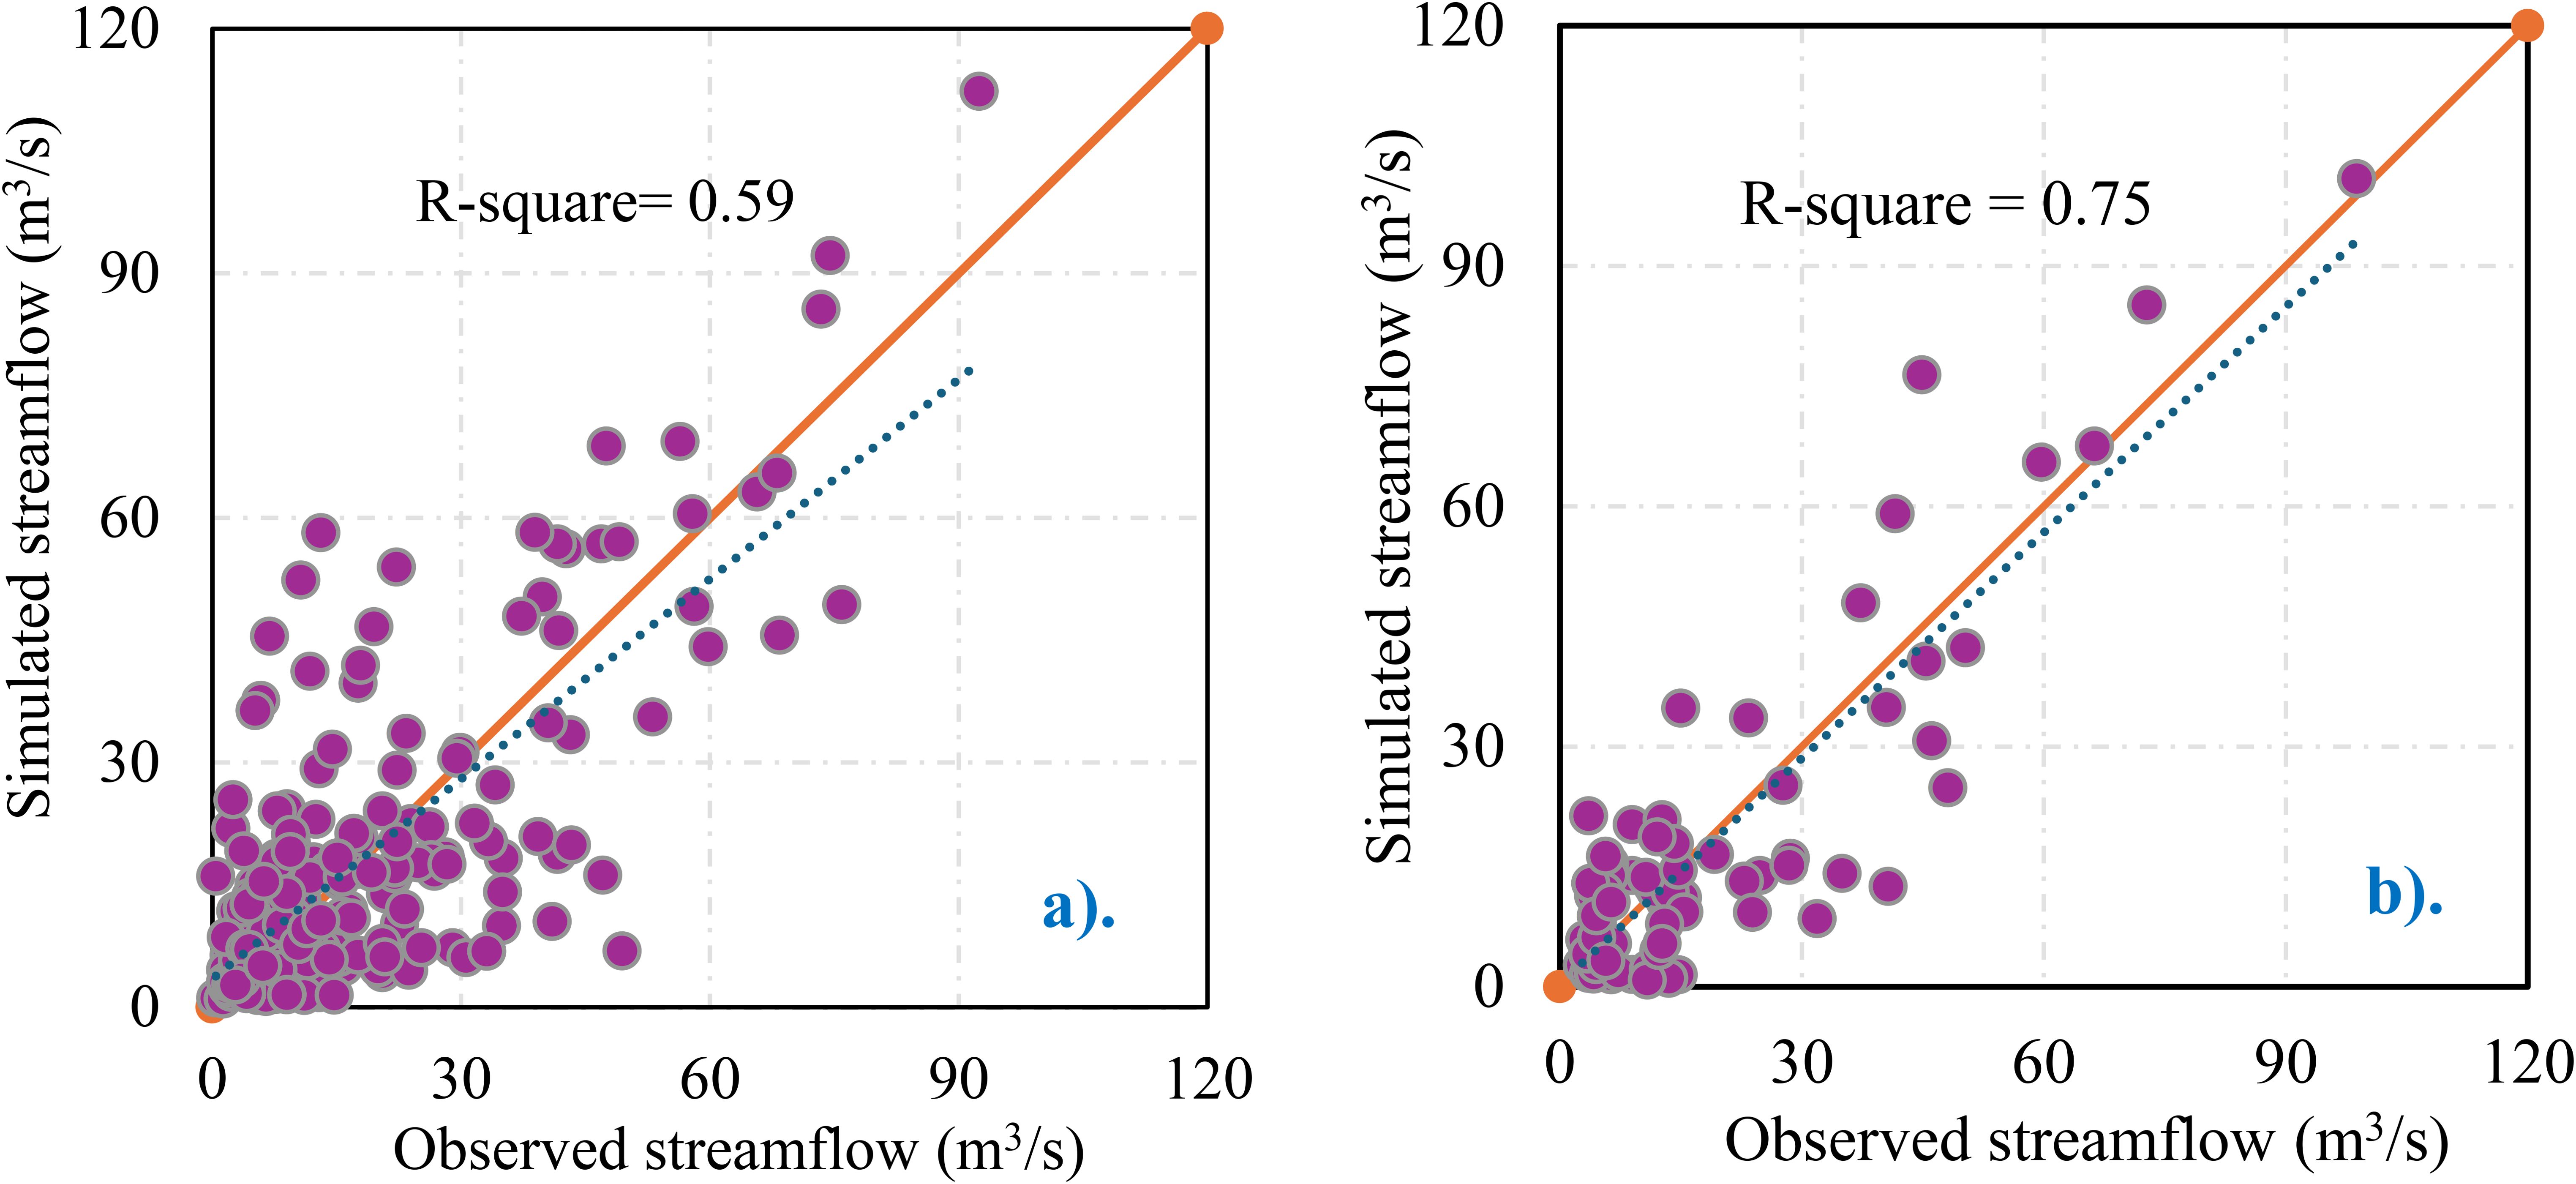
Figure 5. Scatter plot of simulated vs. observed streamflow of Chirakchi watersheds for the calibration and validation period. (a) Chirakchi simulated streamflow performance for the calibration period (2000 – 2016). (b) Chirakchi simulated streamflow performance for the validation period (2017 – 2023).
3.2 Spatial distribution of hydrological components
The calibrated and validated SWAT model showed the spatial distribution of hydrological components across the watershed. Figures 6a, b illustrate the spatial distribution of surface runoff (mm) and actual evapotranspiration (mm). Areas with high rainfall, steeper slope, and low vegetation cover indicated a higher runoff coefficient (runoff/rainfall) of over 25%. The flatter area near the watershed outlet indicated a lower runoff coefficient ranging from 10 to 15%. Regions with high runoff or high runoff coefficients are likely to have greater potential for soil erosion.
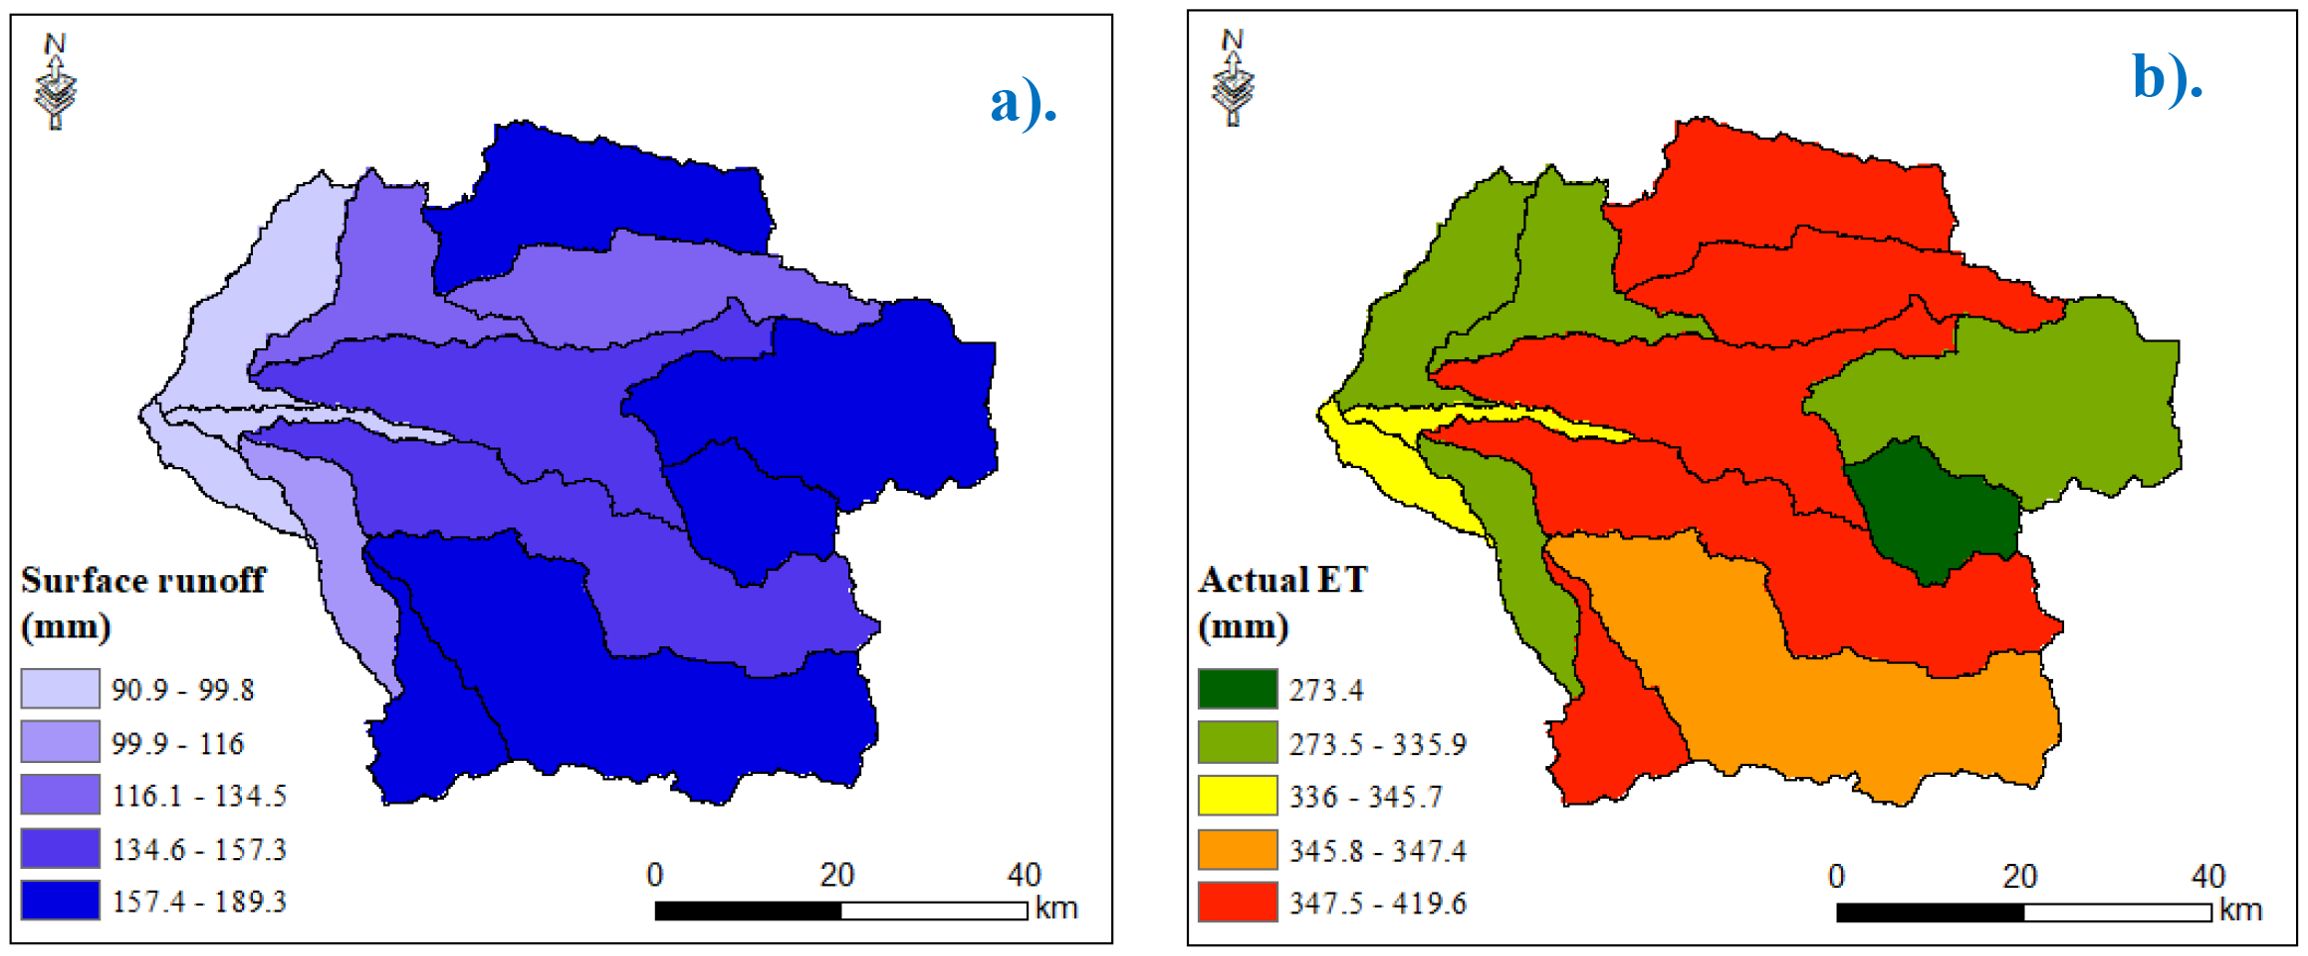
Figure 6. Annual average surface runoff and actual evaporation across the subwatersheds. (a) annual average surface runoff and (b) annual average actual evapotranspiration.
These patterns were interplayed by topography, soil texture, and vegetation cover. Specifically, upstream areas with steep slopes and sparse vegetation contribute disproportionately to surface runoff, highlighting the need for targeted soil and water conservation measures. In contrast, flatter downstream areas promote greater infiltration, reducing surface runoff while increasing subsurface flow and, potentially, waterlogging risks.
The annual average water balance components of the watershed, including surface runoff, lateral flow, groundwater flow, and evaporation, are illustrated in Figure 7. On average, across the watershed during the study period, evapotranspiration was the major component of the water balance, accounting for ~58% of the annual rainfall. This was followed by runoff, representing 26% of the annual rainfall, while 6.5% of the annual rainfall contributes to the groundwater flow.
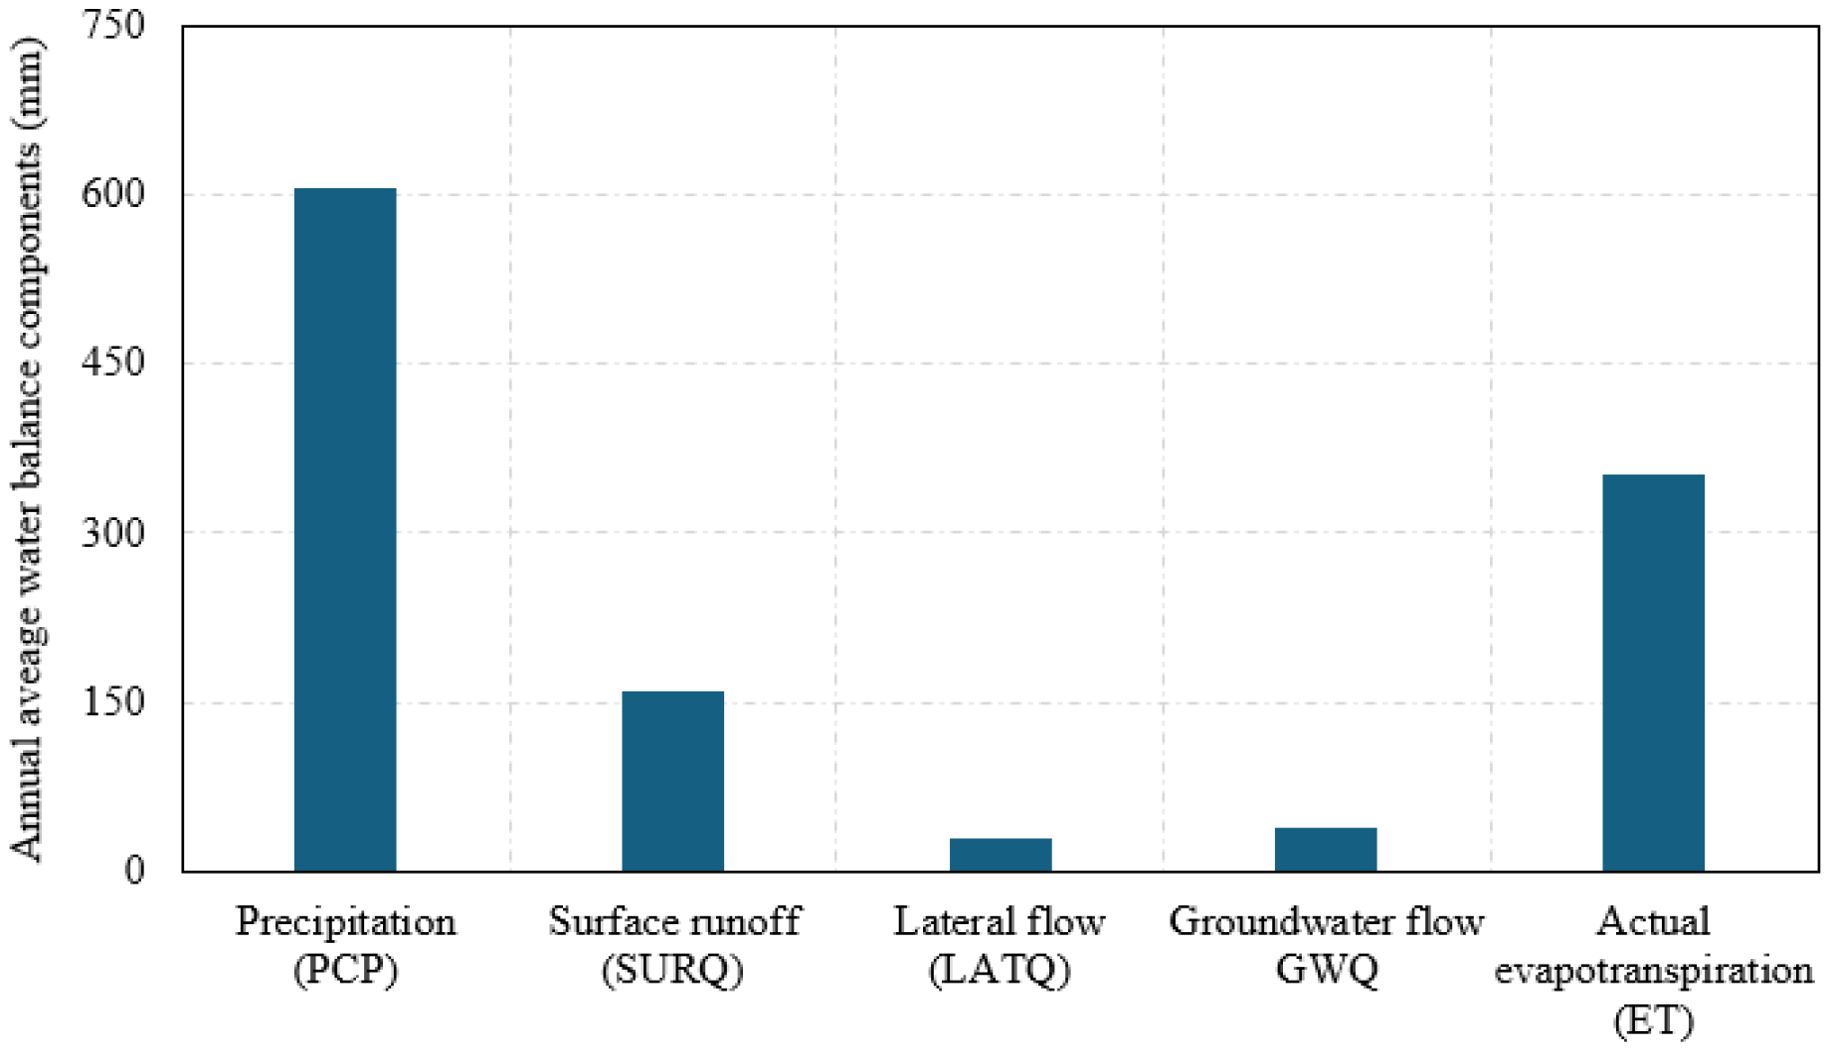
Figure 7. Water balance components of the Chirakchi watershed.
The dominance of evapotranspiration in the water balance is typical of semi-arid regions like Chirakchi, where water losses through the atmosphere exceed contributions to surface and subsurface flows. These findings underscore the importance of improving irrigation efficiency and adopting crop types with lower ET demand to enhance water productivity. Additionally, the relatively small groundwater contribution suggests limited recharge, which could have implications for the sustainability of groundwater-dependent irrigation.
3.3 APEX model simulation for the baseline period
The APEX model, calibrated with the SWAT simulated streamflow data, demonstrated an acceptable performance during the calibration as well as the validation periods. During the calibration period, the model achieved an NSE of 0.66, PBIAS of 2.3%, and R-square of 0.78, while the validation period indicated an NSE of 0.71, PBIAS of 3.2%, and R-square of 0.79. Figure 8 shows a scatter plot of the SWAT versus APEX simulated streamflow. The streamflow calibrated APEX model was subsequently used to estimate the selected crops’ observed yield from 2021 to 2023, and the simulated long-term actual crop water requirements were used to estimate the green and blue water footprint of the production system.
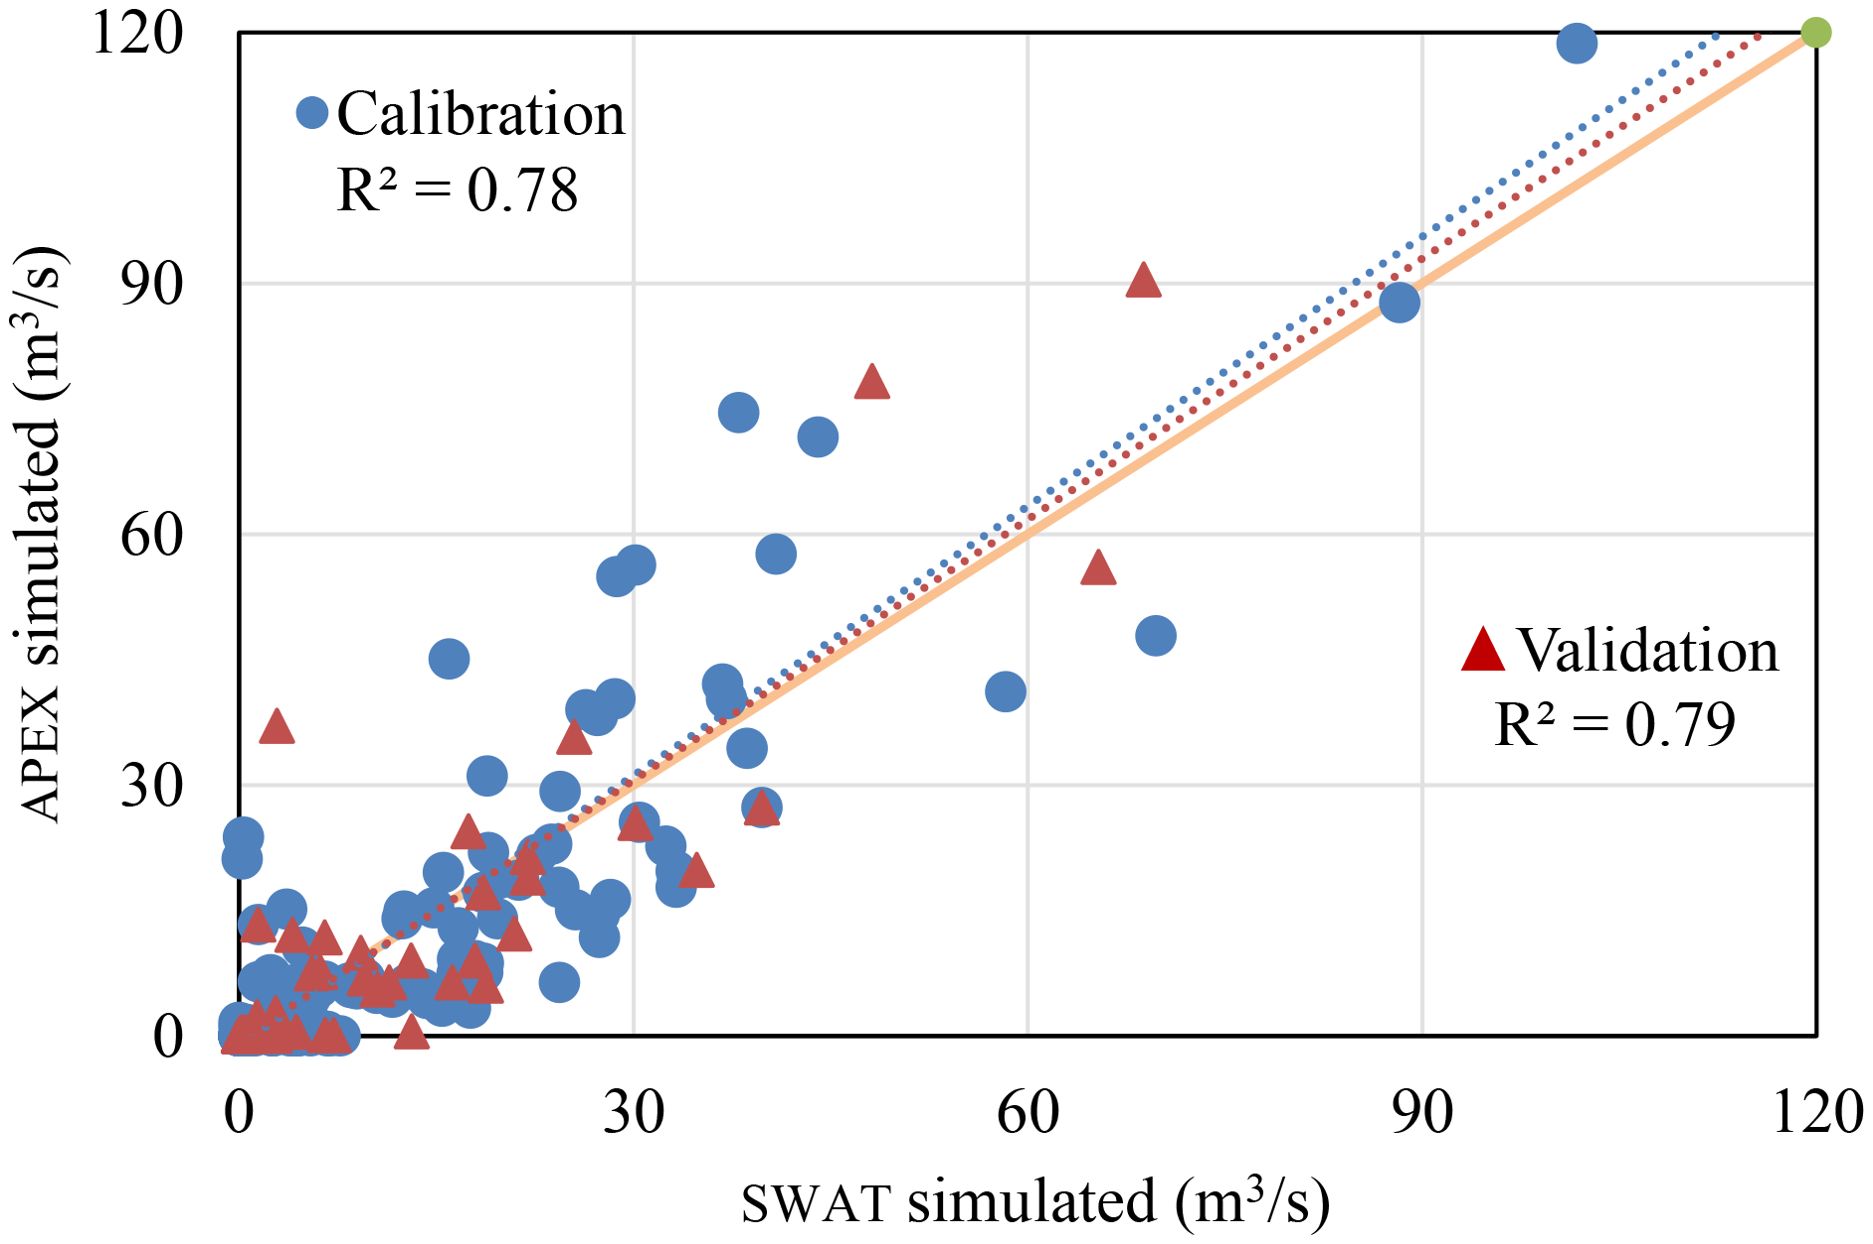
Figure 8. The scatter plot of SWAT simulated vs. APEX simulated streamflow during the calibration and validation period (2001–2016 and 2017 - 2023).
The APEX model crop parameters were calibrated within ± 3% of the default model parameter value. The parameters include HI (harvest index), WA (biomass energy ratio), and TBS (minimum temperature for plant growth). This was done to ensure the APEX model realistically captures the crop growth and yield. The HI represents the fraction of harvest yield and the total above-ground biomass, WA represents the efficiency of the crop in converting the intercepted solar radiation into biomass, and TBS represents the lowest temperature at which the crop can grow and develop. The calibrated APEX model reasonably captured the observed crop yield with a PBIAS of 23% for wheat, -3% for carrot, -15% for potato, and 16.5% for cotton. The performance of the APEX simulated crop yield evaluated with RMSE indicated 1.8 t ha-1 for wheat, 2.8 t ha-1 for carrot, 3.8 t ha-1 for carrot, and 0.5 t ha-1 for cotton. The model performance during the validation period indicated a PBIAS ranging between -8% and -10%. For most crops, including carrot and potato, the major yield-limiting factor in the region was temperature stress, which indicates the number of suboptimal days, either high or low temperature. Additionally, nitrogen stress was another significant yield-limiting factor for cotton and wheat.
3.4 Water footprint of dominant crops
The calibrated APEX model for streamflow and observed crop yields were further used to assess potential evapotranspiration (PET), actual evapotranspiration (ET), and transpiration (PE) components for the five selected crops over the entire growing period. The crops potential evaporation exhibited minimal variation across crops since it only represents the evaporation potential of the climate; the slight differences observed were associated with the variations in crop growing periods and durations. In terms of actual evapotranspiration, cotton exhibited the highest actual evapotranspiration compared to the other selected crops; on average, cotton actual evapotranspiration was 52% higher than potato, 59% higher than wheat, and 34% higher than carrot (Figure 9). This significant difference was due to cotton larger leaf area index than other crops, facilitating greater water loss through transpiration. Carrot exhibited the second-highest actual evapotranspiration, which was due to higher soil evaporation (actual evapotranspiration minus transpiration, Figure 10) since it has the lowest leaf area index, exposing the soil to direct solar radiation. The simulation indicated soil evaporation was higher for carrots, followed by wheat and potatoes. The fraction of soil evaporation for carrots can reach up to 35%. A similar study in Ethiopia by Worqlul et al. (2019) indicated that soil evaporation of non-leafy plants, such as onions, could reach up to 60% of the total evapotranspiration. A similar conclusion was drawn by multiple researchers, indicating higher soil evaporation rates associated with non-leafy plants (Lawrence et al., 2007; Li et al., 2013; Carvalho et al., 2018). The result highlights the importance of adding a soil protective layer, such as organic mulch or a plastic cover, especially when cultivating non-foliage crops like onions and garlic, or during the early growth stage of any crop, to reduce soil evaporation. Such measures can help reduce soil evaporation, ultimately improving water productivity.
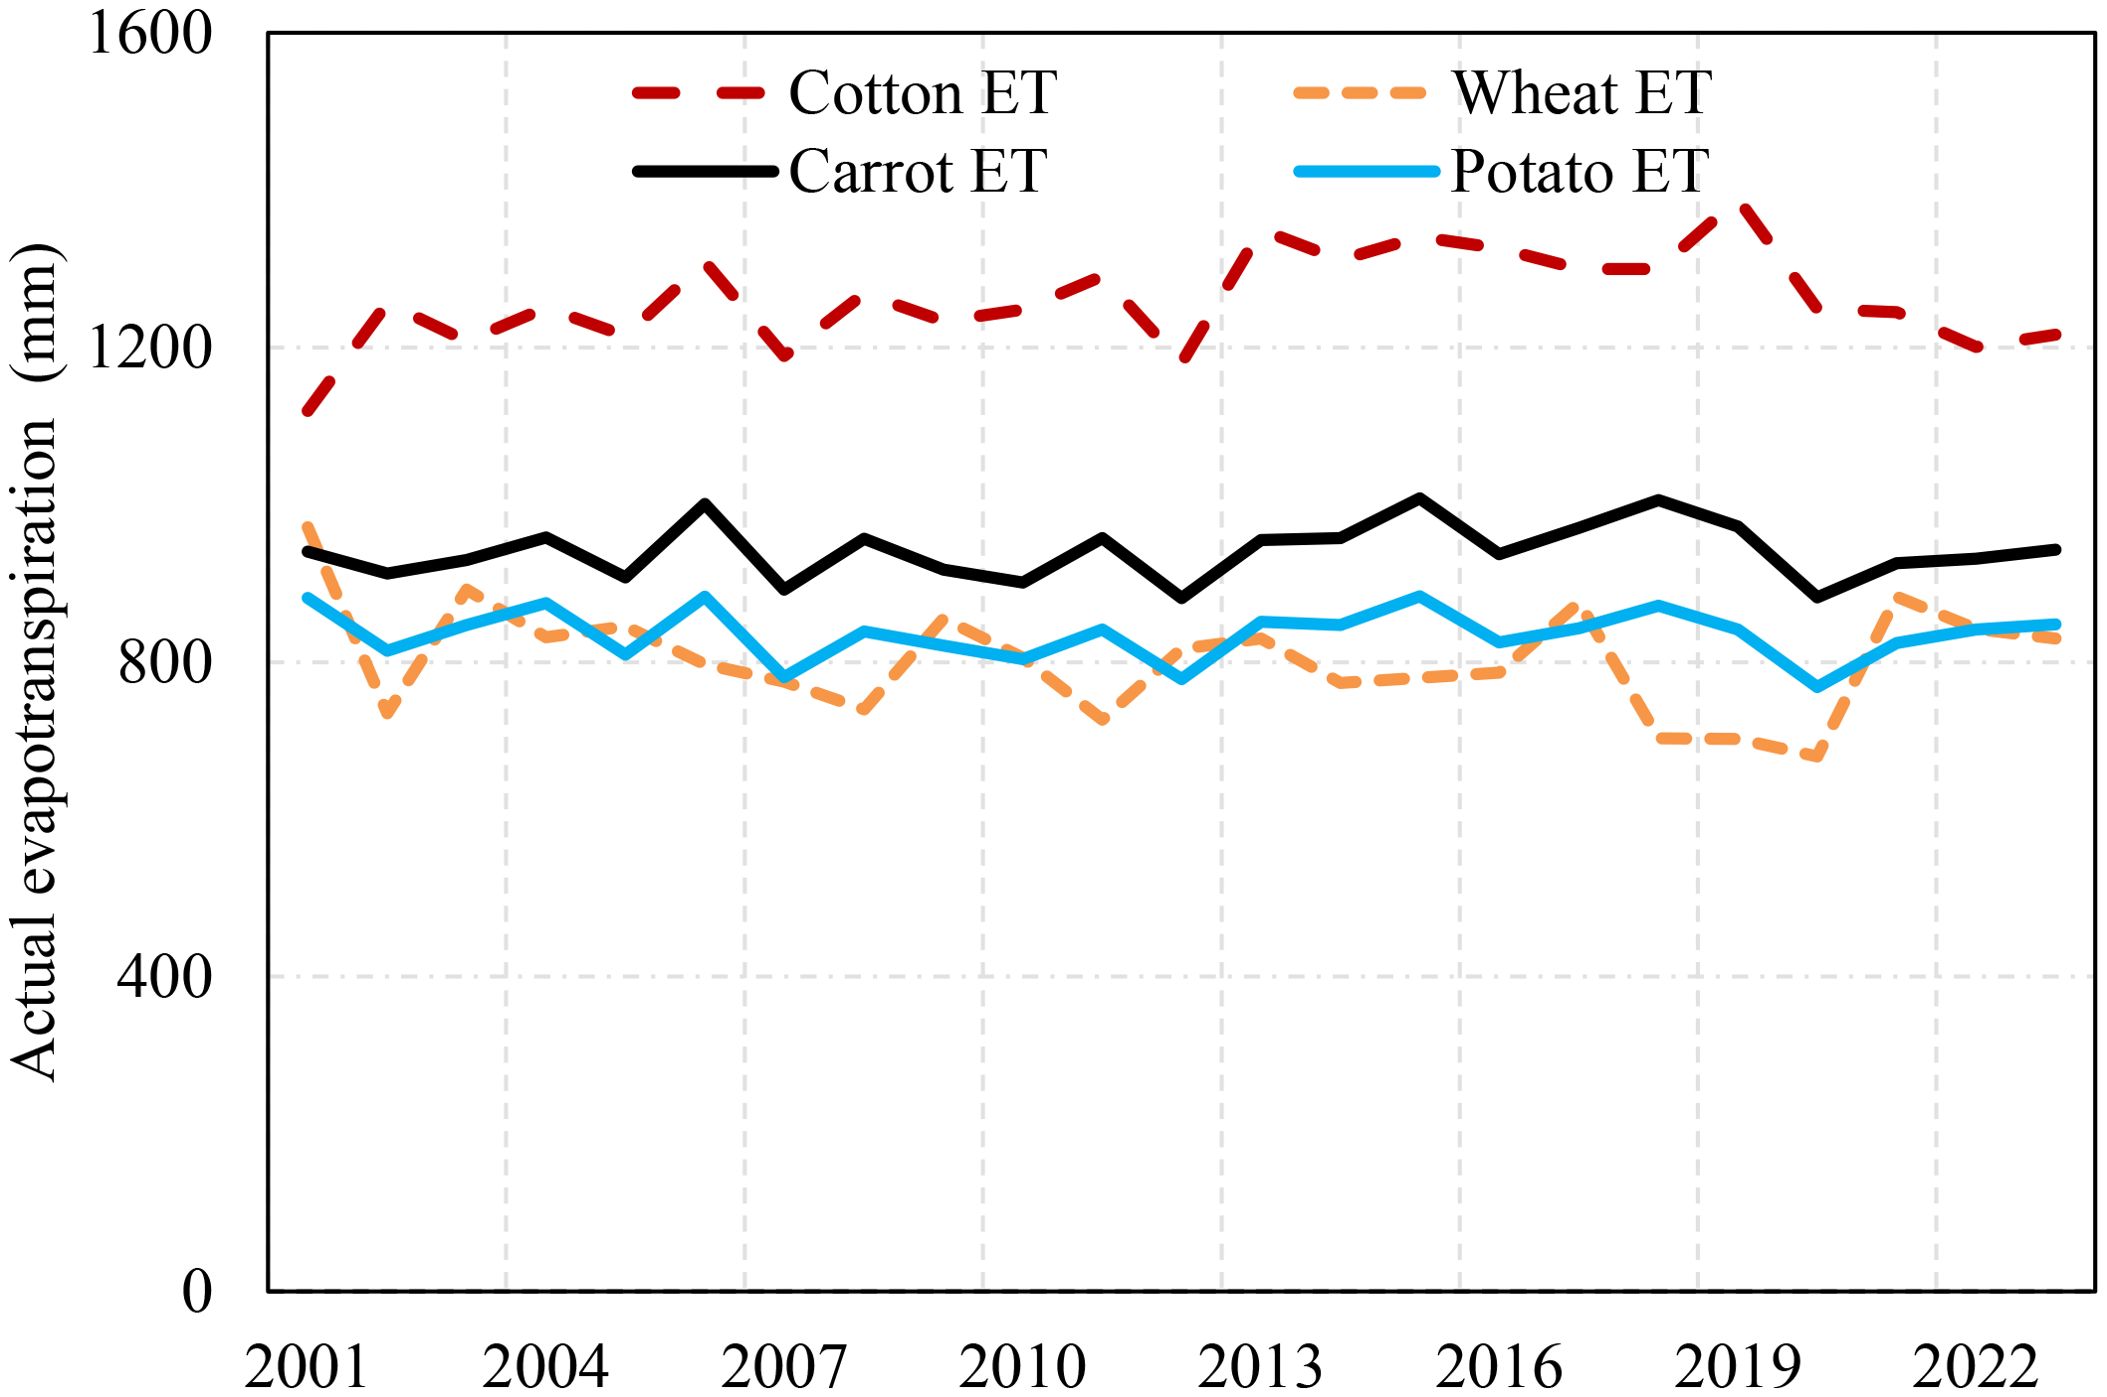
Figure 9. Annual actual evapotranspiration for the simulated crops (2001 – 2023).
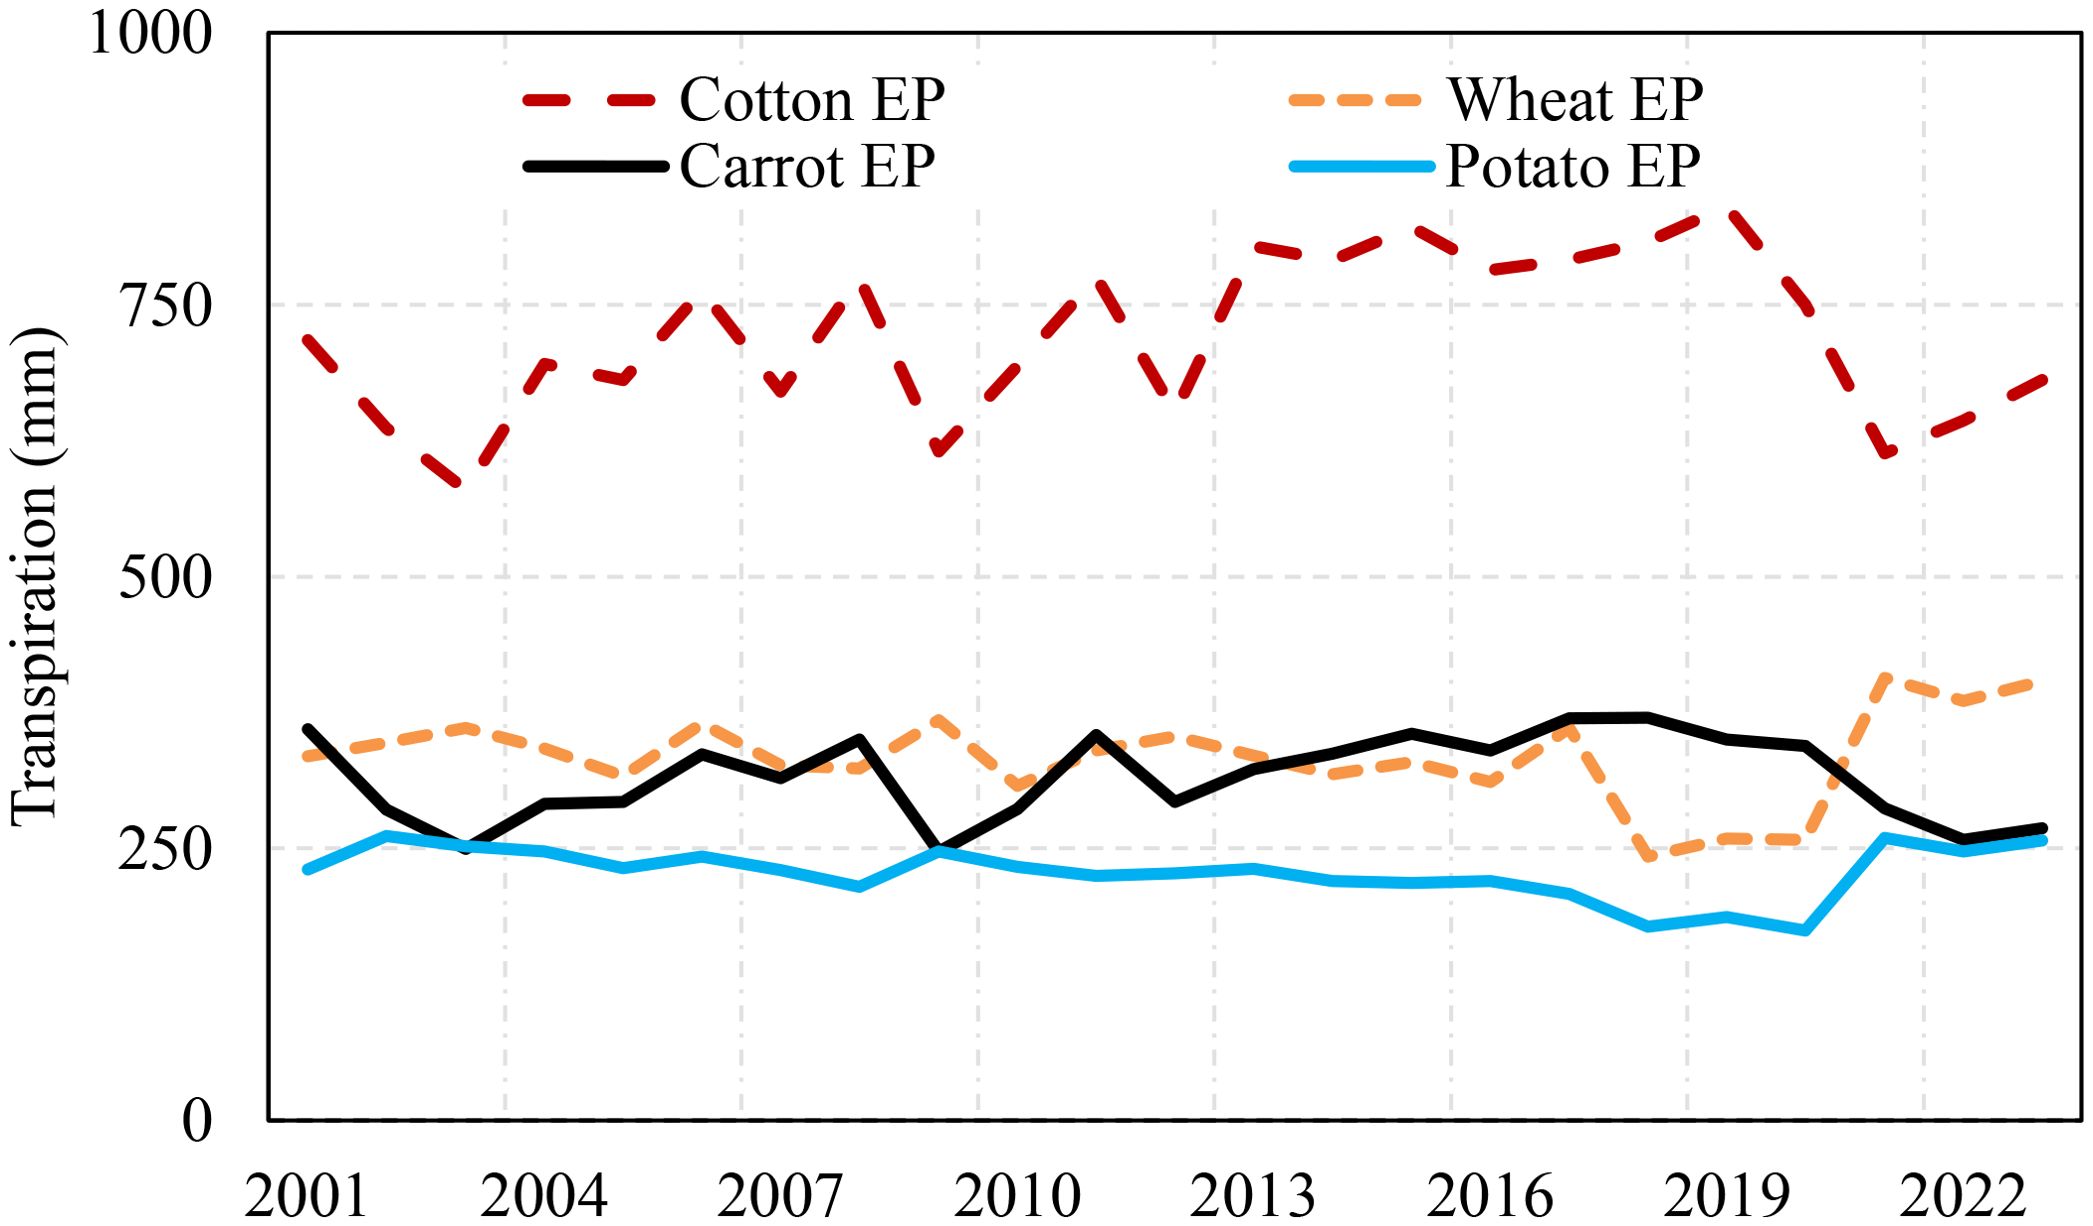
Figure 10. Annual transpiration for the simulated crops (2001 – 2023).
Although the grey water footprint was not explicitly quantified due to its limited practical application in Uzbekistan’s agricultural systems, we acknowledge its relevance in providing a complete picture of total water use. Studies in similar arid and semi-arid regions have shown that the grey water component often constitutes less than 5 to 10% of the total water footprint for major field crops, especially under low fertilizer application and limited leaching conditions (Mekonnen and Hoekstra, 2011; Termini, 2015). Therefore, its exclusion from the analysis is unlikely to affect the overall findings, though future research could benefit from more precise estimates as data availability improves.
The simulated actual evapotranspiration was partitioned into contributions from rainfall and irrigation. During the growing period, the plant’s irrigation and rainfall occurred a few times simultaneously, approximately 8%, 9%, 7%, and 4% during the growing period for carrots, potatoes, wheat, and cotton, respectively. The evapotranspiration components from rainfall and irrigation, which are green and blue water components, are shown in Figures 11, 12, respectively.
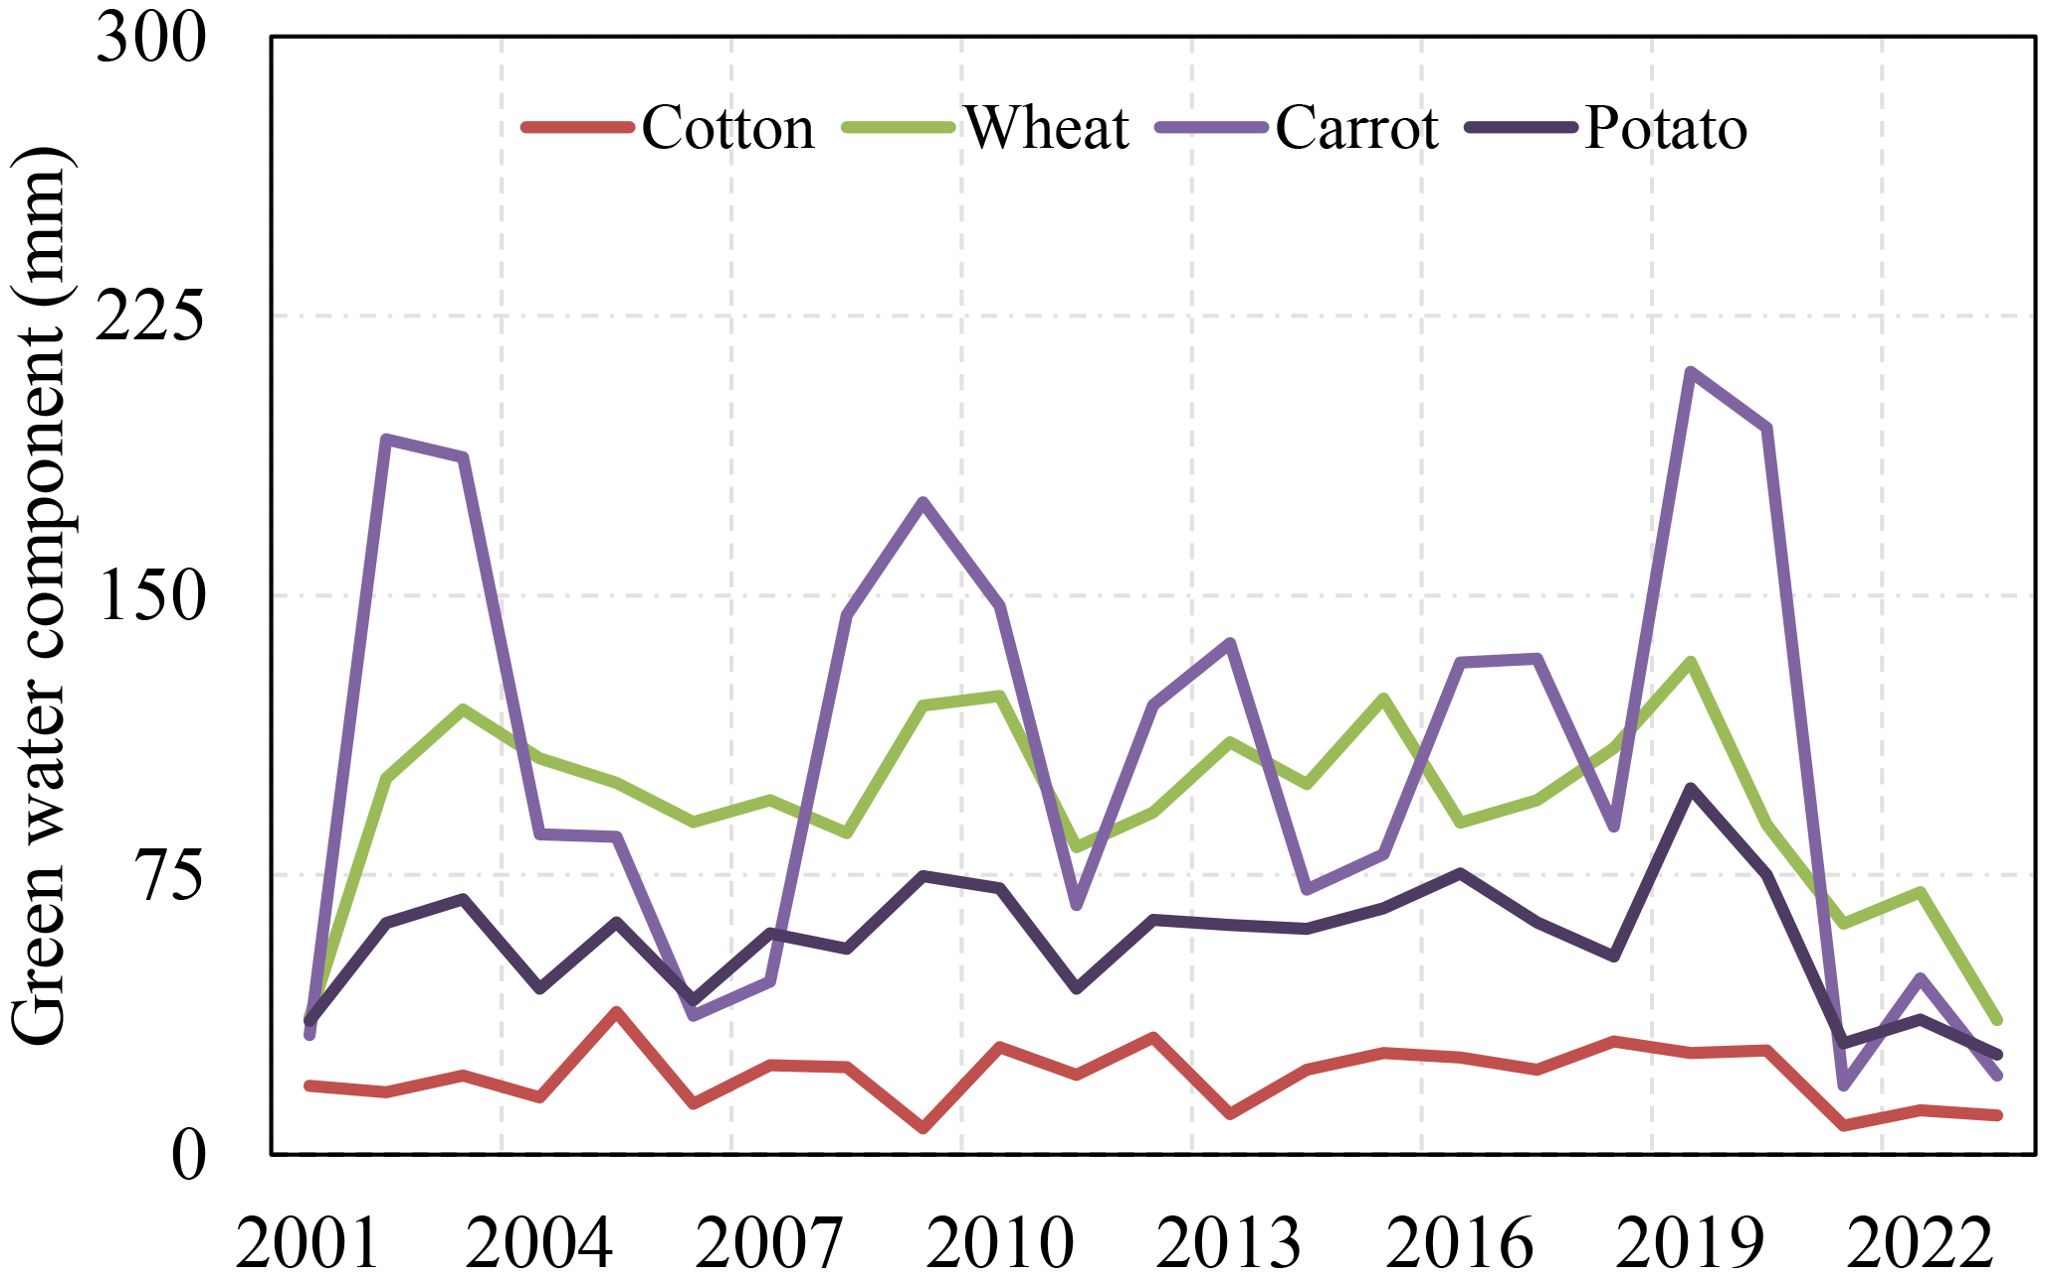
Figure 11. Annual evaporation contributed by rainfall (green water footprint, 2001 - 2023).
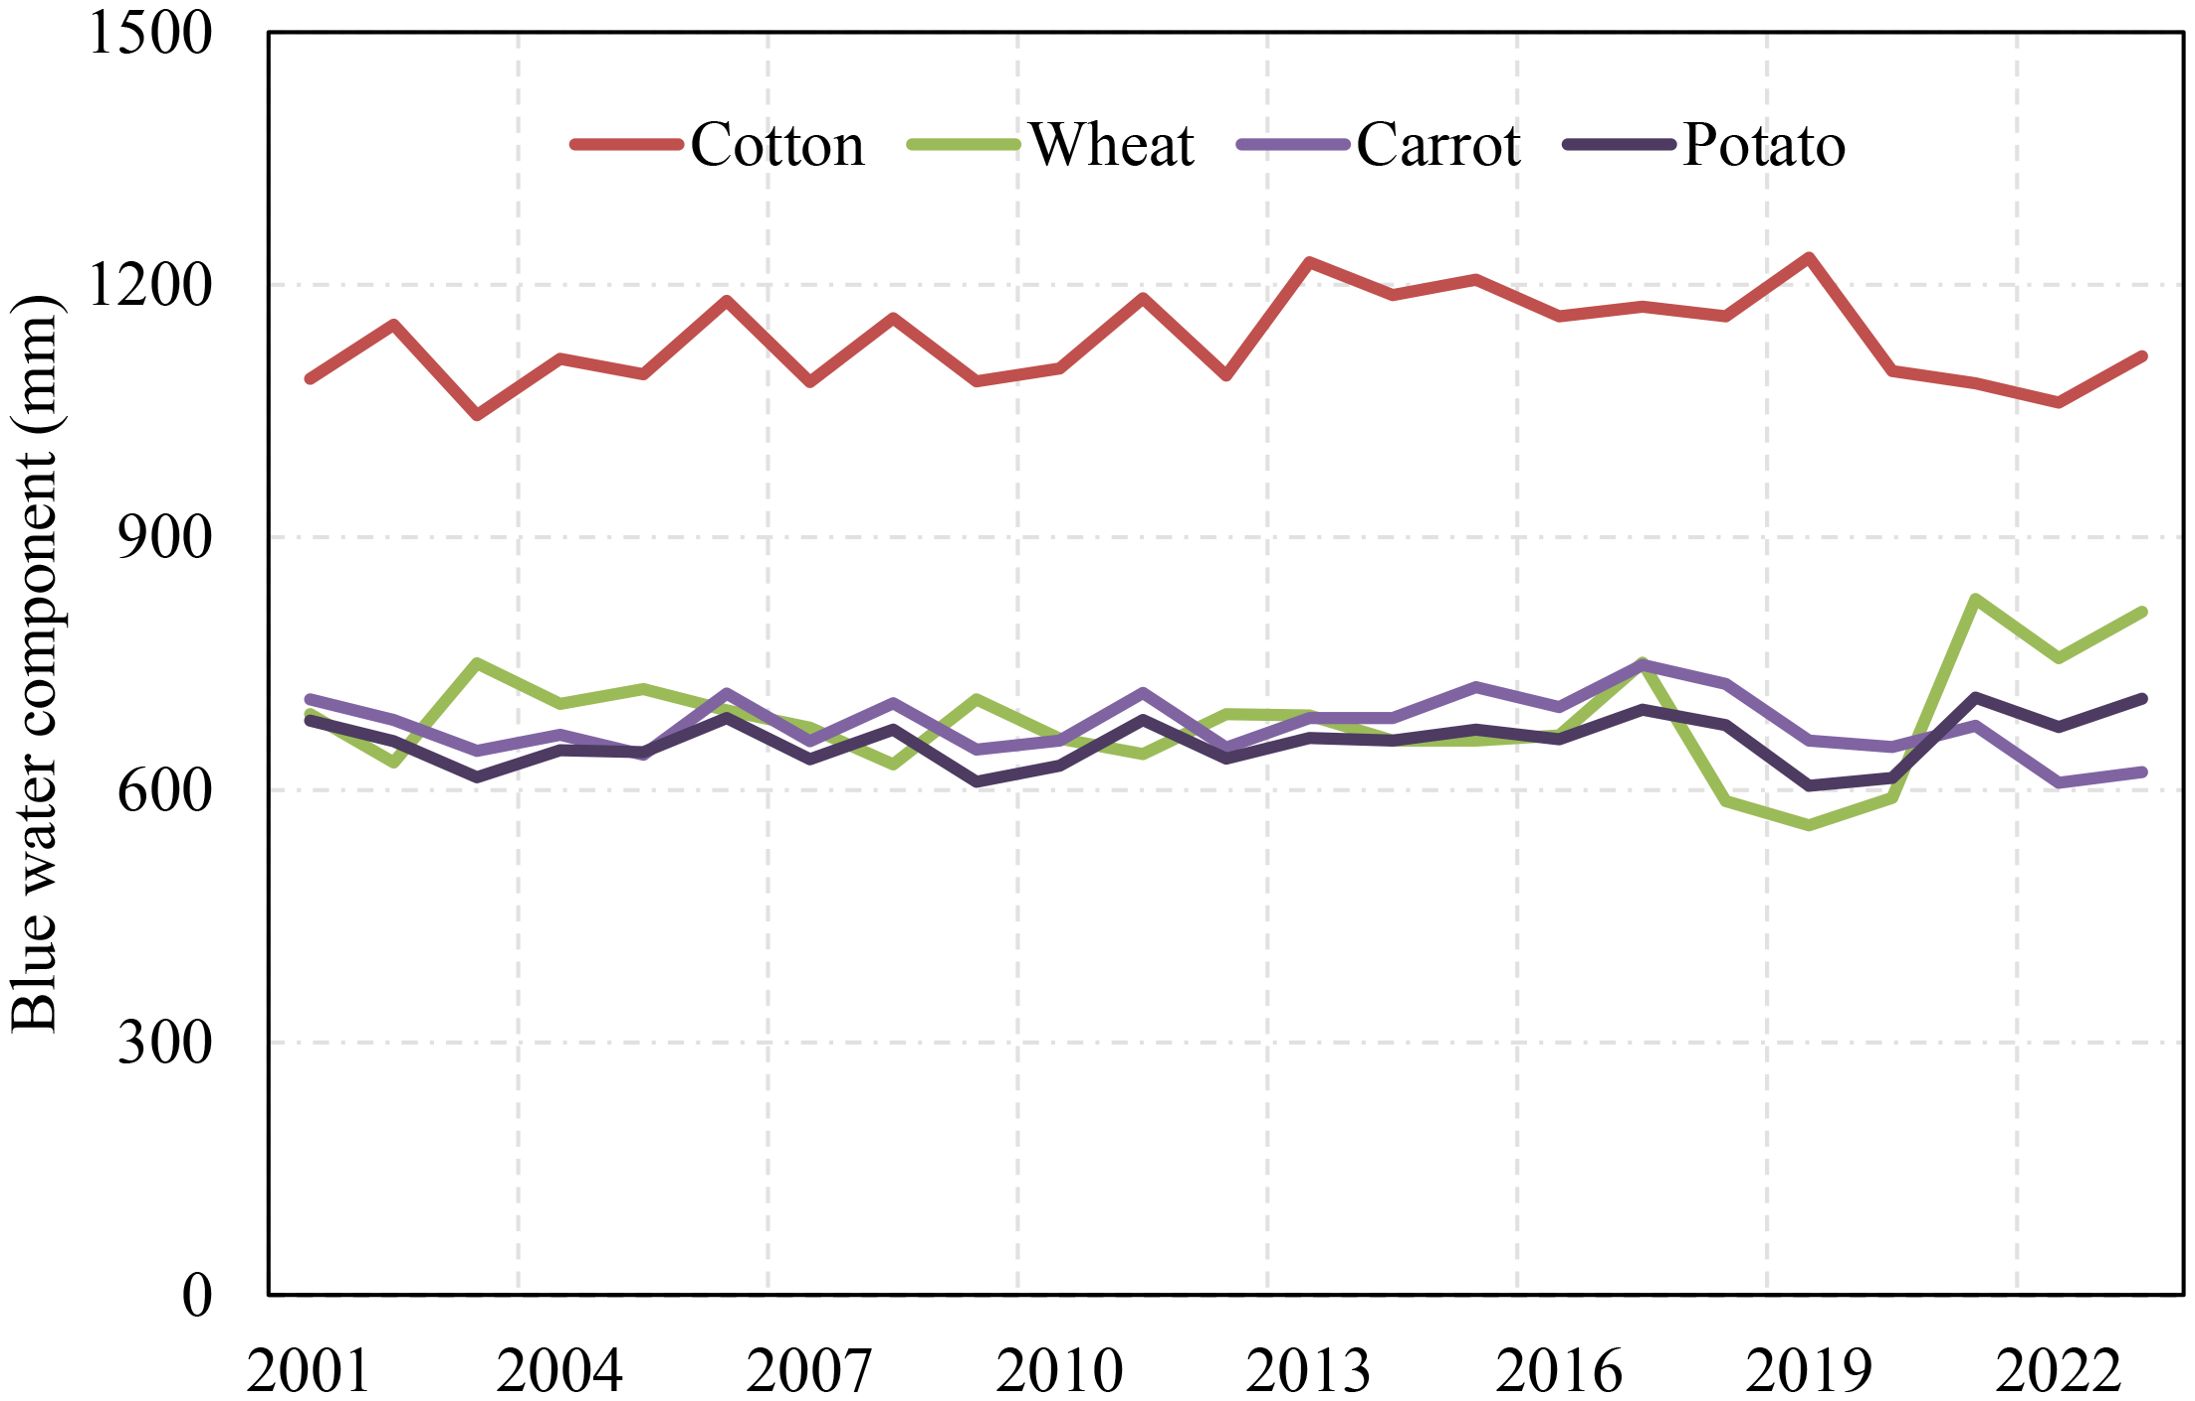
Figure 12. Annual evaporation contributed by irrigation (blue water footprint, 2001 – 2023).
The annual average green water contribution was found to be consistently lower than the blue water footprint across the simulated crops, primarily due to the region’s limited rainfall during the crop-growing seasons. Among the crops simulated, wheat exhibited the highest green water contribution (90 mm year-1), while cotton received the smallest (16 mm year-1). The trend of the green water contribution indicated a significant decline after 2019 across all simulated crops, partly due to a reduction in rainfall and changes in its seasonal distribution. This shift highlights the growing dependency on irrigation (blue water) to meet crop water requirements, further emphasizing the challenge posed by changing climatic conditions in maintaining a sustainable balance between green and blue water resources in agricultural systems.
Cotton consumed the most blue water among the selected crops, averaging at 1,140 mm year-1, nearly twice the simulated values for other crops such as wheat (690 mm year -1), carrot (620 mm year-1), and potato (640 mm year-1). This significant difference reveals cotton high irrigation requirements, particularly in regions with insufficient rainfall to meet crop water requirements.
The simulation results further revealed that, except for potatoes, the blue water consumption indicated an increasing trend over the study period. This trend suggests an intensifying reliance on irrigation, driven by declining rainfall and precipitation pattern shifts.
The boxplot in Figure 13 shows the blue and green water footprint of the cropping system, estimated by dividing the simulated green and blue water components during the growing period by the fresh yield (2001 – 2023). The result revealed that the green water footprint is a relatively minor component, accounting for only 2% to 16% of the total water consumed (Figure 13). Cotton exhibits the lowest green water footprint, as it predominantly grows during the dry period. The blue water footprint for potato and carrot was comparable, with an average value of 280 m3 t-1 and 310 m3 t-1, respectively. Meanwhile, cotton had the highest blue water footprint at 3,500 m3 t-1, followed by wheat at 1,400 t m-3.
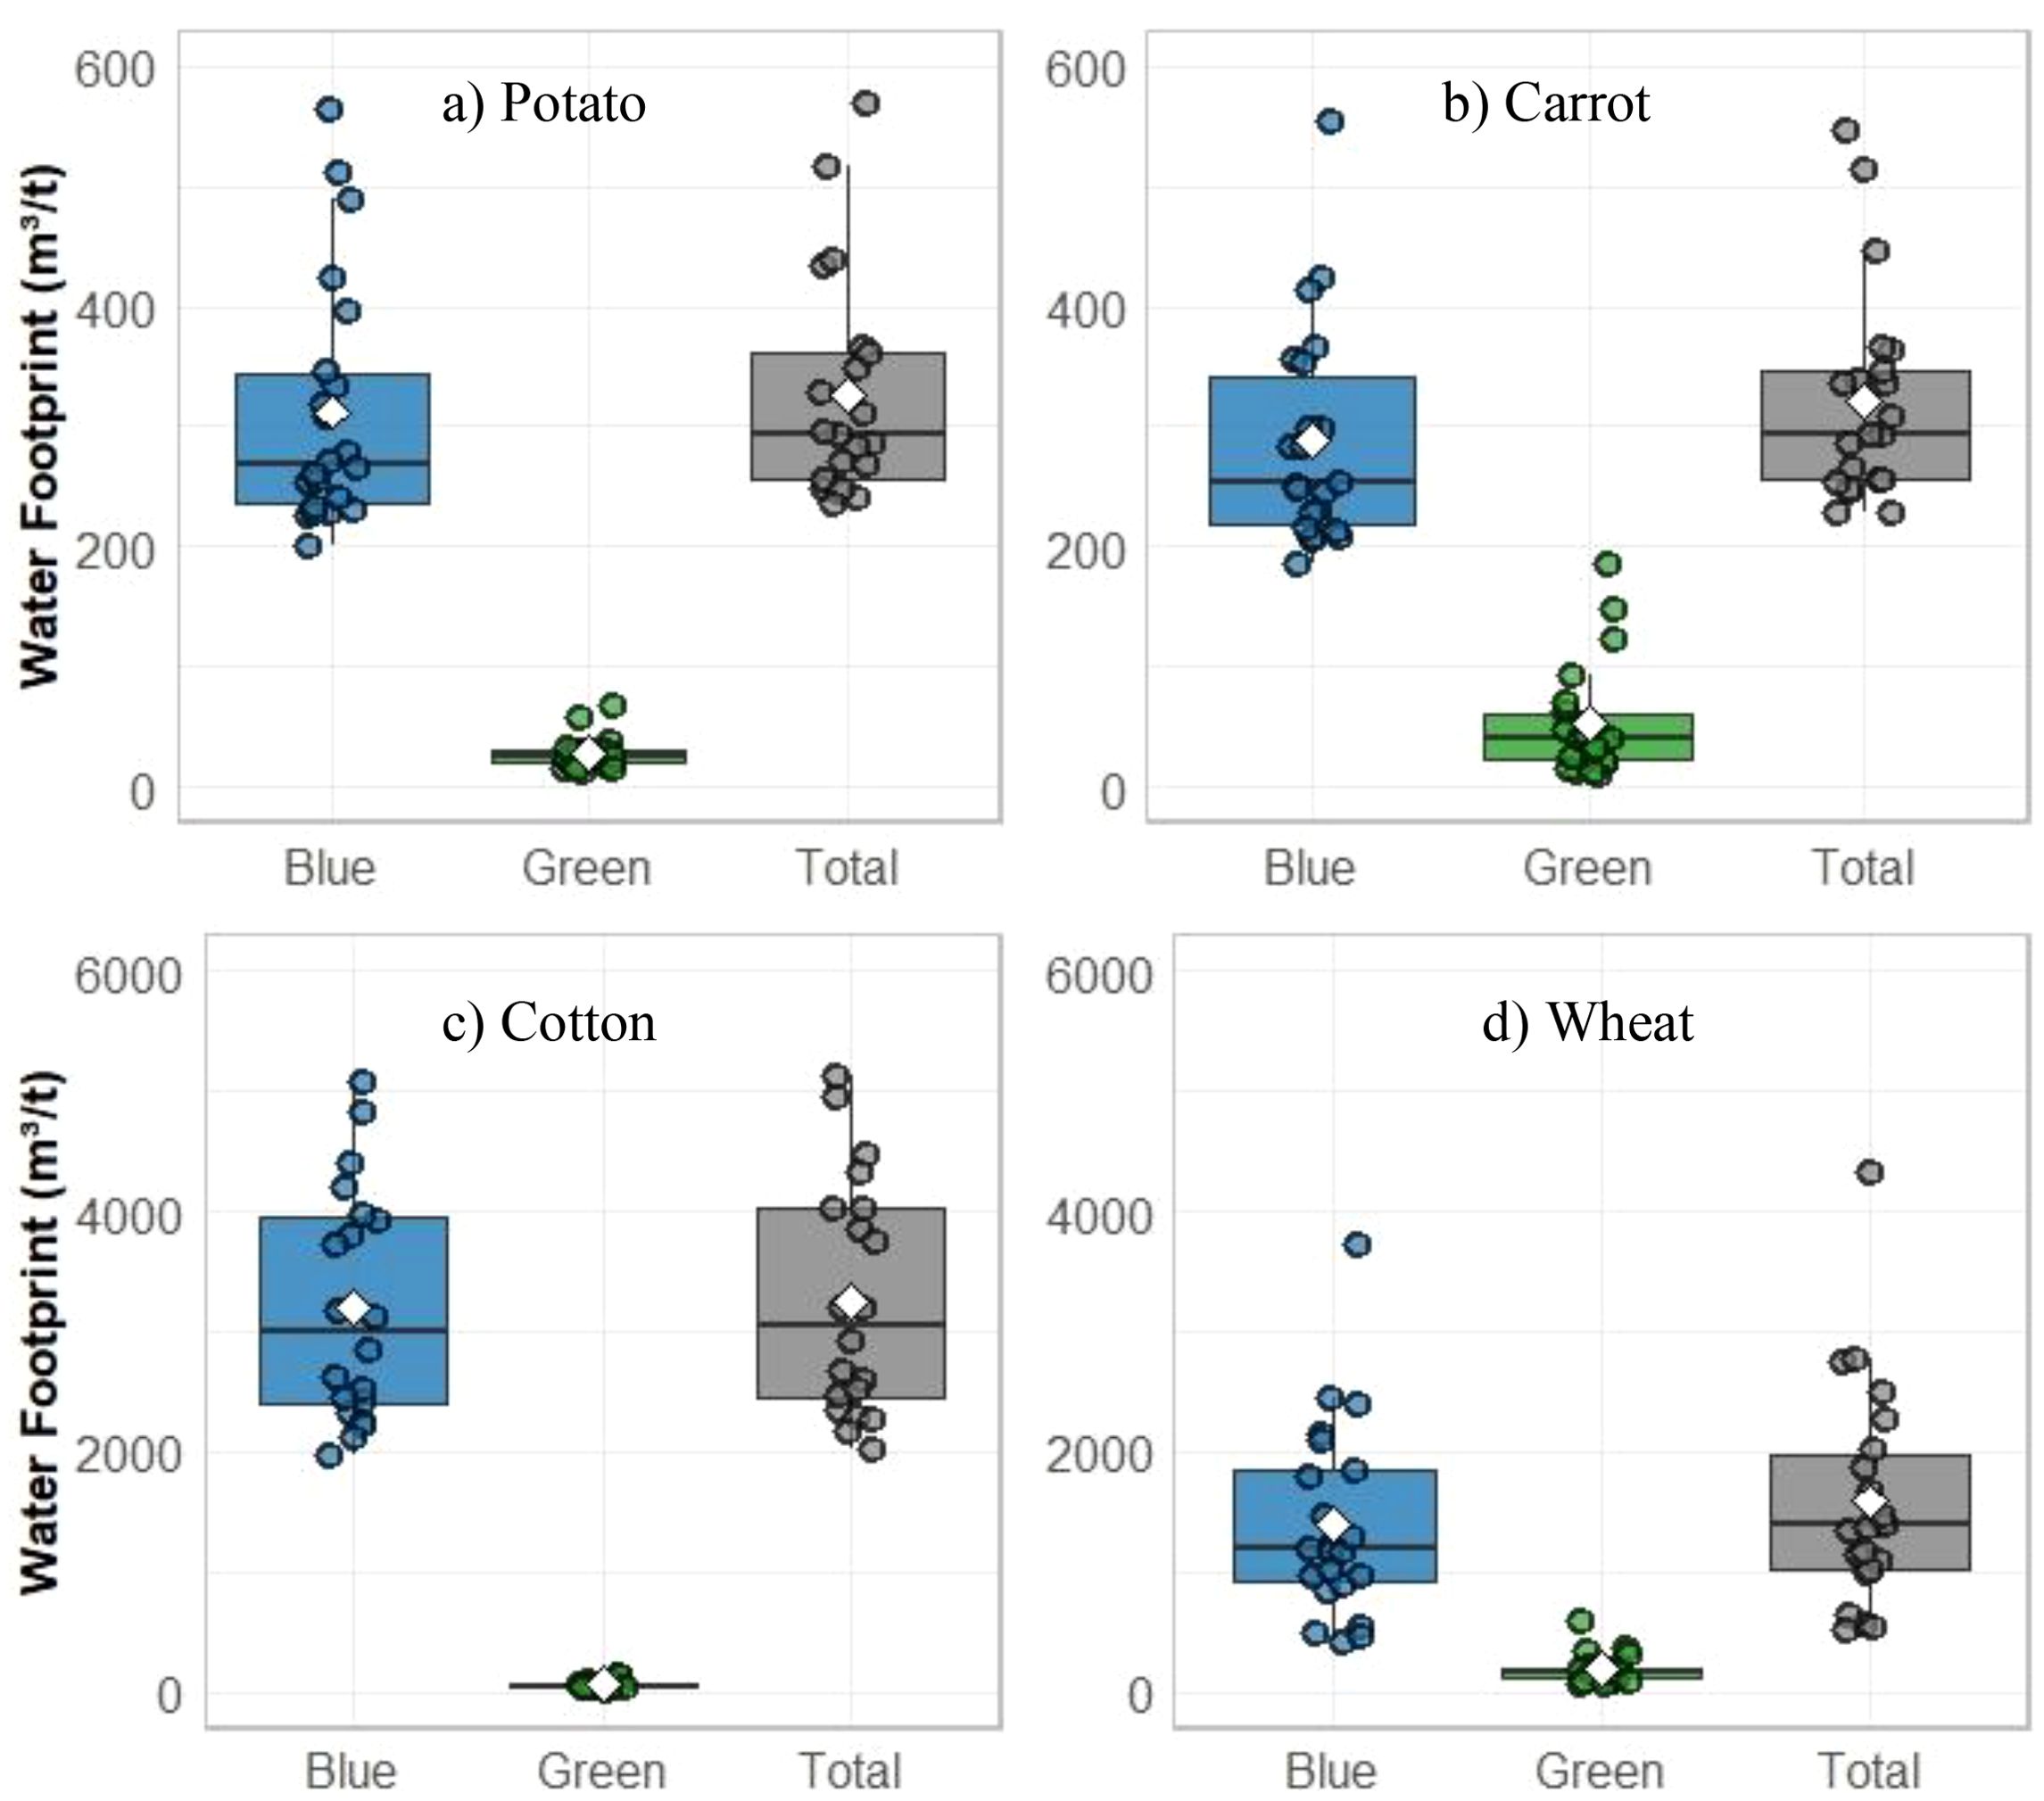
Figure 13. Boxplots of the blue, green, and total water footprint for selected crops from 2001 to 2023: (a) potato, (b) carrot, (c) cotton, and (d) wheat.
In terms of total water footprint, cotton is the largest water consumer, requiring 3,630 m3 of water per ton of production, followed by wheat (1,590 m3), potato (330 m3), and carrot (340 m3). A similar water footprint for carrot, ranging between 200 and 500 m3 t-1 was reported by Gallo et al. (2022); Al-Gaadi et al. (2022) and Mekonnen and Hoekstra (2011). Nosey (2017) and Chapagain et al. (2006) indicated that potato water footprint is approximately 300 m3 t-1. A range of water footprint values for wheat, ranging from 1,000 to 1,800 m3 t-1, was reported by (Chapagain and Orr, 2009), (Mekonnen and Hoekstra, 2010) and (Rockström et al., 2010).
Hence, the region faces significant water scarcity challenges due to climate change and the outdated irrigation infrastructure; it is necessary to improve irrigation efficiency for sustainable water management. This can be achieved by reducing soil evaporation and updating irrigation infrastructure across the region to improve water conveyance and application efficiency.
3.5 Socio-economic implications and trade-offs in crop water use
While the water footprint results highlight variation in water use across crops, these differences also point to important trade-offs and opportunities for sustainable water management. Cotton, while being the most water-intensive crop in the Chirakchi watershed, plays a vital economic role in Uzbekistan as a key export commodity and a major source of rural employment (Djanibekov et al., 2010; MacDonald, 2012). Reducing cotton cultivation could significantly lower water consumption, especially blue water use, thereby easing pressure on limited irrigation resources.
However, this transition poses substantial trade-offs. The cotton sector is closely tied to national economic strategies, farmer incomes, and agro-industrial chains, including ginning and textile manufacturing. Shifting away from cotton to less water-intensive crops like wheat or pulses may improve water-use efficiency but could result in lower economic returns, market instability, and livelihood risks for smallholder farmers, unless supported by strong policy frameworks and market incentives.
Moreover, state regulations and historical land use planning have reinforced cotton’s dominance, creating institutional constraints to diversification. Thus, any recommendation to alter crop composition must carefully balance water sustainability goals with economic viability and social acceptability. Future work integrating hydrological modeling with socio-economic analysis and stakeholder consultations is crucial to inform practical and scalable adaptation strategies.
3.6 Limitations and future research
Even though a detailed climate change impact assessment on the WFP is beyond the scope of this study, which focused on historical water footprint estimation using observed climate data, we recognize the importance of understanding potential future climate impacts on water resources and crop productivity in the Chirakchi Watershed and similar arid regions. Several studies have highlighted that climate change in Uzbekistan is expected to lead to increased temperatures, reduced water availability, and shifts in precipitation patterns, all of which could exacerbate irrigation demand and reduce crop yield (Hunink and Droogers, 2011; Hamidov et al., 2020; Rakhmatova et al., 2024). In particular, declining snowpack and glacier melt in upstream areas have been projected to significantly alter river flow regimes, further stressing water availability for agriculture in downstream basins like Chirakchi (Chub, 2000; Shahi et al., 2024). These findings emphasize the need for future studies to build upon this work by incorporating downscaled climate projections to evaluate the resilience of current agricultural systems under future climate scenarios. Future research should build upon this baseline by simulating water footprint responses under projected climate conditions to support more resilient agricultural water management and policy planning.
We would also like to acknowledge some of the limitations of this study, including the limited availability of crop yield data, uncertainty in input data such as land use, soil properties, and rainfall products. The availability of a few years crop yield data posed a limitation to this study, which restricts the model’s ability to capture interannual variability in crop yield performance. Future studies should consider using multiple years of crop yield data to enhance the accuracy of blue and green water consumption estimation across the selected crops and projected climate data. Considering multiple years of observed crop yield for model calibration and validation would provide more in-depth insight into the variability of blue and green water consumption.
4 Conclusions
This study highlights the crucial role of integrating satellite-observed data and biophysical models in assessing the green and blue water footprints of a cropping system in Uzbekistan. The study integrated the SWAT and APEX models to estimate the spatial distribution of water balance components and estimate the water footprint of selected crops.
As a typical of semi-arid regions, like Chirakchi district in Kashkadarya, Uzbekistan, evapotranspiration was the major component of the water balance, accounting for ~58% of the annual rainfall, followed by runoff, representing 26% of the annual rainfall, and 6.5% of the annual rainfall contributing to the groundwater flow. The dominance of evapotranspiration in the water balance, where water is lost through the atmosphere, exceeds contributions to surface and subsurface flows, underscoring the importance of improving irrigation efficiency and adopting crop types with lower ET demand to enhance water productivity. Additionally, the relatively small groundwater contribution suggests limited recharge, which could have implications for the sustainability of groundwater-dependent irrigation.
The results indicated that, among the selected crops, cotton exhibits an extensive water demand and plays a significant role in water consumption, followed by wheat, carrots, and potatoes. Carrot and potato, though less water-intensive overall, also demonstrated considerable soil evaporation losses, particularly for carrot, due to their lower leaf area index. With a decreasing trend in rainfall and shifting seasonal patterns, the region’s agricultural practice is increasingly dependent on irrigation. The study’s findings underscore the need for sustainable water management practices that improve water use efficiency, balance green and blue water resources, and adapt to the changing climate to ensure food security and environmental sustainability in the Chirakchi Watershed and beyond.
To improve water productivity, we recommend that farmers adopt more water-efficient irrigation techniques, such as drip irrigation, which minimizes water wastage and ensures crops receive the optimal amount of water. Implementing soil conservation practices, such as mulching and contour farming, can also enhance water retention in the soil, ultimately improving water productivity. Additionally, the promotion of drought-resistant crop varieties and improved agronomic practices can further mitigate water demand. To address the challenges posed by climate change (Hunink and Droogers, 2011; Hamidov et al., 2020; Rakhmatova et al., 2024), it is essential to integrate climate-smart agricultural strategies, such as optimizing planting dates and using weather forecasting tools for better water management. Implementing policies that incentivize the efficient use of water resources and investing in the development of sustainable irrigation systems will be crucial for enhancing water productivity and mitigating the impacts of climate change.
Data availability statement
The raw data supporting the conclusions of this article will be made available by the authors, without undue reservation.
Author contributions
AW: Conceptualization, Data curation, Formal analysis, Investigation, Methodology, Project administration, Resources, Validation, Visualization, Writing – original draft, Writing – review & editing. AA: Conceptualization, Funding acquisition, Project administration, Investigation, Writing – review & editing. ZG: Methodology, Investigation, Writing – review & editing.
Funding
The author(s) declare financial support was received for the research and/or publication of this article. This work was carried out under the CGIAR Initiative on Nexus Gains. Open access fee was supported by the CGIAR Policy Innovations Program.
Acknowledgments
We thank all funders who supported this research through their contributions to the CGIAR Trust Fund (www.cgiar.org/funders).
Conflict of interest
The authors declare that the research was conducted in the absence of any commercial or financial relationships that could be construed as a potential conflict of interest.
Generative AI statement
The author(s) declare that no Generative AI was used in the creation of this manuscript.
Publisher’s note
All claims expressed in this article are solely those of the authors and do not necessarily represent those of their affiliated organizations, or those of the publisher, the editors and the reviewers. Any product that may be evaluated in this article, or claim that may be made by its manufacturer, is not guaranteed or endorsed by the publisher.
References
Ahmadzadeh H., Morid S., Delavar M., and Srinivasan R. (2016). Using the SWAT model to assess the impacts of changing irrigation from surface to pressurized systems on water productivity and water saving in the Zarrineh Rud catchment. Agric. Water Manage. 175, 15–28. doi: 10.1016/j.agwat.2015.10.026
Al-Gaadi K. A., Madugundu R., Tola E., El-Hendawy S., and Marey S. (2022). Satellite-based determination of the water footprint of carrots and onions grown in the arid climate of Saudi Arabia. Remote Sens. 14, 5962. doi: 10.3390/rs14235962
Aminova M. and Abdullayev I. (2009). Water management in a state-centered environment: water governance analysis of Uzbekistan. Sustainability 1, 1240–1265. doi: 10.3390/su1041240
Ashraf Vaghefi S., Abbaspour K. C., Faramarzi M., Srinivasan R., and Arnold J. G. (2017). Modeling crop water productivity using a coupled SWAT–MODSIM model. Water. 9(3), 157. doi: 10.3390/w9030157
Carvalho D. F. D., Gomes D. P., Oliveira D. H. D., Guerra J. G., Rouws J. R., and Oliveira F. L. D. (2018). Carrot yield and water-use efficiency under different mulching, organic fertilization and irrigation levels. Rev. Bras. engenharia agricola e ambiental 22, 445–450. doi: 10.1590/1807-1929/agriambi.v22n7p445-450
Chapagain A. K., Hoekstra A. Y., Savenije H. H., and Gautam R. (2006). The water footprint of cotton consumption: An assessment of the impact of worldwide consumption of cotton products on the water resources in the cotton producing countries. Ecol. economics 60, 186–203. doi: 10.1016/j.ecolecon.2005.11.027
Chapagain A. and Orr S. (2009). An improved water footprint methodology linking global consumption to local water resources: A case of Spanish tomatoes. J. Environ. Manage. 90, 1219–1228. doi: 10.1016/j.jenvman.2008.06.006
Chub V. (2000). Climate change and its impact on natural resources potential of the Republic of Uzbekistan (Russian: Main Administration on Hydrometeorology under the Cabinet of Ministers of …).
Dile Y. T. and Srinivasan R. (2014). Evaluation of CFSR climate data for hydrologic prediction in data-scarce watersheds: an application in the Blue Nile River Basin. JAWRA J. Am. Water Resour. Assoc. 50, 1226–1241. doi: 10.1111/jawr.12182
Djanibekov N., Rudenko I., Lamers J., and Bobojonov I. (2010). Pros and cons of cotton production in Uzbekistan. In Pinstrup‑Andersen P.. (Ed.), Food Policy for Developing Countries: The Role of Government in the Global Food System (Case Study #7‑9). Ithaca, NY: Cornell University Press. Available at: https://ecommons.cornell.edu/handle/1813/55674.
Djumaboev K., Hamidov A., Anarbekov O., Gafurov Z., and Tussupova K. (2017). Impact of institutional change on irrigation management: A case study from southern Uzbekistan. Water 9, 419. doi: 10.3390/w9060419
Earls J. and Dixon B. (2008). A comparison of SWAT model-predicted potential evapotranspiration using real and modeled meteorological data. Vadose Zone J. 7, 570–580. doi: 10.2136/vzj2007.0012
Ercin A. E. and Hoekstra A. Y. (2014). Water footprint scenarios for 2050: A global analysis. Environ. Int. 64, 71–82. doi: 10.1016/j.envint.2013.11.019
Farr T. G., Rosen P. A., Caro E., Crippen R., Duren R., Hensley S., et al. (2007). The shuttle radar topography mission. Rev. geophysics 45(2), RG2004. doi: 10.1029/2005RG000183
Funk C., Peterson P., Landsfeld M., Pedreros D., Verdin J., Shukla S., et al. (2015). The climate hazards infrared precipitation with stations—a new environmental record for monitoring extremes. Sci. Data 2, 1–21. doi: 10.1038/sdata.2015.66
Gallo I., Landro N., La Grassa R., and Turconi A. (2022). Food recommendations for reducing water footprint. Sustainability 14, 3833. doi: 10.3390/su14073833
Gleick P. H. (2000). A look at twenty-first century water resources development. Water Int. 25, 127–138. doi: 10.1080/02508060008686804
Gulakhmadov M., Chen X., Gulakhmadov A., Umar Nadeem M., Gulahmadov N., and Liu T. (2023). Multiscale evaluation of gridded precipitation datasets across varied elevation zones in central Asia’s Hilly region. Remote Sens. 15, 4990. doi: 10.3390/rs15204990
Gupta D., Gujre N., Singha S., and Mitra S. (2022). Role of existing and emerging technologies in advancing climate-smart agriculture through modeling: A review. Ecol. Inf. 71, 101805. doi: 10.1016/j.ecoinf.2022.101805
Hamidov A., Khamidov M., and Ishchanov J. (2020). Impact of climate change on groundwater management in the northwestern part of Uzbekistan. Agronomy 10, 1173. doi: 10.3390/agronomy10081173
Hoekstra A. Y., Chapagain A. K., Aldaya M. M., and Mekonnen M. M. (2011). The water footprint assessment manual: Setting the global standard (London, UK: Earthscan, Routledge).
Hoekstra A. Y., Chapagain A., Martinez-Aldaya M., and Mekonnen M. (2009). Water footprint manual: State of the art 2009. Enschede, the Netherlands: Water Footprint Network. 127.
Hoekstra A. Y. and Hung P. Q. (2003). “Virtual water trade,” in Proceedings of the international expert meeting on virtual water trade, 1–244. Delft, The Netherlands: UNESCO-IHE Institute for Water Education.
Hoekstra A. Y. and Mekonnen M. M. (2012). The water footprint of humanity. Proc. Natl. Acad. Sci. 109, 3232–3237. doi: 10.1073/pnas.1109936109
Hunink J. and Droogers P. (2011). “Climate change impact assessment on crop production in Uzbekistan,” in World Bank Study on Reducing Vulnerability to Climate Change in Europe and Central Asia (ECA) Agricultural Systems, vol. 106. (Wageningen, The Netherlands: Report FutureWater).
Jiang L., Wu Y., Wang J., Wang Z., and Jiang Q. (2023). Scenario simulation and comprehensive assessment of water footprint sustainability system in Heilongjiang Province, China: A model combining system dynamics with improved radar chart approach. Ecol. Indic. 154, 110527. doi: 10.1016/j.ecolind.2023.110527
Jung C.-G., Lee D.-R., and Moon J.-W. (2016). Comparison of the Penman-Monteith method and regional calibration of the Hargreaves equation for actual evapotranspiration using SWAT-simulated results in the Seolma-cheon basin, South Korea. Hydrological Sci. J. 61, 793–800. doi: 10.1080/02626667.2014.943231
Karra K., Kontgis C., Statman-Weil Z., Mazzariello J. C., Mathis M., and Brumby S. P. (2021) “Global land use/land cover with Sentinel 2 and deep learning,” in 2021 IEEE international geoscience and remote sensing symposium IGARSS: IEEE. 4704–4707. doi: 10.1109/IGARSS47720.2021.9553495
Lawrence D. M., Thornton P. E., Oleson K. W., and Bonan G. B. (2007). The partitioning of evapotranspiration into transpiration, soil evaporation, and canopy evaporation in a GCM: Impacts on land–atmosphere interaction. J. Hydrometeorology 8, 862–880. doi: 10.1175/JHM596.1
Li S., Wang Z., Li S., Gao Y., and Tian X. (2013). Effect of plastic sheet mulch, wheat straw mulch, and maize growth on water loss by evaporation in dryland areas of China. Agric. Water Manage. 116, 39–49. doi: 10.1016/j.agwat.2012.10.004
Luan X., Wu P., Sun S., Wang Y., and Gao X. (2018). Quantitative study of the crop production water footprint using the SWAT model. Ecol. Indic. 89, 1–10. doi: 10.1016/j.ecolind.2018.01.046
Mabhaudhi T., Dirwai T. L., Taguta C., Sikka A., and Lautze J. (2023). Mapping Decision Support Tools (DSTs) on agricultural water productivity: A global systematic scoping review. Agric. Water Manage. 290, 108590. doi: 10.1016/j.agwat.2023.108590
Martínez-Alcalá I., Pellicer-Martínez F., and Fernández-López C. (2018). Pharmaceutical grey water footprint: Accounting, influence of wastewater treatment plants and implications of the reuse. Water Res. 135, 278–287. doi: 10.1016/j.watres.2018.02.033
Mekonnen M. M. and Hoekstra A. Y. (2010). A global and high-resolution assessment of the green, blue and grey water footprint of wheat. Hydrology Earth system Sci. 14, 1259–1276. doi: 10.5194/hess-14-1259-2010
Mekonnen M. M. and Hoekstra A. Y. (2011). The green, blue and grey water footprint of crops and derived crop products. Hydrology Earth system Sci. 15, 1577–1600. doi: 10.5194/hess-15-1577-2011
Mekonnen M. M. and Hoekstra A. Y. (2015). Global gray water footprint and water pollution levels related to anthropogenic nitrogen loads to fresh water. Environ. Sci. Technol. 49, 12860–12868. doi: 10.1021/acs.est.5b03191
Moriasi D. N., Arnold J. G., Van Liew M. W., Bingner R. L., Harmel R. D., and Veith T. L. (2007). Model evaluation guidelines for systematic quantification of accuracy in watershed simulations. Trans. ASABE 50, 885–900. doi: 10.13031/2013.23153
Mussatayev S., Muminov N., and Orynbayev Z. (2024). Water scarcity dynamics in central Asia: implications for regional stability. J. Cent. Asian Stud. 96, 20–31. doi: 10.52536/2788-5860
Nosey M. M. (2017). Estimation of the Volumetric Water Footprint of Carrot (Daucus Carota L.) and Swiss Chard (Beta Vulgaris L.) Grown in Gauteng Province, South Africa (South Africa: University of Pretoria (South Africa).
Peña-Guerrero M. D., Umirbekov A., Tarasova L., and Müller D. (2022). Comparing the performance of high-resolution global precipitation products across topographic and climatic gradients of Central Asia. International Journal of Climatology, 42(11), 5554–5569. doi: 10.1002/joc.7536
Rakhmatova N., Nishonov B. E., Kholmatjanov B. M., Rakhmatova V., Toderich K. N., Khasankhanova G. M., et al. (2024). Assessing the potential impacts of climate change on drought in Uzbekistan: findings from RCP and SSP scenarios. Atmosphere 15(7), 866. doi: 10.3390/atmos15070866
Rockström J., Karlberg L., Wani S. P., Barron J., Hatibu N., Oweis T., et al. (2010). Managing water in rainfed agriculture—The need for a paradigm shift. Agric. Water Manage. 97, 543–550. doi: 10.1016/j.agwat.2009.09.009
Rodda C., Birkel S., and Mayewski P. (2019). A 2000 year-long proxy and observational reconstruction of Central Asian climate. Quaternary Sci. Rev. 223, 105847. doi: 10.1016/j.quascirev.2019.07.029
Romaguera M., Hoekstra A. Y., Su Z., Krol M. S., and Salama M. S. (2010). Potential of using remote sensing techniques for global assessment of water footprint of crops. Remote Sens. 2, 1177–1196. doi: 10.3390/rs2041177
Shahi R., Lamichhane S., and Devkota N. (2024). Evaluating the dynamics of climate and anticipated snow cover changes on the hydrological response of rivers in the Hindu Kush Himalaya region. J. Water Climate Change 15, 4713–4730. doi: 10.2166/wcc.2024.279
Termini D. (2015). Fluvial eco-hydraulics and morphodynamics: New insights and challenges. Adv. Water Resour. 81, 1–3. doi: 10.1016/j.advwatres.2015.04.003
Tuyishimire A., Liu Y., Yin J., Kou L., Lin S., Lin J., et al. (2022). Drivers of the increasing water footprint in Africa: The food consumption perspective. Sci. Total Environ. 809, 152196. doi: 10.1016/j.scitotenv.2021.152196
Van Dijk M., Morley T., Jongeneel R., Van Ittersum M., Reidsma P., and Ruben R. (2017). Disentangling agronomic and economic yield gaps: An integrated framework and application. Agric. Syst. 154, 90–99. doi: 10.1016/j.agsy.2017.03.004
Veettil A. V. and Mishra A. (2020). Water security assessment for the contiguous United States using water footprint concepts. Geophysical Res. Lett. 47, e2020GL087061. doi: 10.1029/2020GL087061
Wieder W., Boehnert J., Bonan G., and Langseth M. (2014). Regridded harmonized world soil database v1. 2. ORNL DAAC. doi: 10.3334/ORNLDAAC/1247
Wolfe J., Jeong J., Paulk K., and Farley A. (2021). Agricultural and watershed modeling with EPIC, APEX, and SWAT: Computational tools for investigating, planning, and understanding the future. J. Environ. Sci. Sustain. Soc. 10, MR06_p23–MR06_p26. doi: 10.3107/jesss.10.MR06
Worqlul A. W., Dile Y. T., Bizimana J.-C., Jeong J., Gerik T. J., Srinivasan R., et al. (2018). Multi-dimensional evaluation of simulated small-scale irrigation intervention: A case study in Dimbasinia Watershed, Ghana. Sustainability 10, 1531. doi: 10.3390/su10051531
Worqlul A. W., Dile Y. T., Schmitter P., Jeong J., Meki M. N., Gerik T. J., et al. (2019). Water resource assessment, gaps, and constraints of vegetable production in Robit and Dangishta watersheds, Upper Blue Nile Basin, Ethiopia. Agric. Water Manage. 226, 105767. doi: 10.1016/j.agwat.2019.105767
Xiong J., Liang F., Yang X., Du T., Pacenka S., Steenhuis T. S., et al. (2022). Water footprint assessment of green and traditional cultivation of crops in the Huang-Huai-Hai Farming Region. Agronomy 12, 2494. doi: 10.3390/agronomy12102494
Yang C. and Cui X. (2014). Global changes and drivers of the water footprint of food consumption: A historical analysis. Water 6, 1435–1452. doi: 10.3390/w6051435
Keywords: water productivity, green water, blue water, SWAT model, APEX model, irrigation
Citation: Worqlul AW, Akramkhanov A and Gafurov Z (2025) Water footprints of irrigated crops in the Chirakchi Watershed, Uzbekistan. Front. Agron. 7:1595665. doi: 10.3389/fagro.2025.1595665
Received: 18 March 2025; Accepted: 22 July 2025;
Published: 03 September 2025.
Edited by:
Vaishali Sharda, Kansas State University, United StatesReviewed by:
Carina Almeida, Lusofona University, PortugalPantazis Georgiou, Aristotle University of Thessaloniki, Greece
Copyright © 2025 Worqlul, Akramkhanov and Gafurov. This is an open-access article distributed under the terms of the Creative Commons Attribution License (CC BY). The use, distribution or reproduction in other forums is permitted, provided the original author(s) and the copyright owner(s) are credited and that the original publication in this journal is cited, in accordance with accepted academic practice. No use, distribution or reproduction is permitted which does not comply with these terms.
*Correspondence: Abeyou W. Worqlul, YWJleW91X3dhbGVAeWFob28uY29t