 B. Gouthami1*
 D. S. Gurjar1P. S. Brahmanand1A. K. Tiwari2Mam Chand Singh3
 Subhash Babu4
 Shiv Prasad5
 Jitendra Rajput6
- 1Water Technology Centre, Indian Council of Agricultural Research (ICAR)- Indian Agricultural Research Institute, New Delhi, India
- 2Division of Floriculture and Landscaping, Indian Council of Agricultural Research (ICAR)-Indian Agricultural Research Institute, New Delhi, India
- 3Division of Floriculture and Landscaping - Centre for Protected Cultivation Technology (CPCT), Indian Council of Agricultural Research (ICAR)-Indian Agricultural Research Institute, New Delhi, India
- 4Division of Agronomy, Indian Council of Agricultural Research (ICAR)- Indian Agricultural Research Institute, New Delhi, India
- 5Division of Environment Science, Indian Council of Agricultural Research (ICAR)- Indian Agricultural Research Institute, New Delhi, India
- 6Division of Agricultural Engineering, Indian Council of Agricultural Research (ICAR)- Indian Agricultural Research Institute, New Delhi, India
Understanding the effects of irrigation levels and nutrient levels on crop production is crucial for the advancement of sustainable agriculture, encompassing crop growth management, soil health preservation, and the strategic use of the input resources. Therefore, this study assessed the impact of different irrigation and fertigation management practices on yield, water use efficiency (WUE), and economic feasibility of chrysanthemum (Chrysanthemum morifolium Ramat.) cultivars. The field experiments were carried out during the rabi seasons of 2023–24 and 2024–25 at the Precision Farming Development Centre (PFDC), Water Technology Centre, ICAR-Indian Agricultural Research Institute, New Delhi. A split-split plot design was adopted, incorporating three experimental factors: two chrysanthemum cultivars (Autumn Pink and Autumn White), three irrigation regimes (0.5 Epan, 0.75 Epan, and 1.0 Epan), and three fertigation levels (50%, 75%, and 100% of the recommended fertilizer dose). The results revealed that the Autumn White cultivar consistently outperformed Autumn Pink cultivar in terms of flower yield, WUE, and economic returns. Among different irrigation regimes, the highest WUE was observed in 0.75 Epan irrigation level treatment. Similarly, the highest fertigation level (100% RDF) produced the best results in terms of yield and economic benefits. Economic analysis showed that the treatment combination V2I2F3 (Autumn White + Irrigation at 0.75 Epan + 100% RDF) consistently achieved the higher gross returns, net returns, and profitability across both years and pooled data. This study concludes that optimizing irrigation and fertigation strategies, particularly for commercial chrysanthemum cultivars, can significantly improve profitability and sustainability, especially in water-scarce regions.
Introduction
As global warming intensifies and water scarcity becomes an increasing concern, the interaction between soil and water in agricultural systems plays a crucial role in sustaining crop growth, maintaining soil health, and enhancing ecosystem resilience (Mba et al., 2025). Effective management of irrigation, fertilizers, and crop rotation is essential to adapting to these challenges (Yang et al., 2020). In both global and national agricultural landscapes, farmers, alongside state and federal agricultural and water resource agencies, must adopt climate-smart and integrated conservation practices for improving the agriculture sustainability. These strategies are designed to maintain agricultural productivity while optimizing water and nutrient use, enhancing economic efficiency, minimizing environmental and social impacts, and safeguarding the long-term quality and productivity of land and water resources (Sassenrath et al., 2009).
India’s floriculture industry is rapidly evolving, with flower crops accounting a significant share of the country’s total agricultural output. This sector has experienced remarkable growth, covering approximately 339 thousand hectares under floriculture. In 2019-2020, the total export of floriculture products reached 16,949.37 MT, valued at Rs. 541.61 crore (US $75.89 million) (Yeptho et al., 2021).The primary importers of Indian floriculture products include the United States of America, the Netherland, Germany, the United Kingdom, and the United Arab Emirates (Anonymous, 2019). Chrysanthemum (Chrysanthemum morifolium Ramat.), a crucial commercial flower crop in India and worldwide, is native to the Northern Hemisphere, primarily Europe and Asia, belongs to Asteraceae family and often referred to as the “Queen of the East” (Kaushal and Bala, 2018). Its flowers are prized for their longevity, diverse colors, and varied forms, making them suitable for floral arrangements, bouquets, and decorations. In India, chrysanthemum is the second most important flower crop after roses. Karnataka is the leading chrysanthemum-producing Indian state, covering 5,453 hectares of land and yielding 59.54 thousand tons of loose flowers in 2017-18, followed by Tamil Nadu (Kumar et al., 2021). Chrysanthemums accounted for approximately 12–15% of the global cut flower trade market, making them the second most traded flower after rose, which held a dominant share of around 45–50% (Ornamental Chrysanthemum Market Report, 2024).
Chrysanthemum is widely favored for its beauty, color diversity, size, shape, and keeping quality. Its ease of propagation has increased its popularity among consumers and commercial growers (Bisht et al., 2010). Chrysanthemum flowers are categorized based on size into spray and standard types. Spray types are used for garlands, worship, and social ceremonies, while standard types are used for cut flowers, indoor decoration, bouquets, and floral arrangements. Since the performance of a variety depends on environmental conditions, identifying suitable genotypes for different regions is vital. Water and fertilizer management significantly impact chrysanthemum cultivation. Inefficient irrigation and excessive fertilizer use not only waste resources but also lead to groundwater nitrate pollution, reduced plant vigor, and lower flower yield due to poor foliage, fewer branches, and weak flowering (Melvin and James, 2001). Hence sustainable technologies are needed to optimize resource use and maximize production while minimizing environmental impact.
Micro-irrigation techniques, such as drip irrigation, can reduce water usage by 27% to 42 (NITI Aayog technical report, 2023). The first extensive comparison of drip irrigation with conventional methods was conducted by Goldberg and colleagues in Israel’s Arava and Negev districts, demonstrating over 75% yield increases in pepper and tomato crops (Goldberg and Shumeli, 1971). Despite its importance, irrigation in chrysanthemum cultivation has been neglected, leading to productivity losses and quality deterioration (Farias et al., 2009). Efficient water management should consider soil, plant, and water factors to mitigate water deficits. Drip fertigation enhances crop quality and yield while improving nutrient efficiency. It allows precise nutrient placement at critical growth stages, reducing fertilizer use by 15-25% without affecting yield. Fertigation benefits include consistent nutrient availability, improved nutrient uptake, reduced leaching losses, and cost savings (Chitra et al., 2023). Flower crops require high nutrient levels, necessitating balanced chemical fertilizer applications to achieve optimal flower production (Nikam et al., 2017). Fertigation is also increasingly used in landscaping due to advancements in dispenser technology. It supplements nutrients or corrects deficiencies detected through plant tissue analysis and is commonly used for crops such as vegetables, grasses, fruit trees, and ornamentals (Incrocci et al., 2017).
The standardization of irrigation and fertigation scheduling tailored to specific cultivars is imperative to address the heterogeneity of field conditions, including soil type, slope variations, and field layout. Despite its benefits there is a limited research has been conducted on drip fertigation for flower crops. The effects of irrigation and fertigation on chrysanthemum’s vegetative and floral growth have not been investigated extensively. Hence, this study aimed to evaluate the effects of irrigation and fertigation levels on chrysanthemum’s vegetative, floral growth & yield and cost economics. The findings of this study will provide valuable insights for farmers, agronomists, and policymakers, contributing to the development of sustainable and profitable chrysanthemum cultivation practices in water-scarce regions. Furthermore, the economic aspects of chrysanthemum cultivation under drip fertigation need thorough investigation to ensure sustainable production. By integrating agronomic practices with economic analysis, this paper seeks to provide a comprehensive understanding of the cost-benefit ratio and overall profitability of drip fertigation techniques in semi-arid regions. This approach not only addresses the technical and agronomic challenges but also highlights the economic viability of adopting advanced irrigation and fertigation practices in chrysanthemum cultivation.
Materials and methods
Study area details
The field experiment was carried out during winter rabi seasons of 2023–24 and 2024–25 at the Precision Farming Development Centre (PFDC), Water Technology Centre, ICAR-Indian Agricultural Research Institute, New Delhi. It is located at 28°37′22″–28°39′00″ North latitude and 77°8′45″–77°10′24″ East longitude with a mean altitude of 230 m above mean sea level (Figure 1). The study was conducted in a semi-arid, sub-tropical climate characterized by hot, dry summers and cold winters. The experimental soil was classified as sandy loam, consisting of 71% sand, 14% silt, and 15% clay. It had a pH of 7.65, an electrical conductivity of 0.29 dS/m, and an organic carbon content of 0.43%. The soil moisture analysis revealed that the experimental site had a field capacity of 24.3% and a permanent wilting point of 7.3% as displayed in Table 1.
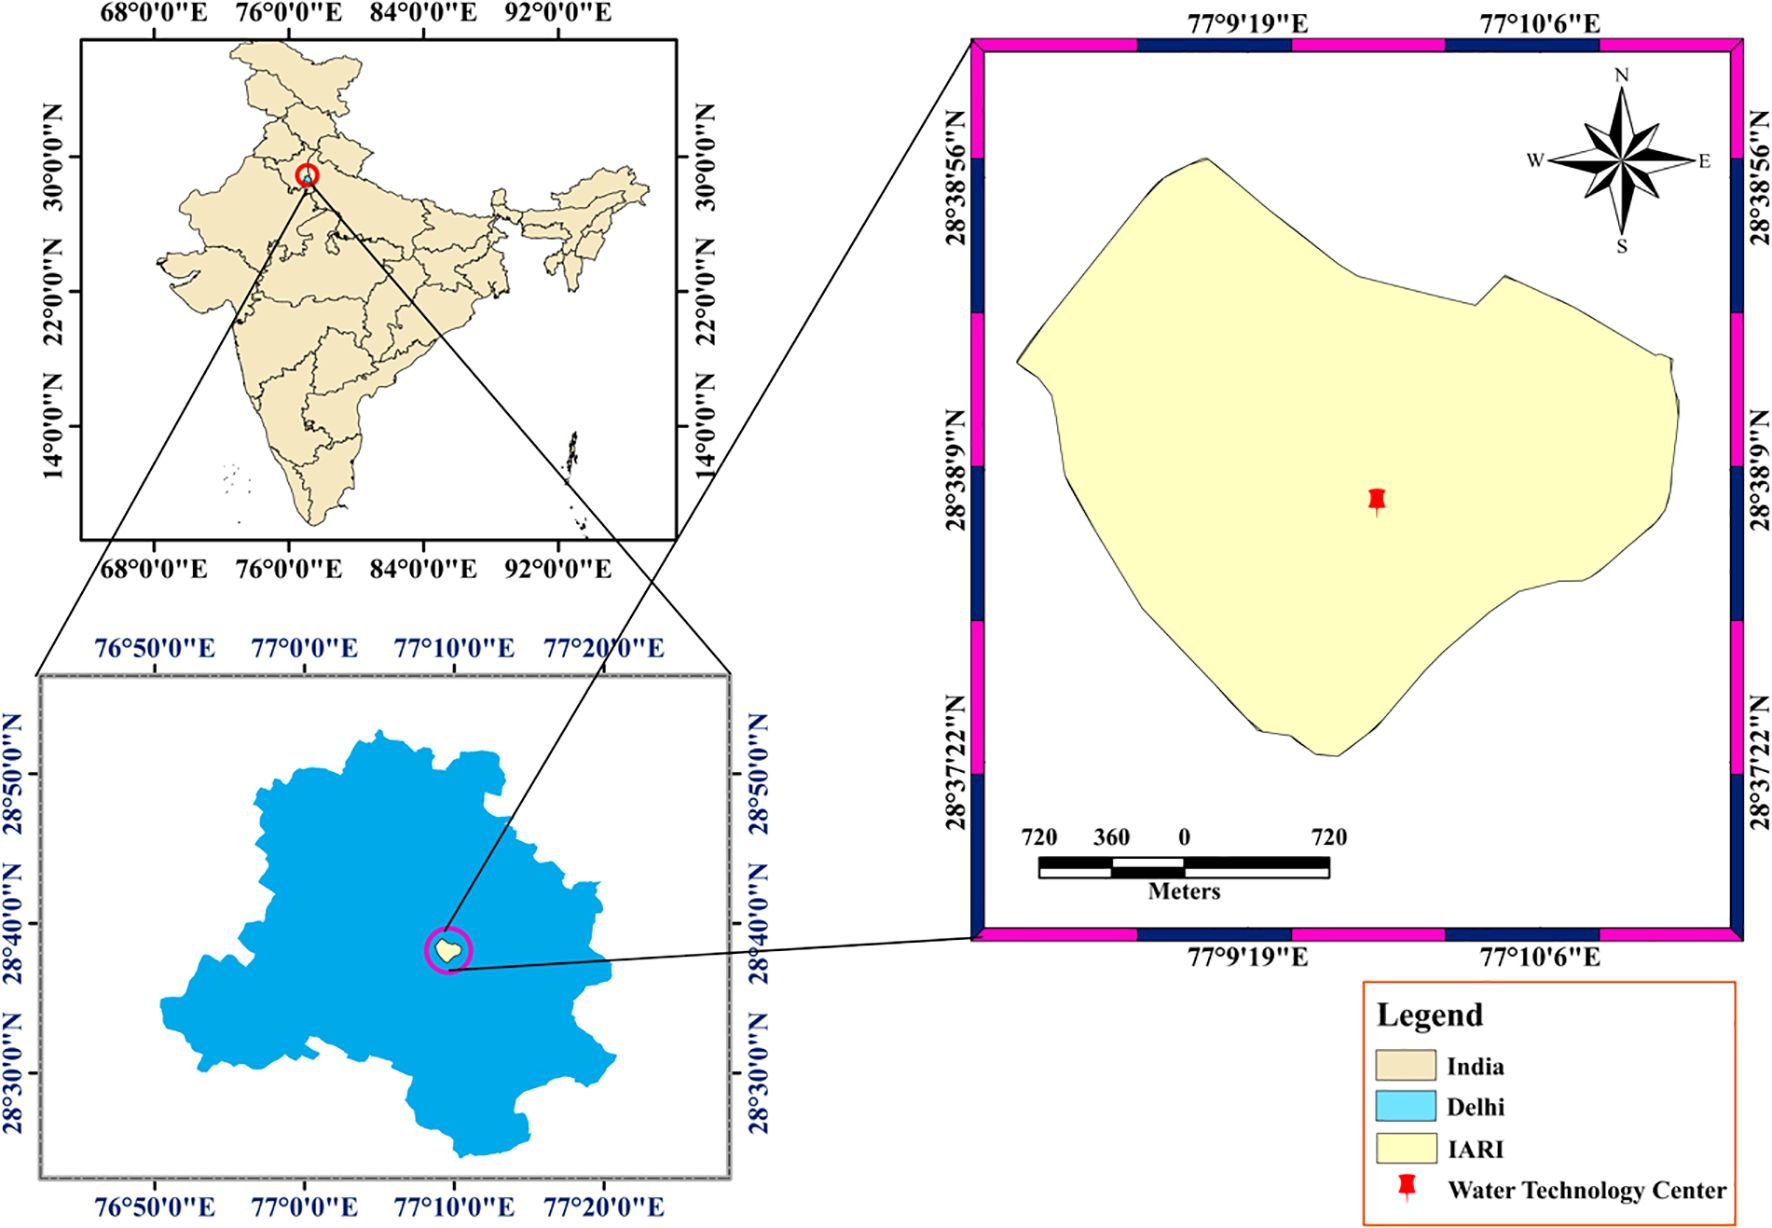
Figure 1. Location map of the experimental site.
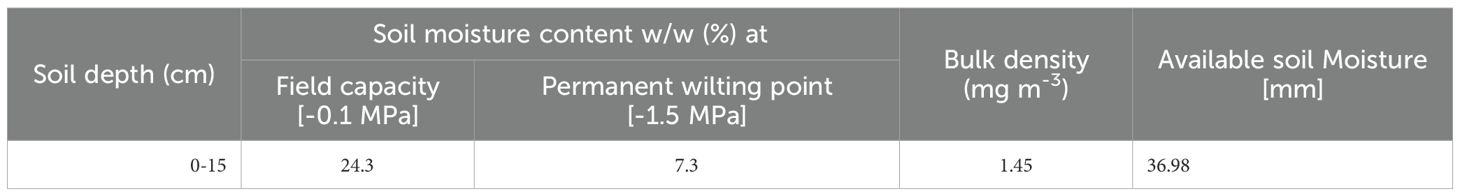
Table 1. Soil moisture retention characteristics of the experimental soil.
The 31 years (19900-2020) long-term average data revealed that the long-term mean Tmax (30.95 °C) and Tmin (17.66 °C) indicate a moderately warm climate with wide variability (range up to 43.8 °C for Tmax and 37.4 °C for Tmin). The maximum RH (80.6%) shows generally humid conditions, while minimum RH (47.7%) highlights considerable dryness during parts of the year. Mean wind speed (3.93 km/h) and sunshine hours (6.02 h/day) reflect moderate airflow and good solar radiation availability. The average ETo (3.28 mm/day) suggests a moderate evaporative demand, strongly influenced by sunshine and wind speed. Similarly mean monthly maximum and minimum temperatures in 2023–24 were 31.34 °C & 20.47 °C respectively, and 31.90 °C& 20.39 °C in 2024-25, during the crop growth period. The mean monthly maximum relative humidity (RH I) was 87.24% and 87.53% in 2023–24 and 2024–25, respectively, while the minimum relative humidity (RH II) was 60.93% & 57.87% over the same period. Daily Mean sunshine hours fluctuated between 4.45 and 4.96 hours. The mean monthly pan evaporation (PE) values ranged from 3.03 to 2.95 mm. Daily variability of the weather parameters during the experiment period are displayed in Figures 2a, b for 2023-24 and 2024-25 crop seasons, respectively.
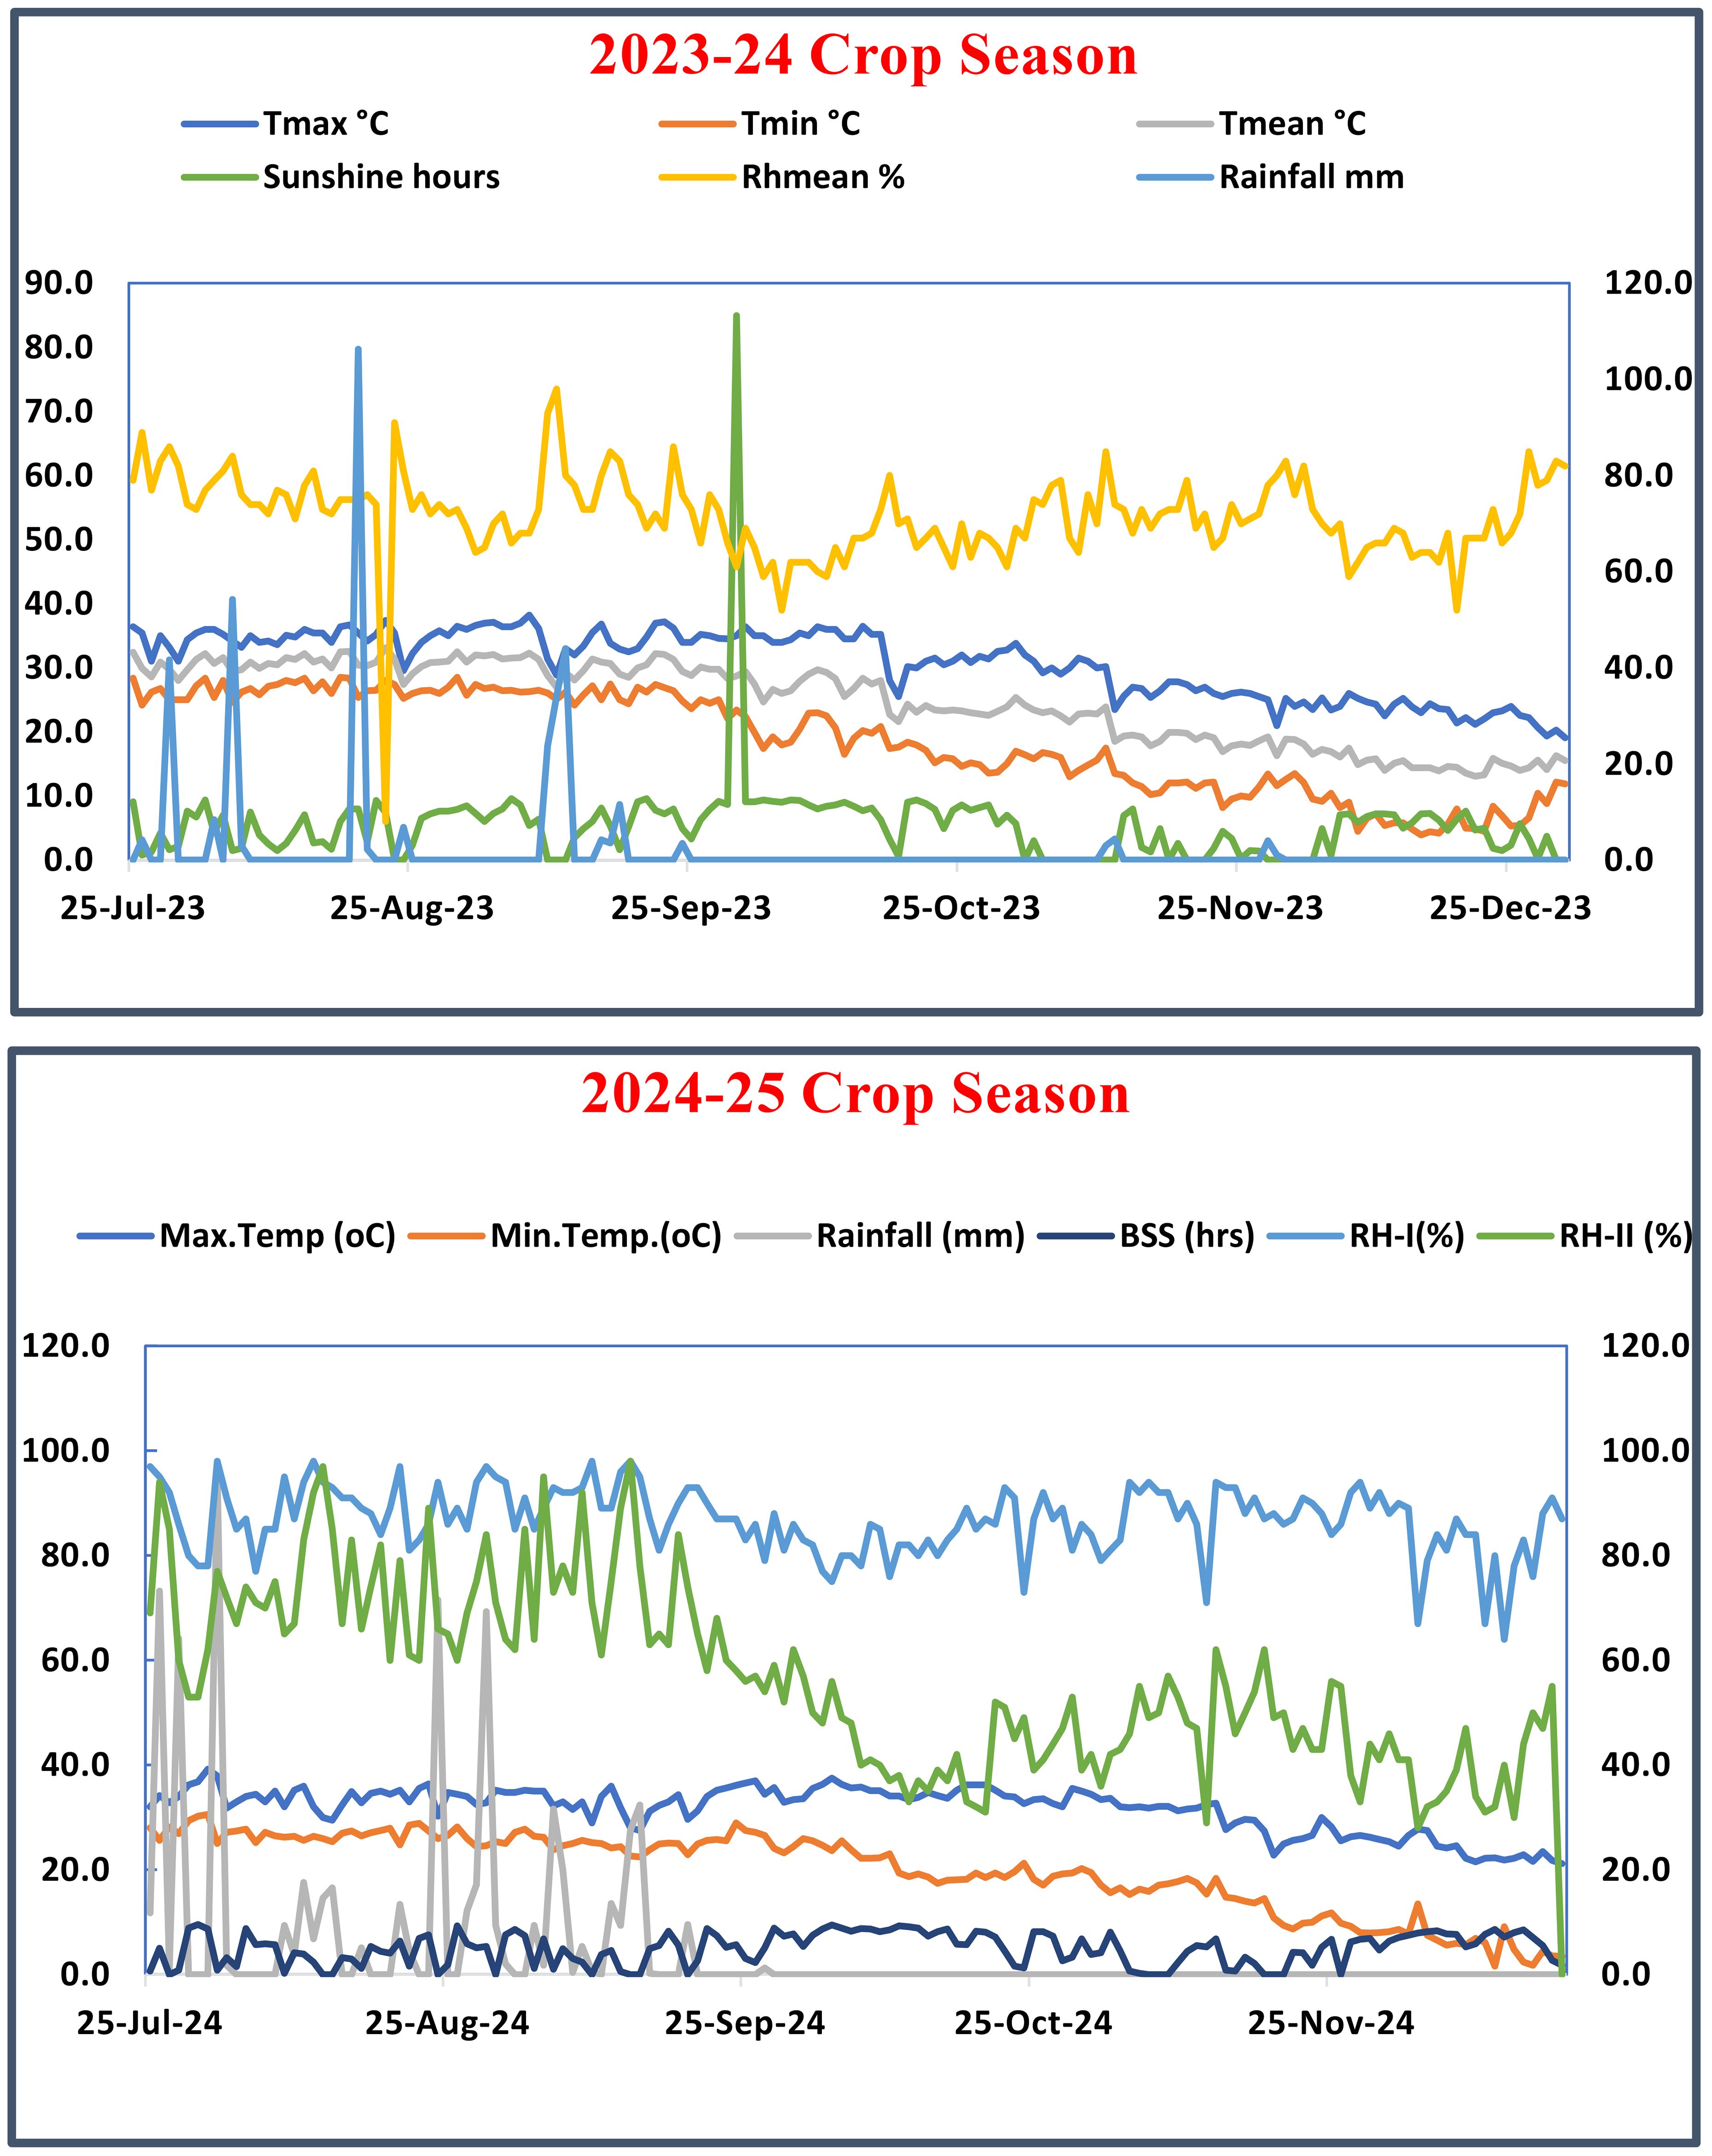
Figure 2. Meteorological parameters during the cropping period in 2023-24 and 2024-25 crop seasons.
Experiment details
The experiment was laid out in a split-split plot design with 18 treatments and each treatment was replicated thrice. These treatments included two cultivars (autumn pink and autumn white), three irrigation schedules (0.5 Epan, 0.75 Epan and 1.0 Epan) and three fertigation schedules (50%, 75%, and 100% Recommended Dose of Fertilizers). The treatments included T1-Autumn pink + Irrigation Scheduled at 0.5 Epan + 50% RDF (V1I1F1), T2-Autumn pink + Irrigation Scheduled at 0.5 Epan + 75% RDF (V1I1F2), T3-Autumn pink + Irrigation Scheduled at 0.5 Epan + 100% RDF (V1I1F3), T4-Autumn pink + Irrigation Scheduled at 0.75 Epan + 50% RDF (V1I2F1), T5-Autumn pink + Irrigation Scheduled at 0.75 Epan + 75% RDF (V1I2F2), T6-Autumn pink + Irrigation Scheduled at 0.75 Epan + 100% RDF (V1I2F3), T7- Autumn pink + Irrigation Scheduled at 1.0 Epan + 50% RDF (V1I3F1), T8-Autumn pink + Irrigation Scheduled at 1.0 Epan + 75% RDF (V1I3F2), T9-Autumn white + Irrigation Scheduled at 1.0 Epan + 100% RDF (V1I3F3), T10-Autumn white + Irrigation Scheduled at 0.5 Epan + 50% RDF (V2I1F1), T11-Autumn white + Irrigation Scheduled at 0.5 Epan + 75% RDF (V2I1F2), T12-Autumn white + Irrigation Scheduled at 0.5 Epan + 100% RDF (V2I1F3), T13-Autumn white + Irrigation Scheduled at 0.75 Epan + 50% RDF (V2I2F1), T14-Autumn white + Irrigation Scheduled at 0.75 Epan + 75% RDF (V2I2F2), T15-Autumn white + Irrigation Scheduled at 0.75 Epan + 100% RDF (V2I2F3), T16-Autumn white + Irrigation Scheduled at 1.0 Epan + 50% RDF (V2I3F1), T17-Autumn white + Irrigation Scheduled at 1.0 Epan + 75% RDF (V2I3F2), T18-Autumn white + Irrigation Scheduled at 1.0 Epan + 100% RDF (V2I3F3). The layout of the field experiment is displayed in Figure 3.
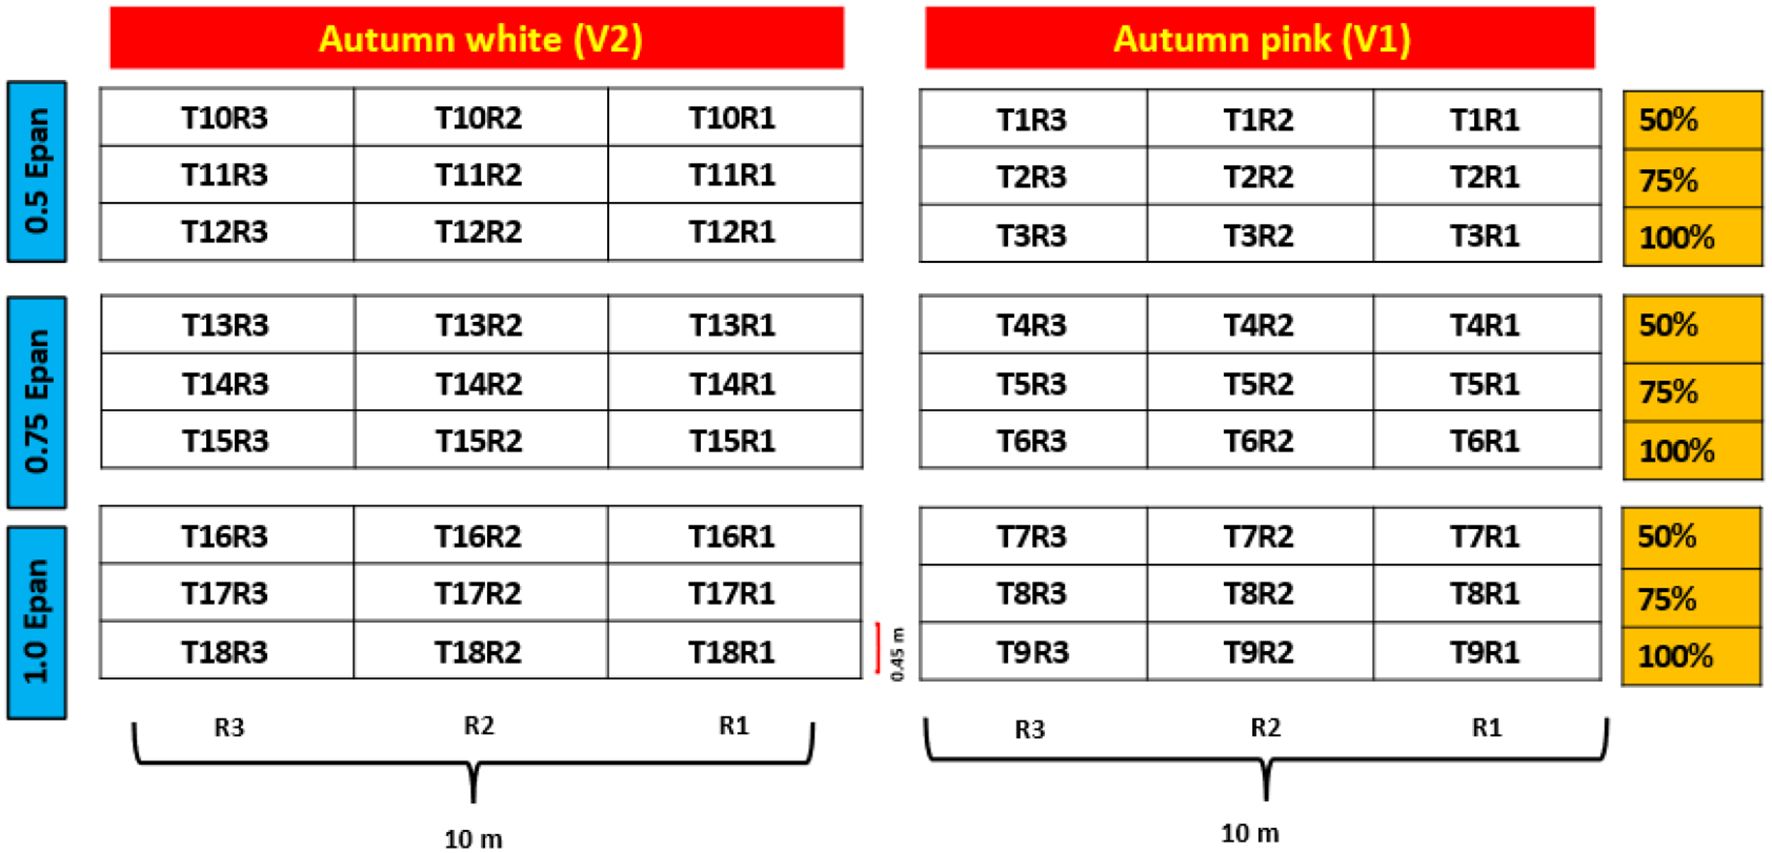
Figure 3. Layout of the field experiment.
The available nutrient levels of nitrogen (N), phosphorus (P), and potassium (K) were recorded as 125.66, 26.55, and 281.41 kg/ha, respectively prior to the start of the field experiments.
Soil moisture holding properties
Soil moisture retention capacity of the experimental field was estimated at -0.1 MPa and -15 MPa using pressure plate apparatus and the bulk density of the experimental soil was estimated for 0-15 cm soil depth by following the standard procedure as given below by (Richards, 1954) (Equation 1);
The total available soil moisture for plant use is the difference between -0.1 - 1.5 MPa.
The available soil moisture up to 15 cm depth was computed as follows (Equation 2):
Where as
D = Total available moisture (mm)
FC = Soil moisture content at field capacity (% by dry weight)
PWP = Soil moisture content at permanent wilting point (% by dry weight)
BD = Bulk density of soil (mg m-3)
d = Depth of soil (mm)
Irrigation and fertigation scheduling
Irrigation was scheduled on every third day based on daily evaporation data recorded from a USWB Class ‘A’ pan evaporimeter available at the agrometeorological station, ICAR-IARI, New Delhi. The amount of irrigation water was calculated in terms of gross irrigation requirements and pumping time per application, whereas irrigation time depends on crop evapotranspiration (ETc) on daily basis. The irrigation duration was determined by considering the number of laterals, emitter spacing, and emitter discharge. The following f were used to calculate the application rate and irrigation time (yang et al., 2023) of the drip system (Equations 3, 4):
Where,
Q = Dripper discharge (L h-1)
DL= Distance between laterals (m)
DE = Distance between drippers (m)
Fertigation was applied using a venturi system every third day, as per the treatments. The fertilizers were applied in 3 equal split dosages at three critical crop growth stages viz., vegetative, budding, and flowering stages as displayed in Figure 4. The sources for nitrogen, phosphorus and potassium nutrients were urea, DAP, and MOP, respectively.
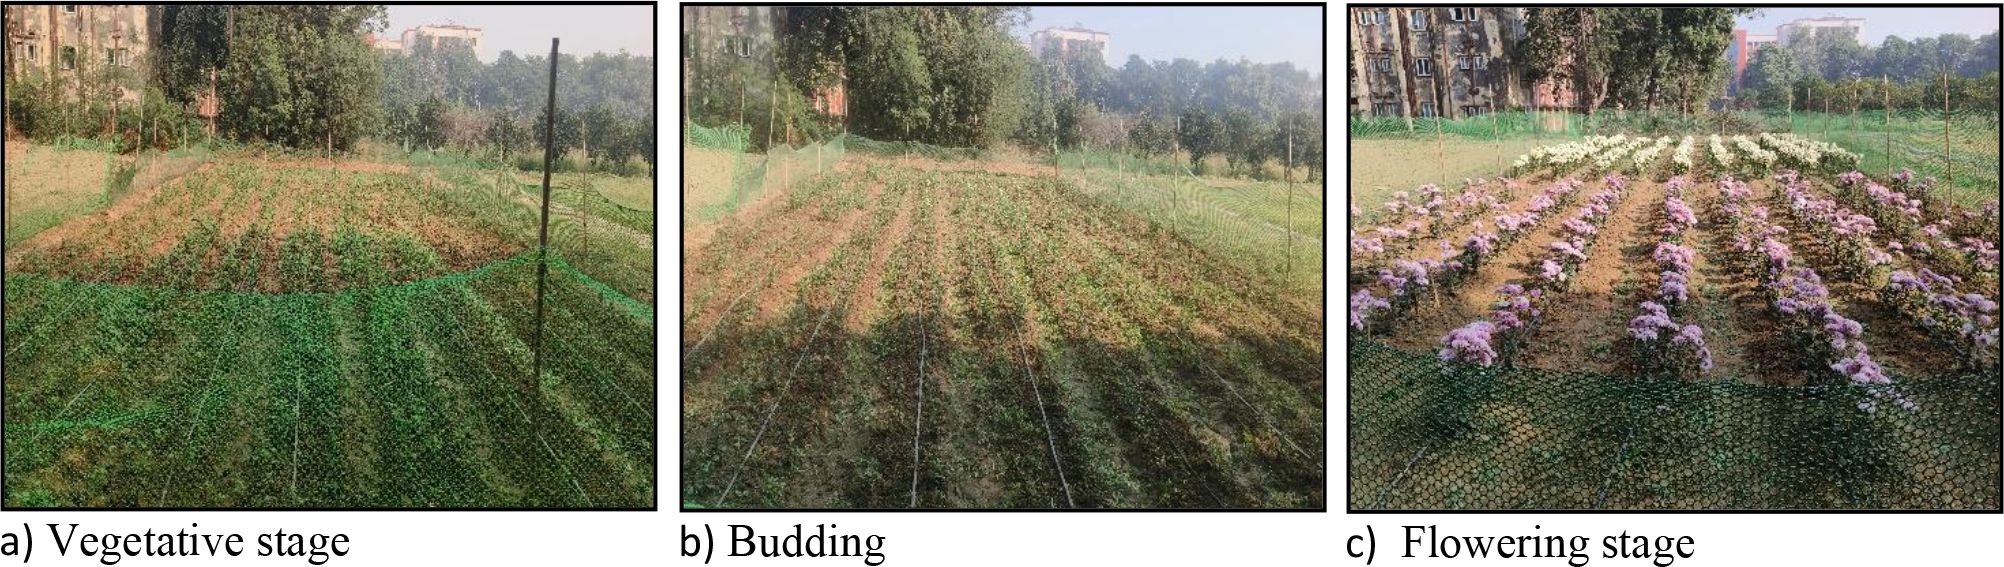
Figure 4. Different crop growth development stages of chrysanthemum [i.e., (a). Vegetative stage, (b). Budding and (c). Flowering stage].
Cultivar description
The Autumn White chrysanthemum cultivar (Figure 5a) is a charming fall-blooming cultivar known for its crisp, pure white flowers that add a touch of brightness to autumn gardens. With a dense, mounding growth habit and decorative bloom form, it typically reaches 18 to 24 inches in height and is ideal for borders, containers, or seasonal displays. Its clean white petals may take on a soft ivory tone in cooler weather, offering subtle warmth to fall color palettes. This hardy perennial thrives in full sun and performs best in USDA zones 5 through 9, often returning year after year with proper care and mulching in colder regions. The Autumn Pink chrysanthemum cultivar (Figure 5b), on the other hand, brings a gentle splash of color with its soft to medium pink blooms, sometimes tinged with hints of lavender or rose depending on the temperature. Like its white counterpart, it features a compact, bushy habit and blooms prolifically in mid to late fall, creating a rich, seasonal contrast when planted alongside other mums or ornamental grasses. Its lush green foliage serves as a lovely backdrop to the colorful blossoms, making it a favorite for mixed container arrangements and garden beds alike. Autumn Pink is also hardy in zones 5 to 9 and flourishes in full sun, offering long-lasting beauty and reliable performance in the fall garden. The selected cultivar’s flowers are shown in Figure 5.
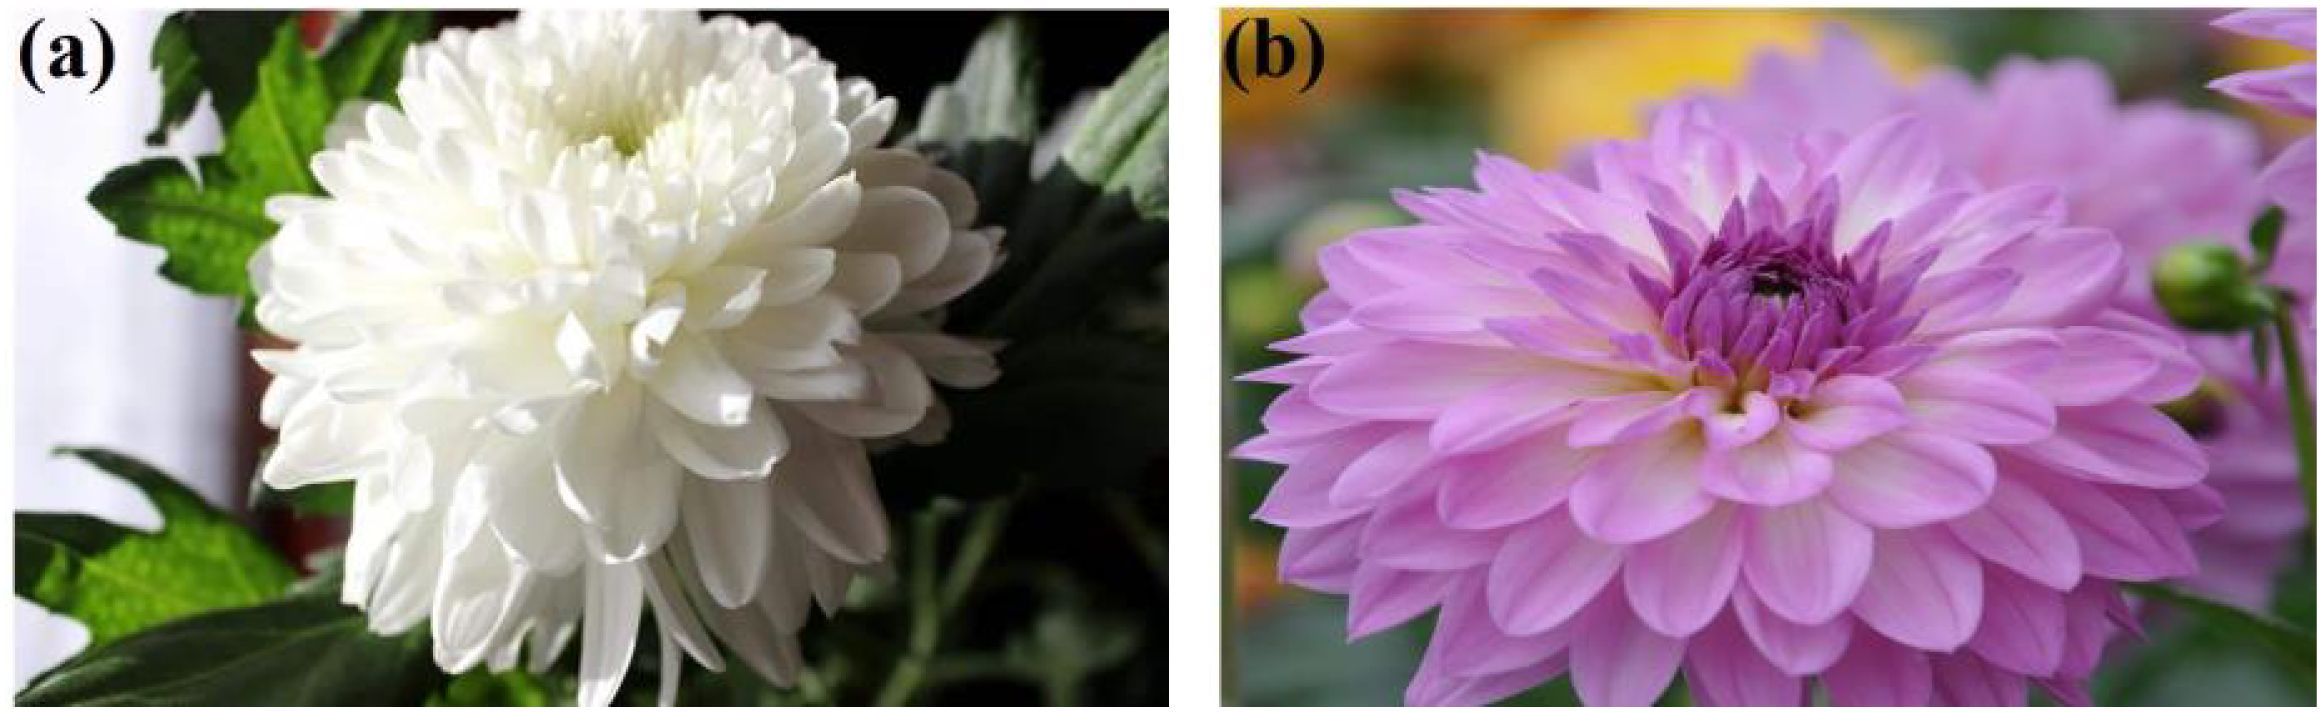
Figure 5. Autumn white (a) and autumn pink (b) cultivars.
Nursery preparation and transplanting
The raised beds prepared for planting were watered to field capacity before transplanting (Figure 6a). Disease free and healthy 40 days old cuttings were transplanted to the field on 24th July in both the cropping seasons. Cuttings were manually planted in paired row planting on either side of the bed in all the treatments. During planting, care was taken such that the plants should be 5 mm below soil without disturbing the root ball. Two rows of cuttings were planted on each bed at 1 m distance between the rows and 30 cm distance between the cuttings (Figure 6b). Around 2000 cuttings were planted on 9 raised beds. A pathway of 1 m was maintained between the beds to facilitate easy movement for cultural operations.
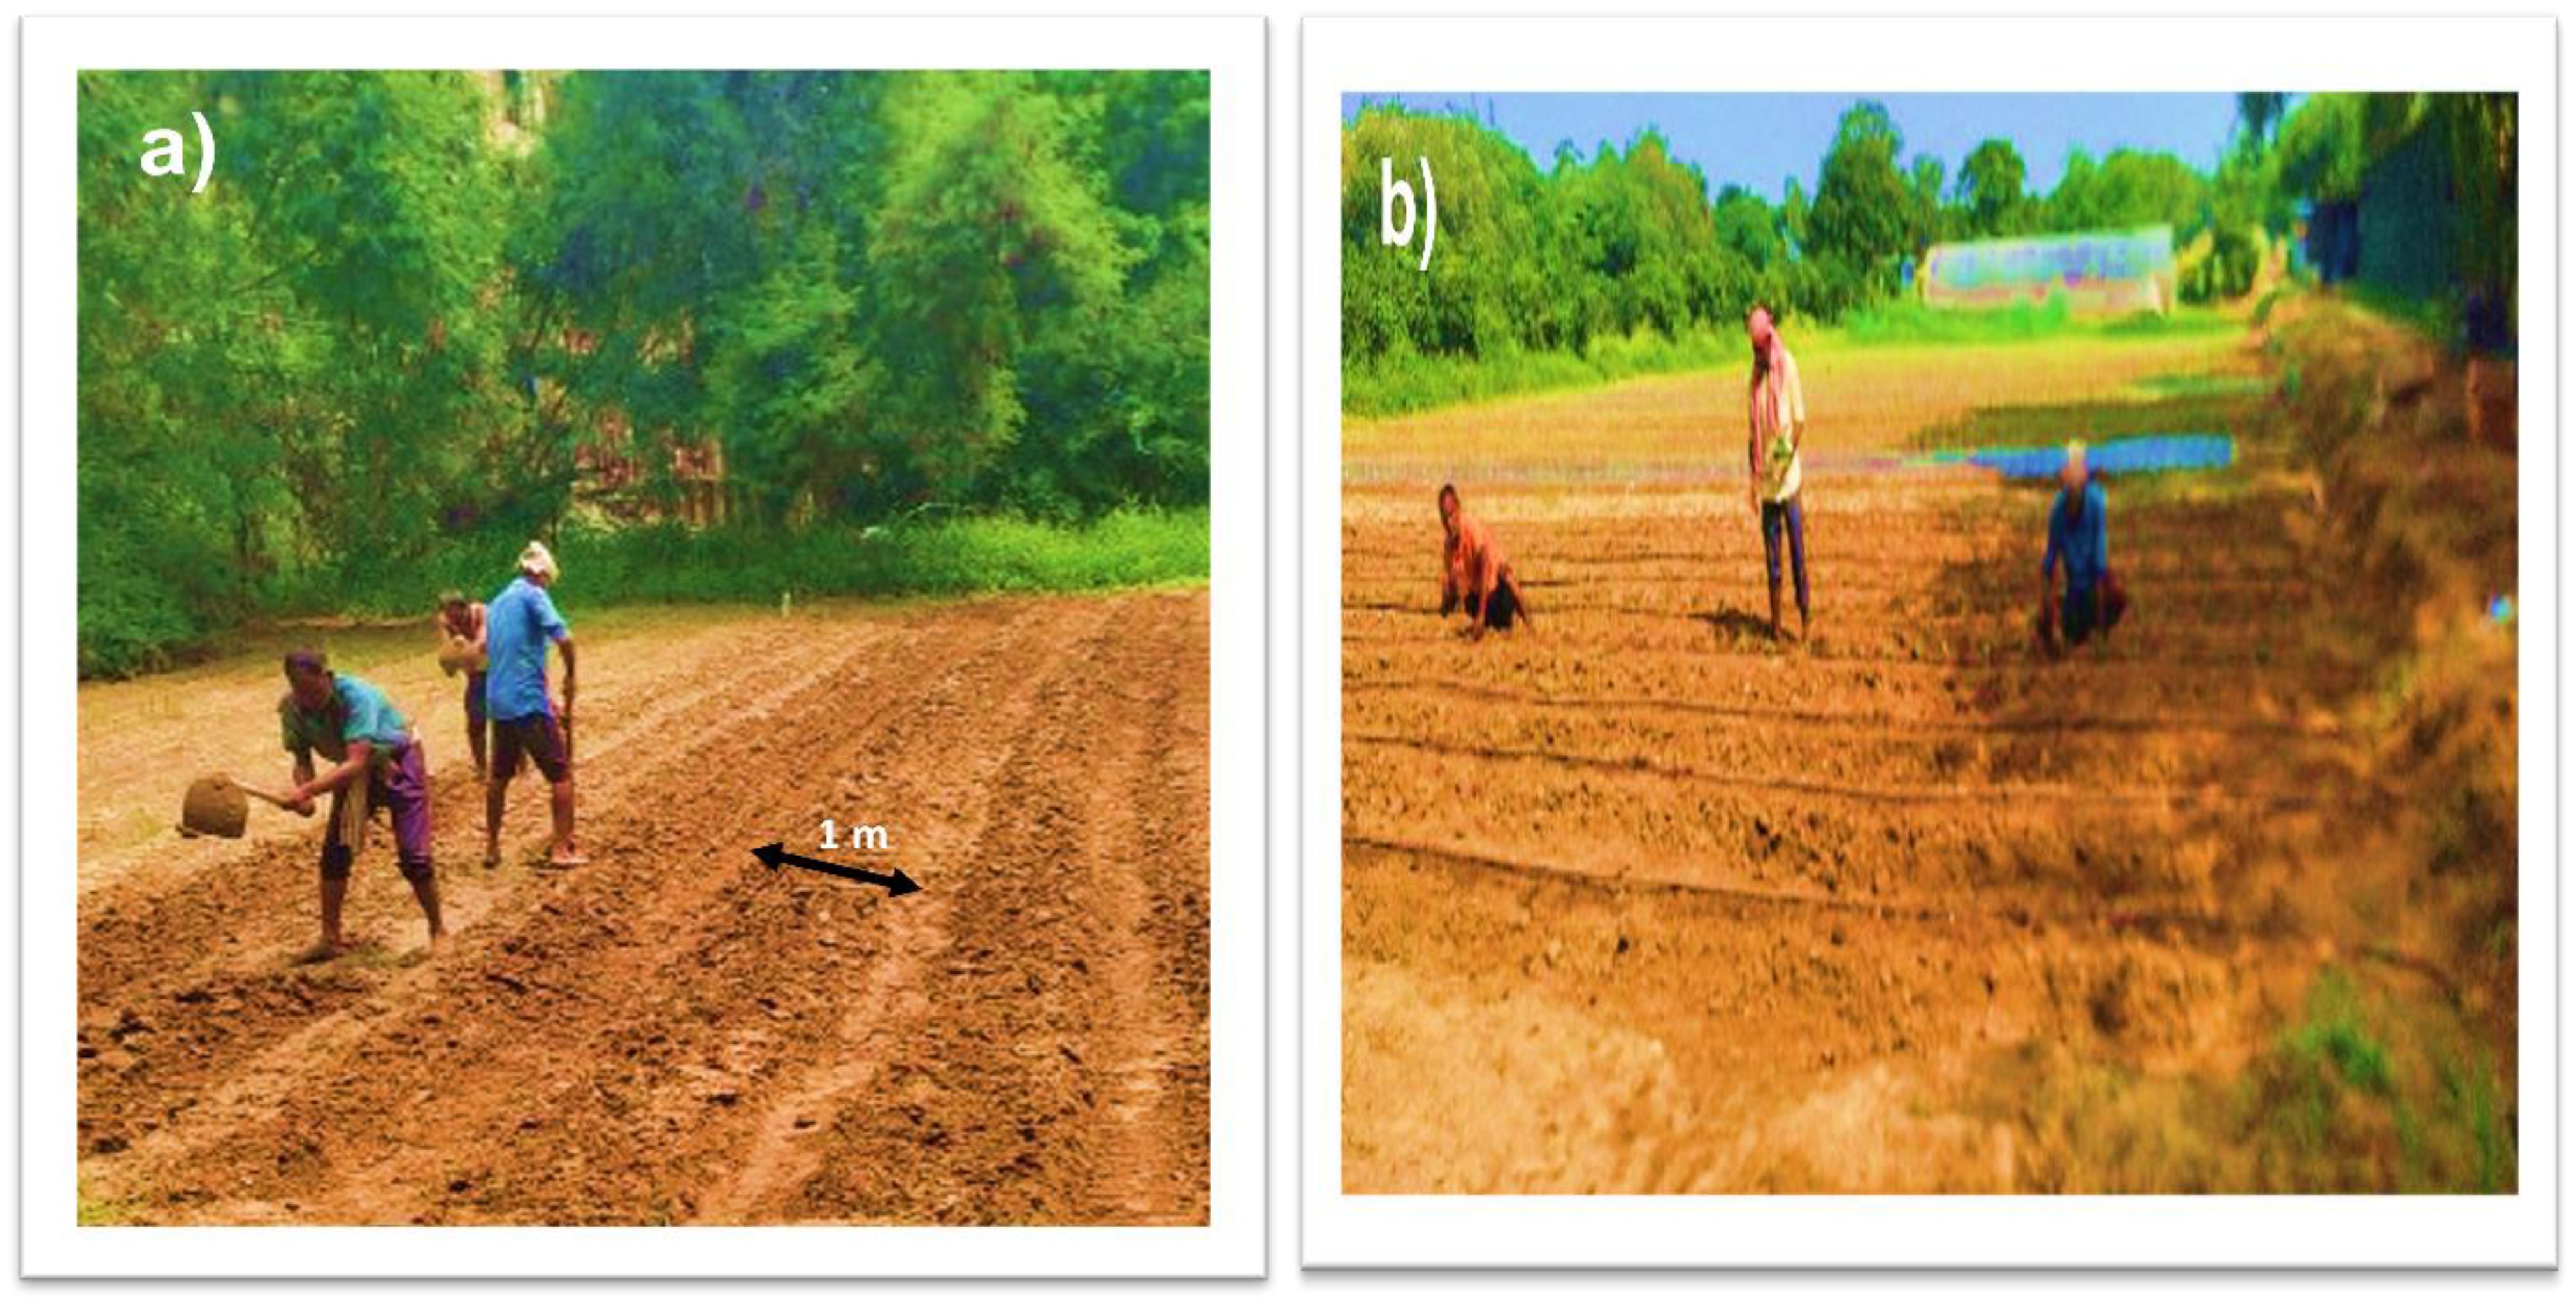
Figure 6. Beds preparation (a) and transplanting of cuttings (a).
Crop management practices
Gap filling was done at 10 days after transplanting to maintain optimum plant population in all the treatments. Organic manures i.e., neem cake and vermicompost were applied as basal dose. Hand weeding was done regularly at 10 days interval throughout the crop growth period to maintain weed free environment during the entire crop growth period. The fertilizers were applied in the form of urea, di-ammonium phosphate (DAP), and white muriate of potash. From 100% RDF (200-200-100 kg N, P2O5, K2O ha-1), a common dose of 200 kg phosphorus was applied to all the treatments as basal application. Nitrogen and potassium were applied through drip fertigation at different growth stages as per treatments (Table 2). Plant protection measures were followed for the control of pests and diseases like wilts, aphids, thrips and mites etc. The flowers from the plant were harvested at maturity. Harvesting was done at morning time and flowers were kept in a cool shade place avoiding direct exposure to sunlight. Care was taken to keep the flowers separately for each treatment and then weighed.
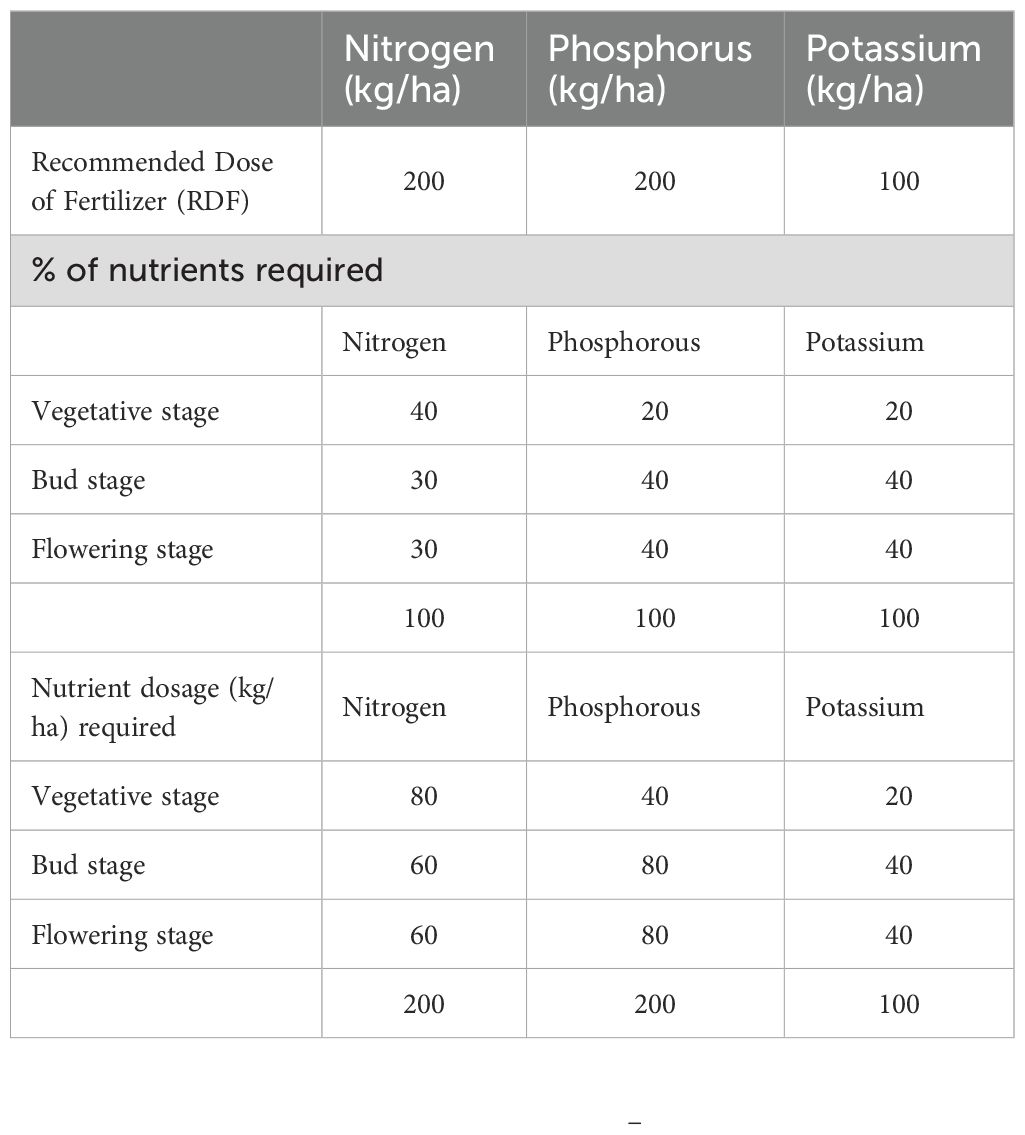
Table 2. Quantity of fertilizer (NPK kg/ha) given at different crop growth stages.
Biometric measurements of flower parameters were recorded by tagging five randomly selected plants in each plot, and then the average values were reported. Flower yield (t/ha) was measured by multiplying the total number of flowers and the average weight of a flower in each treatment plot. Water use efficiency was derived by the ratio of total marketable yield to the crop evapotranspiration (ETc) and it was expressed as kg.ha-1mm-1 (Erdem et al., 2010) (Equation 5).
Where R, Rainfall (mm); Y, total yield (kg/ha); IRw, Irrigation water applied (mm); ETc, Total water consumed for crop production (mm); WUE, water use efficiency (kg.ha-1.mm-1); This measurement helps in assessing the efficiency of water use in crop production, providing insights into how effectively water resources are being utilized to achieve maximum crop yield.
The economic analysis of chrysanthemum cultivation for the 2023–24 and 2024–25 crop seasons considered both fixed and variable costs. Fixed costs included the cost of the drip irrigation system, calculated using the annual fixed cost (AFC) formula, which comes through multiplying present value with capital recovery factor (CRF) (Soujanya et al., 2025) as follows (Equations 6, 7);
where CRF = 0.1769. The annualized cost of the investment is 17.69% of the initial investment each year for the 10-year period. Variable costs covered operational and maintenance expenses for the drip system and all cultivation activities, including land preparation, bulb costs, planting, plant protection, intercultural operations, fertilizer application, irrigation, and harvesting. The pumping cost was calculated based on the energy consumption of the pump, the hours of operation, and the cost of electricity. It was crucial to monitor and optimize the pumping schedule to minimize energy consumption while ensuring efficient water delivery to the crop. The average market value of the flowers used in the experiment was used to determine gross returns (GRR). The net returns (NER) was calculated by deducting the total cultivation cost (TCOC) from the gross return (GRR). Net returns to cultivation costs were compared to get the benefit-cost ratio (BCR), where all variables are represented in rupees per hectare (USD/ha). Everything from tillage to harvesting including fertilizers, and irrigation, was included in the cultivation cost for each treatment. The flower market prices that were prevalent during both crop seasons were used to compute the gross returns. To get the net returns, we took the gross monetary returns and subtracted the cultivation cost. The BCR was then calculated using Equation (Soujanya et al., 2025) (Equation 8);
The data from the two-year study were analyzed using a three-factor analysis of variance (ANOVA) based on a split-split plot design, as recommended by Gomez and Gomez (1984). Standard statistical procedures were employed to compute the critical difference (CD) for treatment contrasts and also met the normality and homogeneity of variance. The least significant difference at P = 0.05 was determined to assess variations among the treatments.
Results and discussion
Crop water and irrigation requirement of chrysanthemum
These two terms are closely related but serve different purposes in agricultural water management. Crop water requirement is the total amount of water a crop needs for optimal growth and yield which includes, Evapotranspiration (ET), water for metabolic processes, and minor losses, whereas irrigation water requirement is the amount of water that must be supplied through irrigation to meet the crop’s water needs which includes (Crop Water Requirement minus Effective Rainfall) and other natural sources.
Irrigation scheduling was done based on daily evaporation data recorded from USWB class ‘A’ pan evaporimeter available at the agrometeorological station, ICAR-IARI Farm, New Delhi. Pan evaporation (PE) measures the water evaporated from an open pan, which reflects the atmospheric demand of water. Different levels (e.g., 0.5, 0.75, and 1.0 Epan) were used to determine the amount of irrigation water to apply, reflecting varying irrigation levels. The irrigation requirement under different treatments was 127.85 mm for I1 (0.5 Epan), 180.55 mm for I2 (0.75 Epan), and 233.2 mm for I3 (1.0 Epan) (Table 3). The crop water requirement represents the total amount of water needed by the crop for optimal growth, which includes evapotranspiration (ET) and soil moisture needs. It is influenced by various factors. Thus, it is typically higher than the irrigation water applied, with values of 204.85 mm for I1, 257.55 mm for I2, and 310.20 mm for I3.
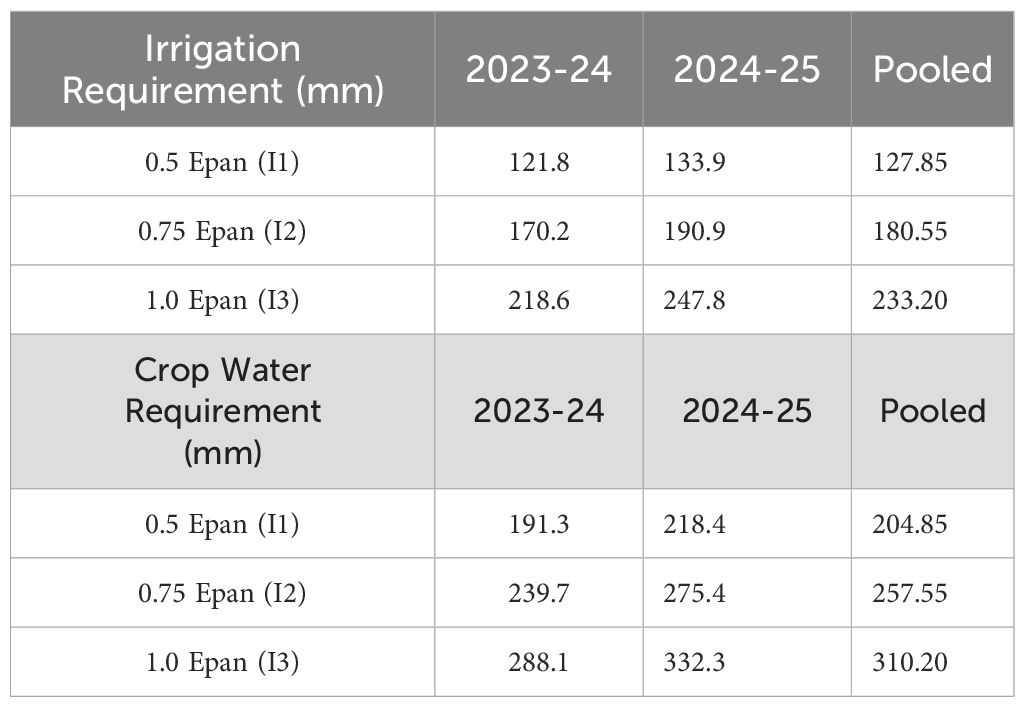
Table 3. Crop and irrigation water requirement of chrysanthemum during 2023-2025 and pooled data.
Water use efficiency
Water use efficiency varied significantly across treatments, influenced by different irrigation and fertigation schedules. Among cultivars, Autumn white (V2) recorded the highest WUE (56.85 kg.ha-1.mm-1) followed by V1 (47.08 kg.ha-1.mm-1) (Table 4 and Figure 7.). Among varied irrigation levels, the highest WUE was recorded with I2 (58.87 kg.ha-1.mm-1) followed by I3 (49.56 kg.ha-1.mm-1) and the lowest was recorded with I1 (47.46 kg.ha-1.mm-1) irrigation levels. However, the total volume of irrigation water applied in I3 was significantly higher than in treatment I2, which has resulted in a lesser WUE in I3 as compared to the I2 treatment. There is an inverse relationship between water use/irrigation amount and WUE. Among different fertigation regimes, the highest WUE was recorded with F3 (60.76 kg.ha-1.mm-1) followed by F2 (52.80 kg.ha-1.mm-1) and the lowest was recorded with F1 (42.33 kg.ha-1.mm-1). However, among all the treatments, the highest pooled WUE was found in treatment V2I2F3 (Autumn white + Irrigation Scheduled at 0.75 Epan + 100% RDF) which recorded (82.71 kg.ha-1.mm-1) which highlights the importance of optimizing irrigation levels for maximum returns. Similarly, the treatment V2I3F3 (Autumn white + Irrigation Scheduled at 1.0 Epan + 100% RDF) also exhibited a strong pooled WUE of (63.47 kg.ha-1.mm-1) followed by V2I2F2 (i.e., 63.42 kg.ha-1.mm-1). In contrast, the treatment (V1I1F1), recorded the lowest WUE, with a pooled average of (35.09 kg.ha-1.mm-1), and these treatments resulted in lower returns compared to treatments with higher irrigation levels. Higher WUE and saving of irrigation water under drip irrigation could be ascribed to minimum water loss through deep percolation, runoff, seepage and soil evaporation as water was applied directly near the crop root zone of the crop in the required quantity. The highest WUE was found in 0.75 Epan (i.e., 58.87 kg.ha-1.mm-1) is indicating comparatively more efficient use of irrigation water. Similar results were reported with Jawaharlal (2017), who revealed that irrigation applied through drip at the rate of 60% E pan recorded significantly higher WUE followed by irrigation at 80% Epan and the significantly lowest WUE was recorded by irrigation given at 100 per cent Epan. The highest WUE was found in the lowest level of irrigation at 60% ET (11.90 t/ha/cm), indicating comparatively the more efficient use of irrigation water. These results agree with Khanam et al. (2017) who concluded in the tuberose crop that higher water use efficiency occurred at lower levels of irrigation, emphasizing the importance of optimizing water application for crop yield. Similar results were also obtained by Banik et al. (2018) and Yadav et al. (2020).

Table 4. Water use efficiency (kg.ha-1.mm-1) of chrysanthemum as influenced by different cultivars, irrigation levels and fertigation regimes during 2023 to 2025 and pooled data.
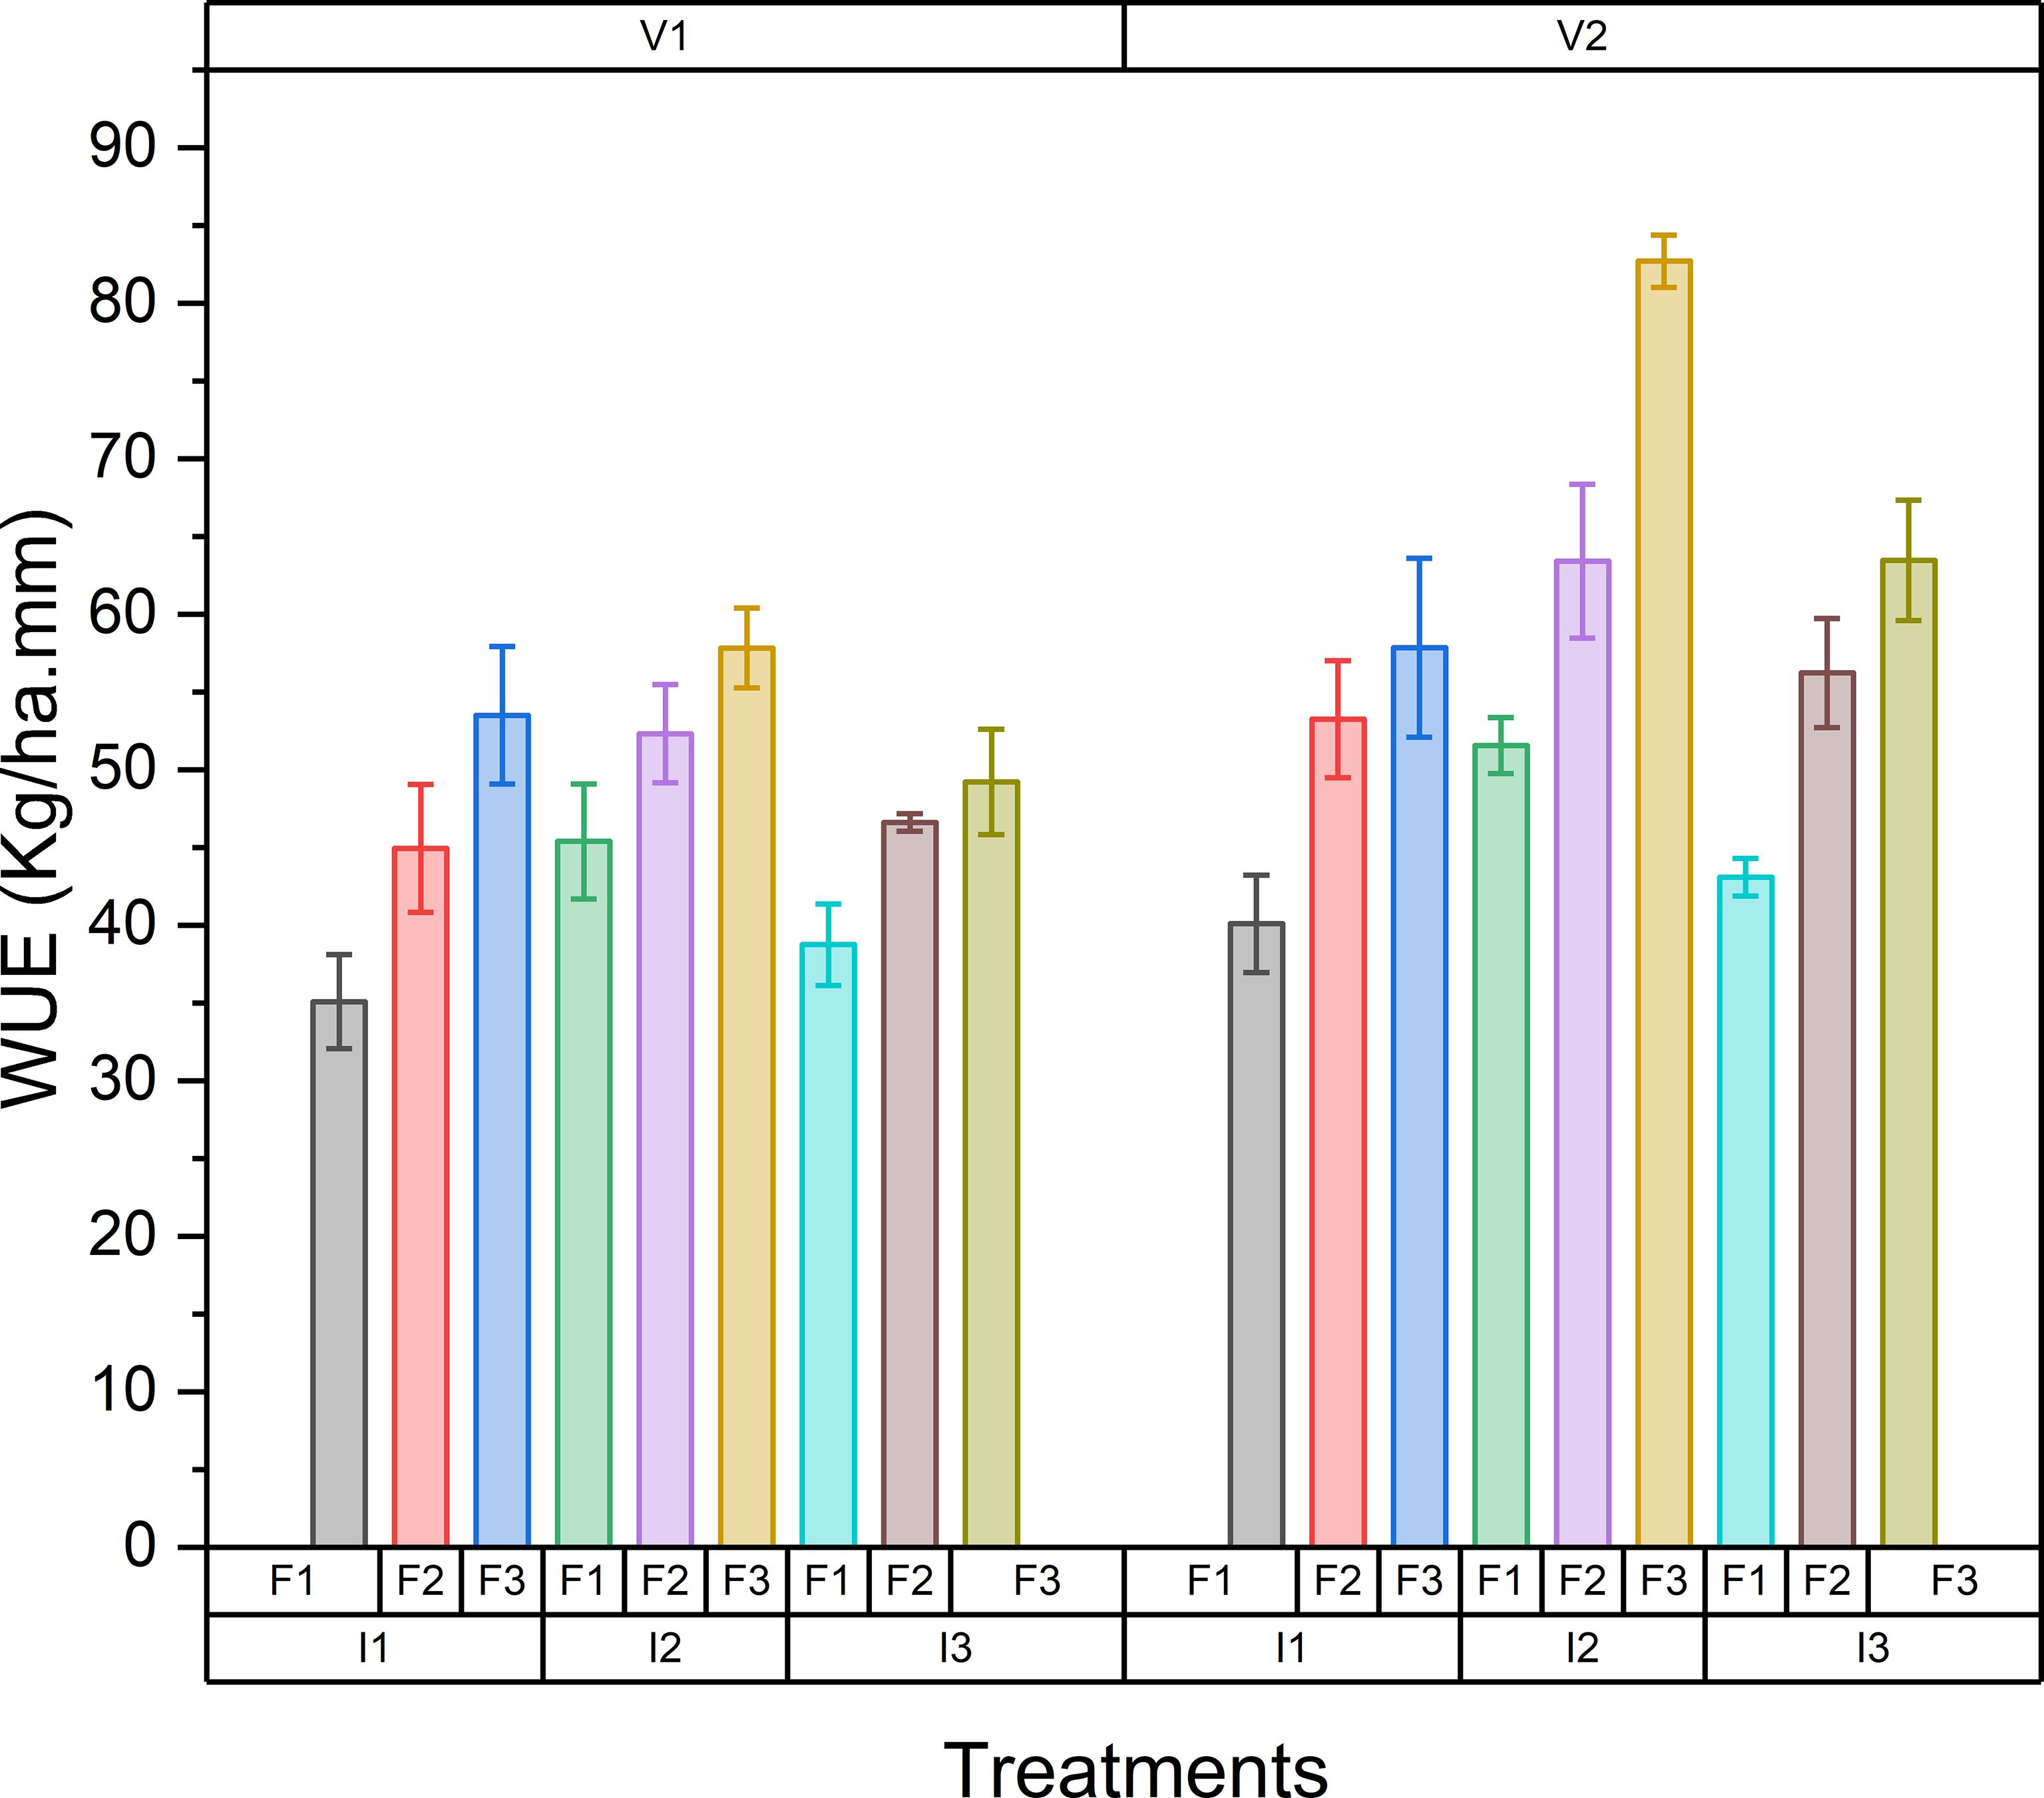
Figure 7. Influence of different cultivars, irrigation and fertigation levels on water use efficiency (kg.ha-1.mm-1).
Flower yield
The flower yield of chrysanthemum was significantly influenced by different cultivars, irrigation regimes, and fertigation levels across both the 2023–24 and 2024-25 seasons, as well as in the pooled data (Table 5 and Figure 8). The autumn white cultivar (V2) consistently produced higher flower yield in both years, with 14.84 t/ha in 2023–24 and 14.41 t/ha in 2024–25, resulting in a pooled yield of 14.62 t/ha. In contrast, the autumn pink cultivar (V1) yielded 12.34 t/ha in 2023–24 and 11.77 t/ha in 2024–25, with a pooled average of 12.05 t/ha. Suvija et al. (2016), reported that the variation in flower size in a particular cultivar may be attributed to the inherent genetic characters of the individual cultivars and environmental factors, which are directly correlated with the weight of individual flowers and hence the flower yield per plot. Similar results were also reported by Biradur and Khan (1996); Singh and Ramachandran (2002).
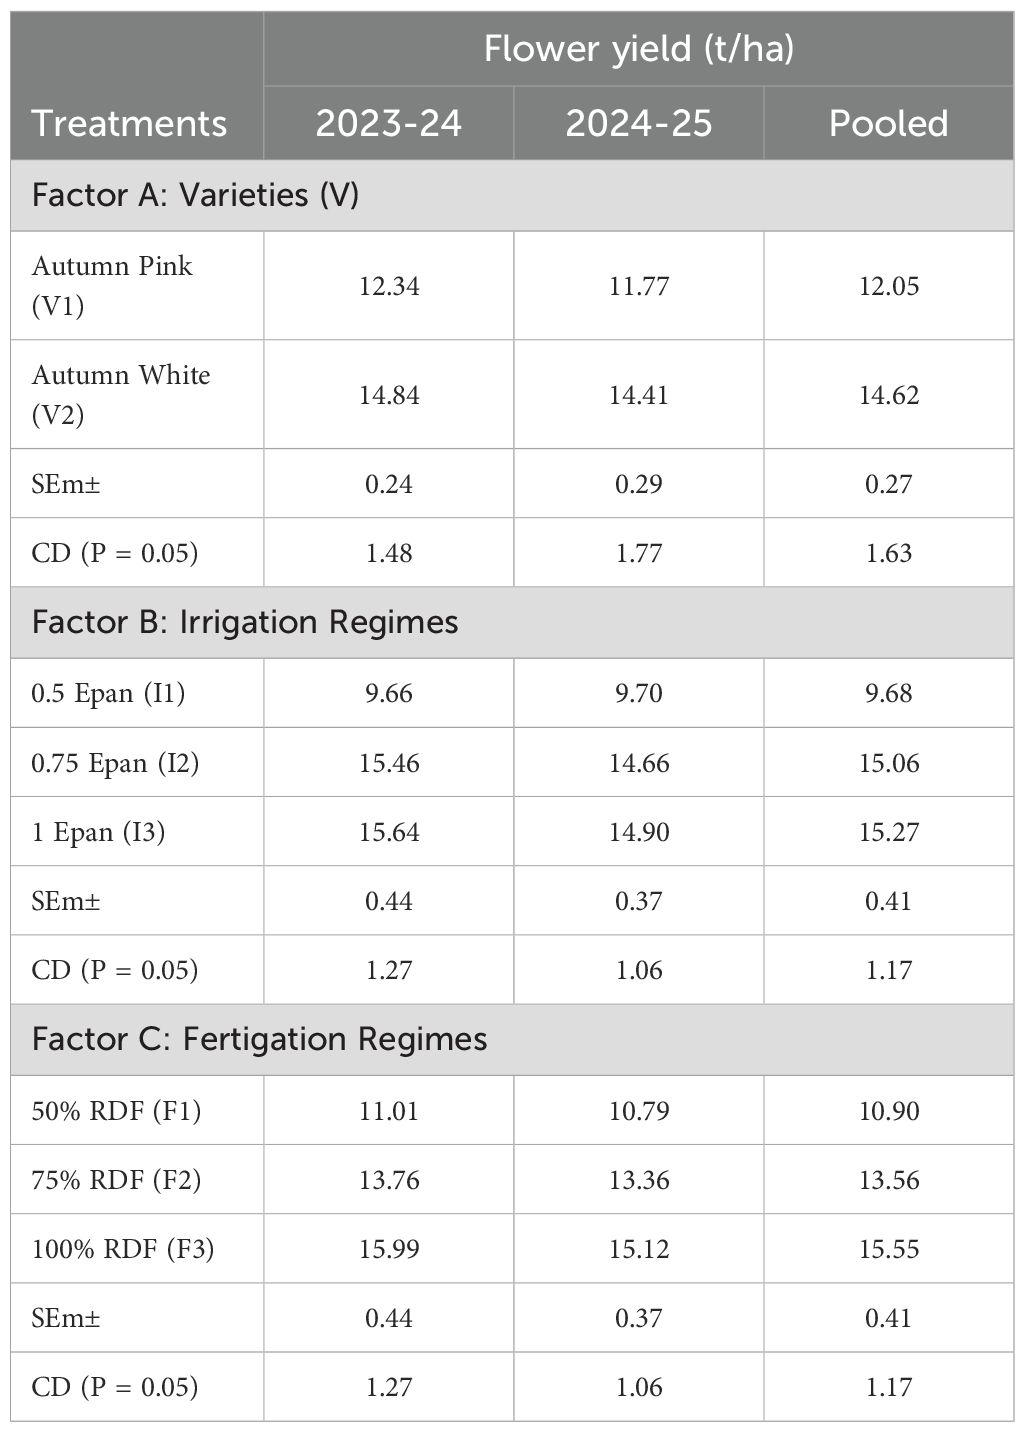
Table 5. Flower yield of chrysanthemum (t/ha) as influenced by different cultivars, irrigation levels and fertigation regimes during 2023–2024, 2024–2025 and pooled data.
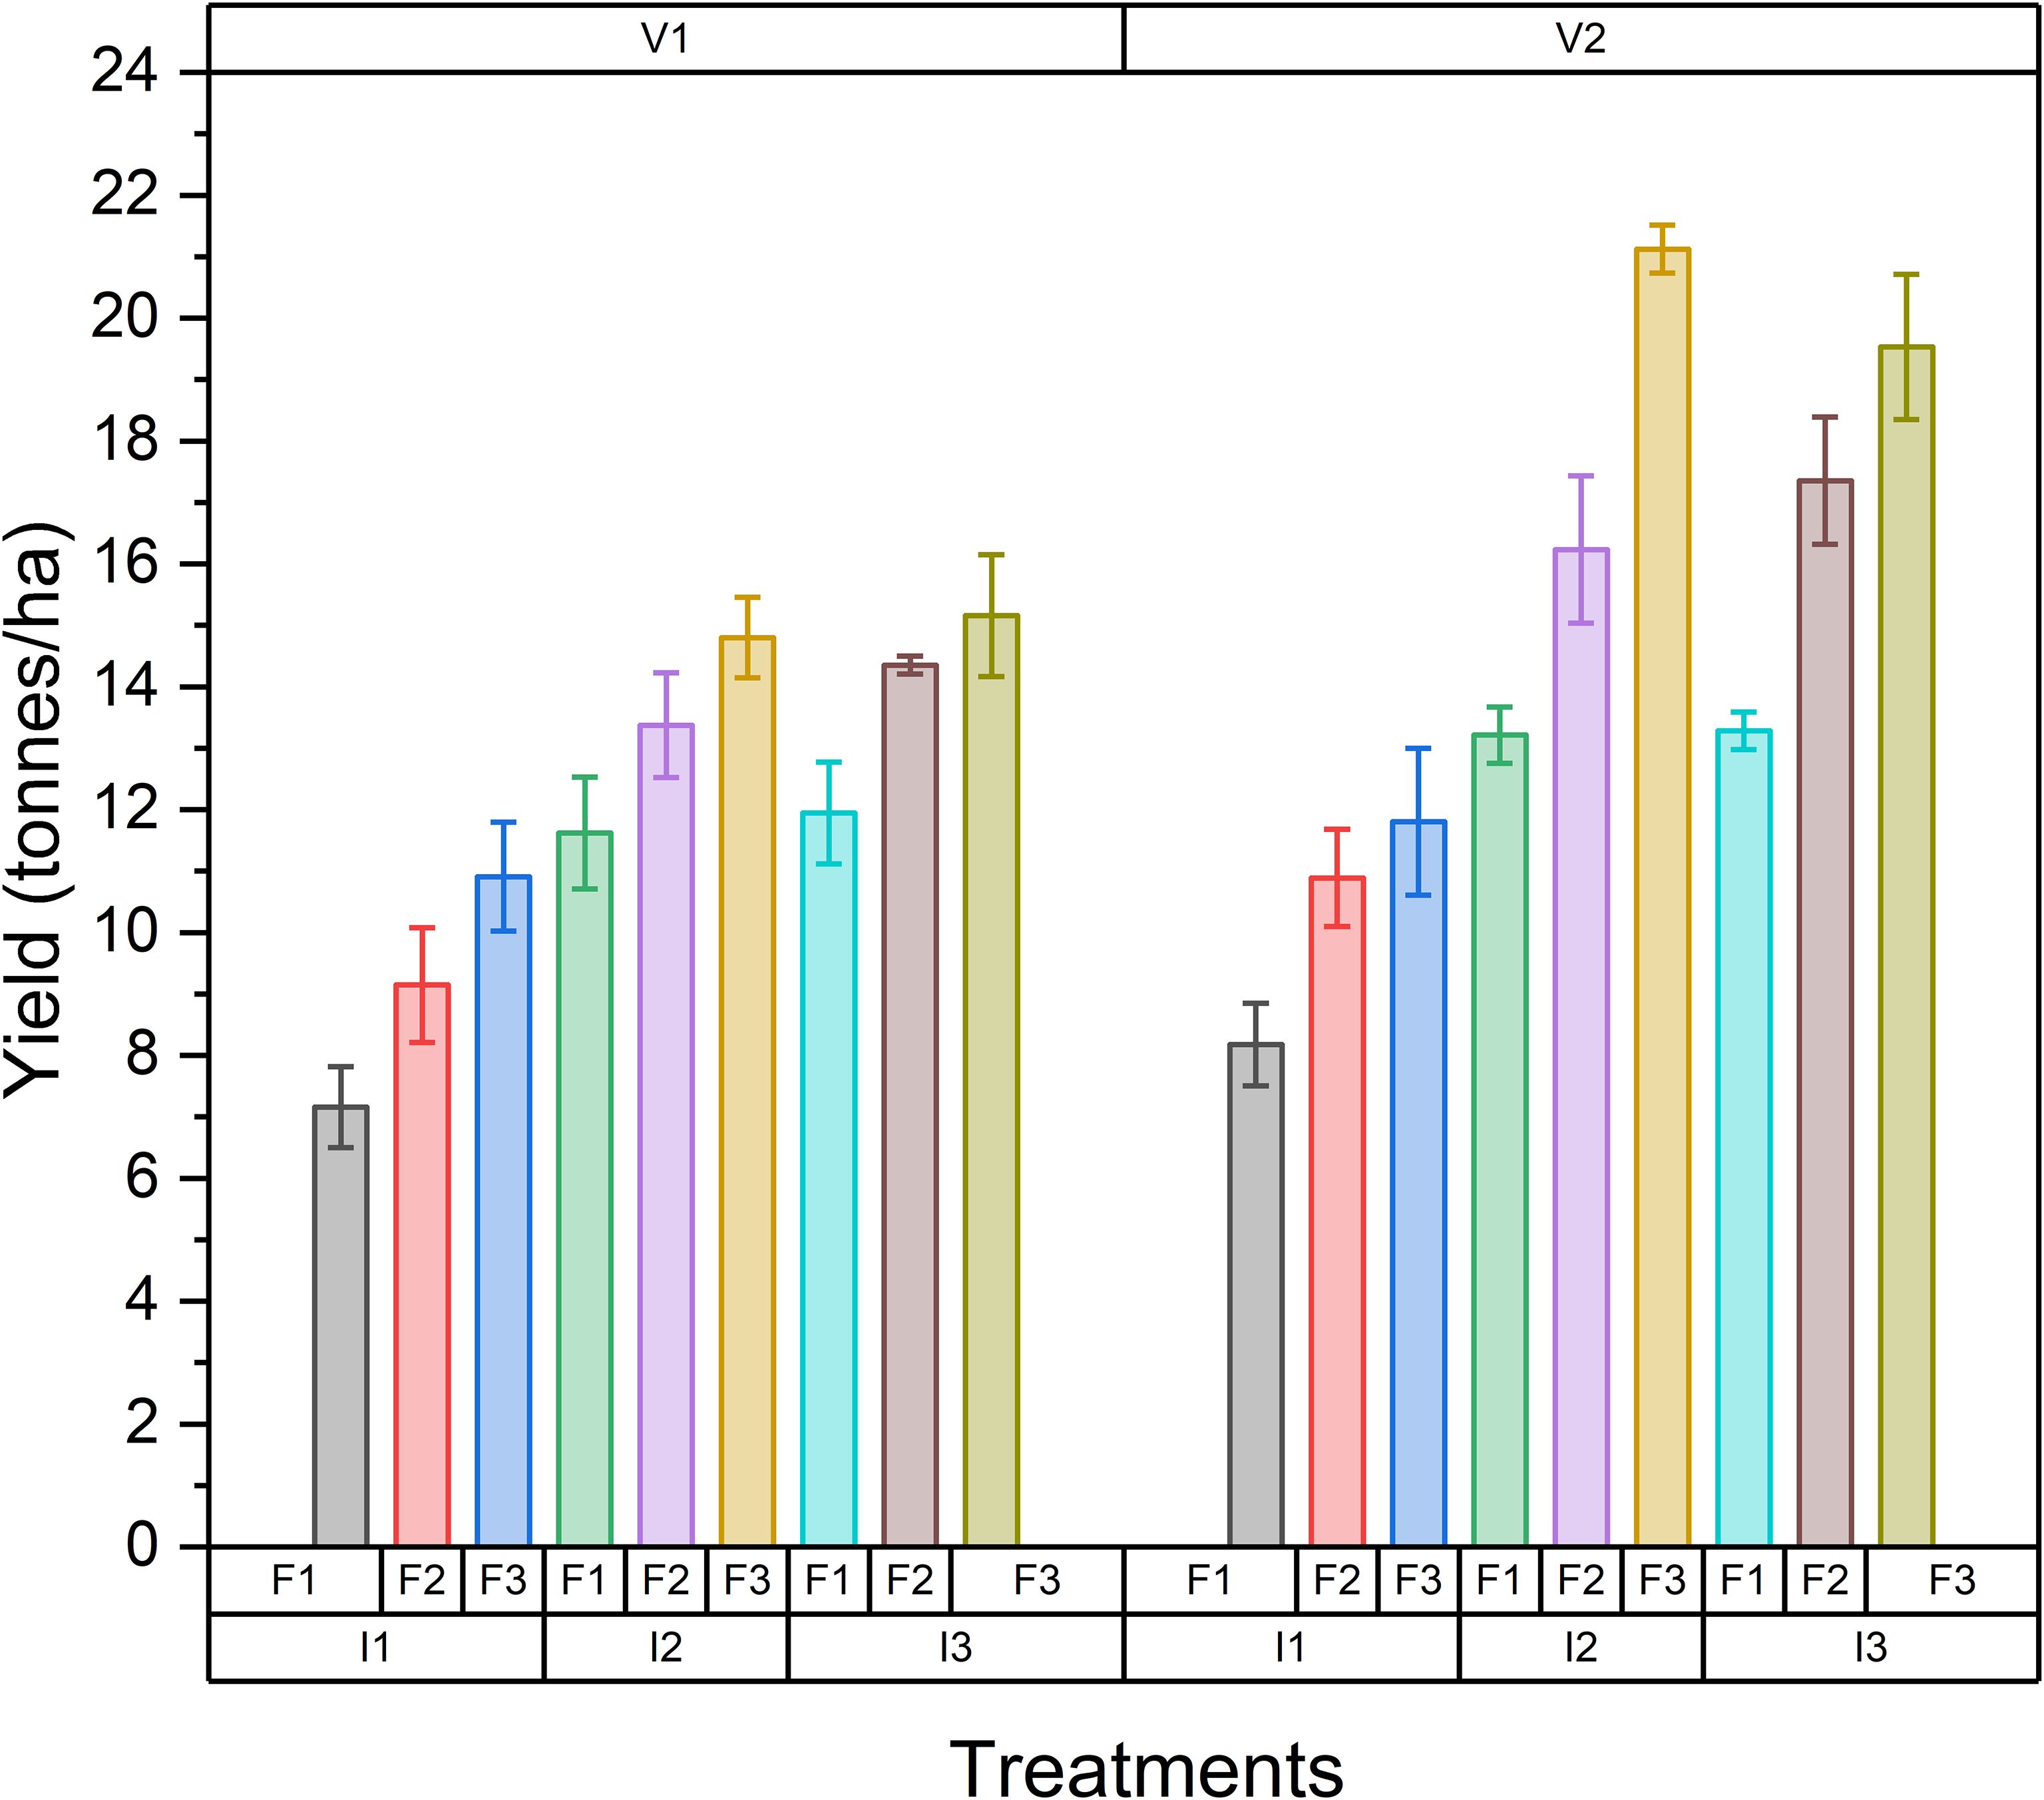
Figure 8. Influence of different cultivars, irrigation and fertigation levels on flower yield (t/ha).
Irrigation at 1.0 Epan (I3) led to the highest flower yield across both years, with yields of 15.64 t/ha in 2023–24 and 14.90 t/ha in 2024–25, resulting in a pooled yield of 15.27 t/ha. This was closely followed by 0.75 Epan (I2), which yielded 15.46 t/ha in 2023–24 and 14.66 t/ha in 2024–25, with a pooled average of 15.06 t/ha. The lowest yields were observed in 0.5 Epan (I1), with 9.66 t/ha and 9.70 t/ha across the two years, resulting in a pooled yield of 9.68 t/ha. These results indicated that higher irrigation levels, especially at 1.0 Epan, provided sufficient moisture for optimal crop growth and flower production. However, 0.75 Epan level is significantly on par and could also be a water-efficient regime while still maintaining high flower yield. Higher flower yield was recorded through drip irrigation might be due to the fact that the optimum moisture in the vicinity of root zone throughout the crop growth period enhanced the vegetative growth in the form of higher plant height, dry matter production, leaf area, and number of branches per plant of the crop, thereby increasing in the photosynthesis and efficient translocation of photosynthates towards the reproductive parts, which increased the number of flowers per plant, flower diameter, and flower fresh weight per plant and finally resulted in to increased flower yield. Yadav et al. (2020) reported that 60% of cumulative pan evaporation (CPE) water and 80% water solubilizing fertilizer (WSF) through drip gave the maximum yield of Gladiolus (110119 spikes ha-1) and (110119 corms ha-1), which is 29% more than the conventional irrigation method. The results also revealed that the maximum water use efficiency was recorded with 60% CPE water by drip irrigation (72.52%) over control (22.79%). Chitra et al. (2023), reported that the flower yield recorded was significantly higher at drip irrigation scheduled at 1.2 Epan (12.11 t/ha) than at 1.0 Epan (10.33 t/ha) and 0.8 Epan (10.05 t/ha) and flower yield was akin between 1.0 Epan and 0.8 Epan. Similar results were also reported by Raj and Sinha (2021), Jawaharlal (2017), and Turan et al. (2015). Patra et al. (2017) concluded that the highest flower yield was obtained, when tuberose crop was irrigated at IW/CPE 1.0. This result was statistically similar to the moderate irrigation level at IW/CPE 0.8. The lowest values were significantly recorded when the irrigation level was at IW/CPE 0.4. The results obtained are consistent with Khanam et al. (2017); Kabariel and Kannan (2015), and Pal et al. (2019).
Fertigation at 100% RDF (F3) consistently produced the highest flower yields, with 15.99 t/ha in 2023–24 and 15.12 t/ha in 2024–25, resulting in a pooled yield of 15.55 t/ha. Fertigation at 75% RDF (F2) showed moderate yields of 13.76 t/ha and 13.36 t/ha, with a pooled average of 13.56 t/ha. The lowest yields were recorded under 50% RDF (F1), with 11.01 t/ha in 2023–24 and 10.79 t/ha in 2024–25, giving a pooled yield of 10.90 t/ha. The increase in fertigation levels, particularly at 100% RDF, likely provided adequate nutrient availability, enhancing vegetative growth and flower production. Flower yield is a cumulative effect of yield attributes like number of flowers per plant, flower diameter, and flower fresh weight. Fertilizers applied through drip irrigation at frequent intervals of time in small quantities increased the fertilizer use efficiency and nutrient uptake as it prevents the loss of nutrients by leaching, erosion as well as by weeds. Effective and efficient utilization of water and nutrients by the plants, which generated favorable conditions for growth and development by enhancing metabolic processes in the plant system. Chitra et al. (2023) reported that the flower yield was recorded significantly higher at 125% recommended dose of NK (11.48 t/ha) than 75% (9.98 t/ha) and on par with 100% recommended dose of NK (11.03 t/ha). Similar results were also reported by Kabariel and Kannan (2015); Dikr and Belete (2017); Rahmani et al. (2012). However, a significant increase in flower yield (t/ha) was observed under (V2I2F3) treatment (22.20, 20.04 t/ha) during 2023–24 and 2024–25, with a pooled average of (21.12 t/ha) followed by V2I3F3 (19.53 t/ha), V2I3F2 (17.35 t/ha) whereas, it yielded lowest under V1I1F1 treatment combination (7.15, 7.17 t/ha) with a pooled yield of (7.16 t/ha) during 2023–24 and 2024–25,respectively.
Economic profitability
The economic analysis of chrysanthemum cultivation under various cultivars, irrigation regimes, and fertigation levels for the years 2023-24, 2024-25, and the pooled data is presented in (Table 6 and Figure 9). The cost of cultivation varied across treatments due to differences in different cultivars, irrigation and fertigation levels. The lowest cost of cultivation was observed in the V1I1F1 treatment (Autumn pink + Irrigation Scheduled at 0.5 Epan + 50% RDF), with pooled cost of cultivation of 4692.58 USD, while the highest cost of cultivation was recorded in V2I3F3 (Autumn white + Irrigation Scheduled at 1.0 Epan + 100% RDF), with pooled COC of4793.75 USD. The higher cost of cultivation in treatments with higher irrigation and fertigation levels can be attributed to increased input costs for water and fertilizer. Among all the treatments, V2I2F3 (Autumn white + Irrigation Scheduled at 0.75 Epan + 100% RDF) consistently showed the highest gross returns, net returns, and profitability across both the years and pooled data. In the 2023-24 season, the gross returns under V2I2F3 were 15062.33 USD which slightly declined to 13970.93 USD in 2024-25, resulting in a pooled gross return of 14516.63 USD. Net returns for the same treatment were 10202.34 USD and 9261.54 USD for the 2023-24 and 2024-25 years respectively, pooling to 9731.94 USD, reflecting the overall best performance. The higher returns can be attributed to better growth and yield outcomes under the autumn white cultivar along with optimal fertigation and irrigation, enhancing flower quality and quantity. Similarly, V2I3F3 (Autumn white + Irrigation Scheduled at 1.0 Epan + 100% RDF) also exhibited robust economic performance, with the gross returns of 14661.48 USD to 13790.88 USD in 2023-24 and 2024-25 respectively, resulting in a pooled gross return of 14226.18 USD. Net returns for the same treatment were 9792.84 USD to 9072.02 USD for the 2023-24 and 2024-25 years respectively, pooling to 9432.43 USD although slightly lower than V2I2F3, this treatment still demonstrated substantial profitability due to efficient water and nutrient management, making a next best alternative after V2I2F3. In contrast, the treatments with lower irrigation levels and fertigation rates, such as V1I1F1 (Autumn pink + Irrigation Scheduled at 0.5 Epan + 50% RDF) recorded the lowest returns. In 2023-24, the gross returns for V1I1F1 were 9555.83 USD, which decreased to 8379.96 USD in 2024-25, yielding a pooled gross return of 8967.90 USD. Due to lower flower yield and quality under least irrigation and fertigation, net returns for this treatment remained considerably lower, for both the years (i.e., 4788.48 USD and 3762.15 USD) with pooled net returns of 4275.32 USD. Among all the treatments, the highest pooled B:C ratio was observed in V2I2F3 (Autumn white + Irrigation Scheduled at 0.75 Epan + 100% RDF) which recorded a ratio of 3.03. This high value reflects the combined benefits of increased water and nutrient availability leading to better yields and profitability. The strong performance of the V2I2F3 treatment highlights the importance of optimizing irrigation and fertigation levels for maximum returns. Similarly, the treatment V2I3F3 (Autumn white + Irrigation Scheduled at 1.0 Epan + 100% RDF) also exhibited a strong pooled B:C ratio of 2.97 followed by V2I3F2 (i.e 2.92). This treatment, V2I3F3 (Autumn white + Irrigation Scheduled at 1.0 Epan + 100% RDF) is the second best option, reinforcing the trend that higher input levels, when managed efficiently, lead to better profitability. On the other hand, treatments with lower input levels, particularly V1I1F1, recorded the lowest B:C ratio, which had a pooled B:C ratio of 1.91, showing that these configurations are less profitable despite having lower costs of cultivation and these treatments resulted in lower returns compared to treatments with higher fertigation and irrigation inputs.
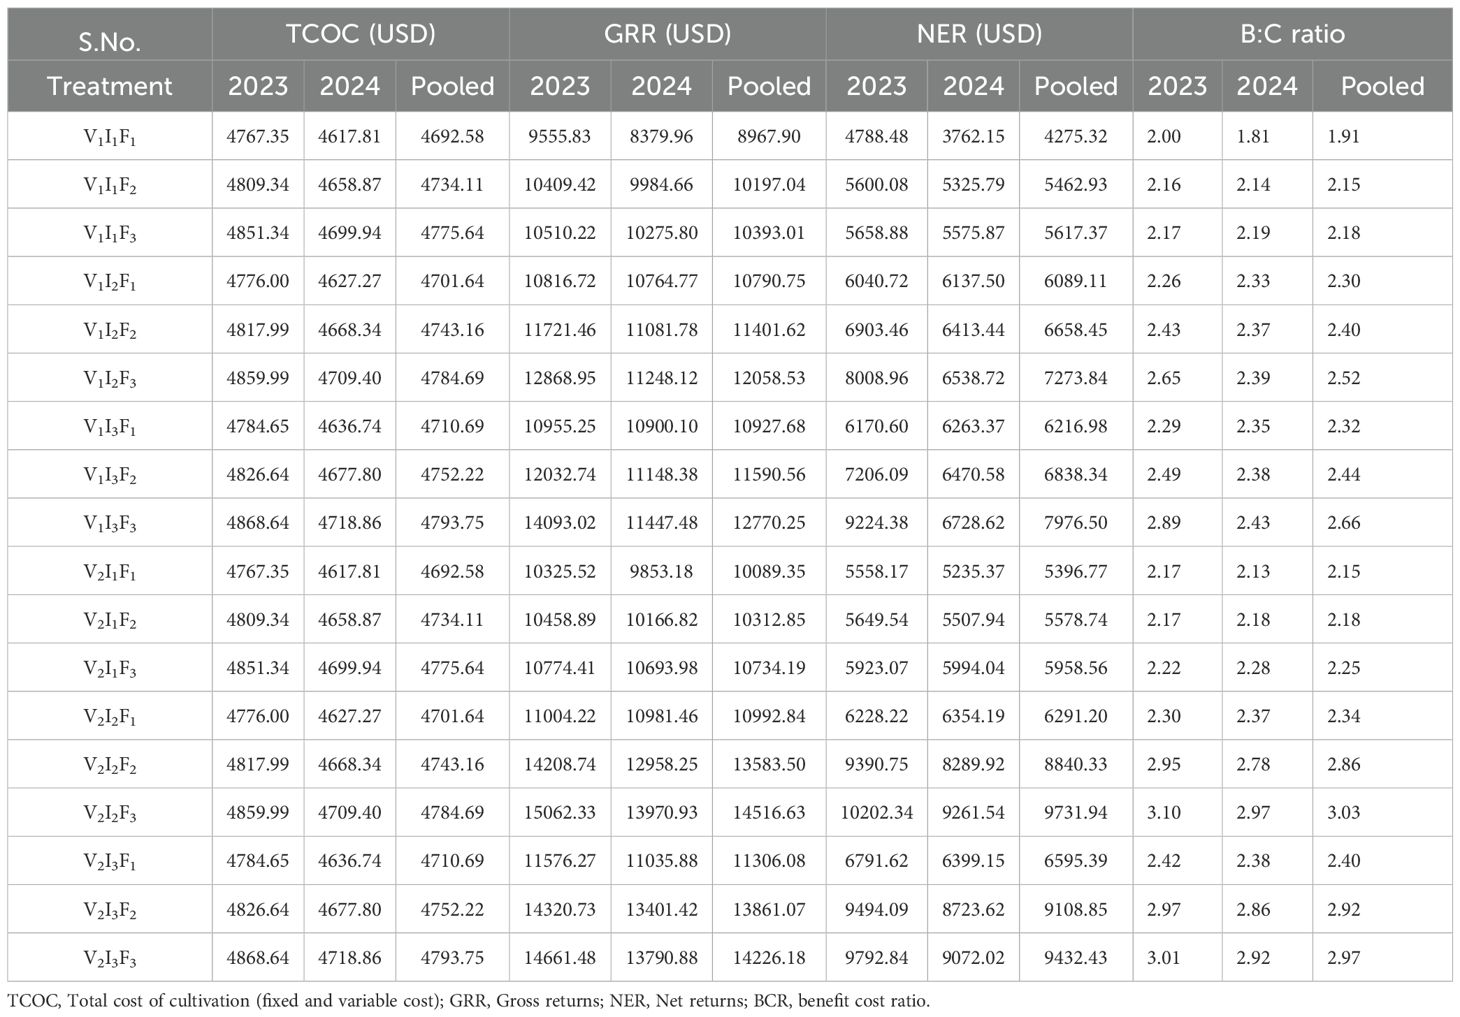
Table 6. Economic assessment of chrysanthemum cultivars under different irrigation and fertigation regimes during (2023, 2024 and pooled data).
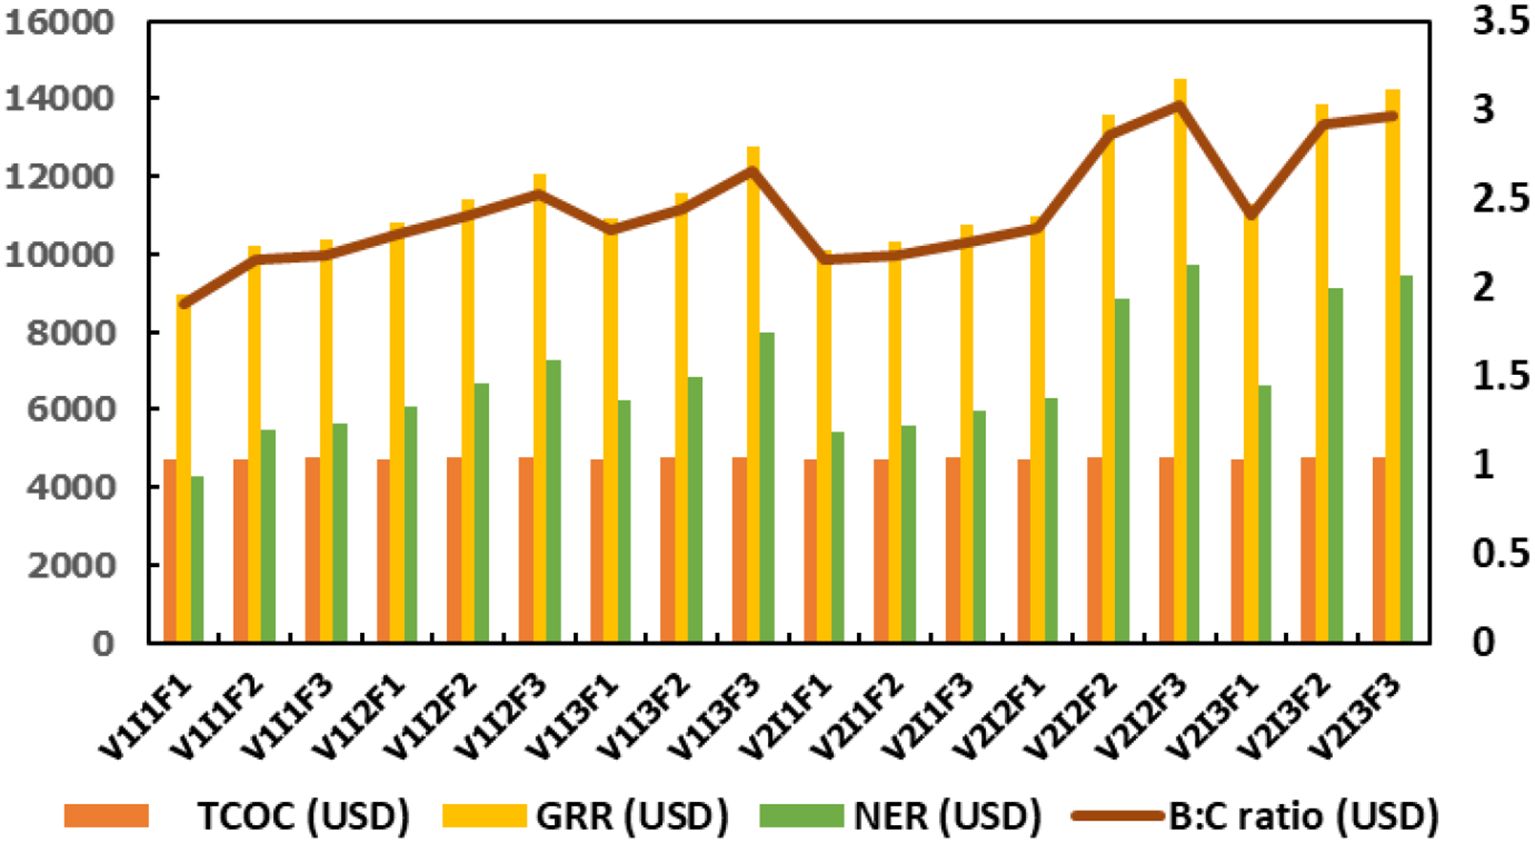
Figure 9. Economic analysis of chrysanthemum influenced by different cultivars, irrigation regimes and fertigation levels.
Overall, the results indicated that autumn white cultivars combined with higher irrigation levels (0.75 Epan and 1.0 Epan) and fertigation rates (100% RDF) resulted in greater economic viability in chrysanthemum cultivation. The pooled data further confirms that the combination of autumn white cultivars along with adequate irrigation, and higher fertigation levels is crucial for maximizing chrysanthemum profitability. The increase in income may be attributed to the application of water-soluble fertilizers through the drip system, which ensures efficient and uniform fertilizer distribution with minimal labor involvement, thereby enhancing productivity and produce quality. Additionally, the recommended dose of fertilizer applied through fertigation helps reduce cultivation costs while increasing production, resulting in a higher benefit-cost ratio. These findings align with previous studies, which indicate that drip irrigation with 60% cumulative pan evaporation (CPE) water and 80% water-soluble fertilizer (I1F1) yielded superior results in gladiolus, achieving maximum net returns of 9866.32 USD per hectare approximately 1.50 times higher than the control (6421.04 USD per hectare) with a benefit-cost ratio of 2.51 compared to 1.46 in the control (Yadav et al., 2020). Similar results were reported by Gupta et al. (2010), who found that adopting a drip irrigation system generated the highest income in capsicum compared to conventional methods. The maximum benefit-cost ratio was observed with the same treatment combination, i.e., 80% ET through drip irrigation and 80% of the recommended NPK through fertigation. The presented data also align with the findings of Biswas (2010). Treatments with lower fertigation and irrigation levels, particularly those using flatbed configurations, resulted in lower economic returns due to reduced yield. Conversely, economic analysis revealed that higher moisture regimes resulted in higher net returns but lower benefit-cost ratios. Despite higher moisture levels promoting certain growth aspects, the economic yield of tuberose was not optimal, leading to lower returns compared to lower moisture regimes (Khanam et al., 2017). Pal et al. (2019) reported similar findings in their studies on tuberose economics. These findings emphasize the significance of optimizing both water and nutrient management through drip irrigation and fertigation to improve the sustainability and profitability of chrysanthemum cultivation, particularly in water-scarce regions. This research offers a practical framework for farmers and policymakers to implement efficient irrigation and fertigation schedules, ultimately enhancing resource utilization and profitability in chrysanthemum production. The final results revealed that the Autumn White cultivar consistently outperformed Autumn Pink in terms of flower yield, water use efficiency, and economic returns. Among different irrigation regimes, the highest water use efficiency was observed at 0.75 Epan, similarly the highest fertigation level (100% RDF) produced the better results in yield and economic benefits. Economic analysis showed that the treatment combination V2I2F3 (Autumn White + Irrigation at 0.75 Epan + 100% RDF) consistently achieved the higher gross returns, net returns, and profitability across both years and pooled data, concluded that optimizing irrigation and fertigation strategies, particularly for commercial chrysanthemum cultivars, can significantly improves the profitability and sustainability, especially in water-scarce regions.
Conclusion
This study assessed the impact of different irrigation and fertigation management practices on yield, water use efficiency, and economic feasibility of chrysanthemum (Chrysanthemum morifolium Ramat.) cultivars. The field experiment was laid out in a split-plot design, with irrigation as the main treatment and fertigation as the sub-treatment, comprising three irrigation and three fertigation levels. The field trial was conducted during the rabi seasons of 2023–24 and 2024–25 at the Precision Farming Development Centre (PFDC), Water Technology Centre, ICAR–Indian Agricultural Research Institute, New Delhi, India. The results revealed that the autumn white cultivars consistently outperformed the pink cultivars, producing higher flower yield (%), water use efficiency (%), and water productivity (%). This superiority could be attributed to the inherent genetic traits of each cultivar and environmental factors, which are directly linked to individual flower weight and, consequently, overall flower yield per plot. The study further demonstrated that drip irrigation and fertigation significantly enhanced the growth, yield, water productivity, and economic returns of chrysanthemum cultivars. Irrigation at 0.75 Epan resulted in the highest flower yield, suggesting it as a more water-efficient option without compromising productivity. Likewise, irrigation at 1.0 Epan performed nearly on par with the 0.75 Epan treatment. Fertigation with 100% of the Recommended Dose of Fertilizers (RDF) achieved the highest flower yield and economic returns, emphasizing the importance of adequate nutrient supply for optimal crop performance. The combination of autumn white cultivars (21.5% higher yield and 21% higher WUE compared to autumn pink cultivars) with 0.75 Epan irrigation and 100% RDF (V2I2F3) proved to be the most effective treatment, maximizing yield, water use efficiency, and profitability. The study demonstrates that irrigation at 0.75 Epan combined with full fertigation (100% RDF) can significantly increase yield, water use efficiency, and profitability in chrysanthemum farming. Adoption of such optimized approaches can help guide resource-efficient and sustainable floriculture in water-scarce areas. This study findings are based on two rabi seasons at a single agro-climatic region, which may limit its broader applicability and thus should be assessed in different soil types and climatic conditions to draw concrete inferences. Future research should focus on the integrate sensor-based irrigation scheduling and advanced fertigation technologies to further refine water–nutrient management in chrysanthemum production.
Data availability statement
The raw data supporting the conclusions of this article will be made available by the authors, without undue reservation.
Author contributions
BG: Methodology, Investigation, Writing – review & editing, Writing – original draft. DG: Visualization, Writing – review & editing, Conceptualization, Supervision. PB: Writing – review & editing, Supervision, Visualization, Conceptualization. AT: Writing – review & editing. MS: Writing – review & editing. SB: Writing – review & editing. SP: Writing – review & editing. JR: Writing – review & editing.
Funding
The author(s) declare that no financial support was received for the research, and/or publication of this article.
Acknowledgments
We are thankful to the Water Technology Centre, ICAR-Indian Agricultural Research Institute, New Delhi for successful conduct of the experiment and for providing necessary laboratory facilities.
Conflict of interest
The authors declare that the research was conducted in the absence of any commercial or financial relationships that could be construed as a potential conflict of interest.
The author(s) declared that they were an editorial board member of Frontiers, at the time of submission. This had no impact on the peer review process and the final decision.
Generative AI statement
The author(s) declare that no Generative AI was used in the creation of this manuscript.
Any alternative text (alt text) provided alongside figures in this article has been generated by Frontiers with the support of artificial intelligence and reasonable efforts have been made to ensure accuracy, including review by the authors wherever possible. If you identify any issues, please contact us.
Publisher’s note
All claims expressed in this article are solely those of the authors and do not necessarily represent those of their affiliated organizations, or those of the publisher, the editors and the reviewers. Any product that may be evaluated in this article, or claim that may be made by its manufacturer, is not guaranteed or endorsed by the publisher.
References
Banik M., Ghatak P., Ray R., and Patra S. K. (2018). Yield, water use and economics of tuberose as influenced by different irrigation scheduling in Indo-Gangetic plains. Int. J. Curr. Microbiol. Appl. Sci. 7, 922–930. doi: 10.20546/ijcmas.2018.704.098
Biradur M. S. and Khan M. M. (1996). Performance of exotic gerbera varieties under low cost plastic greenhouse. Lalbaugh 41, 46–52.
Bisht D., Kumar A., and Kumar P. (2010). “Standardization of media composition for pot mum production in open field under Tarai conditions,” in Abstract book, National Symposium on Life style Floriculture Challenges and Opportunities, Nauni: Notheastern Hill University (NHU). 19–21.
Biswas B. C. (2010). Fertigation in high tech agriculture A success story of A lady farmer. Fertiliser Marketing News 41, 4–8.
Chitra V., Revathi P., Pasha M. L., Srijaya T., and Yakadri M. (2023). Effect of Drip Irrigation and Fertigation Levels on Yield Attributes and Yield of African Marigold (Tagetes erecta L.) during Rabi. Int. J. Environ. Climate Change 13, 1344–1349. doi: 10.9734/ijecc/2023/v13i102786
Dikr W. and Belete K. (2017). Review on the effect of organic fertilizers, biofertilizers and inorganic fertilizers (NPK) on growth and flower yield of marigold (Targetes erecta L.). Acad. Res. J. Agric. Sci. Res. 5, 192–204.
Erdem T., Arın L., Erdem Y., Polat S., Deveci M., and Okursoy H and Gultaş H. T. (2010). Yield and quality response of drip irrigated broccoli (Brassica oleracea L. var. italica) under different irrigation regimes, nitrogen applications and cultivation periods. Agric. Water Manage. 97, 681–688. doi: 10.1016/j.agwat.2009.12.011
Farias M. F., De Saad J. C. C., and Denise M. C. (2009). Effect of soil-water tension on cut chrysanthemum floral quality and longevity. Appl. Res. Agrotechnology 2, 141–145.
Goldberg D. and Shumeli M. (1971). Sprinkle and trickle irrigation of green pepper in an arid zone. Horticulture Sci. 6, 559–562. doi: 10.21273/HORTSCI.6.6.559
Gomez K. A. and Gomez A. A. (1984). Statistical Procedures for Agricultural Research. New York: John Wiley and Sons Publishers, 97–107.
Gupta A. J., Ahmed M. F., and Bhat F. N. (2010). Studies on yield, quality, water, and fertilizer use efficiency of capsicum under drip irrigation and fertigation. Indian J. Horticulture 67, 213–218.
Incrocci L., Massa D., and Pardossi A. (2017). New trends in the fertigation management of irrigated vegeta ble crops. Horticulturae 3, 37. doi: 10.3390/horticulturae3020037
Jawaharlal D. (2017). Water use efficiency of chrysanthemum crop for different mulches under drip irrigation system in semi arid region. Int. J. Agric. Sci., 0975–3710.
Kabariel J. and Kannan M. (2015). 10. Effect of irrigation regimes and fertigation levels on growth parameters of tuberose (Polianthes tuberosa)’Prajwal’under black polythene sheet mulched eco system by kabariel_ J. and M. Kannan. Life Sci. Leaflets 69, 62–To.
Kaushal S. and Bala M. (2018). DUS characterization of chrysanthemum (Chrysanthemum morifolium Ramat.) genotypes suita ble for pot culture. J. Ornamental Horticulture 21, 102.
Khanam R., Kundu D., Thingujam U., and Patra S. K. (2017). Effect of different irrigation level on growth, yield and water use efficiency of tuberose in lower gangetic plain of West Bengal, India. Int. J. Curr. Microbiol. Appl. Sci. 6, 1944–1952. doi: 10.20546/ijcmas.2017.608.230
Kumar V. S., Nair S. A., Nair A. K., Laxman R. H., and Kalaivanan D. (2021). Influence of phenophase based irrigation and fertigation schedule on vegetative performance of chrysanthemum (Dendranthema grandiflora Tzelev.) var. Marigold. J. Horticultural Sci. 16 (2), 222–233.
Mba P. C., Njoku J. N., and Uyeh D. D. (2025). Enhancing resilience in specialty crop production in a changing climate through smart systems adoption. Smart Agric. Technol. 11, 100897. doi: 10.1016/j.atech.2025.100897
Melvin R. K. and James J. K. (2001). “Fertilizing shade and ornamental trees,” in MSU extension forestry bulletin (Bozeman).
Nikam B. S., Badge S. A., and Pawar A. R. (2017). Growth and seed yield of annual chrysanthemum as influenced by different levels of nitrogen and potassium. International. J. Curr. Microbiol. Appl. Sci. 7, 563–568. doi: 10.20546/ijcmas.2018.709.067
NITI Aayog/Indian government review (2023). Efficiency of Micro-Irrigation in economizing water use in India (policy/technical report) New Delhi: Nithi Aayog.
Ornamental Chrysanthemum Market Report. (2024). Global market share analysis of cut flower trade: Chrysanthemums vs. other floriculture products. New Delhi, Nithi Aayog: Nauni, Notheastern Hill University (NHU).
Pal A., Adhikary R., Bera M., Garnayak R., and Roy R. (2019). Growing of tube rose with different irrigation treatment under alluvial soil of West Bengal. J. Pharmacognosy Phytochem. 8, 4534–4538.
Patra S. K., Chaitanya A. K., and Ray R. (2017). Effects of different levels of irrigation on growth, flowering and bulb production in tuberose (Polianthes tuberosa L.). Int. J. Agric. Innov. Res. 5, 637–641.
Rahmani N., Taherkhani T., Zandi P., and Aghdam A. M. (2012). Effect of regulated deficit irrigation and nitrogen levels on flavonoid content and extract performance of marigold (Calendula officinalis L.). Ann. Biol. Res. 3, 2624–2630.
Raj J. and Sinha J. (2021). Effect of different levels of irrigation on yield and yield attributes of winter marigold crop (Tagetes erecta L.). Int. J. Plant Soil Science. 33, 269–275. doi: 10.9734/ijpss/2021/v33i2430777
Richards L. A. (1954). “Diagnosis and improvement of saline and alkaline soils,” in USDA handbook no.60(United States of America (USA).
Sassenrath G. F., Hanson J. D., Hendrickson J. R., Archer D. W., Halloran J. M., and Steiner J. J. (2009). “Principles of dynamic integrated agricultural systems: Lessons learned from an examination of southeast production systems,” in Agroecosystem managementfor ecological, social, and economic sustainability (Advances in Agroecology Series) (Taylor and Francis/CRC Press, Boca Raton, Florida, USA), 259–269.
Singh K. P. and Ramachandran N. (2002). Comparison of greenhouse having natural ventilation and fan and pad evaporate cooling systems for gerbera production. J. Ornamental Horticulture 5, 15–19.
Soujanya B., Gurjar D. S., Brahmanand P. S., Tiwari A. K., Meena S. L., Prasad S., et al. (2025). Enhancing water productivity and flower yield of tuberose through drip fertigation and optimized land configurations in semi-arid region. BioResources 20. doi: 10.15376/biores.20.2.4020-4032
Suvija N. V., Suresh J., Kumar R. S., and Kannan M. (2016). Evaluation of chrysanthemum (Chrysanthemum morifolium Ramat.) genotypes for loose flower, cut flower and pot mums. Int. J. Innov. Res. Adv. Stud. (IJIRAS) 3, 100–104.
Turan A., Ucar Y., and Kazaz S. (2015). Effects of different irrigation treatments on quality parameters of cut chrysanthemum. LIX: Horticulture. p. 419–426.
Yadav U., Agrawal N., Katre P., Tamrakar S. K., and Tripathi M. P. (2020). Effect of irrigation and fertigation on gladiolus crop water requirement, yield and water use efficiency in Chhattisgarh plain. Int. J. Curr. Microbiol. Appl. Sci. 9, 2913–2923. doi: 10.20546/ijcmas.2020.906.351
Yang T., Siddique K. H. M., and Liu K. (2020). Cropping systems in agriculture and their impact on soil health—A review. Global Ecol. Conserv. 23, e01118. doi: 10.1016/j.gecco.2020.e01118
Keywords: drip irrigation, autumn pink, autumn white, flower yield, water use efficiency, profitability
Citation: Gouthami B, Gurjar DS, Brahmanand PS, Tiwari AK, Singh MC, Babu S, Prasad S and Rajput J (2025) Standardization of irrigation and fertigation schedules for optimizing flower yield, water use efficiency and economic returns in chrysanthemum (Chrysanthemum morifolium Ramat.) cultivars under semi-arid conditions. Front. Agron. 7:1605713. doi: 10.3389/fagro.2025.1605713
Received: 03 April 2025; Accepted: 22 October 2025;
Published: 14 November 2025.
Edited by:
Nawab Ali, Michigan State University, United StatesReviewed by:
Wang Xiukang, Yan’an University, ChinaMina Devkota, International Center for Agricultural Research in the Dry Areas (ICARDA), Morocco
Copyright © 2025 Gouthami, Gurjar, Brahmanand, Tiwari, Singh, Babu, Prasad and Rajput. This is an open-access article distributed under the terms of the Creative Commons Attribution License (CC BY). The use, distribution or reproduction in other forums is permitted, provided the original author(s) and the copyright owner(s) are credited and that the original publication in this journal is cited, in accordance with accepted academic practice. No use, distribution or reproduction is permitted which does not comply with these terms.
*Correspondence: B. Gouthami, YmFzYXJhdmVuaS5nb3V0aGFtaTEyM0BnbWFpbC5jb20=