 Gerald Kyalo1*†George Chemining’wa2
 Peter Charles Apunyo3*
 Nhamo Nhamo4Ibrahim Wanyama5Frank Mussgnug6
- 1Department of Coffee Development, Ministry of Agriculture, Animal Industry and Fisheries, Entebbe, Uganda
- 2Department of Plant Science and Crop Production, University of Nairobi, Nairobi, Kenya
- 3Department of Crop Production and Management, Busitema University, Tororo, Uganda
- 4International Center for Biosaline Agriculture (ICBA), Dubai, United Arab Emirates
- 5International Livestock Research Institute (ILRI), Nairobi, Kenya
- 6Centre for International Migration and Development (CIM), Deutsche Gesellschaft fuer Internationale Zusammenarbeit (GIZ), Eschborn, Germany
The yields and supply of rice have continuously remained low despite increase in demand. A study was carried out using Randomized Complete Block Design to determine the indigenous nutrient supply (INS) of lowland rice soils and the nutrient use efficiency of fertilizer in order to develop a site specific nutrient management option for eastern Uganda. Indigenous nutrient supply was determined by the omission plot technique using five treatments; control (no fertilizer), NPK, PK (-N), NK (-P) and NP (-K) with NPK rates of 58.2 kg N ha-1, 13.2 kg P ha-1 and 49 kg K ha-1. A total of 27 omission experiments were set up over a two-year period with each farmer acting as a replicate.The grain yield ranged from 1.1- 8.7 t ha-1 with the mean of 3.8 t ha-1. The full NPK treatment yielded significantly higher than PK and control treatments (NPK plots= 4.83 t ha-1). The yield in NPK treatment was 73, 40, 23 and 25% higher than control, PK (-N), NK (-P) and NP (-K) treatments, respectively. There was no significant difference between treatments for agronomic efficiency of N.The mean RE was 31% N, 9.9% P and 59% K with NPK treatment recording an average RE for N of 46.9%. The RE for P was low at 19% (for NPK), 9.9% (for control and NK), 9.3% for NP and 1.4 for PK. Average IUE was 36.9 kg grain kg−1 N, 270 kg grain kg−1 P and 28 kg grain kg−1 K, respectively. The average indigenous nutrient supplies for nitrogen (INS), phosphorus (IPS) and potassium (IKS) were 52, 9.7 and 87.2 kg ha–1, respectively. The Gross return over fertilizer cost (GRF) for the full NPK treatment was $1,275.3 ha–1 with gains of $270 ha-1 when compared to the control. The calculated respective N, P and K doses were 63, 12.6 and 24.5 kg ha–1 indicating a saving of 49, 74 and 59% on applied NPK respectively. This study has shown that fertilizer use in eastern Uganda is profitable and SSNM has demonstrated big savings on fertilizer N, P and K.
1 Introduction
Rice (Oryza sativa L.) is a key nutritional crop and it is a staple to almost a half of the world’s population (Fan et al., 2016). In order to face the increasing demand for food and to meet the needs of a growing population, the production of rice must be enhanced up to 70% by 2050 (Awio et al., 2022; Godfray et al., 2010). In Uganda, rice is one of the most important cereal crops (Bua and Ojirot, 2014). It is mostly grown by smallholder farmers in eastern and northern parts of the country for income, although some of the household production is retained for consumption (Akongo et al., 2017). Rice is also the most traded food commodity across borders in the East African Community (EAC) region, compared to traditional staples like bananas. According to Oonyu (2011), rice is second to maize as the food commodity most imported into, as well as most exported from the EAC. Over the last decade, the consumption of rice in the EAC has increased by 360% owing to the change in eating habits with urbanization (Nanfumba et al., 2013). As a result, supply of rice in Uganda and other EAC Partner States cannot keep-up with the rapidly expanding regional market demand.
Uganda produces up to 350,000 MT of rice annually which is equivalent to import substitution of about 104 million USD per year. The Government of Uganda set a target to produce 680,000 MT of rice by 2020 and generate at least USD 73 million worth of exports (MAAIF, 2016). Farmers in Uganda and sub-Saharan Africa (SSA) in general harvest on average 1–2 t ha-1 paddy rice, about 33% of the potential yield of 6 t ha-1 (Awio et al., 2022). The low yields and rice supply gap can be attributed to climatic constraints, poor seed quality, weeds, pests and diseases, low soil fertility, mineral toxicities and inadequate water supply (Dobermann and Fairhurst, 2000). Therefore, Uganda is still a net importer of rice, since domestic demand exceeds its supply/production (Barungi and Odokonyero, 2016).
To achieve potential rice yields, modern cultivars of rice require large amounts of fertilizers (Fazli et al., 2019). Among all fertilizers, nitrogen (N) is the most essential for plant development, growth and grain quality (Davies et al., 2020; Kichey et al., 2007). However, in developed economies, N use efficiency (NUE; defined as grain dry matter per unit of N available from the soil, fertilizer included), is very low and estimated to be approximately 33% of the applied N source (Saito et al., 2019; Raun and Johnson, 1999). Improved nutrient management can help reduce the yield gap as well as mitigating the negative impacts of excessive fertilizer applications. According to Hameed et al. (2019) citing Cassman and Harwood (1995), over-utilization of N regularly initiates pest destruction and lodging, bringing a decrease in quality and quantity of rice yield. Relatedly, excessive use of N may induce the acidity of the soil (Guo et al., 2010), water contamination and encourage nitrous oxide (N2O) emission (Hameed et al., 2019). However, the greatest benefit for improved nutrient management is found on farms with good crop management and few pest problems (Dobermann et al., 2002). Farmers in rainfed lowlands in Uganda and other parts of SSA grow a rice crop with minimal use of fertilizers and pesticides. For example, a survey in eastern Uganda found only 12% of lowland rice farmers using inorganic fertilizer albeit applying low rates of about 50 kg urea per hectare (Kyalo, 2016). Few farmers who apply fertilizers have insufficient knowledge about fertilizer use and recovery efficiencies hence they do not achieve maximum benefits from use of fertilizers (Saito et al., 2019). However, fertilizer application can increase the rice yield matching the indigenous N supply (Chivenge et al., 2021; Jing et al., 2007). There is therefore need to develop a framework for improved soil fertility management for lowland rice systems in Uganda. Nutrient use efficiency was described using agronomic indices namely partial factor productivity (PFP, kg crop yield per kg nutrient applied), agronomic efficiency (AE, kg crop yield increase per kg nutrient applied) and apparent recovery efficiency (RE, kg nutrient taken up per kg nutrient applied), physiological efficiency (PE, kg yield increase per kg nutrient taken up) and internal efficiency of N (IEN) (kg of grain per kg of nutrient taken up) (Cassman et al., 1998).
According to Dobermann et al. (2002), applying fertilizers on a field specific and cropping season specific basis also known as Site specific nutrient management (SSNM) improves rice yields, profit, plant nutrient uptake and N- use efficiency. The SSNM strategy aims to achieve sustainable, large, and economic yields through proper nutrient and crop management achieved through making efficient use of all available nutrient sources, following plant based N-management strategies, determining indigenous nutrient supply of the soil using omission plots and providing a crop with a balanced supply of nutrients. Dobermann et al. (2003) defined indigenous nutrient supply (INS) as the cumulative amount of that nutrient originating from all indigenous non-fertilizer sources that circulate through the soil solution surrounding the entire roots system during one complete crop cycle. Indigenous nutrient supply (INS) can be estimated by plant nutrient accumulation in a nutrient omission plot or estimated from grain yield measurements in small N, P, and K omission plots embedded in farmers’ fields if other nutrients are fully supplied and the harvest index is approximately 0.5. The use of SSNM has been shown to be a simple and effective way to increase nitrogen use efficiency. Adoption of SSNM requires an understanding and quantification of the indigenous supply of nutrients. Considering the growing importance of rice as cash and food crop, and the growing need to increase productivity, there is a quick need to understand some aspects of the soil nutrient status including soil indigenous supply and fertilizer use efficiency of the soils which will ultimately lead to fertilizer recommendations for farmers. The objective of this research was to determine the indigenous nutrient supply and nutrient use efficiency of lowland rice soils in eastern Uganda.
1.1 Materials and methods
1.1.1 Site description
The experiments were set up in Bugiri district (034’14.66” N, 33 44’ 56.04” E) of eastern Uganda in 2013 and 2014. In 2013, the experiment was set up in farmers’ fields in Buwunga Sub county while in 2014 the experiments were set up in farmers’ fields in Buluguyi Sub county. The change in site was due to a prolonged drought at Buwunga which resulted in insufficient water at the experimental site thus leading to a shift to Buluguyi Sub county. The soils covering most of Bugiri district are mainly loamy and sand loams with fine texture and rather loose structure. The soils are laterite and ferralitic, with deep reddish brown sandy loams mixed with clay loams and overlain by clayey subsurface horizons derived from gneiss and granites (Yost and Eswaran, 1990).
Soil characteristics of experimental sites are shown in Table 1. Bugiri district has two distinct rainfall seasons per year - April to June and August to November with a dry season lasting from December to March. The mean annual rainfall for Buwungu Sub county is 1,200 mm and Buluyu Sub county is 900 mm with the mean temperatures of 22°C and 28.1°C respectively with the month of February being the hottest. For majority of the farmers, rice is grown as a monocrop either twice or once a year with no known crop rotation regimes. Second season planting of rice is normally dependent on the arrival of the rains, and for some farmers it is not planted if the rains come late.
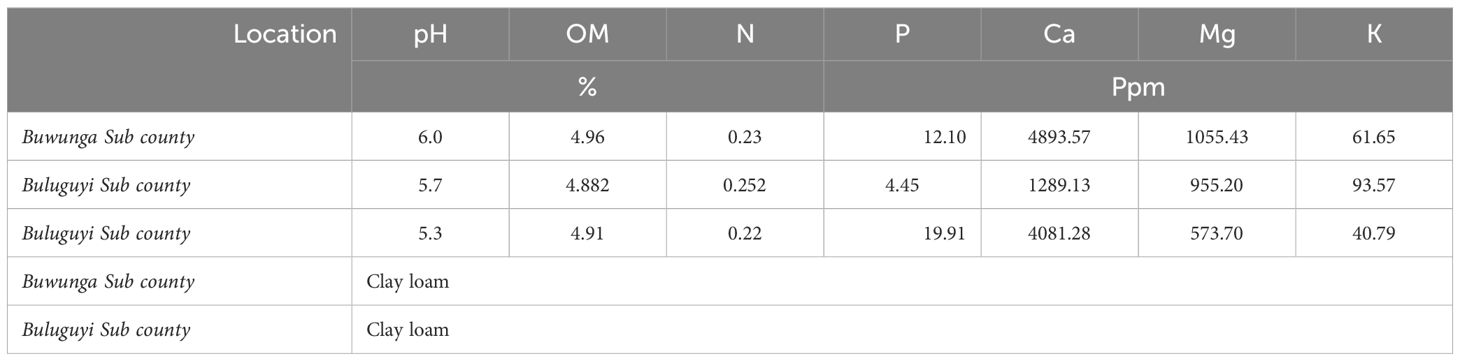
Table 1. Characteristics of soils in the experimental sites.
1.2 Experimental design and treatments
A nutrient omission trial was set up using Randomised Complete Block Design in farmers’ fields with a total of 21 farmers, 7 each in first season 2013 (2013A), first season 2014 (2014A) and second season 2014 (2014B). Consequently, a total of 21 omission experiments were set up over the two-year period. Each farmer acted as a block/replicate for each season. The experimental plots for each season were different. The trial was set up with five treatments; full N, P and K (NPK), omission of K with full N and P (NP-K), omission of P with full N and K (NK-P), omission of N with full P and K (PK-N), and a control where no fertilizer was applied. The full N, P and K applications rates used in the experiment were 58.3 kg N ha-1, 13.2 kg P ha-1 and 49 kg K ha-1, respectively. The rates were based on a yield target of 5 t ha-1 under SSNM (Fairhurst et al., 2007). Nitrogen was applied as urea (CO (NH2)2) 46% N; Phosphorus was applied in the form of triple super phosphate (TSP) 46% P2O5 (Ca (H2PO4)2H2O) while Potassium was applied in the form of muriate of potash (MOP), 50% K2O (KCL). Nitrogen was applied in three splits; 55, 35 and 35 kg ha-1 at basal, active tillering and panicle initiation stages, respectively. Potassium was applied in two equal splits (50% at basal and 50% at panicle initiation). All the phosphorus was applied basally.
In 2013B, the trial was not set up because the drought conditions persisted until November. All plots were 25 square meters (5m x 5m) and were separated by bunds to restrain water movement from one plot to another. All omission experiments were set up with farmer variety Bedinego because it was the most commonly grown variety in the area. Nurseries were sown at a rate of 100g per square metre equivalent to 5kg of seed in 500 m-2 and were transplanted at 21–28 days old. Rice plants were transplanted at a spacing of 25 cm x 25 cm with 2–3 seedlings per hill. Weeds were managed manually by hand weeding twice each season at 25–30 days after transplanting (DAT) and 40–50 DAT. In addition, all fields were sprayed with herbicides (satunil 60EC (40% Theobencarb and 20% propanil) at a rate of 200–500 l ha-1 at the beginning of the season to control weeds. All fields were sprayed with Orius (250gl-1 tebuconazole) at 750l ha-1 at panicle initiation to control rice blast. All experiments relied on rainfall for water requirements.
1.3 Data collection and analysis
In order to determine general properties of the soil, five soil cores were taken from a 0–15 cm depth in every plot and mixed to form one composite sample. The samples were analyzed at Kawanda Soil Science Laboratory using standard procedures (Okalebo et al., 2002) for pH, total carbon, total nitrogen, available P and exchangeable Ca, Mg, and K. Soil pH was measured using the glass electrode method with a soil-to-water ratio of 1:2.5 (Okalebo et al., 2002). Organic matter was measured using the potassium dichromate (K2Cr2O7) method (Nelson and Sommers, 1982). Total N was determined by Kjeldhal digestion. Available P was measured by Bray P1 method (Bray and Kurtz, 1945). Exchangeable bases were determined from an ammonium acetate extract by flame photometry (K+, Na+) and atomic absorption spectrophotometry (Ca2+, Mg2+). Particle size distribution (texture) was determined using the Bouyoucos (hydrometer) method.
Data from experimental plots were collected according to the standard evaluation system of rice (IRRI, 2002). Data were collected on plant height at 105 days after sowing (DAS), number of tillers at 89 DAT, number of panicles, grain yield and rice biomass dry weight at harvest. Panicles were counted prior to harvest. Plant height was taken on two hills per plot whereas numbers of tillers and panicles were taken from four hills (0.0625 m2 area). Plants were harvested from 12 hills in each plot at physiological maturity and used to determine % filled grains, harvest indices and nutrient concentrations in plant tissue. Nitrogen concentrations in grain and straw were measured by micro-Kjeldahl digestion, distillation and titration Bremner and Mulvaney (1982), tissue P by the molybdenum-blue calorimetric method and tissue K by atomic adsorption spectrometer after wet digestion. Grain and straw samples from the 12 hill sample were dried to constant weight at 70°C. Paddy grain yields were obtained from a central 5 m2 harvest area in each plot at harvest. Paddy yields and total biomass (grain + straw yields) were adjusted to 14% moisture content.
Optimum N, P and K doses were calculated following Driessen (1986):
Where, YNPK =yield in NPK plots, YPK = yield in N omission plot, YNK =yield in P omission plot, YNP = yield in K omission plot, NU =N use efficiency (40% in the current study), PU =P use efficiency (18%), and KU =K use efficiency (assuming 100%).
Gross return over fertilizer cost (GRF), which is the farm gate revenue from produced rice minus cost of fertilizer N applied and provides a relative measure for the benefit derived by farmers from the use of fertilizer, was calculated as follows: TFC = PNFN + PPFP + PKFK.
GRF = PRYR -TFC Where, TFC = total fertilizer cost ($/ha), PN = price of N fertilizer ($2.1/kg N), FN=amount of N applied (kg N/ha), PP=price of P fertilizer ($2.2 kg-1 P), FP=amount of P applied (kg P ha-1), PK = price of K fertilizer ($1.4 kg-1 K), FK =amount of K applied (kg K ha-1), GRF = gross return over fertilizer ($ ha-1), PR =price of rice ($0.36/kg paddy), and YR = rice yield (kg ha-1). Economic calculations were made using U.S. dollars as standard currency.
N-use efficiencies were determined following Cassman et al. (1998):
AEN = agronomic efficiency of applied N (kg grain yield increase per kg N applied), RE = apparent recovery efficiency of applied nutrient (kg nutrient taken up per kg nutrient applied), IEN = internal efficiency of N (kg grain per kg N taken up),
GYN is the grain yield in a treatment with N application (kg ha–1), FN is the amount of fertilizer N applied (kg ha–1), GY0 is the grain yield in the 0-N plot without N application, UNN is the total plant nutrient accumulation measured in above ground biomass at physiological maturity (kg ha–1), and UN 0 is the total N accumulation in plots that did not receive nutrients.
Indigenous nitrogen supply (INS), indigenous phosphorus supply (IPS), and Indigenous potassium supply (IKS) were estimated from grain yield measurements in N, P, and K omission plots.
1.4 Data analysis
Data was entered into excel sheets, cleaned and collated. It was then checked for normality and homoscedasticity and transformed if necessary to meet the assumptions of analysis of variance (ANOVA). Data was then analyzed using GenStat 18th Edition statistical package to generate means, Least Significant Differences (LSDs), F- probability and significant means were separated using Least Significant Difference (LSD) at the 0.05 probability.
1.5 Results and discussion
1.5.1 Yield and yield components for 2013 and 2014
Paddy rice yield differed significantly (p<0.05) between NPK, PK, NP, NK and control treatments. The average yield across all seasons was 3.8 t ha-1 including the control treatment. The NPK treatment had significantly higher average grain yield (average yield= 4.83 t ha-1) than control (2.8 t ha-1) and PK (-N) (3.4 t ha-1) but not NP (-K) (3.8 t ha-1) and NK (-P) (3.9 t ha-1).The NK (-P) and NP (-K) treatments significantly out-yielded the control, but yields were not significantly different from PK which had statistically similar yields with the control (Table 2). The average yield in NPK was 73, 40, 23 and 25% higher than in control, PK (-N), NK (-P) and NP (-K) treatments respectively. The NPK, NP (-K) and NK (-P) had significantly higher average tiller number, panicle number and plant height than control and PK. The latter two were not significantly different in the three plant attributes measured. Rice plants in the treatments that received N (NP, NK, and NPK) were generally taller than those plants in the –N treatments (control and PK).
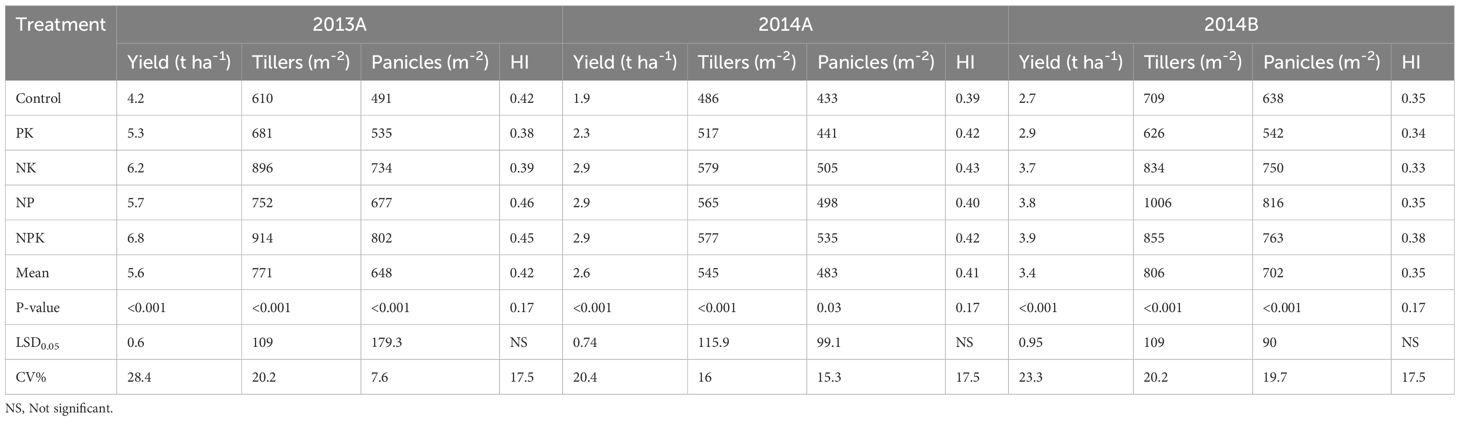
Table 2. Average yield and yield components for different omission treatments in 2013A, 2014A and 2014B.
Grain filling and harvest index were not significantly different (p>0.05) between treatments. Number of tillers and panicles followed the same trend and were highest in the full NPK treatment. In this study, application of nitrogen improved the tillering ability of the rice thereby increasing yield. According to Fageria et al. (2009), nitrogen is the most limiting factor in crop production in the tropics and is responsible for increasing tillering and reducing grain sterility. The high yields in NP, NK and NPK treatments can be attributed to the high numbers of tillers and panicles recorded in treatments that received nitrogen. Studies on nutrient omission in lowland rice in East Africa are scanty, however, the results obtained in this study are lower than those obtained by Meertens et al. (2003) in the rainfed lowlands in the Sukuma land and Kwesiga et al. (2019) in Kilombero, Tanzania. In that study, application of 60kg of nitrogen and 17.5 kg of phosphorus per hectare recorded rice paddy yields of 4.5 t ha-1.
The performance across seasons was significantly different for all parameters(p<0.05). First season 2013 (2013 A) had higher grain yield, panicle number, plant height and % filled grains than first season 2014 (2014A) and second season 2014 (2014B). The average yield was highest in 2013A (5.6 t ha-1) and lowest in 2014A (2.6 t ha-1). 2014A and 2014B were not significantly differently in yield, %filled grains and plant height (Table 2). The harvest index in 2014B was significantly different from that in 2014A and 2013A. The harvest indices in 2014B and 2013A were not different. Overall, most of the harvest indices were below 0.5. The low harvest indices could have been caused by limited soil moisture and poor performance of the local farmer variety (Benenego) used in the study. The good performance in 2013A and 2014B could have been due to presence of adequate water in the respective seasons. A total of 752 mm and 754 mm of rainfall was received in 2013A and 2014B compared to 665 mm received in the 2014A season (Kibimba weather station).
The Gross return over fertilizer cost (GRF) for the full NPK treatment was $1,275.3 ha-1. Compared with the average yields in the control, a farmer who does not apply fertilizer loses $ 270.9 ha-1 and the farmers who apply fertilizers at the same rate gains the same amount per ha.
1.5.2 Grain and straw yields and nutrient concentrations in grain and straw
Nutrient concentrations in grain and straw yields (dry weights) are presented in Table 3. Average straw yield was 3.8 t ha-1 ranging from 2.6 to 5 t ha-1. Similarly, average grain yield was 2.7 t ha-1and ranged from 1.7- 4.0 t ha-1. There were significant differences (p<0.05) between treatments for both straw and grain yields with NPK having the highest straw and grain yields of 5.7 and 4.0 t ha-1, respectively. The straw and grain yields for PK (-N) and the control were similar but low compared to other treatments. The nutrient uptake in straw were 33.2, 5.3 and 86.3 kg ha-1 for N, P and K respectively while for grain were kg P ha-1 were 38.1, 4.5 kg and 10.5 kg ha-1 for N, P, and K respectively. There were significant differences between treatments for all nutrients in both grain and straw except for the concentration of P in grain. Generally, NPK treatment had the highest nutrient concentrations; 50.5 kg N ha-1, 8.3 kg P ha-1 and 128.0 kg K ha-1 in straw and 59.0 kg N ha-1, 6.8 kg P ha-1 and 15.0 kg K ha-1 in grain. The nutrient concentrations recorded in straw and grain are similar to those presented by Haefele et al. (2003) for the Sahelian region of West Africa and Hossain et al. (2012) in Bangladesh. However, the grain concentrations are lower than those presented by Witt et al. (1999).
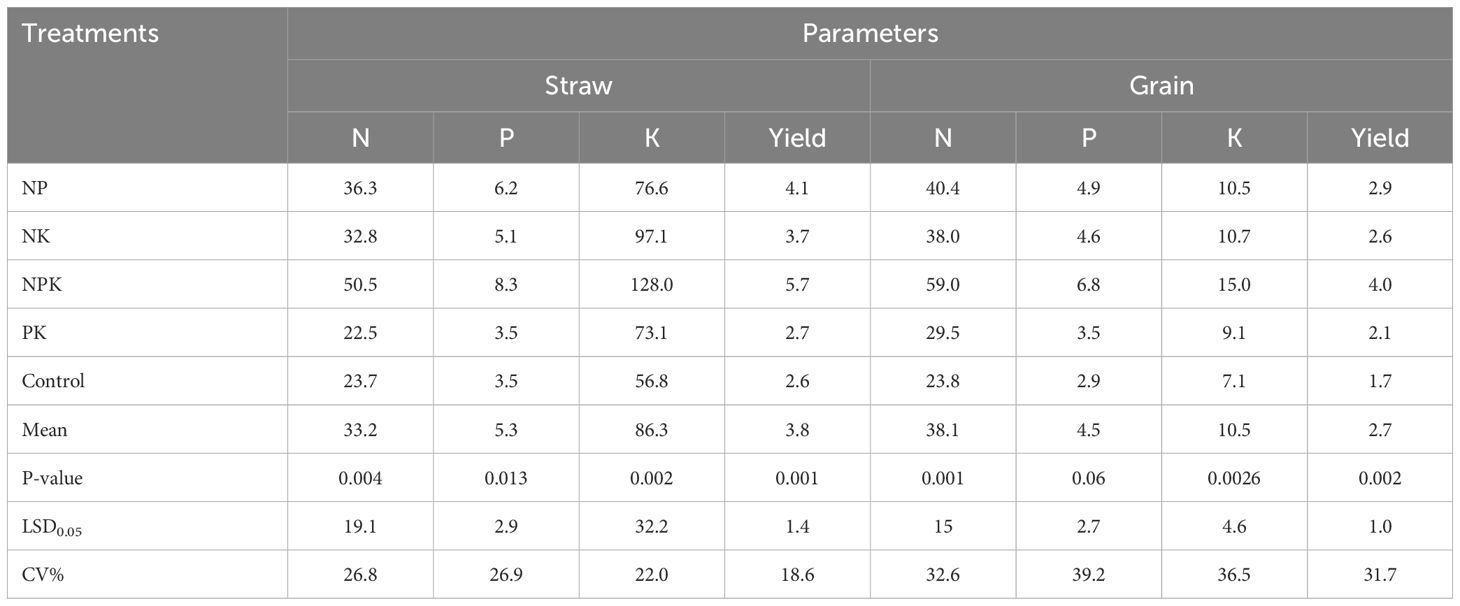
Table 3. Total straw and grain (dry weight) yield (t ha-1) and nutrient uptake of N, P, K (kg ha-1) in grains and straw.
1.5.3 Agronomic efficiency, recovery efficiency and internal use efficiency
The average AE was 9.4 kg grain kg-1 of fertilizer and ranged from 6.7 to 18 kg grain kg-1 of fertilizer added for NK (-P) and NPK treatments, respectively. However, no significant differences were observed between treatments for AE (Table 4). The average RE was 31%N, 9.9% P and 59% K, respectively. Though not significantly different among treatments for N, RE ranged from 21.5% (NK-P) to 46.9% (NPK). There was a significant difference (P<0.05) between treatments for RE of P with the NPK treatment having the highest RE (19.9%). There was a lot of variability in the RE for P and it ranged from 1.4 to 18%. Average RE for K was 59% ranging from 30% (PK-N) to 132% (NPK). The agronomic efficiency (AE) of nitrogen in the NPK plots (18 kg N kg-1 of grain) was almost double the AE in other treatments but similar to those recorded by Hossain et al. (2012). According to Witt et al. (1999), with proper nutrient and crop management, AE of N should be more than 20 kg of grain per kg of N applied. The AE of N recorded here is therefore slightly below the expected levels. This can be due to the fact that this study was set up under rainfed conditions where farmers plant a local farmer preferred variety - Bedinego which is a poor yielder. This is evident in the low harvest indices recorded throughout 2013 and 2014. In order to improve agronomic efficiency at farmer level, adoption of fertilizer technologies will have to be accompanied by new improved high yielding rice varieties. The RE recorded here for N is similar to those recorded in the Sahelian region of West Africa (Haefele et al., 2003) and many parts in Asia but are higher than those recorded by Hossain et al. (2012) in Bangladesh.
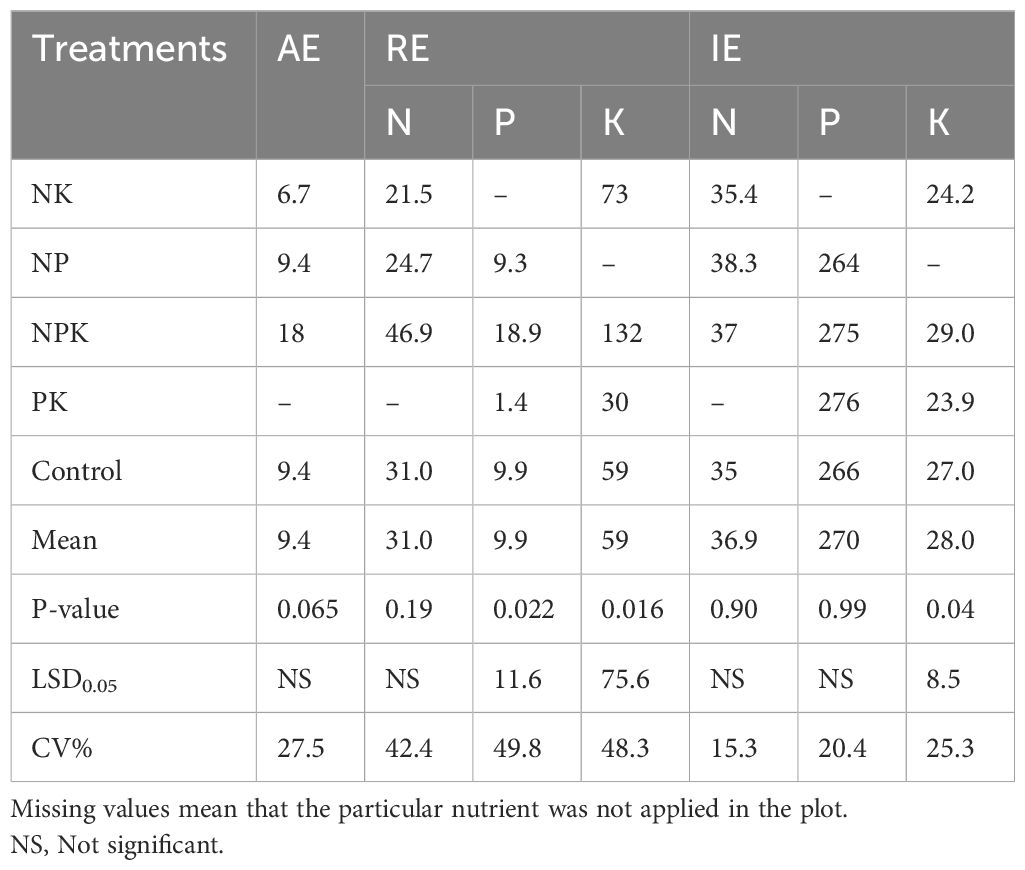
Table 4. Agronomic efficiency of N (AE) (kg grain kg-1), recovery efficiency RE (%), and internal use efficiency (IE) ((kg grain kg-1 nutrient) of different omission treatments.
Where RE values were low, it could have been due to poor timing of N application, poor water management or drought in the case of rainfed rice (Hossain et al., 2003). The RE for K was high across all seasons (RE for K in full NPK = 132) compared to Haefele et al. (2003). This could be because K was not found to be a limiting nutrient in most of the farmers’ fields (Kyalo, 2016). High RE recorded for K implies that K may be applied only after soil analysis because results have shown that K is not deficient in lowland rice soils in Buwunga and Buluguyi subcounties.
Internal use efficiency was not significantly different across treatments for all nutrient elements except for K. Average IE was 36.9 kg for N, 270 kg for P and 28 kg for K. The IE for N was similar across treatments being highest for NP (-K) (38.3 kg) and least in the control (35.0 kg). The IE for P was very similar across treatments. NPK had the highest IE for K (29.0 kg) followed by the control. The internal use efficiency for N was very low (average= 36.9 kg kg-1; IE for full NPK = 37 kg kg-1) compared to that recorded in other studies (Haefele et al., 2003; Hossain et al., 2012) and the expected IE of 68 kg kg-1 of N applied under optimal nutrition (Witt et al., 1999). The IE for unfertilized plots was also lower than unfertilized plots in the Sahelian region of West Africa (Saito et al., 2019). It is still not clear why the IE for unfertilized and fertilized plots were similar but it is clear that yield in rainfed ecologies is limited by other factors apart from nutrient supply. This implies that to achieve maximum benefits from applied fertilizers, good agricultural practices have to be practiced.
The calculated N, P and K doses required to achieve 5 t ha-1 were 63, 12.6 and 24.5 kg ha-1, respectively (Table 5). Compared to the rates used for the experiment, the farmer would save 49, 74 and 59% on NPK. The average INS, IPS and IKS were 52, 9.7 and 87.2 kg N, P and K ha-1, respectively (Table 6). The INS recorded here is similar but slightly higher than that recorded in the Sahel while the IPS and IKS were slightly lower. Haefele et al. (2003) recorded INS, IPS and IKS ranging from 33–62 kg N ha-1, 9.8-13.9 kg P ha-1 and 67–169 kg K ha-1respectively. The common farmers’ practice of leaving straw in the garden and cultivating once a year ensures plenty of K in their soils. Laboratory results of soil samples from farmers’ fields recorded high levels of K confirming that K is not a limiting nutrient.
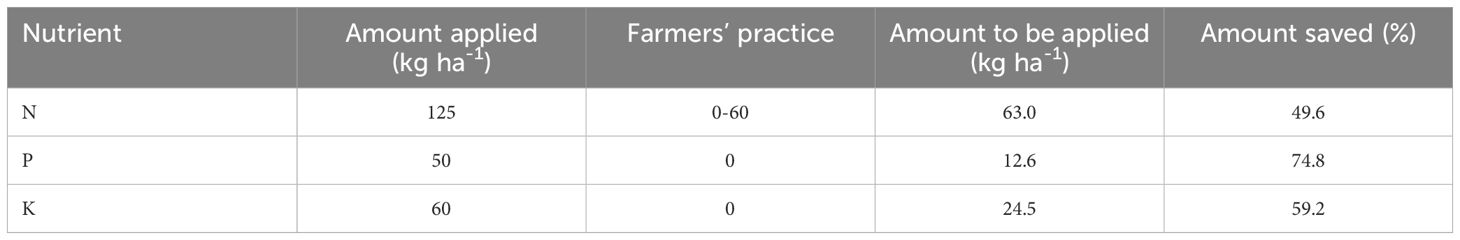
Table 5. Calculated N, P and K doses.
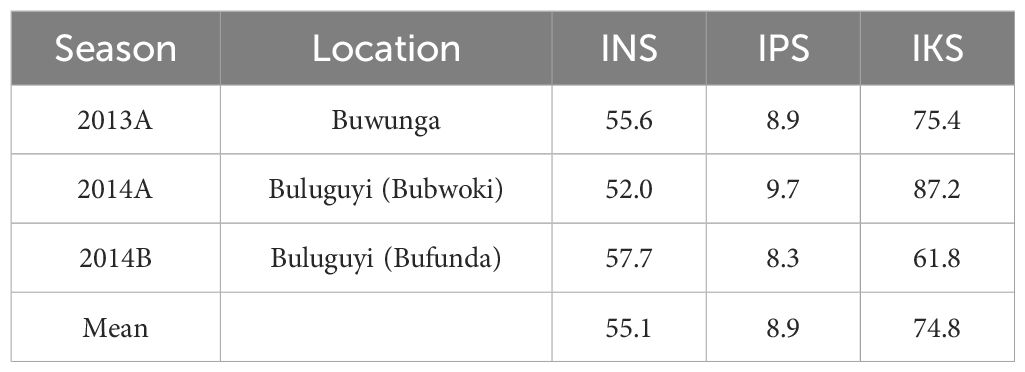
Table 6. Indigenous nutrient supply of N (INS), P (IPS) and K (IKS) (kg ha-1) in season 2013A, 2014A and 2014B.
1.6 Conclusions and recommendations
The indigenous nutrient supply of the soils was 55.1, 8.9 and 74.8kg ha-1 for N, P and K, respectively. The INS recorded here is similar but slightly higher than that recorded in the Sahel while the IPS and IKS were slightly lower. The agronomic efficiency in NPK plots was 18 kg of grain per kg of N added, and the RE was 46.9%. The internal use efficiency for N, P and K was equally low. The AE, RE and IE were low compared to the base minimum of 20 kg grain kg-1 N, 50% and 68 kg grain kg-1 N respectively. The low nutrient use efficiency is most likely due to the fact that this is a rainfed system under farmers’ conditions where water management is not only inadequate, there are also many other factors affecting efficient use of nutrients like drought, weed problems and poor crop management. The calculated NPK rates were 63, 12.6 and 24 kg ha-1 implying a saving of 49, 74 and 59% on NPK rates used in the experiment. This study has shown that fertilizer use is still profitable and SSNM has demonstrated that big savings on fertilizer N and P can be achieved. Based on the low nutrient use efficiency observed, maximum benefits from fertilizer use will only be realized if farmers can manage their water and weeds better and also employ adequate crop management procedures as well as adopting improved high yielding varieties. The current study was conducted in Bugiri district in eastern Uganda. For more conclusive results, there is the need to widen the scope of the study by including irrigated environments, other rainfed lowland rice areas in Uganda and collect more data on farmer practices in order to explain better its impact on the study.
Data availability statement
The original contributions presented in the study are included in the article/supplementary material. Further inquiries can be directed to the corresponding authors.
Author contributions
GK: Conceptualization, Investigation, Methodology, Project administration, Supervision, Writing – original draft, Writing – review & editing. PA: Data curation, Formal analysis, Investigation, Writing – original draft, Writing – review & editing. GC: Conceptualization, Data curation, Validation, Writing – review & editing, Writing – original draft. NN: Data curation, Supervision, Writing – review & editing, Writing – original draft. IW: Data curation, Project administration, Visualization, Writing – original draft, Writing – review & editing. FM: Conceptualization, Funding acquisition, Project administration, Supervision, Writing – original draft, Writing – review & editing.
Funding
The author(s) declare financial support was received for the research and/or publication of this article. This work was funded by the Japan Breeding Project through the International Rice Research Institute (IRRI) under Agreement No. A-2012-44 / 33-231-10162.
Conflict of interest
The authors declare that the research was conducted in the absence of any commercial or financial relationships that could be construed as a potential conflict of interest.
Generative AI statement
The author(s) declare that no Generative AI was used in the creation of this manuscript.
Any alternative text (alt text) provided alongside figures in this article has been generated by Frontiers with the support of artificial intelligence and reasonable efforts have been made to ensure accuracy, including review by the authors wherever possible. If you identify any issues, please contact us.
Publisher’s note
All claims expressed in this article are solely those of the authors and do not necessarily represent those of their affiliated organizations, or those of the publisher, the editors and the reviewers. Any product that may be evaluated in this article, or claim that may be made by its manufacturer, is not guaranteed or endorsed by the publisher.
References
Akongo G. O., Gombya-Ssembajjwe W., Buyinza M., and Namaalwa J. J. (2017). Characterisation of rice production systems in northern Agro-Ecological Zone, Uganda. J. Agric. Sci. 10, 272. doi: 10.5539/jas.v10n1p272
Awio T., Senthilkumar K., Dimkpa C. O., Otim-Nape G. W., Struik P. C., and Stomph T. J. (2022). Yields and yield gaps in lowland rice systems and options to improve smallholder production. Agronomy 12, 552. doi: 10.3390/agronomy12030552
Barungi M. and Odokonyero T. (2016). Understanding the rice value chain in Uganda: opportunities and challenges to increased productivity. Econ. Policy Res. Centre 15, 1–24.
Bray R. H. and Kurtz L. T. (1945). Determination of total, organic, and available forms of phosphorus in soils. Soil Sci. 59, 39–46. doi: 10.1097/00010694-194501000-00006
Bremner J. M. and Mulvaney C. S. (1982). “Chemical and microbiological properties,” in Methods of soil analysis. Part II (American Society of Agronomy: Soil Science Society of America, Madison, Wisconsin), 595–624.
Bua B. and Ojirot M. (2014). Assessing the importance of rice as food and income security crop in puti-puti sub-county, Pallisa District, Uganda. Am. J. Exp. Agric. 4, 532–540. doi: 10.9734/AJEA/2014/6701
Cassman K. G., Peng S., Olk D. C., Ladha J. K., Reichardt W., Dobermann A., et al. (1998). Opportunities for increased nitrogen-use efficiency from improved resource management in irrigated rice systems. Field Crops Res. 56, 7–39. doi: 10.1016/S0378-4290(97)00140-8
Chivenge P., Saito K., Bunquin M. A., Sharma S., and Dobermann A. (2021). Co-benefits of nutrient management tailored to smallholder agriculture. Global Food Secur. 30, 100570. doi: 10.1016/j.gfs.2021.100570
Davies B., Coulter J. A., and Pagliari P. H. (2020). Timing and rate of nitrogen fertilization influence maize yield and nitrogen use efficiency. PloS One 15, e0233674. doi: 10.1371/journal.pone.0233674
Dobermann A., Witt C., Abdulrachman S., Gines H. C., Nagarajan R., Son T. T., et al. (2003). Estimating indigenous nutrient supplies for site-specific nutrient management in irrigated rice. Agron. J. 95, 924–935. doi: 10.2134/agronj2003.9240
Dobermann A., Witt C., Dawe D., Abdulrachman S., Gines H. C., Nagarajan R., et al. (2002). Site-specific nutrient management for intensive rice cropping systems in Asia. Field Crops Res. 74, 37–66. doi: 10.1016/S0378-4290(01)00197-6
Dobermann A. and Fairhurst T. H. (2000). Nutrient disorders and nutrient management. Potash and Phosphate Institute, Potash and Phosphate Institute of Canada and International Rice Research InstituteSingapore 191
Driessen P. M. (1986). “The water balance of the soil,” in Modeling of Agricultural Production: Weather, soil and crops CABI, MAAIF-Entebbe, 76–116. cabidigitallibrary.org
Fageria N. K., Dos Santos A. B., and Cutrim V. D. A. (2009). Nitrogen uptake and its association with grain yield in lowland rice genotypes. J. Plant Nutr. 32, 1965–1974. doi: 10.1080/01904160903245121
Fairhurst T., Witt C., Buresh R., Dobermann A., and Fairhurst T. (2007). Rice: A practical guide to nutrient management (International Rice Research Institute, Los Banos, Laguna Philippines).
Fan X., Tang Z., Tan Y., Zhang Y., Luo B., Yang M., et al. (2016). Overexpression of a pH-sensitive nitrate transporter in rice increases crop yields. Proc. Natl. Acad. Sci. 113, 7118–7123. doi: 10.1073/pnas.1525184113
Godfray H. C. J., Beddington J. R., Crute I. R., Haddad L., Lawrence D., Muir J. F., et al. (2010). Food security: the challenge of feeding 9 billion people. Science 327, 812–818. doi: 10.1126/science.1185383
Guo J. H., Liu X. J., Zhang Y., Shen J. L., Han W. X., Zhang W. F., et al. (2010). Significant acidification in major Chinese croplands. Science 327, 1008–1010. doi: 10.1126/science.1182570
Haefele S. M., Wopereis M. C. S., Ndiaye M. K., Barro S. E., and Isselmou M. O. (2003). Internal nutrient efficiencies, fertilizer recovery rates and indigenous nutrient supply of irrigated lowland rice in Sahelian West Africa. Field Crops Res. 80, 19–32. doi: 10.1016/S0378-4290(02)00152-1
Hameed F., Xu J., Rahim S. F., Wei Q., Rehman Khalil A. U., and Liao Q. (2019). Optimizing nitrogen options for improving nitrogen use efficiency of rice under different water regimes. Agronomy 9, 39. doi: 10.3390/agronomy9010039
Hossain M., Lewis D., Bose M. L., and Chowdhury A. (2003). Rice research, technological progress, and impacts on the poor: the Bangladesh case (summary report). International Food Policy Research Institute
Hossain M. F., Elahi S. F., White S. K., Alam Q. K., Rother J. A., and Gaunt J. L. (2012). Nitrogen budgets for Boro rice (Oryza sativa L.) fields in Bangladesh. Field Crops Res. 131, 97–109. doi: 10.1016/j.fcr.2012.02.029
Jing Q., Bouman B. A. M., Hengsdijk H., Van Keulen H., and Cao W. (2007). Exploring options to combine high yields with high nitrogen use efficiencies in irrigated rice in China. Eur. J. Agron. 26, 166–177. doi: 10.1016/j.eja.2006.09.005
Kichey T., Hirel B., Heumez E., Dubois F., and Le Gouis J. (2007). In winter wheat (Triticum aestivum L.), post-anthesis nitrogen uptake and remobilisation to the grain correlates with agronomic traits and nitrogen physiological markers. Field Crops Res. 102, 22–32. doi: 10.1016/j.fcr.2007.01.002
Kwesiga J., Grotelüschen K., Neuhoff D., Senthilkumar K., Döring T. F., and Becker M. (2019). Site and management effects on grain yield and yield variability of rainfed lowland rice in the Kilombero Floodplain of Tanzania. Agronomy 9, 632. doi: 10.3390/agronomy9100632
Kyalo G. (2016). Exploring Improved Nutrient Options for Increased Rained Lowland Rice Production in Eastern and Northern Uganda. University of Nairobi, Nairobi, Kenya.
Ministry of Agriculture Animal Industry and Fisheries(MAAIF) (2016). Agriculture Sector Strategic Plan 2015/16-2019/20.
Nanfumba D., Turyahabwe N., Ssebuliba J., Kakuru W., Kaugule J., Omio S., et al. (2013). Participatory identification of farmer acceptable improved rice varieties for rain-fed 683 lowland ecologies in Uganda. Afr. Crop Sci. J. 21, 683–692. Available online at: http://hdl.handle.net/10625/52289
Nelson D. W. and Sommers L. E. (1982). Total carbon, organic carbon, and organic matter. Methods Soil Anal.: Part 2 Chem. Microbiol. Properties 9, 539–579.
Okalebo J. R., Gathua K. W., and Woomer P. L. (2002). Laboratory methods of soil and plant analysis: a working manual second edition. Sacred Africa Nairobi 21, 25–26.
Oonyu J. (2011). Upland rice growing: A potential solution to declining crop yields and the degradation of the Doho wetlands, Butaleja district-Uganda. African Journal of Agricultural Research 6 2774–2783.
Raun W. R. and Johnson G. V. (1999). Improving nitrogen use efficiency for cereal production. Agron. J. 91, 357–363. doi: 10.2134/agronj1999.00021962009100030001x
Saito K., Vandamme E., Johnson J. M., Tanaka A., Senthilkumar K., Dieng I., et al. (2019). Yield-limiting macronutrients for rice in sub-Saharan Africa. Geoderma 338, 546–554. doi: 10.1016/j.geoderma.2018.11.036
Witt C., Dobermann A., Abdulrachman S., Gines H. C., Guanghuo W., Nagarajan R., et al. (1999). Internal nutrient efficiencies of irrigated lowland rice in tropical and subtropical Asia. Field Crops Res. 63, 113–138. doi: 10.1016/S0378-4290(99)00031-3
Keywords: indigenous nutrient sources, rice, recovery efficiency, internal use efficiency and agronomic efficiency, nutrient sources
Citation: Kyalo G, Chemining’wa G, Apunyo PC, Nhamo N, Wanyama I and Mussgnug F (2025) Indigenous nutrient supply and fertilizer use efficiency in rainfed lowland rice in eastern Uganda. Front. Agron. 7:1609528. doi: 10.3389/fagro.2025.1609528
Received: 10 April 2025; Accepted: 20 June 2025;
Published: 02 September 2025.
Edited by:
Katharina Hildegard Elisabeth Meurer, Swedish University of Agricultural Sciences, SwedenReviewed by:
Tanmoy Shankar, Centurion University of Technology and Management, IndiaMohamed Dicko, Institute of Rural Economy (IER), Mali
Copyright © 2025 Kyalo, Chemining’wa, Apunyo, Nhamo, Wanyama and Mussgnug. This is an open-access article distributed under the terms of the Creative Commons Attribution License (CC BY). The use, distribution or reproduction in other forums is permitted, provided the original author(s) and the copyright owner(s) are credited and that the original publication in this journal is cited, in accordance with accepted academic practice. No use, distribution or reproduction is permitted which does not comply with these terms.
*Correspondence: Gerald Kyalo, Z3BreWFsb0BnbWFpbC5jb20=; Peter Charles Apunyo, YXB1bnlvY3BAZ21haWwuY29t
†ORCID: Pankaj Kumar, orcid.org/0000-0002-8334-0611