 Ibrahim L. Kadigi
 Stefan Sieber
- 1Department of Business Management, College of Humanities and Business Studies, Mbeya University of Science and Technology (MUST), Mbeya, Tanzania
- 2Leibniz Centre for Agricultural Landscape Research, (ZALF e. V.), Müncheberg, Germany
- 3Department of Agricultural Economics, Faculty of Life Sciences Thaer-Institute, Humboldt-Universität zu Berlin, Berlin, Germany
Introduction: Climate change poses a growing threat to food security in Tanzania, particularly among smallholder rice farmers who rely on rain-fed agriculture and have limited adaptive capacity. Identifying effective input strategies to enhance both profitability and resilience is crucial to securing rural livelihoods and achieving sustainable development goals. This study evaluates the potential of improved seed varieties and fertilizers (both organic and inorganic) as tools for boosting income and reducing vulnerability among rice farming households.
Methods: We utilized nationally representative data from the 2019/20 National Sample Census of Agriculture (NSCA), which encompassed 6,025 rice farms across diverse agroecological zones in Tanzania. A Risk Simulation Model (RSM) was employed to estimate farm income distributions under varying yield and market price conditions. Farmers were categorized by seed type (local vs. improved) and fertilizer use (none, organic, or inorganic). Income thresholds of TZS 2.0 million/ha (low) and TZS 4.0 million/ha (high) were used to benchmark profitability and vulnerability levels across regions.
Results: The combination of improved seeds and inorganic fertilizers significantly enhanced farm profitability. In the Southern Highlands Zone (SHZ), 20% of farms exceeded the upper-income threshold of TZS 4.0 million/ha. In contrast, farmers using local seeds without fertilizer faced a high financial risk, with 78% earning less than TZS 2.0 million/ha nationally. Organic fertilizers offered modest gains; in Zanzibar, they reduced the probability of falling into the low-income category by 14%. However, regional disparities were substantial. Fertile soils in the SHZ amplified input returns, while constraints in the Eastern Zones (EZ) and Zanzibar, including saline soils, land fragmentation, and institutional limitations, restricted profitability, even among users of inorganic fertilizer, with 58% remaining below the income threshold.
Discussion: These findings underscore the importance of spatially targeted strategies. High-potential areas, such as SHZ, could benefit from scaling up access to improved inputs through subsidized programs, like digital vouchers. In low-performing regions like EZ and Zanzibar, integrated interventions are needed, including site-specific soil management, saline-tolerant seeds, infrastructure improvements, and access to credit. A dual policy approach, combining short-term subsidies with long-term resilience-building, is essential to advance food security and sustainable profitability, in line with SDG 2 (Zero Hunger).
1 Introduction
Rice is the second most important staple crop in Tanzania after maize, playing a crucial role in national food security and economic stability (Kangalawe and Lyimo, 2013; Onyutha et al., 2022). It is a major source of livelihood for millions of smallholder farmers and a key commodity in regional trade. Tanzania is one of the largest rice producers in East Africa, with its surplus production supplying neighboring countries, including Kenya, Uganda, Rwanda, and the Democratic Republic of the Congo (DRC) (Andreoni et al., 2021). However, smallholder farmers, who form the backbone of rice production, rely heavily on rain-fed agriculture, making them highly vulnerable to unpredictable climatic patterns. These climatic changes, coupled with declining soil fertility and increased temperature variability, exacerbate low yields and reduce net farm income (NFI) in rice farming (Gashu et al., 2019; Thornton et al., 2024). Adaptive measures such as drought-tolerant rice varieties, efficient water management practices, and climate-smart agricultural technologies are essential for mitigating these impacts.
To address these challenges, adopting improved agricultural technologies, particularly the use of fertilizers and improved seed varieties, has been widely promoted as a means to enhance productivity and economic returns for smallholder farmers (Makate et al., 2023; Shackleton et al., 2015). Improved seeds are developed to be more resistant to drought, pests, and diseases, while fertilizers provide essential nutrients that boost crop growth and yield potential (Savary et al., 2019; Smil, 2004). Empirical studies suggest that integrating these two inputs into rice farming systems can significantly improve yields, stabilize household incomes, and reduce food insecurity in Tanzania (Altieri and Nicholls, 2017; Cai et al., 2017).
Despite the potential benefits, there are policy gaps in ensuring the widespread accessibility and affordability of fertilizers and improved seeds for smallholder farmers. High input costs, inadequate distribution systems, and limited extension services hinder the adoption of these technologies, thereby limiting their effectiveness in enhancing NFI (Chalchisa and Sani, 2016; Mertz et al., 2009). One of the significant barriers to adopting fertilizers and improved seeds is the rising cost of agricultural inputs. The global COVID-19 pandemic and the ongoing Russia-Ukraine war have severely disrupted supply chains, resulting in increased prices for fertilizers and other agricultural inputs. These disruptions have led to higher production costs for farmers, which in turn affect household incomes and national food security. The spike in fertilizer prices has made it difficult for many smallholder farmers to afford essential inputs, resulting in reduced yields and NFI. Additionally, supply chain constraints have led to delays in input availability, further complicating farm planning and productivity. Moreover, variations in agroecological zones influence the responsiveness of rice crops to these inputs, necessitating location-specific adaptation strategies (Lewis et al., 2018; Rowhani et al., 2011).
This study examines the role of fertilizers and improved seeds in determining the NFI of rice farms in Tanzania amidst climate change. It employs a robust Risk Simulation Model (RSM) following the Monte Carlo simulation procedures (Richardson et al., 2008) to model the economic implications of these agricultural inputs under different rice farming systems. The model utilizes data from the most recent National Sample Census of Agriculture (NSCA) 2019/20 to assess the impact of improved seed and fertilizer application on household net farm income. The findings offer critical insights for policymakers and stakeholders in designing interventions that enhance agricultural resilience, promote NFI, and improve the livelihood stability of smallholder farmers. The study also highlights the need for evidence-based policies that support sustainable agricultural intensification and climate-smart farming practices to ensure long-term NFI and economic growth in Tanzania’s rice sector.
2 Methodology
2.1 Overview of the study area
This research focuses on rice farming across both mainland Tanzania and Zanzibar, and also delves into two principal agroecological zones: the Eastern Zone (EZ), primarily the Morogoro region, and the Southern Highlands Zone (SHZ), predominantly the Mbeya region. These zones are characterized by unique climatic patterns, soil types, and agricultural systems that substantially influence rice production. For example, during the 2019/2020 agricultural year, the total production of paddy, produced by smallholder farmers in Tanzania, was 3,443,606 tons, out of which 3,330,293 tons were produced in Mainland Tanzania and 50,421 tons in Tanzania Zanzibar. In Mainland Tanzania, the Morogoro region had the highest production of paddy, at 572,884 tons (17.2%), followed by Mbeya at 413,212 tons (12.4%) and Shinyanga at 381,092 tons (11.4%), as shown in Figure 1. The lowest paddy production was reported in the Arusha region (1,493 tons, 0.04%), followed by Njombe (7,162 tons, 0.2%) and Manyara (9,020 tons, 0.3%). In Tanzania, Zanzibar, Kusini Pemba region reported the highest production (15,296 tons; 30.3%) of paddy, followed by Mjini Magharibi (13,416 tons; 26.6%) and Kaskazini Pemba (12,426 tons; 24.6%), while Kusini Unguja had the lowest paddy production (1,463 tons; 2.9%).
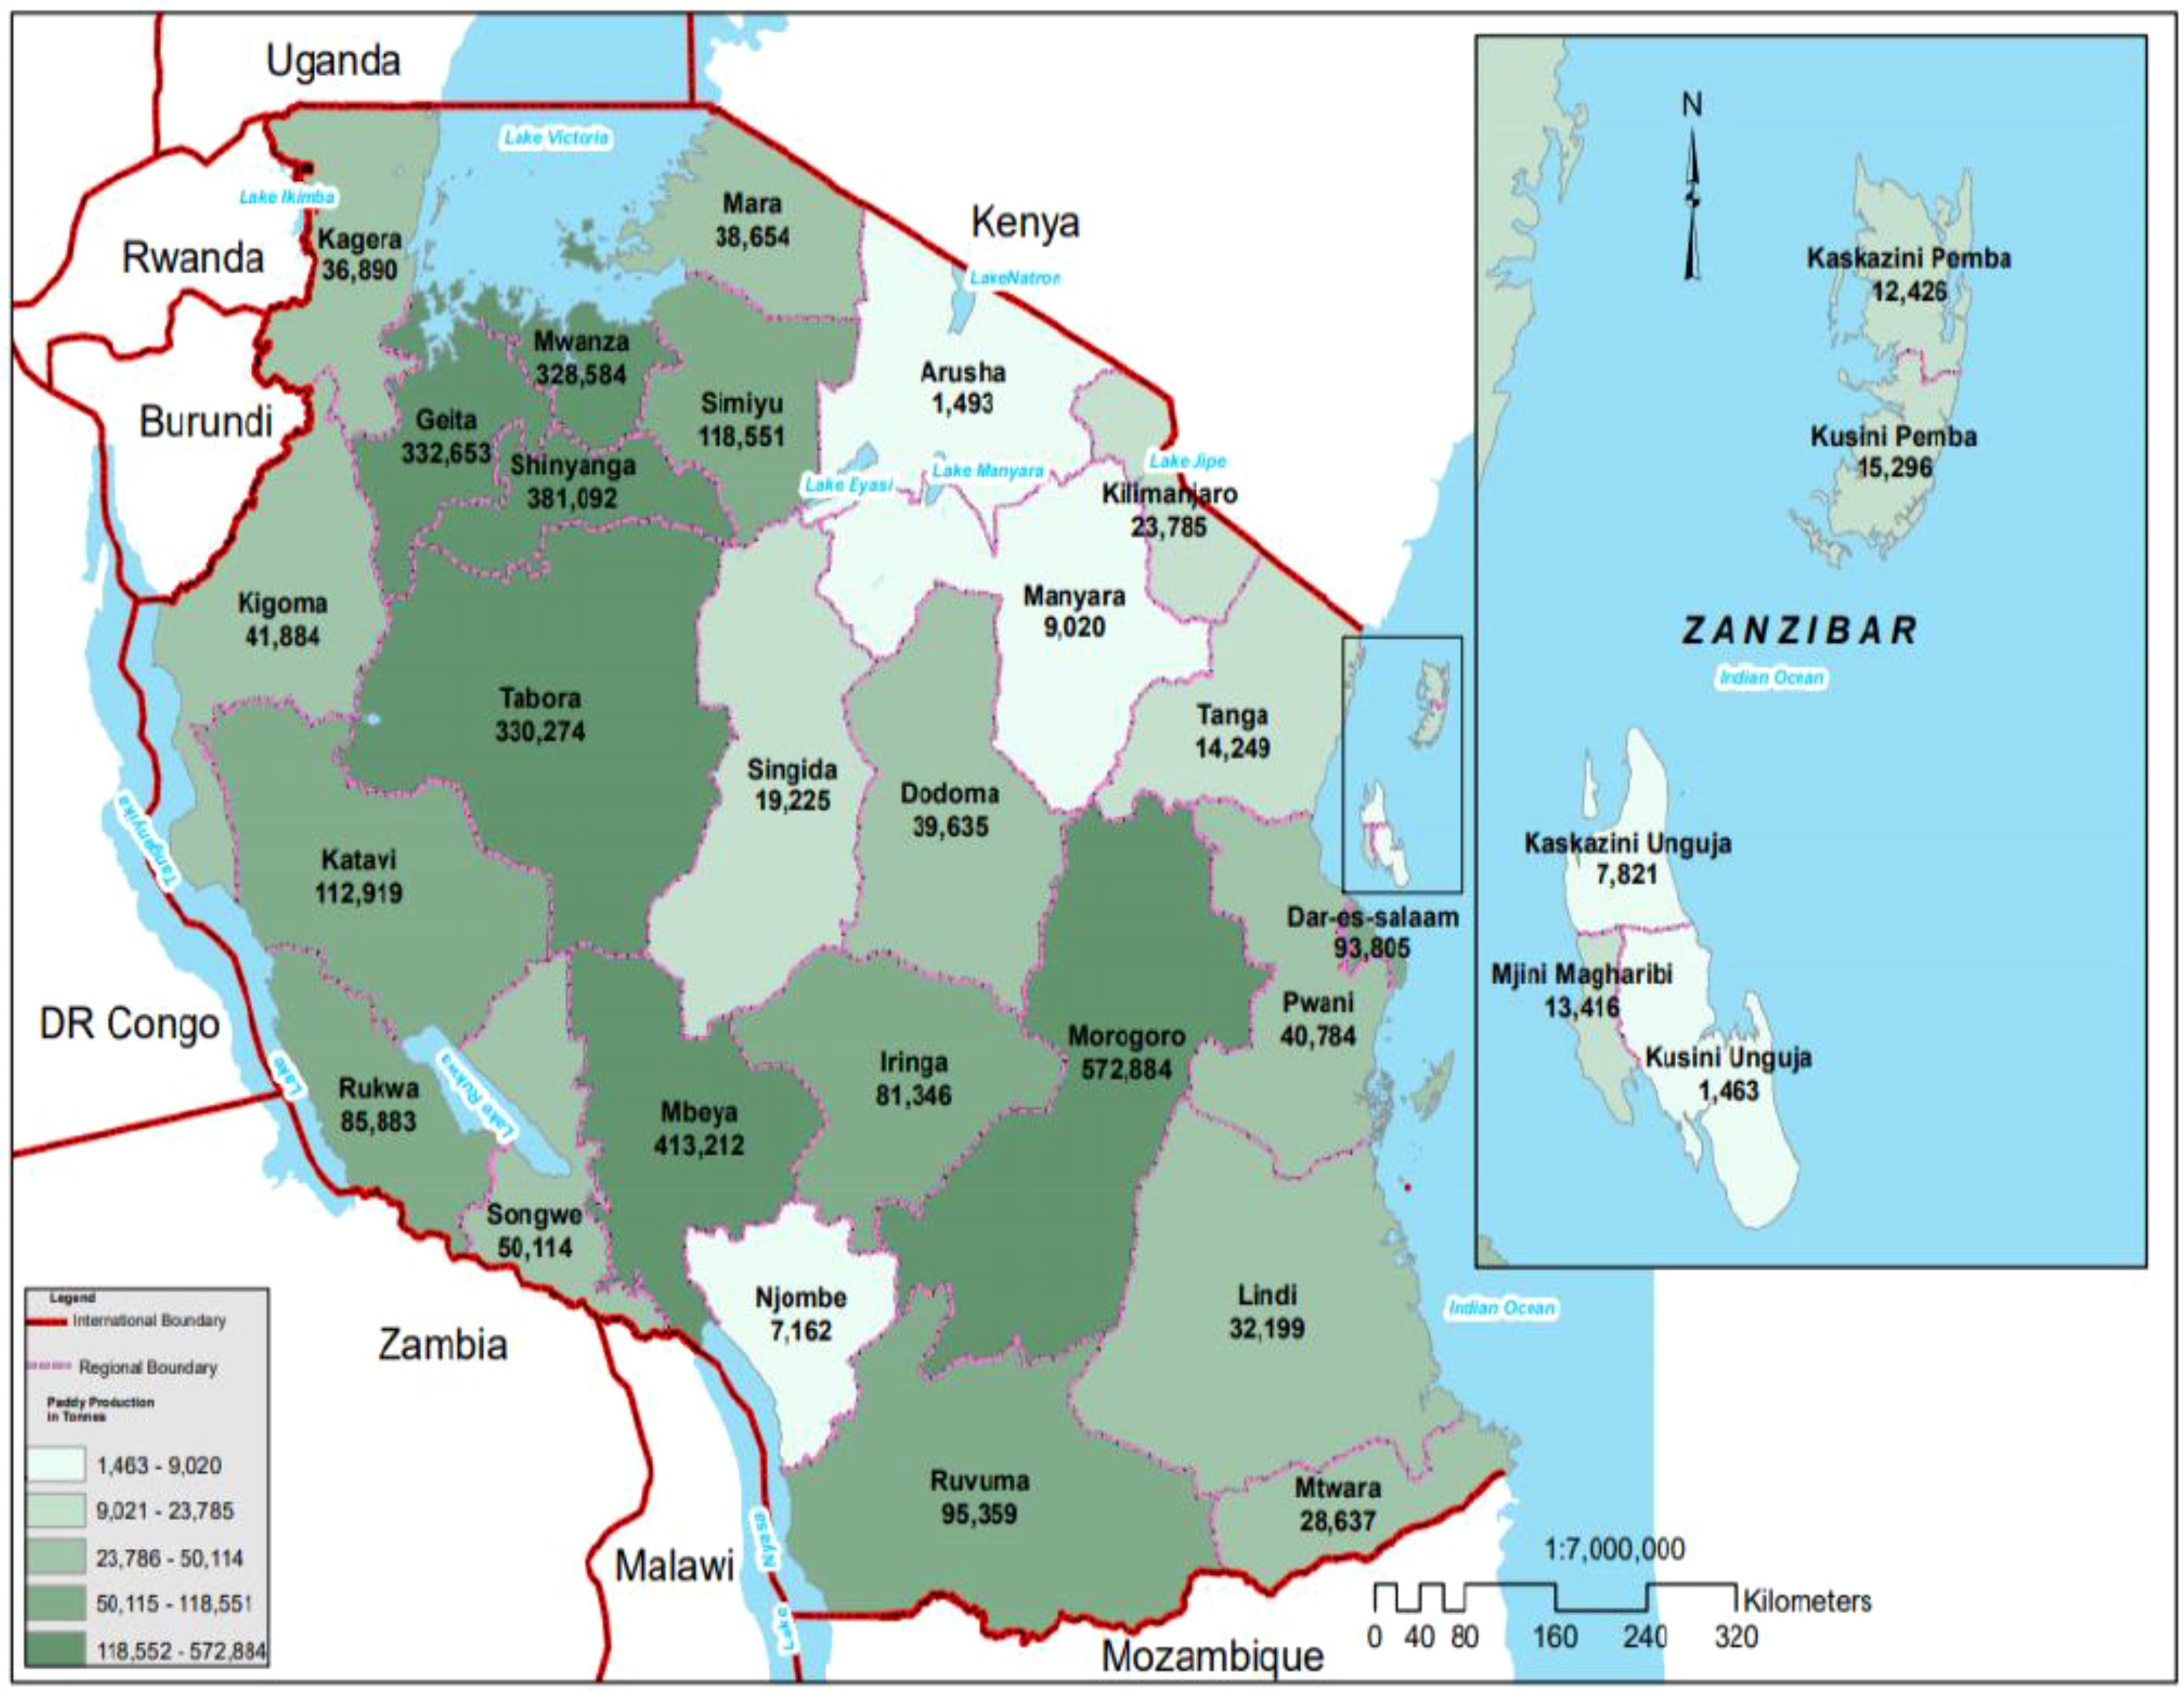
Figure 1. The map of Tanzania showing quantity of paddy harvested by smallholder farmers by region during 2019/20 agricultural year (URT, 2021).
By categorizing rice farms within these specific zones, the study examines how different farming practices, particularly those involving the use of various seeds and fertilizers, perform under distinct environmental conditions. This method ensures that the findings accurately represent national trends and can be applied to localized strategies, thereby aiding farmers, policymakers, and development agencies (Richardson et al., 2000; 2003; 2007; Kadigi et al., 2025a). The division of farms into these agroecological zones allows for a detailed comparative analysis, highlighting the effectiveness of farming practices in diverse environmental settings. This is crucial for crafting region-specific strategies that enhance both agricultural productivity and farmers’ NFI. Furthermore, this analysis facilitates understanding how each zone copes with climatic and environmental challenges, which supports the development of resilient farming systems tailored to local conditions. The study examines explicitly six agroecological zones: rice farms in mainland Tanzania, Zanzibar, the EZ in the Morogoro region, and the SHZ in the Mbeya region. This classification not only reflects Tanzania’s varied agricultural landscape but also enables a robust analysis of productivity and NFI across these ecological zones. By accounting for such variations, the study identifies the most effective agricultural interventions, providing evidence to support informed policy decisions that close the productivity gap in Tanzania’s rice production and promote sustainable agricultural growth.
2.2 Data sources
Tanzania has conducted a series of National Sample Censuses of Agriculture (NSCA), with the most recent being the 2019/2020 census. This follows earlier censuses carried out in 1971/1972, 1994/1995, 2002/2003, and 2007/2008. This study utilized data primarily from the latest 2019/20 NSCA, supplemented by the 2007/08 NSCA data to normalize and adjust the recent figures. The NSCA, administered by Tanzania’s National Bureau of Statistics (NBS), is a vital information repository. It captures essential details of agricultural households, including farm size, crop production, livestock holdings, and the use of inputs like fertilizers and seeds. Furthermore, the census assesses rural infrastructure and the living standards of farming households, providing crucial benchmarks for measuring agricultural productivity and the effectiveness of various interventions.
The NSCA employs a robust two-stage sampling methodology to ensure it accurately reflects national demographics. The initial stage involves selecting Census Enumeration Areas (CEAs) from the 2012 Population and Housing Census. These CEAs act as Primary Sampling Units (PSUs) and are systematically chosen across different regions and districts to ensure a balanced geographical representation. In the second stage, agricultural households within these PSUs are randomly selected, with a focus on those engaged in crop cultivation and livestock production. The total sample encompasses 2,820 PSUs, including 2,670 from Mainland Tanzania and 150 from Tanzania Zanzibar, employing a Probability Proportional to Size (PPS) technique. This method prioritizes areas with higher agricultural activity, thus enhancing the accuracy and reliability of the data. Detailed information on the sampling design and implementation can be found in the official NSCA report (URT, 2021).
2.3 Data processing and simulation
2.3.1 Yield simulation
The sorted data were categorized into six farming practices for more straightforward analysis and comparison. Farms that used local seeds without any fertilizers were given an F1.0 mark, while farms that used local seeds plus organic fertilizers were described as F1.1. Farms that used local seeds with inorganic fertilizers received an F1.2 rating. On the other hand, farms that used improved seeds without fertilizers were designated as F2.0, and farms that used improved seeds along with organic fertilizers were designated as F2.1. The farms that used improved seeds plus inorganic fertilizers were specified as F2.2. Table 1 summarizes the observed data, sorted by farming practices, for mainland Tanzania and those in the Zanzibar zone, as categorized by the NSCA.
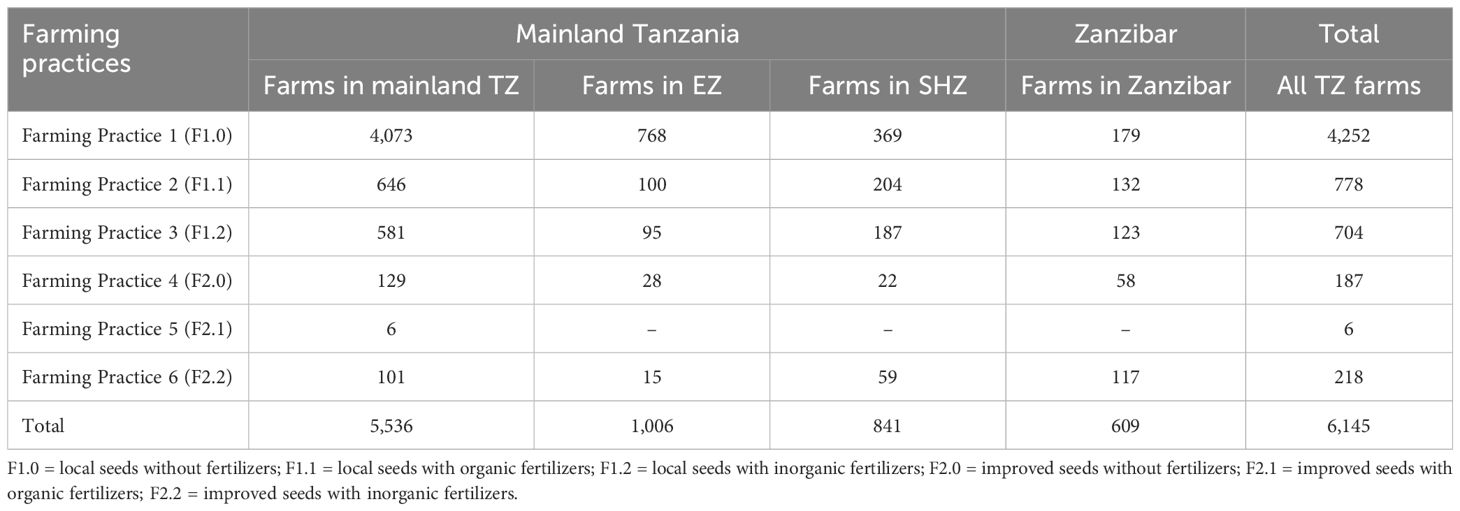
Table 1. Number of observations for rice farms in mainland Tanzania and Zanzibar under different fertilizer and seed types farming practices.
The data analysis for this study utilizes a Risk Simulation Model (RSM) that follows a non-parametric Monte Carlo simulation approach, as detailed by Kadigi et al. (2020; 2025a) and Richardson et al. in various years (2000, 2003, 2007). Monte Carlo simulations are well-regarded for their ability to model stochastic variables, such as yields or prices, and generate estimated distributions for these variables. This technique robustly quantifies the risks and variabilities tied to rice NFI in Tanzania. In the initial phase of the simulation, we define and parameterize the stochastic (risky) yields for each farming system, grounded in actual observed data. The yields are then converted into a stochastic format using standard Monte Carlo protocols, which allow for the simulation and validation of yield distributions tailored to each seed type and farming setup. To address Tanzania’s geographical and climatic diversity, the study further categorizes the data across different agroecological zones, resulting in 30 distinct random models that encompass six farming systems across four agroecological zones (plus the aggregated).
For the analysis of these varied yields, the study employs a Multivariate Empirical (MVE) distribution method, as also recommended by Kadigi et al. (2020). This approach effectively handles multiple variables simultaneously and ensures that the simulated values remain within realistic limits, such as avoiding the generation of implausible negative yields. To facilitate this, residuals defined as percentage deviations of observed yields from their mean are used to estimate the parameters of the MVE yield distribution. This method captures the variability in historical yield data and underscores the probabilistic nature of rice yield variability across different farming systems, providing a comprehensive view of potential production outcomes.
Equation 1 was used to develop the simulation model for simulating stochastic yield ().
Where:
~ = A tilde represents a stochastic variable.
i = Type of farming practices used (FP1.0, FP1.1, FP1.2, FP2.0, FP2.1, and FP2.2).
= Represents farms in Mainland Tanzania, Zanzibar, and farms in major producing agroecological zones (Eastern Zone and Southern Highlands).
ai = Hectares (ha) allocated for farming practice i.
= Stochastic mean yield per ha for farming practice i.
= Deterministic (mean) yield per ha for farming practice i.
= The normalization factor which is given by and it is used to scale/adjust the 2019/20 NCSA mean yield.
= Stochastic yield for the current survey (2019/20 NCSA).
= Stochastic yield for the historical or previous survey (2007/08 NCSA).
Sy = Fraction deviations from the mean or sorted array of random yields for farming practice i.
P(Sy) = Cumulative probability function for the Sy values.
CUSDy = Simetar function to simulate the correlated uniform standard deviation of random variables.
EMP() = Simetar function used to simulate a stochastic variable (yield).
The subsequent phase of the analysis involved simulating the Risk Simulation Model (RSM) for a minimum of 500 iterations using the Latin Hypercube Sampling (LHC) method, as detailed by Richardson et al. (2008). The LHC technique was selected for its efficiency, allowing for a comprehensive replication of the parent yield distributions despite the relatively modest number of iterations. This efficiency is crucial because it ensures that the sample size of 500 iterations is sufficient to accurately capture the underlying characteristics of the yield distributions. This simulation considered 42 random variables, each representing different farming systems across six agroecological zones. Conducting 500 iterations for each variable resulted in a total of 21,000 simulated yields. This extensive dataset, significantly larger than the original 15,927 observed yields, enhances the robustness of our analysis and enables a more precise evaluation of how various farming practices influence rice yields.
To validate the accuracy of these simulations, the final step of the analysis involved comparing the simulated yield distributions against historical yield data. This validation step is essential to ensure that the stochastic model accurately mirrors observed data while incorporating the variability inherent in RSM. By aligning the simulation outputs with historical distributions, the study ensures that its findings are both reliable and relevant for assessing the impact of different farming practices within Tanzania’s diverse agroecological landscapes. Results from this validation are detailed in Figure 2, which uses probability distribution functions (PDF).
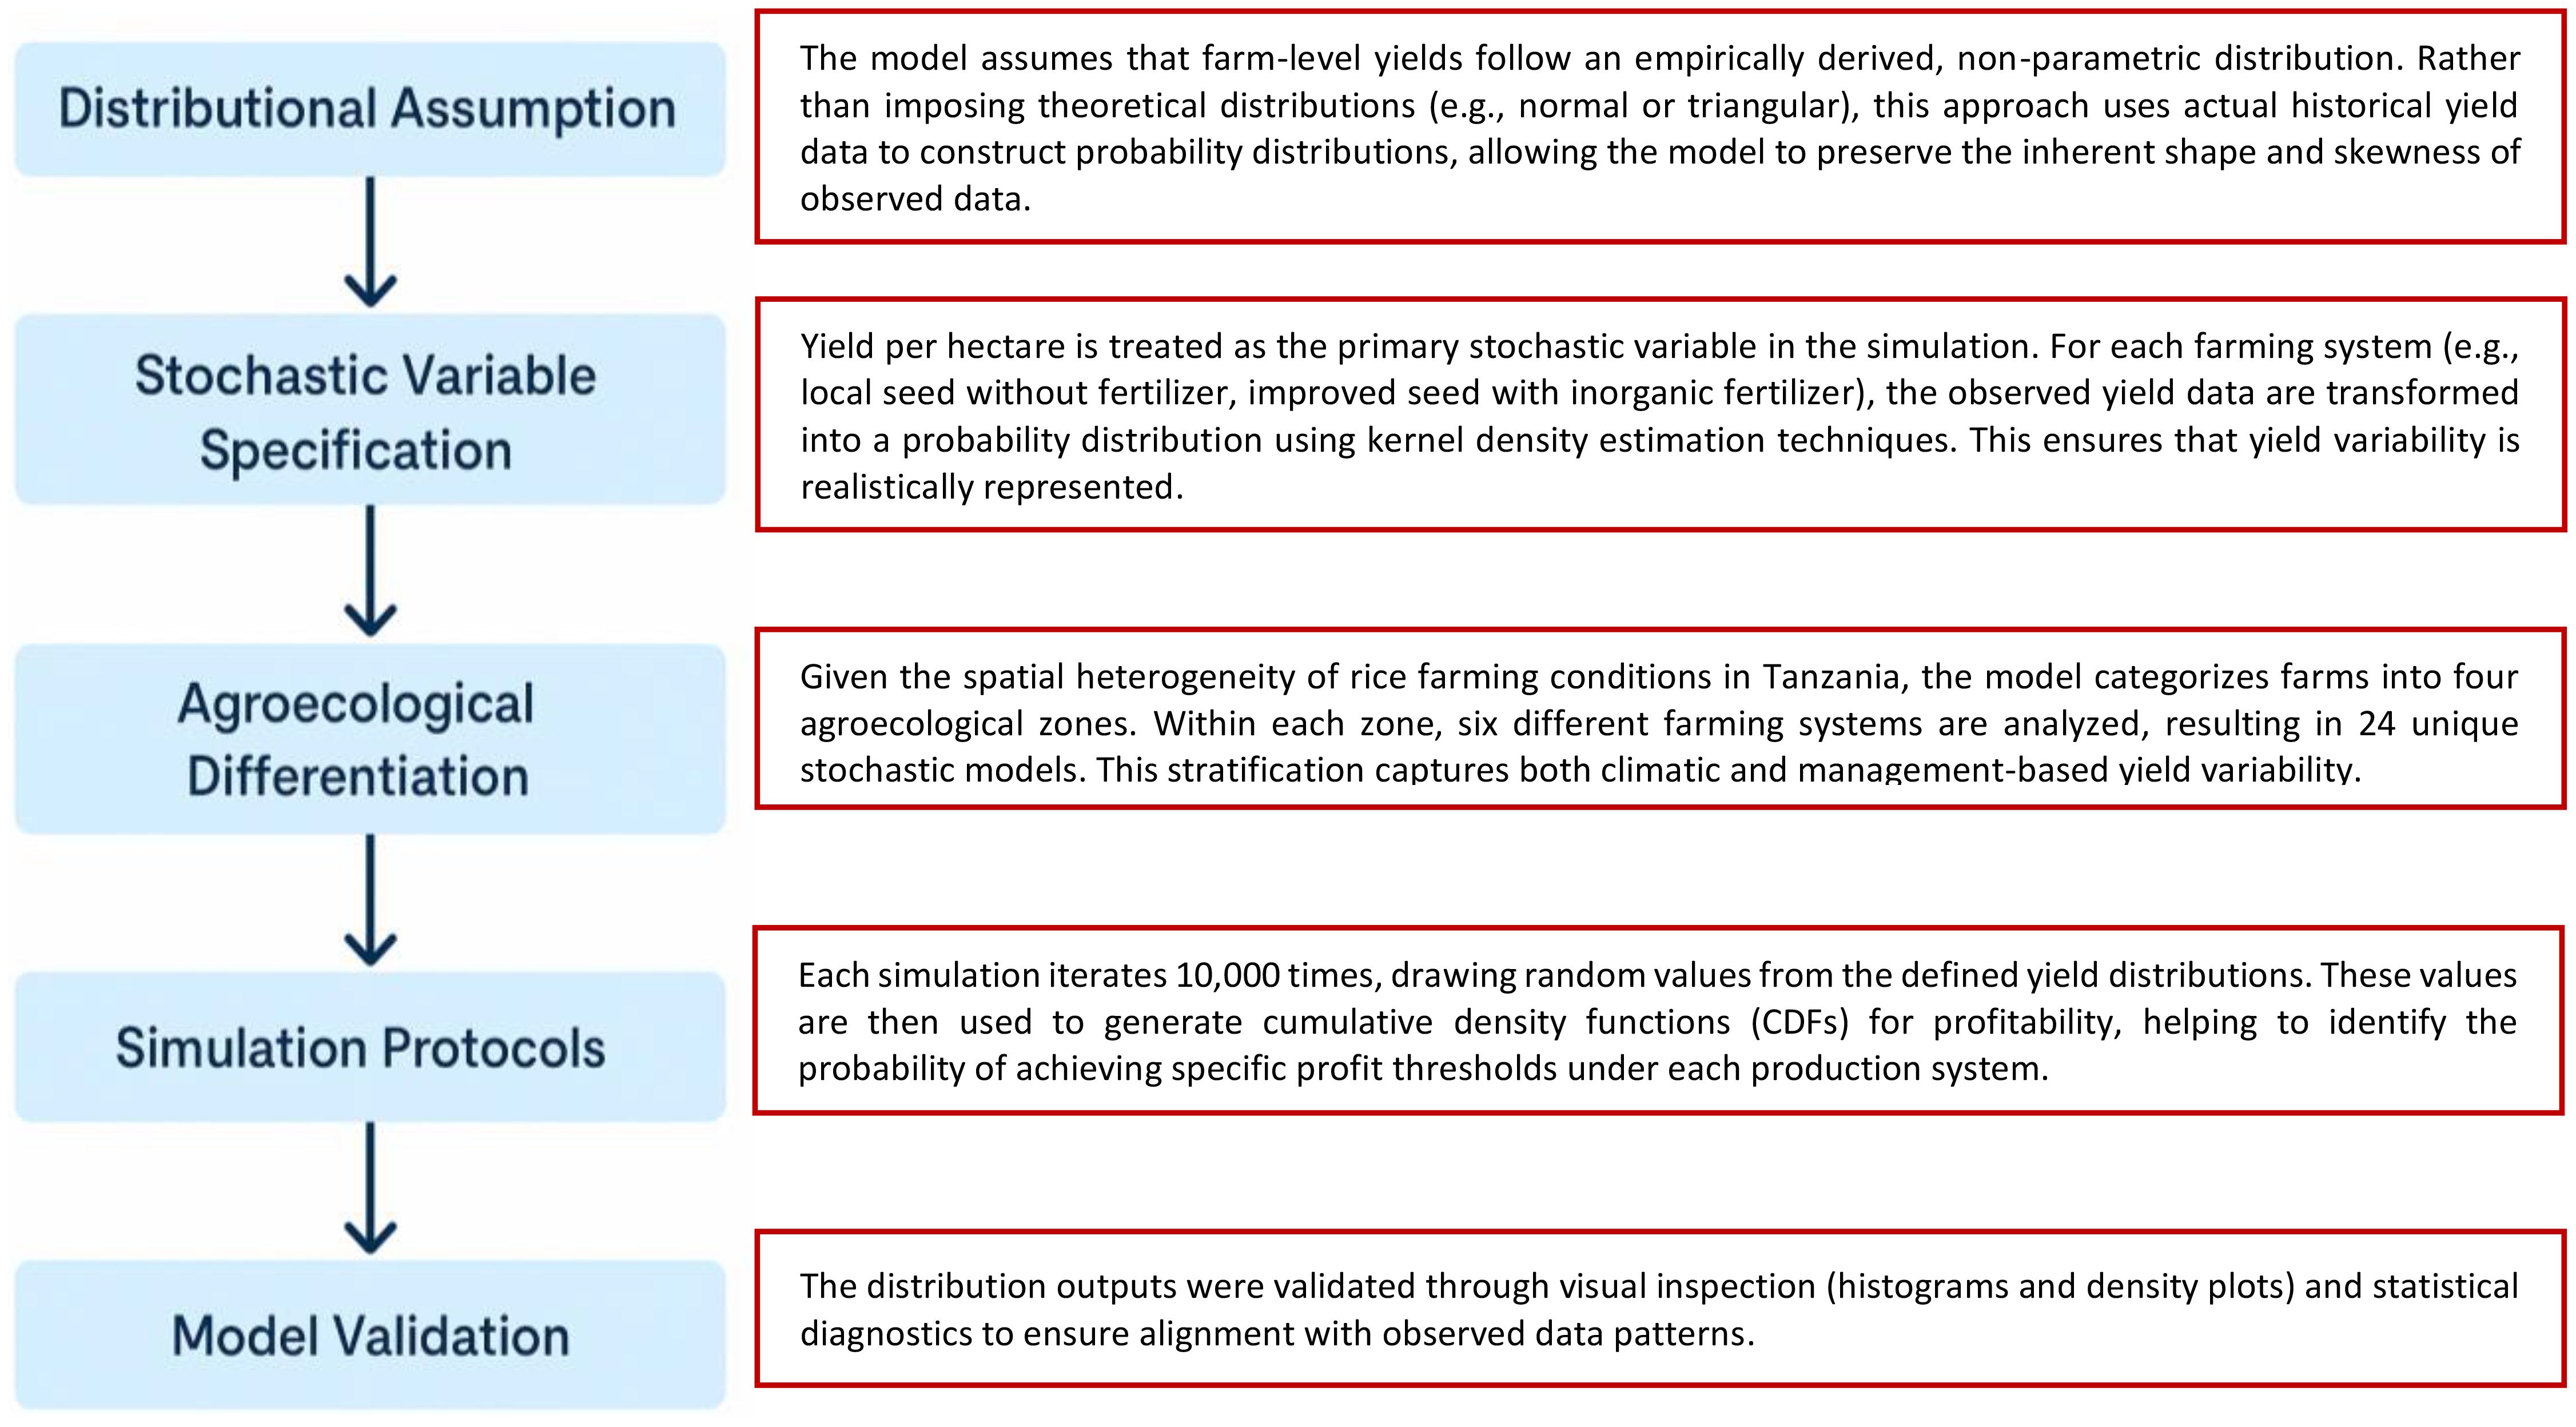
Figure 2. Assumptions and structure of the risk simulation model.
2.3.2 Price data
Price data for local and improved rice varieties were collected and analyzed to evaluate farm-level NFI under different input combinations. Our analysis revealed minor but meaningful differences in the prices between local and improved varieties, which could significantly influence farmers’ net income. Rice price was treated as a stochastic variable due to its variability across seasons and market conditions. Typically, during the harvesting season (April to September), rice prices tend to decline due to increased supply, whereas from October to March, prices generally rise when supply is low, aligning with trends reported by Kadigi et al. (2020).
Table 2 summarizes the distribution of price data, including average, minimum, and maximum values, used in the analysis for both rice varieties. The data also captures farmers’ seasonal fluctuations and market dynamics when selling their produce. We employed the GRKS (Gray, Richardson, Klose, and Schumann) probability distribution function within the Simetar software using the procedures described by Richardson et al. (2000; 2008) and Schumann et al. (2011) to simulate the stochastic nature of these rice prices. This distribution is particularly suitable because it accounts for the entire range of prices (minimum, average, and maximum), rather than relying solely on a single point estimate.
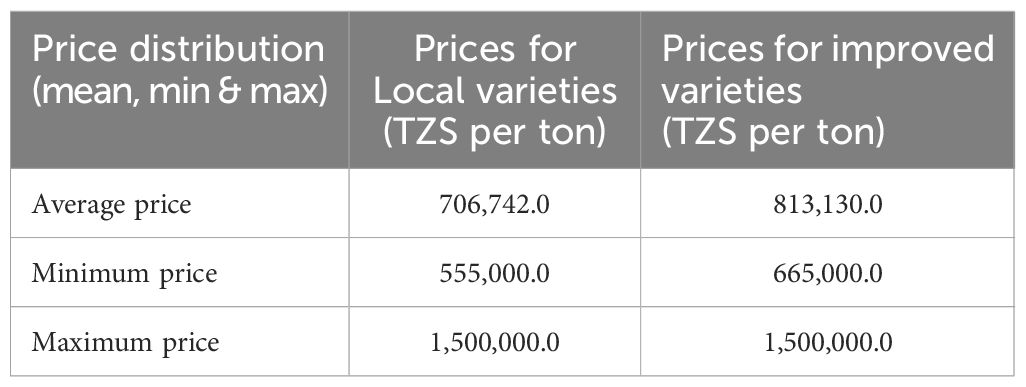
Table 2. Rice price distribution for local and improved varieties.
Equation 2 was therefore used to simulate the stochastic rice price for farmers using either local or improved seed.
Where GRKS = Gray, Richardson, Klose, and Schumann Simetar a function.
j = Prices for variety j (local or improved).
Min = Minimum Price farmers would sell their rice.
Max = The maximum price farmers would sell their rice.
Average = The average price (TZS/ton) that farmers would sell their rice.
= Stochastic price for local and improved varieties.
2.3.3 Production cost data
Each farming system’s production cost and input price data were systematically compiled and analyzed. These costs included key input categories such as seed, land preparation, planting, seed cost, irrigation (where applicable), weeding, fertilizer, herbicides, harvesting, and transportation from farm to storage. Depending on farm-specific practices, additional inputs such as fungicides, insecticides, and miscellaneous costs were also considered. Since production costs vary significantly across individual farms, they were treated as stochastic variables in the simulation model. This variability reflects farmers’ differences in farming practices, resource use, and market access. The GRKS function was applied to estimate stochastic costs based on three key values: the minimum, average, and maximum observed costs for each input to capture this randomness (Table 3).
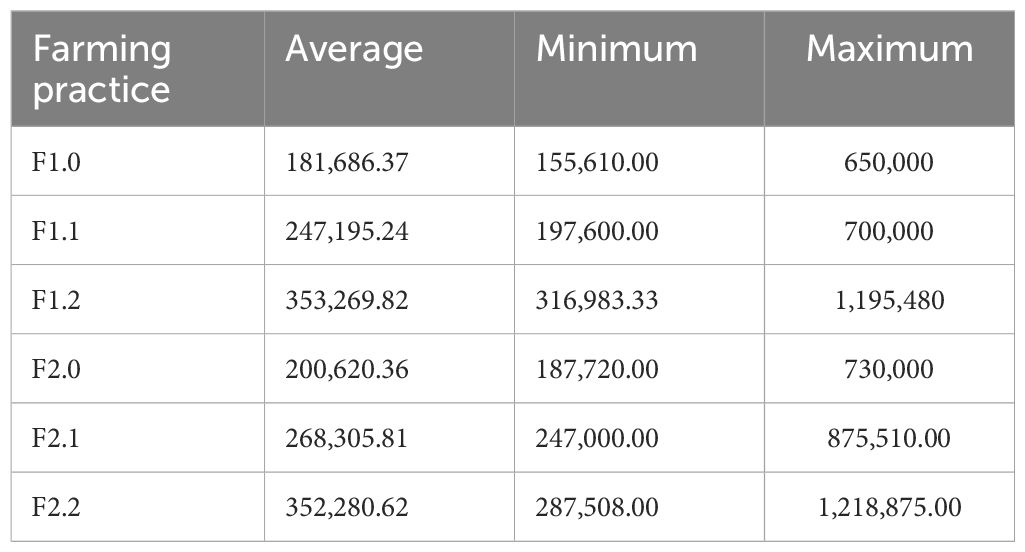
Table 3. Production cost distribution for farms using local and improved varieties.
The total stochastic production cost for each farm was calculated using Equation 3:
2.3.4 Stochastic net farm income simulation
The estimation of NFI for each farm was performed using a stochastic simulation approach. The process began by calculating the stochastic production levels, as outlined in Equation 4. This involved multiplying the simulated yield per hectare by the farm’s total cultivated area. Next, the gross revenue was computed using Equation 5. This represented the total value (in Tanzanian Shillings) that a farmer would earn if the entire output were sold at the given stochastic market price. Importantly, this gross revenue does not account for the production costs. Finally, the stochastic net farm income was derived using Equation 6, which deducts the simulated total production cost from the gross revenue. This represents the farm-level net income associated with producing 1 ton of rice, taking into account variability in yields, prices, and costs.
Where = The stochastic output (in tons) for farming practice i, for agroecological zone .
= The stochastic yield per hectare for farming practice i, for agroecological zone .
= Area cultivated by farmers in farming practice i, for agroecological zone .
= Stochastic revenue gained by farmers in farming practice i, for agroecological zone .
= The stochastic price (TZS/ton) for rice variety j.
= Stochastic price for local and improved varieties.
= The stochastic production cost for farming practice i, for agroecological zone .
2.4 Assumptions and structure of the risk simulation model
The data analysis in this study employs RSM grounded in a non-parametric Monte Carlo simulation (stochastic) approach, as adapted from Kadigi et al. (2020; 2025b) and extensively applied by Richardson et al. (2000, 2003, 2007). Monte Carlo simulation is a widely accepted method for assessing uncertainty and risk by generating probability distributions for stochastic variables (here rice yield per hectare) based on empirical data. The RSM was employed in this study because it does not rely on causal inference methods such as instrumental variables or matching techniques. Instead, the model probabilistically simulates the yield and income outcomes for different groups of farmers (i.e., users and non-users of improved inputs) using historical yield data and observed distributions. This approach is designed to explore the variability and risk associated with different input adoption scenarios rather than to estimate causal treatment effects. The simulation results are intended to inform policy by illustrating potential yield and profitability outcomes under various adoption configurations. On the other hand, the model used in this study relies on historical data from the 2019/20 NSCA, meaning that climate variability is inherently embedded in the observed yield and income distributions. Consequently, the variability arising from past rainfall fluctuations and other climate-related shocks is captured within the stochastic yield simulations (Kadigi et al., 2025a; 2025b, Richardson et al., 2000). While explicit climate metrics (e.g., rainfall variability indices or drought scores) were not incorporated in the model, the influence of climate volatility is implicitly reflected in the data. The key assumptions and structure of the RSM are as summarized in Figure 2.
2.5 Ranking of target probabilities using the stoplight function
The Stoplight Chart function was used to rank the probabilities of rice farms achieving the maximum profit threshold and the probabilities of falling below the minimum threshold per unit area (which is ha in this study). The stoplight function calculates the probabilities of (a) exceeding the upper target (green), (b) being less than the lower target (red), and (c) falling between the targets (yellow). The views from various rice actors, particularly farmers, revealed that farmers were likely to be happier if their net farm return (profit) per ha was equal to or greater than TZS 4 million per ha; hence, we set the maximum threshold at TZS 4.0 million/ha. Farmers perceived a net return of TZS 4.0 million/ha or more as a level that ensures satisfaction and livelihood improvement. On the other hand, farmers revealed that a profit below TZS 2.0 million/ha would make them unhappy, with the highest chances of being income-based food insured. Therefore, we set the minimum threshold at TZS 2.0 million/ha. These thresholds are therefore grounded in stakeholder perceptions rather than fixed national poverty lines or statistical break-even points, making them more reflective of real-world NFI experiences and risk perceptions in the Tanzanian rice farming context.
3 Results and discussion
3.1 Model validation
The stochastic model used in this analysis was validated to ensure it accurately simulated the farming practices under investigation. The stochastic model was validated using probability density function (PDF) charts to compare observed and simulated yield distributions. These comparisons were made across various farming scenarios in Tanzania, including:
i. Yield of farms using local seeds without fertilizer (F1.0).
ii. Yield of farms using local seeds with organic fertilizers (F1.1).
iii. Yield of farms using local seeds with inorganic fertilizers (F1.2).
iv. Yield of farms using improved seeds without fertilizer (F2.0).
v. Yield of farms using improved seeds with organic fertilizers (F2.1).
vi. Yield of farms using improved seeds with inorganic fertilizers (F2.2).
Figure 3 summarizes the validation results of this model using the probability distribution function (PDF). The PDF charts demonstrate a striking resemblance between the observed and simulated distributions, indicating a strong correlation between the two. This visual alignment provides compelling evidence that the simulation model accurately captures the underlying statistical properties of the real-world farming practices under study. The close match between the observed and simulated data underscores the model’s reliability and its effectiveness in replicating the actual conditions and outcomes in the agricultural context. Following validation, the second step involved examining the impact of the selected farming practices on the NFI of rice farms across Tanzania. We analyzed the impact on farms located in Mainland Tanzania and those in Zanzibar. Also, the analysis extended to assess the impact on farms located in high-producing agroecological zones, specifically the SHZ and the EZ.
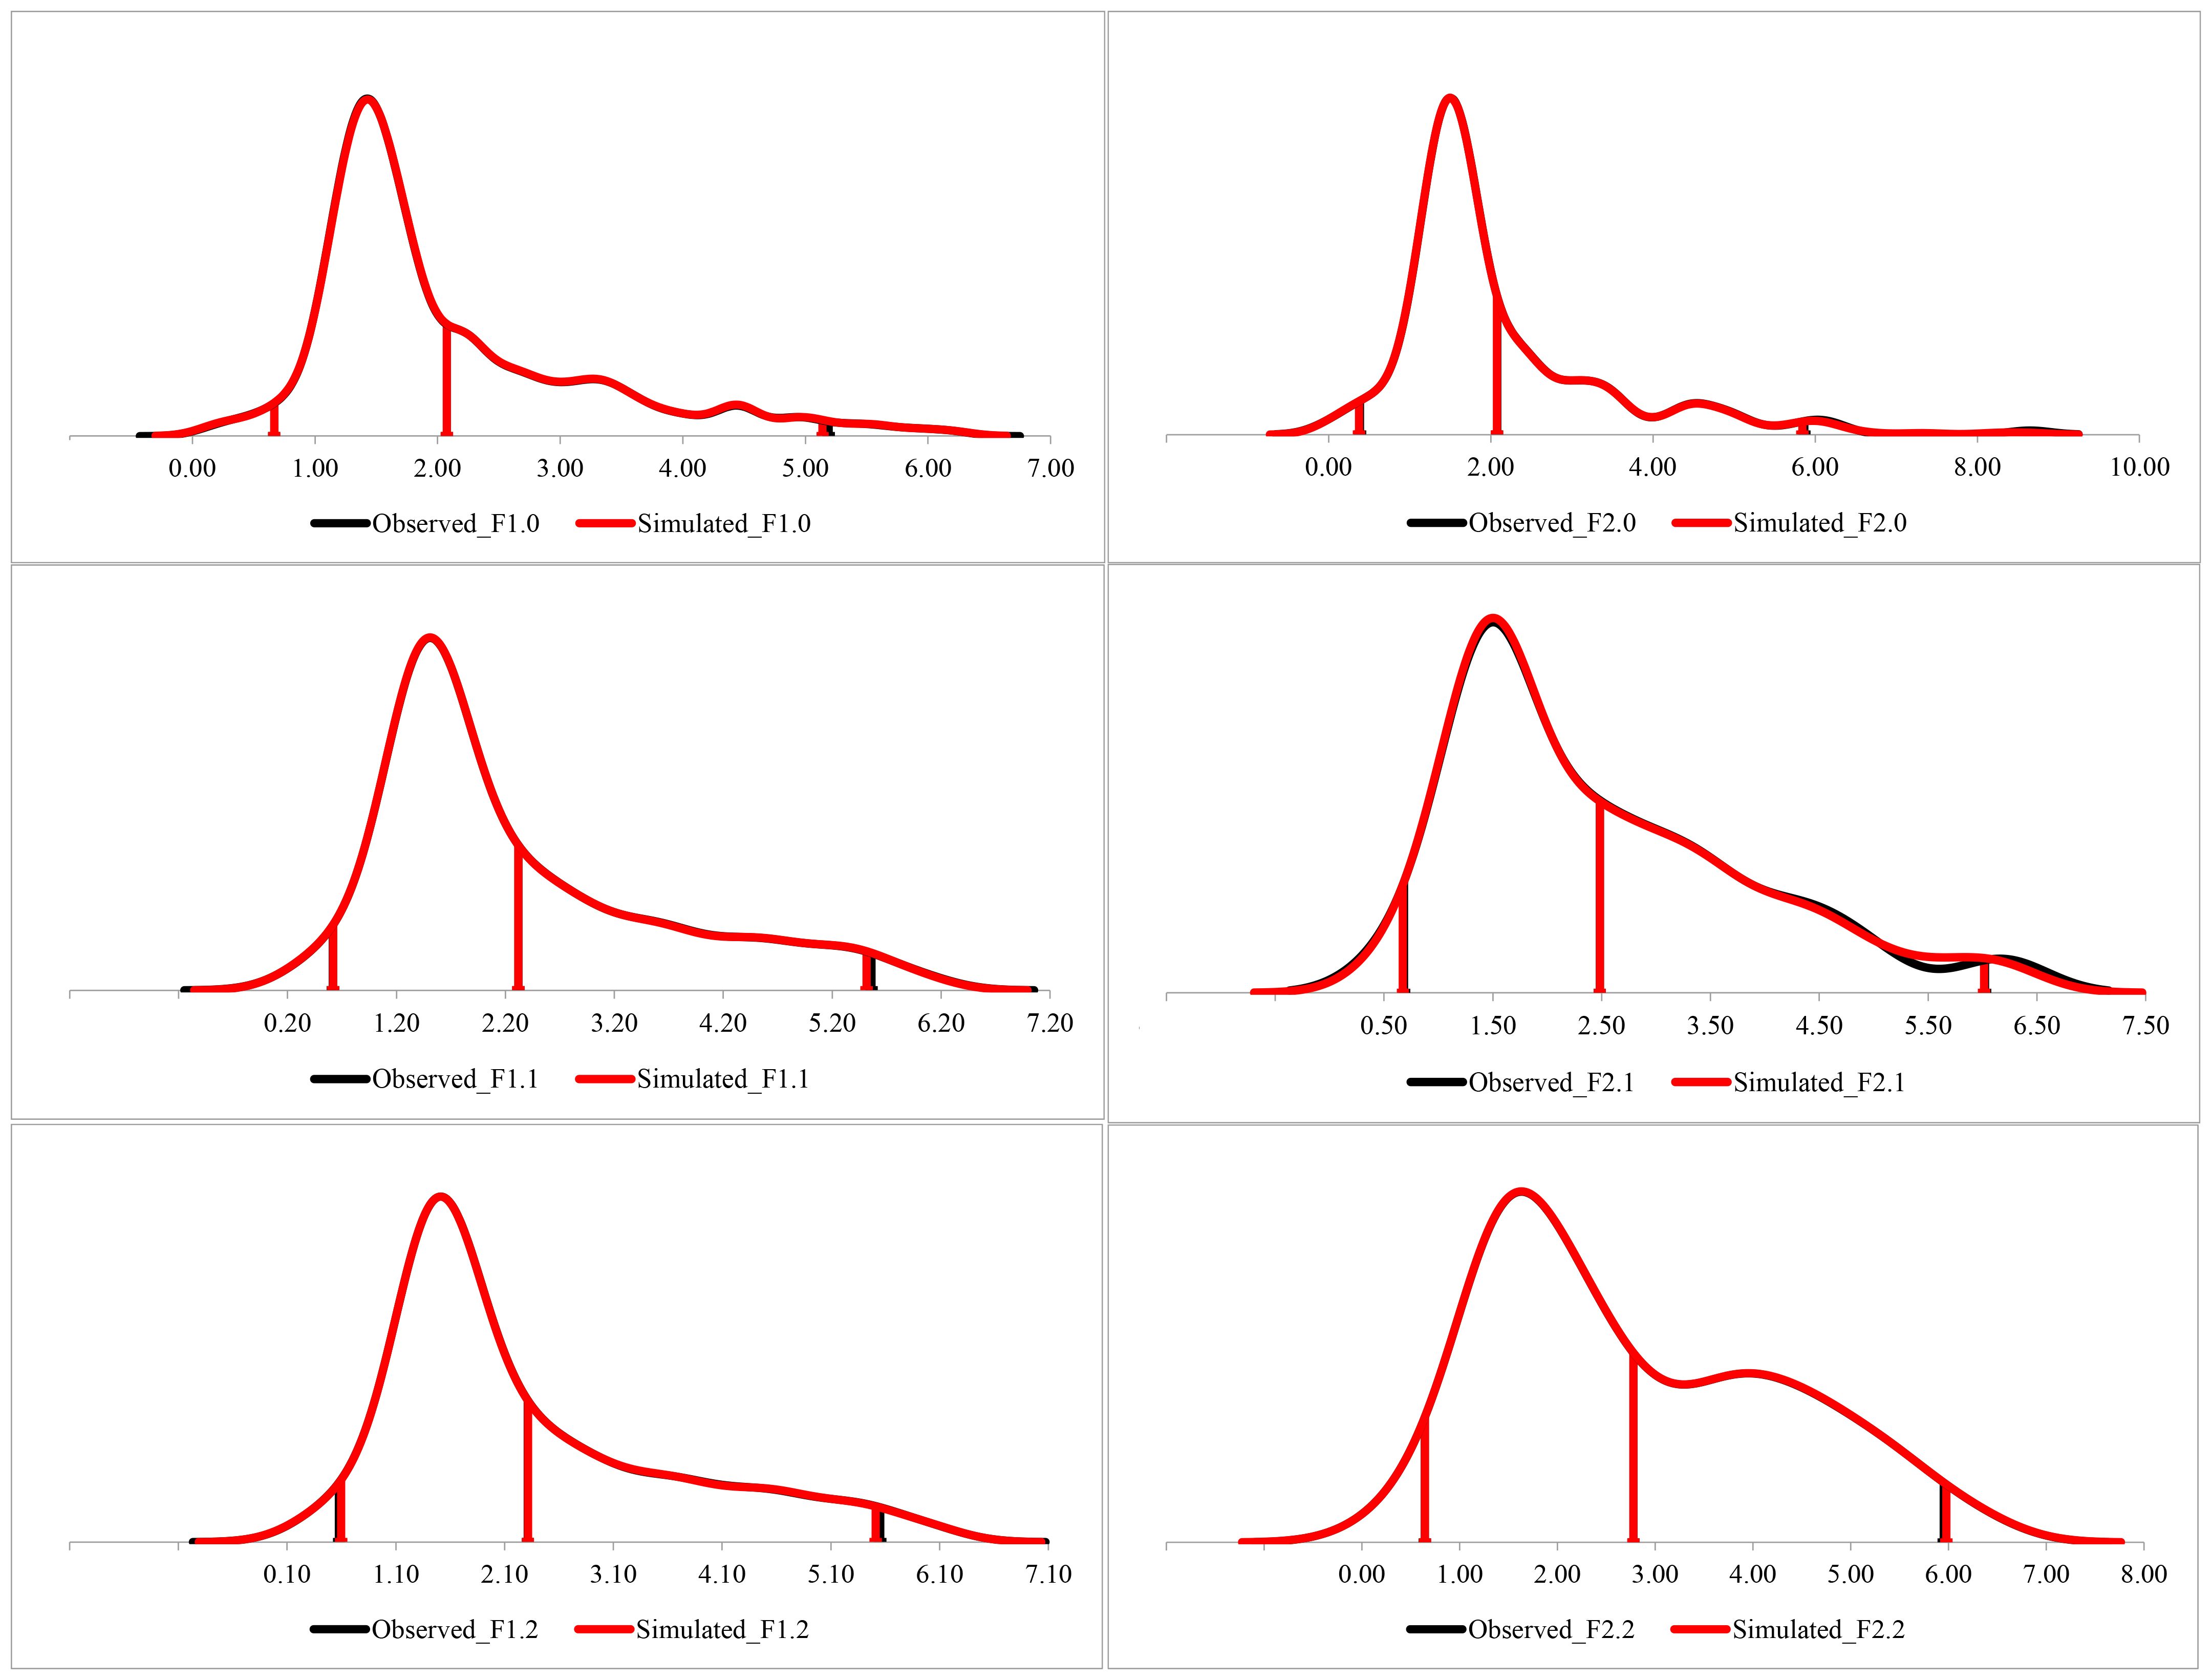
Figure 3. PDF charts show the comparison of observed and simulated distributions for a yield of all farms in Tanzania using local seeds without fertilizer (F1.0), farms using local seeds + organic fertilizers (F1.1), farms using local seeds + inorganic fertilizers (F1.2), farms using improved seeds without fertilizer (F2.0), farms using improved seeds + organic fertilizers (F2.1), farms using improved seeds + inorganic fertilizers (F2.2).
3.2 NFI of rice farms using local or improved seeds without fertilizers (organic/inorganic)
Traditional procedures were followed to evaluate the NFI of improved seed coupled with the application of fertilizers (organic/inorganic), where the net revenue is obtained by subtracting the total cost from gross revenue. Rice yield (a key stochastic variable) was first simulated to generate the stochastic output per ha. The rice yield/productivity data for each farming practice are summarized in Supplementary Material Table 1, and Table 2. Meanwhile, the total cost used by farmers across agroecological zones in Tanzania is stipulated in Supplementary Material 2 (Table 4, Supplementary Table 5) with Supplementary Table 6 summarizing the price.
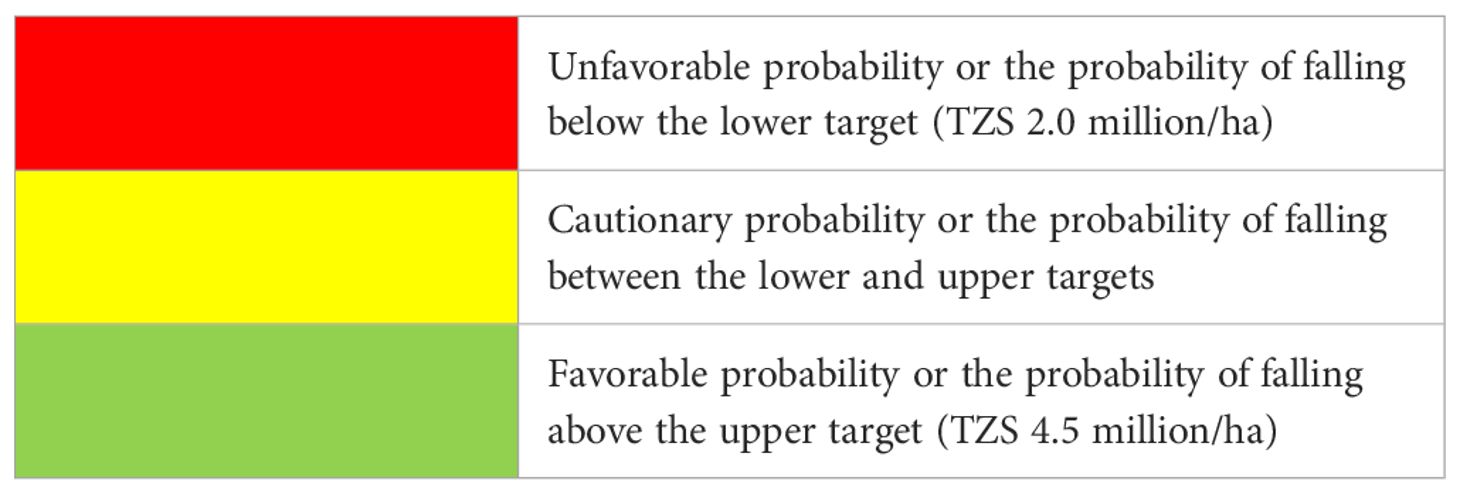
Table 4. Criteria for ranking of target probabilities.
The results in Figure 4 illustrate the NFI distribution of rice farmers in Tanzania, using either local or improved seeds, without applying fertilizers, across different regions. The findings indicate that farmers relying on local seeds without fertilizers face substantial NFI challenges, with a high probability (78%) of earning below the minimum NFI threshold of TZS 2.0 million/ha across all farms in Tanzania. Only 4% of these farmers surpass the upper-NFI threshold of TZS 4.0 million/ha, underscoring the limited NFI of this farming approach. The situation is even more severe in Zanzibar, where 88% of farms fall below the minimum NFI level, making them the least profitable. Meanwhile, in Mainland Tanzania, NFI is slightly better, with 79% of farms earning below TZS 2.0 million/ha and only 4% exceeding TZS 4.0 million/ha. On the other hand, farmers using improved seeds without fertilizers experience a marginally lower risk of low NFI compared to their counterparts using local seeds. Across all farms in Tanzania, the probability of earning below TZS 2.0 million/ha decreases slightly to 75%, while the likelihood of exceeding TZS 4.0 million/ha increases to 8%. This pattern is observed in both Mainland Tanzania and Zanzibar, with Mainland farms exhibiting a slightly more equitable NFI distribution than those in Zanzibar. However, despite the moderate improvement, farmers using improved seeds without fertilizers still face a high probability (above 70%) of falling into the low-NFI category, indicating that seed improvement alone is insufficient to ensure NFI.
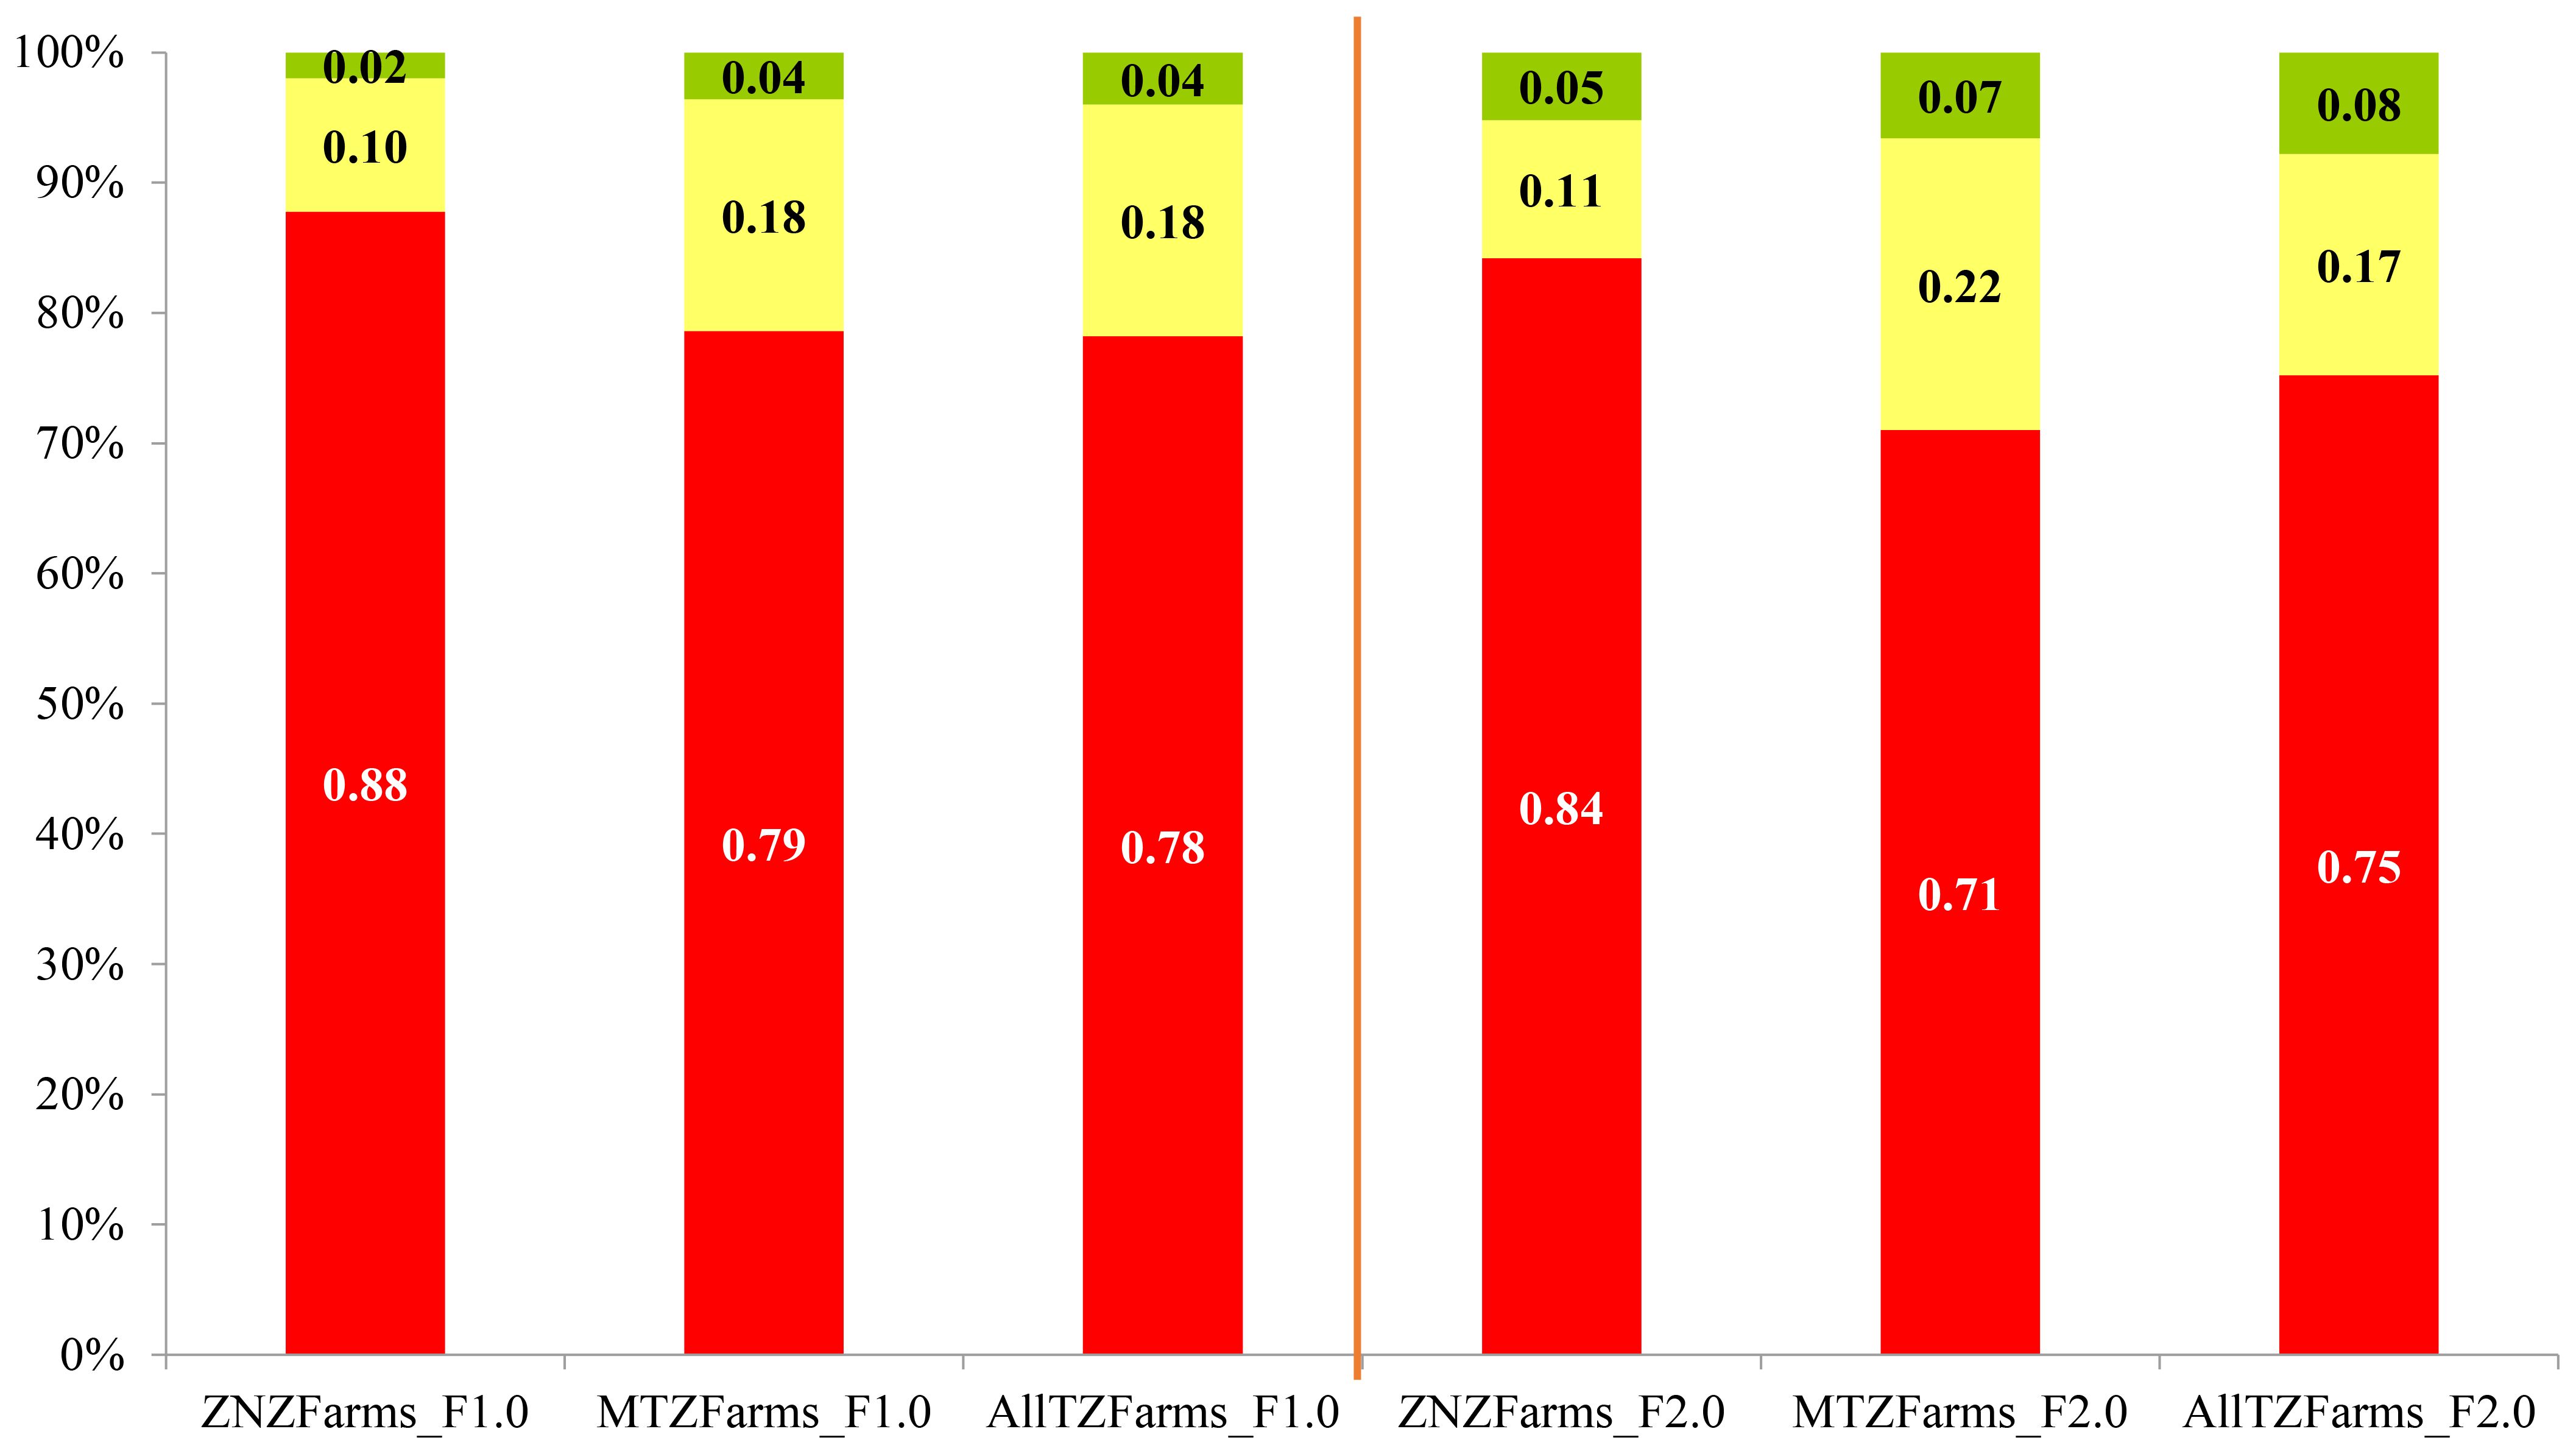
Figure 4. The probabilities of NFI falling above the maximum threshold of TZS 4.0 million/ha (in green) and less than the minimum NFI of TZS 2.0 million/ha (in red), and the probability of falling between the two thresholds for rice farmers using either local or improved seeds without fertilizers for farms located in Zanzibar and Mainland Tanzania. Note: ZNZFarms_F1.0 = farms using local seeds without fertilizers in Zanzibar; MTZFarms_F1.0 = farms using local seeds without fertilizers in Mainland Tanzania; AllTZFarms_F1.0 = farms using local seeds without fertilizers across all farms in Tanzania; ZNZFarms_F2.0 = farms using improved seeds without fertilizers in Zanzibar; MTZFarms_F2.0 = farms using improved seeds without fertilizers in Mainland Tanzania; AllTZFarms_F2.0 = farms using improved seeds without fertilizers across all farms in Tanzania.
These findings highlight critical challenges to rice farming NFI in Tanzania, particularly when relying solely on seed improvement without complementary inputs, such as fertilizers. The marginal improvement in NFI probabilities with improved seeds (from 75% low-income risk to 78% for local seeds) underscores that seed enhancement alone is insufficient to ensure NFI. This aligns with Feder and Savastano (2017), who argue that improved seeds often fail to deliver significant yield gains without synchronized inputs, such as fertilizers, as soil nutrient depletion in Sub-Saharan Africa limits their efficacy. The study’s results reflect this systemic issue, where Tanzanian farmers using improved seeds still face a probability of low income exceeding 70%, suggesting that seed technology must be part of a broader package. The stark contrast between Mainland Tanzania (79% low income for local seeds) and Zanzibar (88%) highlights agroecological and institutional disparities. Moh’d et al. (2017) note that Zanzibar’s smaller landholdings, saline soils, and limited access to extension services exacerbate vulnerabilities compared to the Mainland. These regional differences emphasize the need for context-specific interventions rather than uniform policies.
Even with improved seeds, the persistently high likelihood of low-income probabilities (>70%) reinforces the necessity of integrated practices. Sheahan et al. (2014) and Ogeto and Jiong (2019) demonstrate that combining improved seeds with fertilizers can increase yields by 30–50% in Sub-Saharan Africa. The Tanzanian case mirrors this, as the absence of fertilizers (organic or inorganic) leaves farmers dependent on inherently nutrient-poor soils, a barrier also noted in Masso et al. (2017) and Vanlauwe and Giller (2006) report advocating for holistic soil management. The dominance of low-income probabilities across all farms suggests systemic issues beyond agronomic inputs. Jayne et al. (2022) identify limited market access, post-harvest losses, and climate variability as critical constraints in Tanzanian agriculture. Even with improved seeds, farmers remain trapped in low-revenue cycles due to these structural challenges, necessitating multi-sectoral interventions.
The study highlights the importance of policies that promote integrated resource use. For instance, subsidizing fertilizers alongside improved seeds, as successfully implemented in Malawi’s Farm Input Subsidy Programme (Dorward and Chirwa, 2012), could break the cycle of low productivity. Additionally, targeting Zanzibar’s unique challenges (e.g., saline-resistant seeds, and microcredit access) is vital for equitable growth. While improved seeds offer a marginal advantage, their standalone use fails to address Tanzania’s deeper agricultural constraints. A shift toward integrated practices, regional tailoring, and systemic support is essential to elevate farmers above subsistence thresholds.
3.3 NFI of rice farms using local or improved seeds with organic fertilizers
Figure 5 presents the results of the NFI distribution of rice farmers in Zanzibar and Mainland Tanzania, as well as across all farms in Tanzania, using either local or improved seeds with organic fertilizers. The results reveal that applying organic fertilizers enhances NFI compared to farming without fertilizers (as shown in Figure 3 above). However, a significant proportion of farmers still fall below the minimum NFI threshold of TZS 2.0 million/ha (represented in unfavorable probability or red). Farmers using local seeds with organic fertilizers continue to face financial constraints; 74% of farms across Tanzania earn below TZS 2.0 million/ha, with farmers in Zanzibar having the highest probability of 88%, and those on the mainland performing relatively better, with a lower 69% probability. The probability of NFI falling between the two thresholds seems to remain unchanged for farms across Tanzania and those in Zanzibar, with those in Mainland Tanzania showing an improvement. The probabilities of NFI exceeding TZS 4.0 million/ha are 7%, 6%, and 2% for all farms across the country, the Mainland, and Zanzibar, respectively.
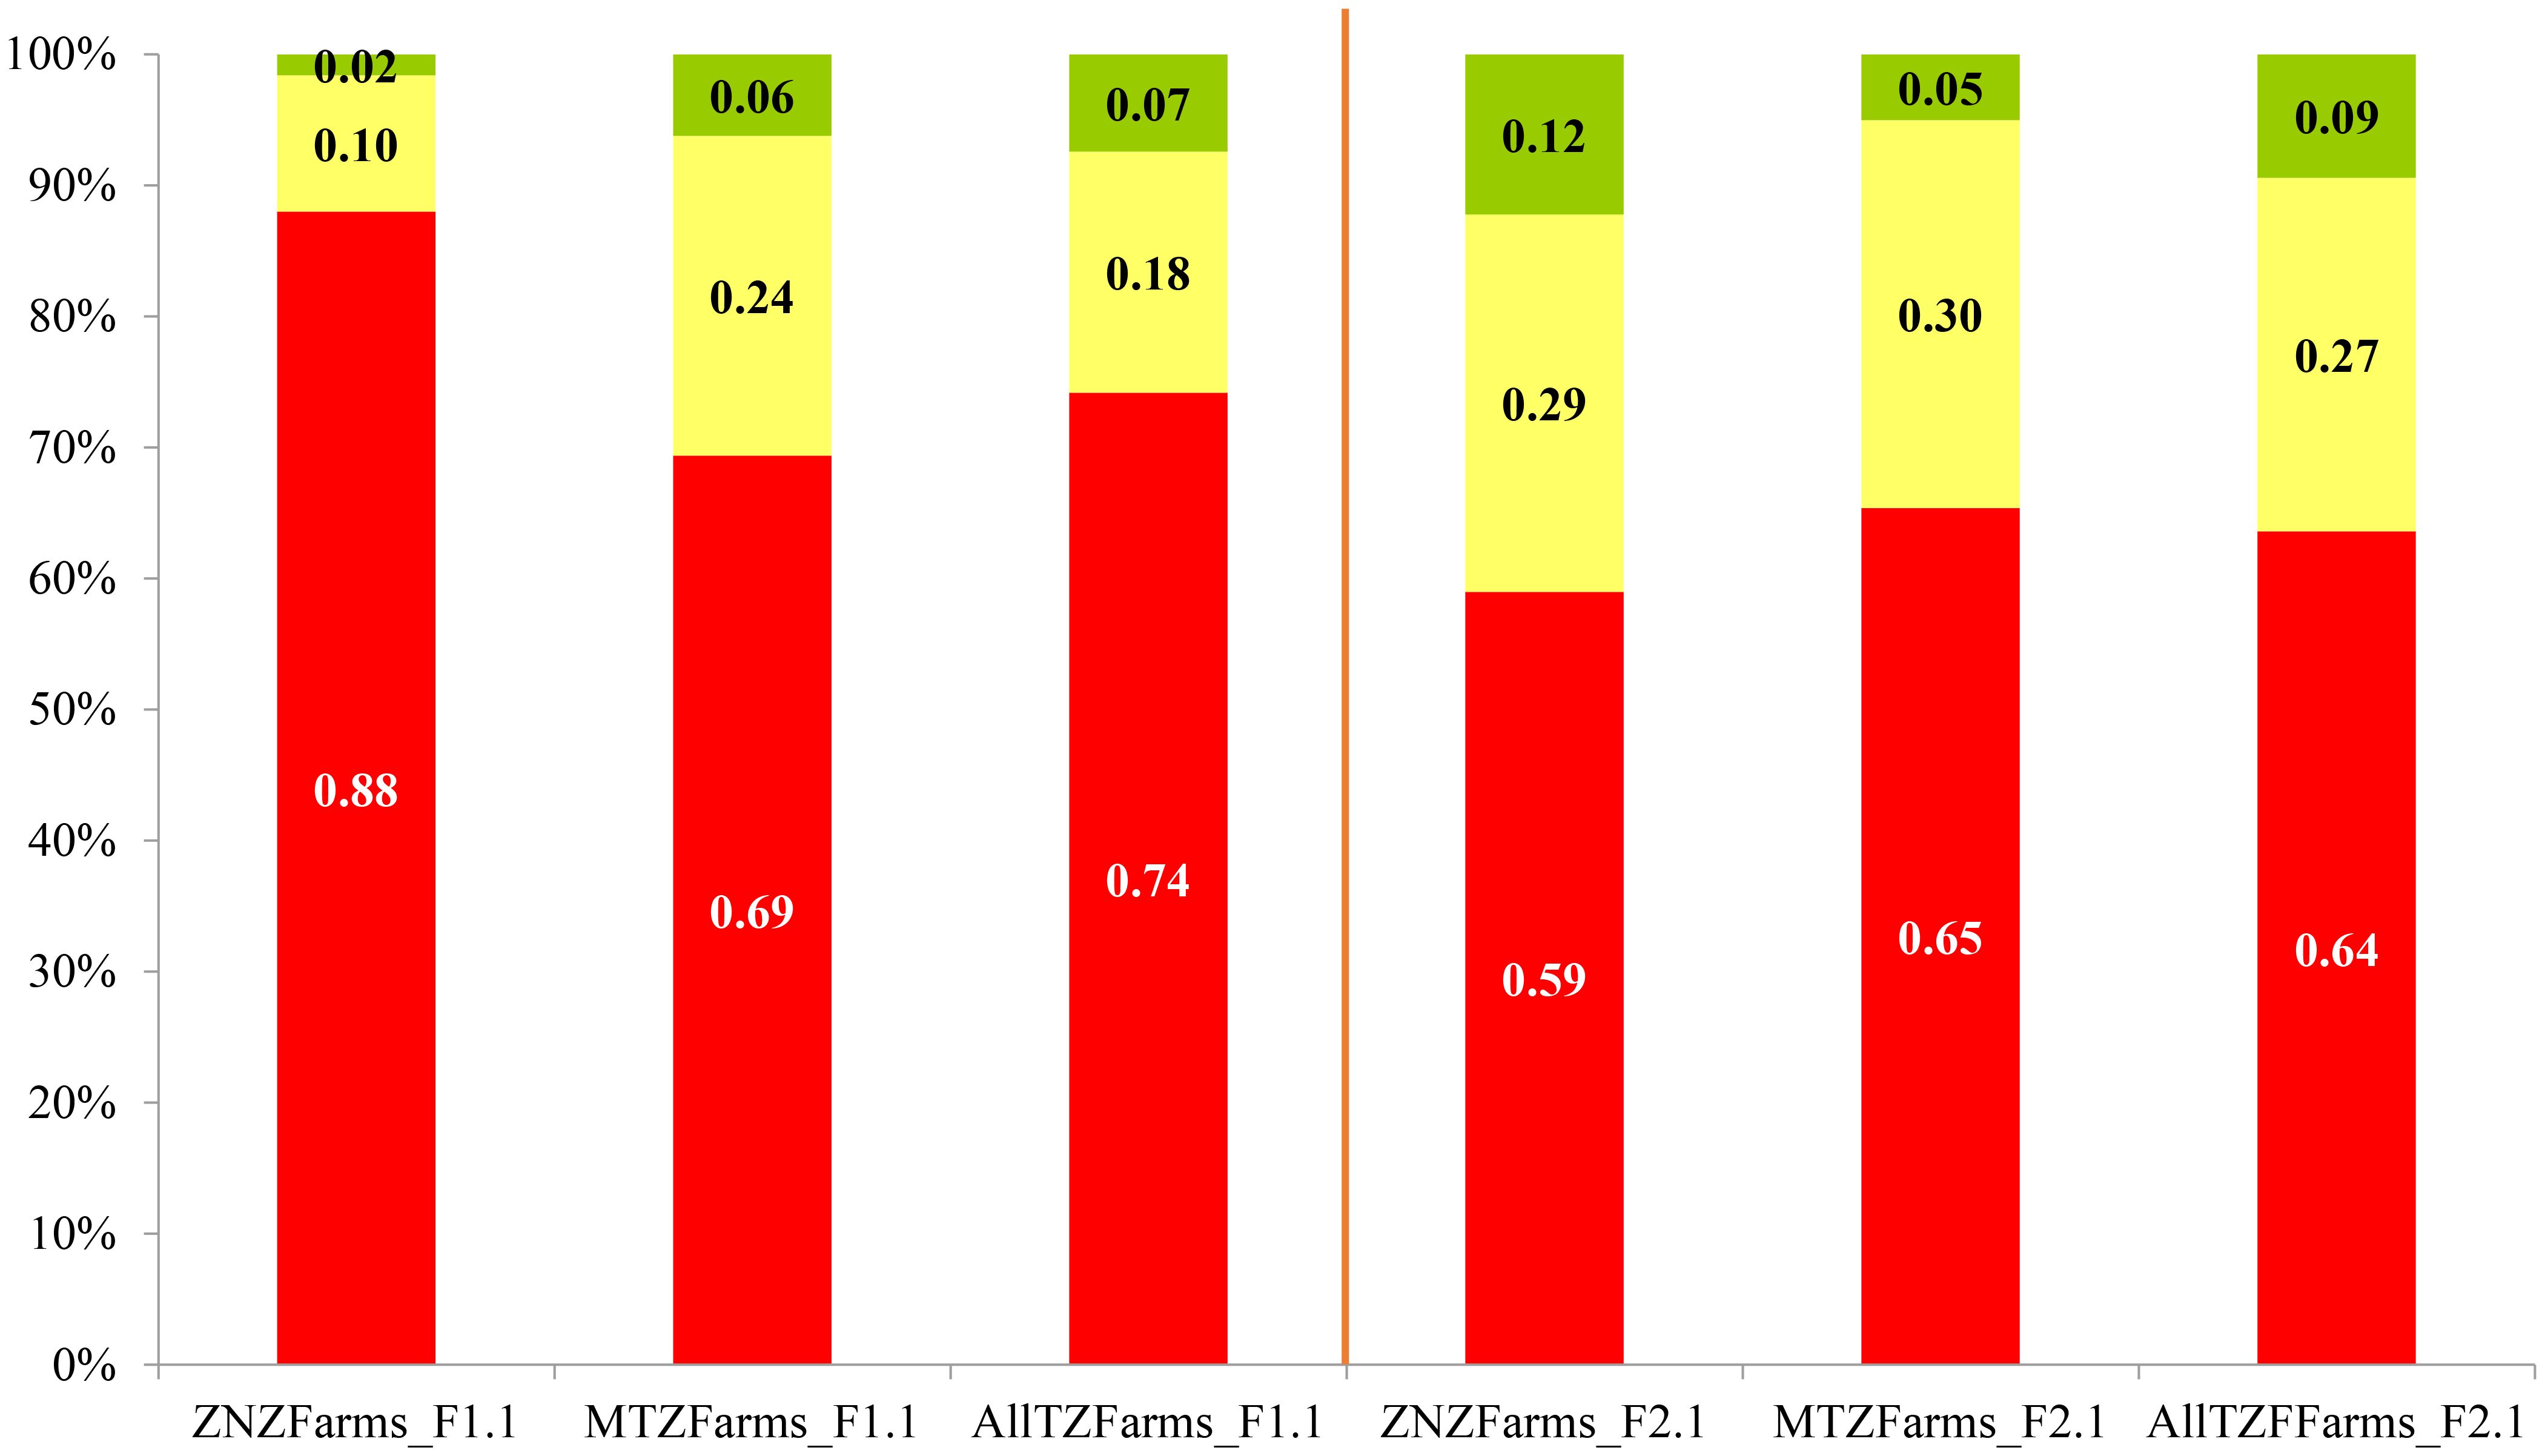
Figure 5. The probabilities of NFI falling above the maximum threshold of TZS 4.0 million/ha (in green) and less than the minimum NFI of TZS 2.0 million/ha (in red), and the probability of falling between the two thresholds for rice farmers using either local or improved seeds with organic fertilizers for farms located in Zanzibar and Mainland Tanzania. Note: ZNZFarms_F1.1 = farms using local seeds with organic fertilizers in Zanzibar; MTZFarms_F1.1 = farms using local seeds with organic fertilizers in Mainland Tanzania; AllTZFarms_F1.1 = farms using local seeds with organic fertilizers across all farms in Tanzania; ZNZFarms_F2.1 = farms using improved seeds with organic fertilizers in Zanzibar; MTZFarms_F2.1 = farms using improved seeds with organic fertilizers in Mainland Tanzania; AllTZFarms_F2.1 = farms using improved seeds with organic fertilizers across all farms in Tanzania.
On the other hand, farmers who use improved seeds with organic fertilizers show a notable improvement in NFI distribution. In Zanzibar, the probability of earning below TZS 2.0 million/ha drops significantly to 59%, with 12% of farmers surpassing the upper-income threshold of TZS 4.0 million/ha. Similarly, in Mainland Tanzania, the proportion of low-income farms reduces to 65%, while 5% surpasses the higher NFI threshold. Across all farms in Tanzania, the probability of earning below the lower threshold is 64%, with 9% exceeding the TZS 4.0 million/ha mark.
These findings underscore that a combination of improved seeds and organic fertilizers significantly reduces the likelihood of low-income households (e.g., Zanzibar: 59% with improved seeds vs. 88% with local seeds). This aligns with Vanlauwe et al. (2015), who emphasize that improved seeds require complementary organic inputs to unlock their genetic potential, particularly in nutrient-depleted soils. Organic fertilizers enhance soil structure and microbial activity, which synergizes with the improved yield capacity of seeds. However, the modest upper threshold exceedance (e.g., 12% in Zanzibar) suggests that organic fertilizers alone may not fully substitute inorganic fertilizers in high-productivity systems, a limitation noted by Place et al. (2003) and Vanlauwe et al. (2015) in their analysis of integrated soil fertility management (ISFM) in Sub-Saharan Africa (SSA). Zanzibar’s lower performance (59% low NFI with improved seeds + organic) compared to the Mainland (65%) reflects entrenched agroecological and institutional challenges. Moh’d et al. (2017) attribute Zanzibar’s struggles to saline soils, smaller landholdings, and limited access to extension services. Organic fertilizers, while beneficial, may not sufficiently address salinity or micronutrient deficiencies, necessitating region-specific amendments like gypsum or composted manure, as advocated by Kahimba et al. (2016); Mwesige et al. (2024), and Omar et al. (2024).
Despite improvements, 64% of farmers nationwide still fall below TZS 2.0 million/ha, even with the use of improved seeds and organic fertilizers. This echoes Snapp (1998), who argue that organic fertilizers often lack sufficient nutrient density to meet crop demands in degraded soils, especially without supplemental inorganic inputs. In Tanzania, where soil organic carbon levels are critically low (≤1% in many regions), organic fertilizers alone may only partially restore fertility, as shown in the persistently low probabilities of exceeding TZS 4.0 million/ha (9% nationally). The results underscore the need for policies promoting ISFM, which combines organic and inorganic fertilizers with improved seeds. As demonstrated in Malawi’s ISFM programs (Kanyama-Phiri et al., 2000; Vanlauwe et al., 2011), such integration can boost yields by 40–60%. Targeted subsidies for organic-inorganic blends and farmer training on compost optimization could help Tanzanian farmers bridge the NFI gap. Additionally, Zanzibar-specific interventions, such as salt-tolerant rice varieties paired with organic amendments, are critical for equity. While organic fertilizers enhance NFI compared to non-fertilizer systems, their standalone use remains insufficient to lift most Tanzanian rice farmers above subsistence thresholds. A holistic approach that combines improved seeds, blended fertilizers, regional adaptations, and systemic support is crucial for achieving a transformative impact.
3.4 NFI of rice farms using either local or improved seeds with inorganic fertilizers
Figure 6 presents the NFI distribution of rice farmers in Zanzibar, Mainland Tanzania, and across Tanzania using local and improved seeds with inorganic fertilizers. The results indicate a notable improvement in NFI distribution compared to using no fertilizers (Figure 4) or organic fertilizers (Figure 5). However, a significant proportion of farmers still earn below the minimum threshold of TZS 2.0 million/ha (red bars), though the share of farmers surpassing the upper threshold of TZS 4.0 million/ha has increased (green bars). There is still a high probability that farmers using local seeds with inorganic fertilizers will continue to experience high NFI uncertainty. 88% of farms in Zanzibar and 76% of farms across Tanzania earn below TZS 2.0 million/ha, while only 1% and 5% exceed TZS 4.0 million/ha, respectively. Mainland Tanzania exhibits slightly better outcomes, with 72% of farms falling into the low-income category and 6% surpassing the upper threshold.
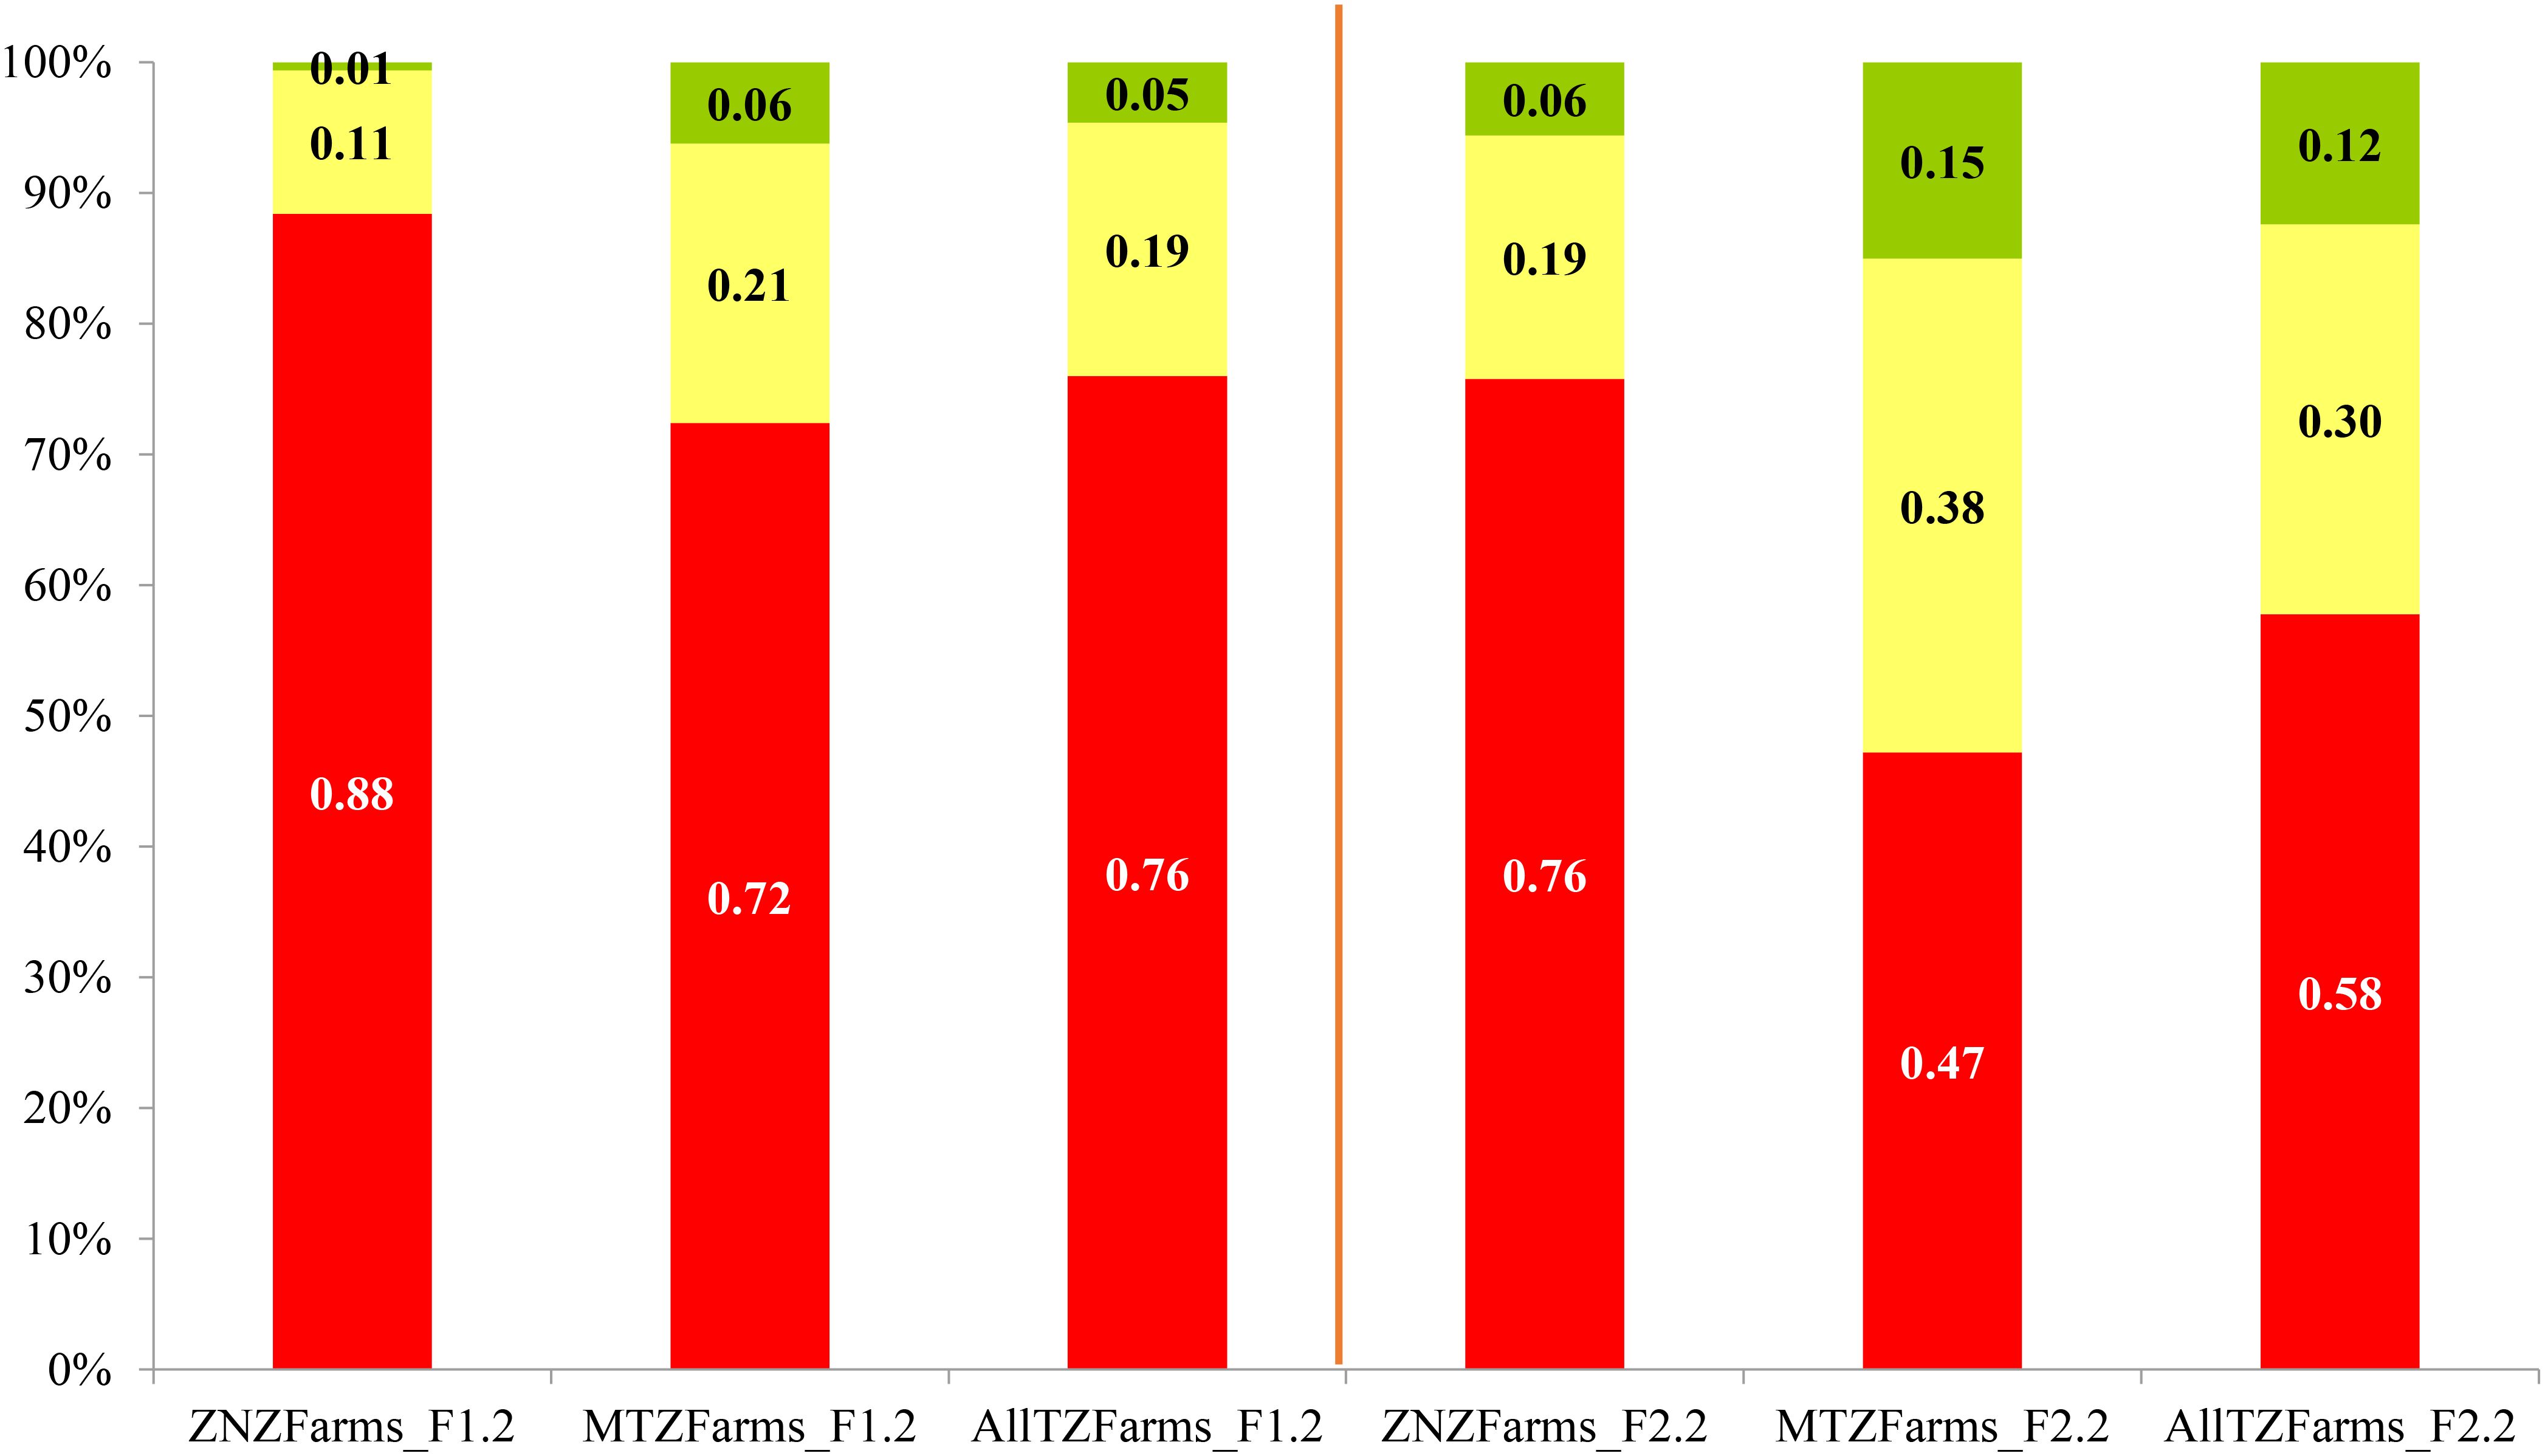
Figure 6. The probabilities of NFI falling above the maximum threshold of TZS 4.0 million/ha (in green) and less than the minimum NFI of TZS 2.0 million/ha (in red), and the probability of falling between the two thresholds for rice farmers using either local or improved seeds with inorganic fertilizers for farms across Tanzania and those located in Zanzibar and Mainland Tanzania: Note: ZNZFarms_F1.2 = farms using local seeds with inorganic fertilizers in Zanzibar; MTZFarms_F1.2 = farms using local seeds with inorganic fertilizers in Mainland Tanzania; AllTZFarms_F1.2 = farms using local seeds with inorganic fertilizers across all farms in Tanzania; ZNZFarms_F2.2 = farms using improved seeds with inorganic fertilizers in Zanzibar; MTZFarms_F2.2 = farms using improved seeds with inorganic fertilizers in Mainland Tanzania; AllTZFarms_F2.2 = farms using improved seeds with inorganic fertilizers across all farms in Tanzania.
In contrast, farmers using improved seeds with inorganic fertilizers achieve substantially better NFI. In Zanzibar, the proportion of low-income farms drops slightly to 76%, while 19% earn a moderate NFI, and 6% surpass the TZS 4.0 million/ha threshold, representing a marginal improvement on the Island. Mainland Tanzania performs significantly better, with a 47% probability of NFI falling below the minimum threshold, 38% of farms falling between the two thresholds, and a 15% probability of exceeding TZS 4.0 million/ha, marking the highest success rate observed within mainland Tanzania and Zanzibar. Across all farms in Tanzania, the probability of low NFI is 58%, with 30% falling between the two thresholds, and 12% of farms exceeding TZS 4.0 million/ha.
The integration of inorganic fertilizers with seed types (local or improved) has demonstrated a marked improvement in rice farm NFI in Tanzania, compared to non-fertilizer and organic fertilizer systems (Figures 3-5). However, persistent challenges and regional disparities underscore the complexity of achieving widespread NFI. The use of inorganic fertilizers significantly increases the likelihood of exceeding the upper-income threshold (TZS 4.0 million/ha), particularly when combined with improved seeds. For instance, Mainland Tanzania achieves a 15% probability of surpassing this threshold with improved seeds and inorganic fertilizers, the highest observed in the study. This aligns with Morris et al. (2007), who highlight that inorganic fertilizers provide immediate, concentrated nutrients critical for yield optimization in nutrient-depleted soils of Sub-Saharan Africa (SSA). However, the marginal gains in Zanzibar (6% exceeding the threshold) suggest that inorganic fertilizers alone cannot overcome site-specific constraints, such as saline soils or limited plot sizes, as noted in the reports by Mwesige et al. (2024) and Omar et al. (2024) on Zanzibar’s agroecology.
The combination of improved seeds and inorganic fertilizers reduces the probability of low-income farmers in Mainland Tanzania to 47%, compared to 76% for local seeds. This synergy reflects the “input complementarity” principle described by Sheahan et al. (2014), where an adequate nutrient supply unlocks the genetic potential of improved seeds. Nevertheless, the persistence of a 58% low-income probability nationally indicates that even this combination faces limitations, likely due to high input costs and inconsistent access to quality fertilizers, a barrier emphasized by Duflo et al. (2011) in their analysis of smallholder fertilizer adoption challenges. Zanzibar’s underperformance (76% low-income probability with improved seeds + inorganic fertilizers vs. 47% in the Mainland) underscores entrenched disparities. Barrett et al. (2017) attribute such gaps to Mainland Tanzania’s better infrastructure, larger farms, and stronger extension services. In Zanzibar, saline soils and fragmented landholdings limit the efficacy of inorganic fertilizers, necessitating tailored solutions such as saline-tolerant varieties or blended fertilizers, as proposed in the 2019 World Bank report by Russ et al. (2020), for coastal regions.
Despite improvements, 58% of farmers nationally remain below TZS 2.0 million/ha, even with the use of inorganic fertilizers. Badiane et al. (2021) argue that systemic issues, such as input market inefficiencies, climate shocks, and post-harvest losses, undermine the benefits of inputs. For example, fertilizer price volatility in Tanzania often deters consistent use, a problem exacerbated by weak rural financial systems. While inorganic fertilizers yield short-term gains, their long-term sustainability is questionable due to risks of soil acidification and environmental degradation (Vitousek et al., 2009). Policies should promote integrated soil fertility management (ISFM), blending inorganic and organic inputs, as seen in Malawi’s subsidy programs (Dorward and Chirwa, 2012). Targeted subsidies for Zanzibar and saline soil remediation could reduce regional inequities. Inorganic fertilizers significantly enhance rice farm profitability, especially when combined with improved seeds; however, their standalone use is insufficient to resolve systemic and regional challenges. A holistic approach, combining input subsidies, climate-smart practices, and context-specific interventions, is vital for Tanzania’s sustainable and equitable agricultural transformation.
3.5 NFI of rice farms using local seeds with or without fertilizers (organic or inorganic) in high-producing agroecological zones in mainland Tanzania
Figure 7 presents the probabilities of NFI distribution among rice farmers in the high-producing agroecological zones of Tanzania, namely the EZ and Southern Highlands Zone (SHZ), using local seeds with either no fertilizers, organic fertilizers, or inorganic fertilizers. The figure highlights significant variations in NFI levels based on the type of fertilizer and agroecological zone. The analysis reveals that farmers who use local seeds without fertilizers experience the highest NFI of earning below TZS 2.0 million/ha, with 84% in EZ and 55% in SHZ falling into the low-income category. This suggests that farming without fertilizers leads to poor NFI. Additionally, very few farms surpass the TZS 4.0 million/ha NFI threshold, with only 1% in EZ and 10% in SHZ, indicating that relying on local seeds without fertilizers is highly unprofitable.
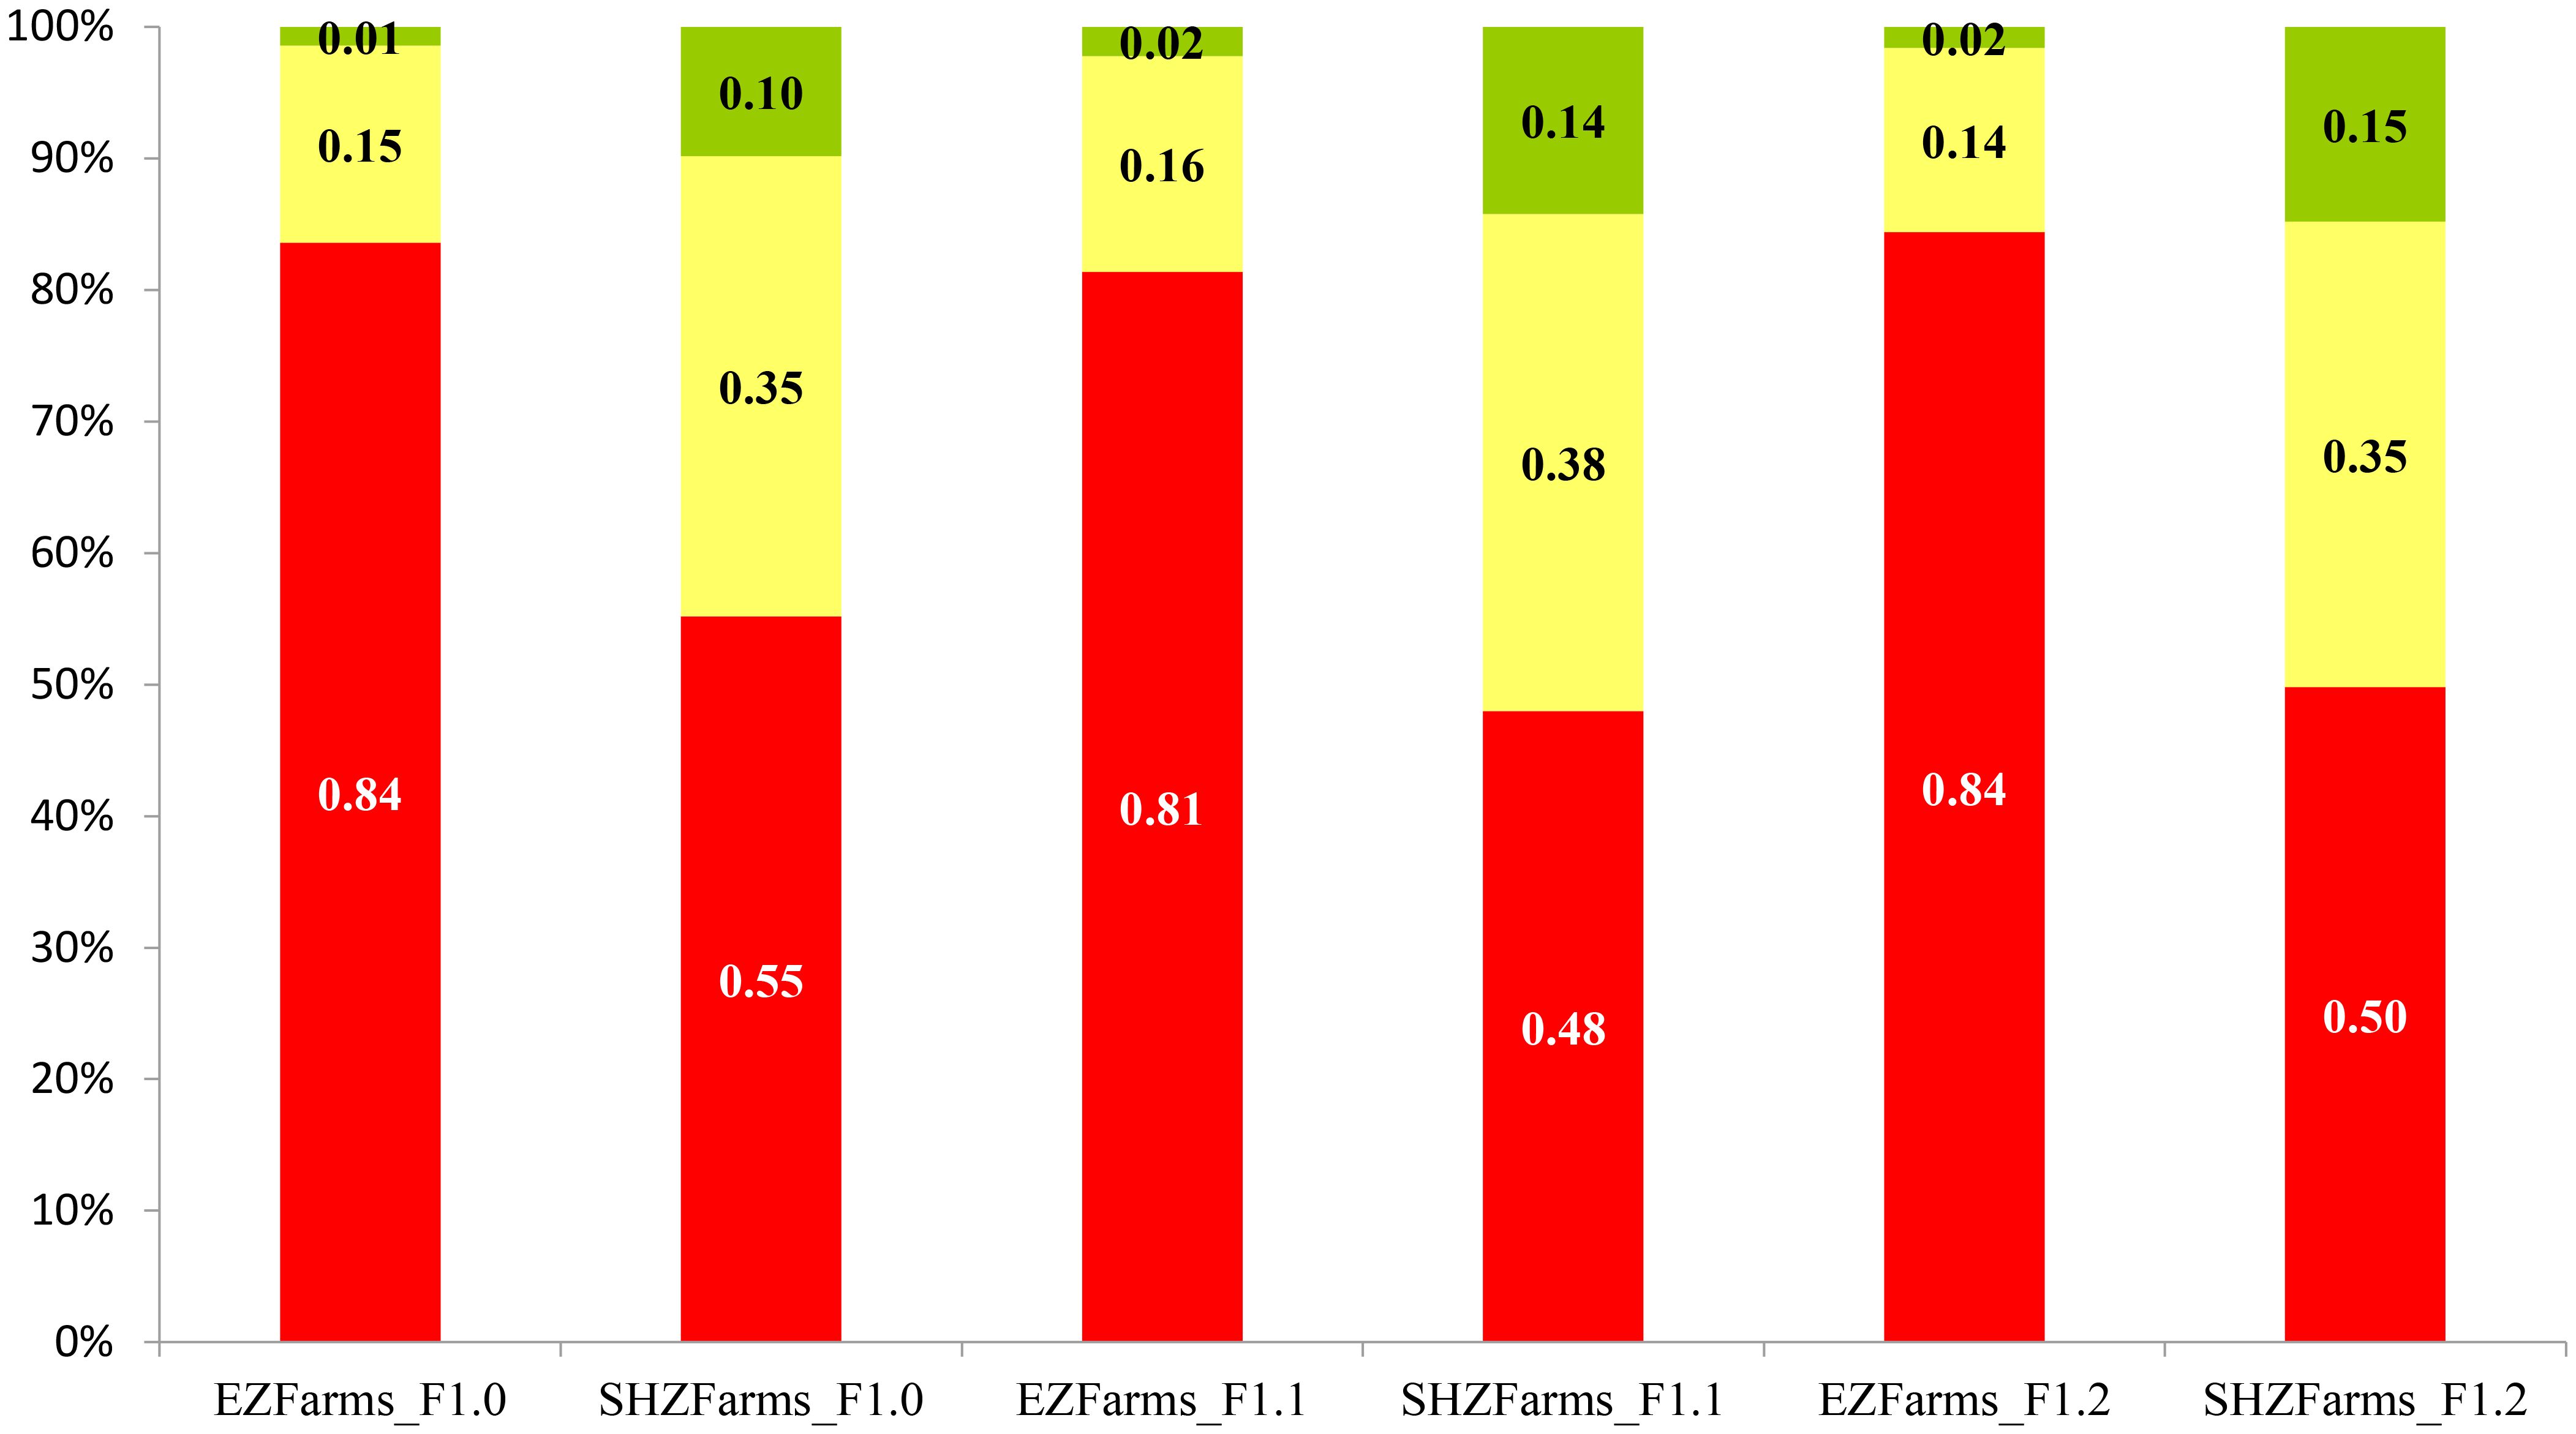
Figure 7. The probabilities of NFI falling above the maximum threshold of TZS 4.0 million/ha (in green) and less than the minimum NFI of TZS 2.0 million/ha (in red), and the probability of falling between the two thresholds for rice farmers using local seeds with different types of fertilizers for farms in major rice producing agroecological zones (EZ & SHZ) in Tanzania. Note: EZFarms_F1.0 = local seeds without fertilizers in the Eastern Zone; SHZFarms_F1.0 = local seeds without fertilizers in the Southern Highlands Zone. EZFarms_F1.1 = local seeds with organic fertilizers in Eastern Zone; SHZFarms_F1.1 = local seeds with organic fertilizers in Southern Highlands Zone; EZFarms_F1.2 = local seeds with inorganic fertilizers in EasternZone; SHZFarms_F1.2 = local seeds with inorganic fertilizers in Southern Highlands Zone.
Introducing organic fertilizers slightly improves NFI, reducing the proportion of low-income farms to 81% in EZ and 48% in SHZ. Although this indicates some improvement, the probability of earning above TZS 4.0 million/ha remains low (2% in EZ and 14% in SHZ). However, there is a notable increase in the proportion of farms earning between TZS 2.0 and 4.0 million/ha, reflecting a moderate positive impact of organic fertilizers on farm income. The highest NFI is observed when local seeds are combined with inorganic fertilizers, particularly in the Southern Highlands Zone. The probability of falling below TZS 2.0 million/ha decreases to 50% in SHZ, while the likelihood of earning above TZS 4.0 million/ha reaches 15%, the highest among all categories. In contrast, EZ farmers still struggle, with 84% earning below the minimum NFI threshold and only 2% surpassing TZS 4.0 million/ha. Notably, farms in SHZ benefit more from inorganic fertilizers than those in EZ, as evidenced by the 35% of SHZ farms falling within the middle-income range (TZS 2.0–4.0 million/ha) compared to just 14% in EZ.
The SHZoutperforms the EZ across all fertilizer regimes. For instance, inorganic fertilizers reduce low-income probabilities to 50% in SHZ but only marginally improve EZ (84% remain below TZS 2.0 million/ha). This disparity aligns with Sanchez et al. (1997), who emphasize that SHZ’s volcanic soils and higher rainfall naturally support better nutrient retention and crop responsiveness to inputs. In contrast, EZ’s sandy, leached coastal soils (FAO and ITPS, 2015) limit the efficacy of fertilizers, explaining the persistent low yields despite interventions. Organic Fertilizer users demonstrated a moderate improvement in soil health (SHZ), with 48% of low-income individuals showing improvement compared to 55% without fertilizers, reflecting gradual benefits to soil health, such as enhanced organic matter and water retention (Vanlauwe et al., 2010). However, slow nutrient release fails to meet immediate crop demands, particularly in EZ’s degraded soils. On the other hand, the inorganic fertilizer user in SHZ experienced a 15% probability of exceeding TZS 4.0 million/ha, underscoring the immediate nutrient availability of inorganic fertilizers, which aligns with improved crop requirements (Morris et al., 2007). However, their limited impact in EZ suggests that soil constraints (e.g., acidity, salinity) require complementary amendments, such as lime or micronutrients (Place et al., 2003).
Even with inorganic fertilizers, 50% of SHZ farmers remain below the NFI threshold. Duflo et al. (2008) attribute such gaps to high input costs, inconsistent access, and weak extension services. In EZ, smaller landholdings and limited market access exacerbate challenges, as farmers cannot offset fertilizer costs through economies of scale, a barrier highlighted by Jayne et al. (2016) in their analysis of smallholder farmers in Tanzania. Agroecologically, SHZ’s responsiveness to inorganic fertilizers warrants subsidies and training on the use of balanced nutrients. EZ requires soil remediation (e.g., gypsum for salinity) paired with drought-tolerant varieties (Russ et al., 2020). The Organic-Inorganic Blending strategy, also known as Integrated Soil Fertility Management (ISFM), as advocated by Vanlauwe et al. (2010), can bridge yield gaps in both zones by combining the long-term benefits of organic matter with the immediacy of inorganic fertilizers. While inorganic fertilizers drive the highest NFI gains in SHZ, their standalone use is insufficient to overcome systemic and agroecological barriers. A dual approach, tailoring inputs to soil conditions and addressing socioeconomic constraints, is essential for equitable agricultural growth in Tanzania’s high-producing zones.
3.6 NFI of rice farms using improved seeds with and without fertilizers (organic and inorganic) in high-producing agroecological zones in mainland Tanzania
Figure 8 illustrates the probability of rice farms’ NFI using improved seeds coupled with or without fertilizers (organic or inorganic) in high-producing agroecological zones (Eastern and Coastal Zone (EZ) and the Southern Highlands Zone (SHZ)). For farms not using any fertilizers (F2.0), both EZ and SHZ show a high probability (76% and 52%) of NFI falling below the minimum threshold, indicating poor NFI, particularly in the EZ zone. The chance of falling above TZS 2.0 million/ha was relatively higher in SHZ (48%) than EZ (24%), with the likelihood of exceeding the maximum NFI threshold being minimal, especially in the EZ (4%) than the SHZ (7%), suggesting that lack of fertilizer use significantly limits NFI potential to these important zones in rice NFI.
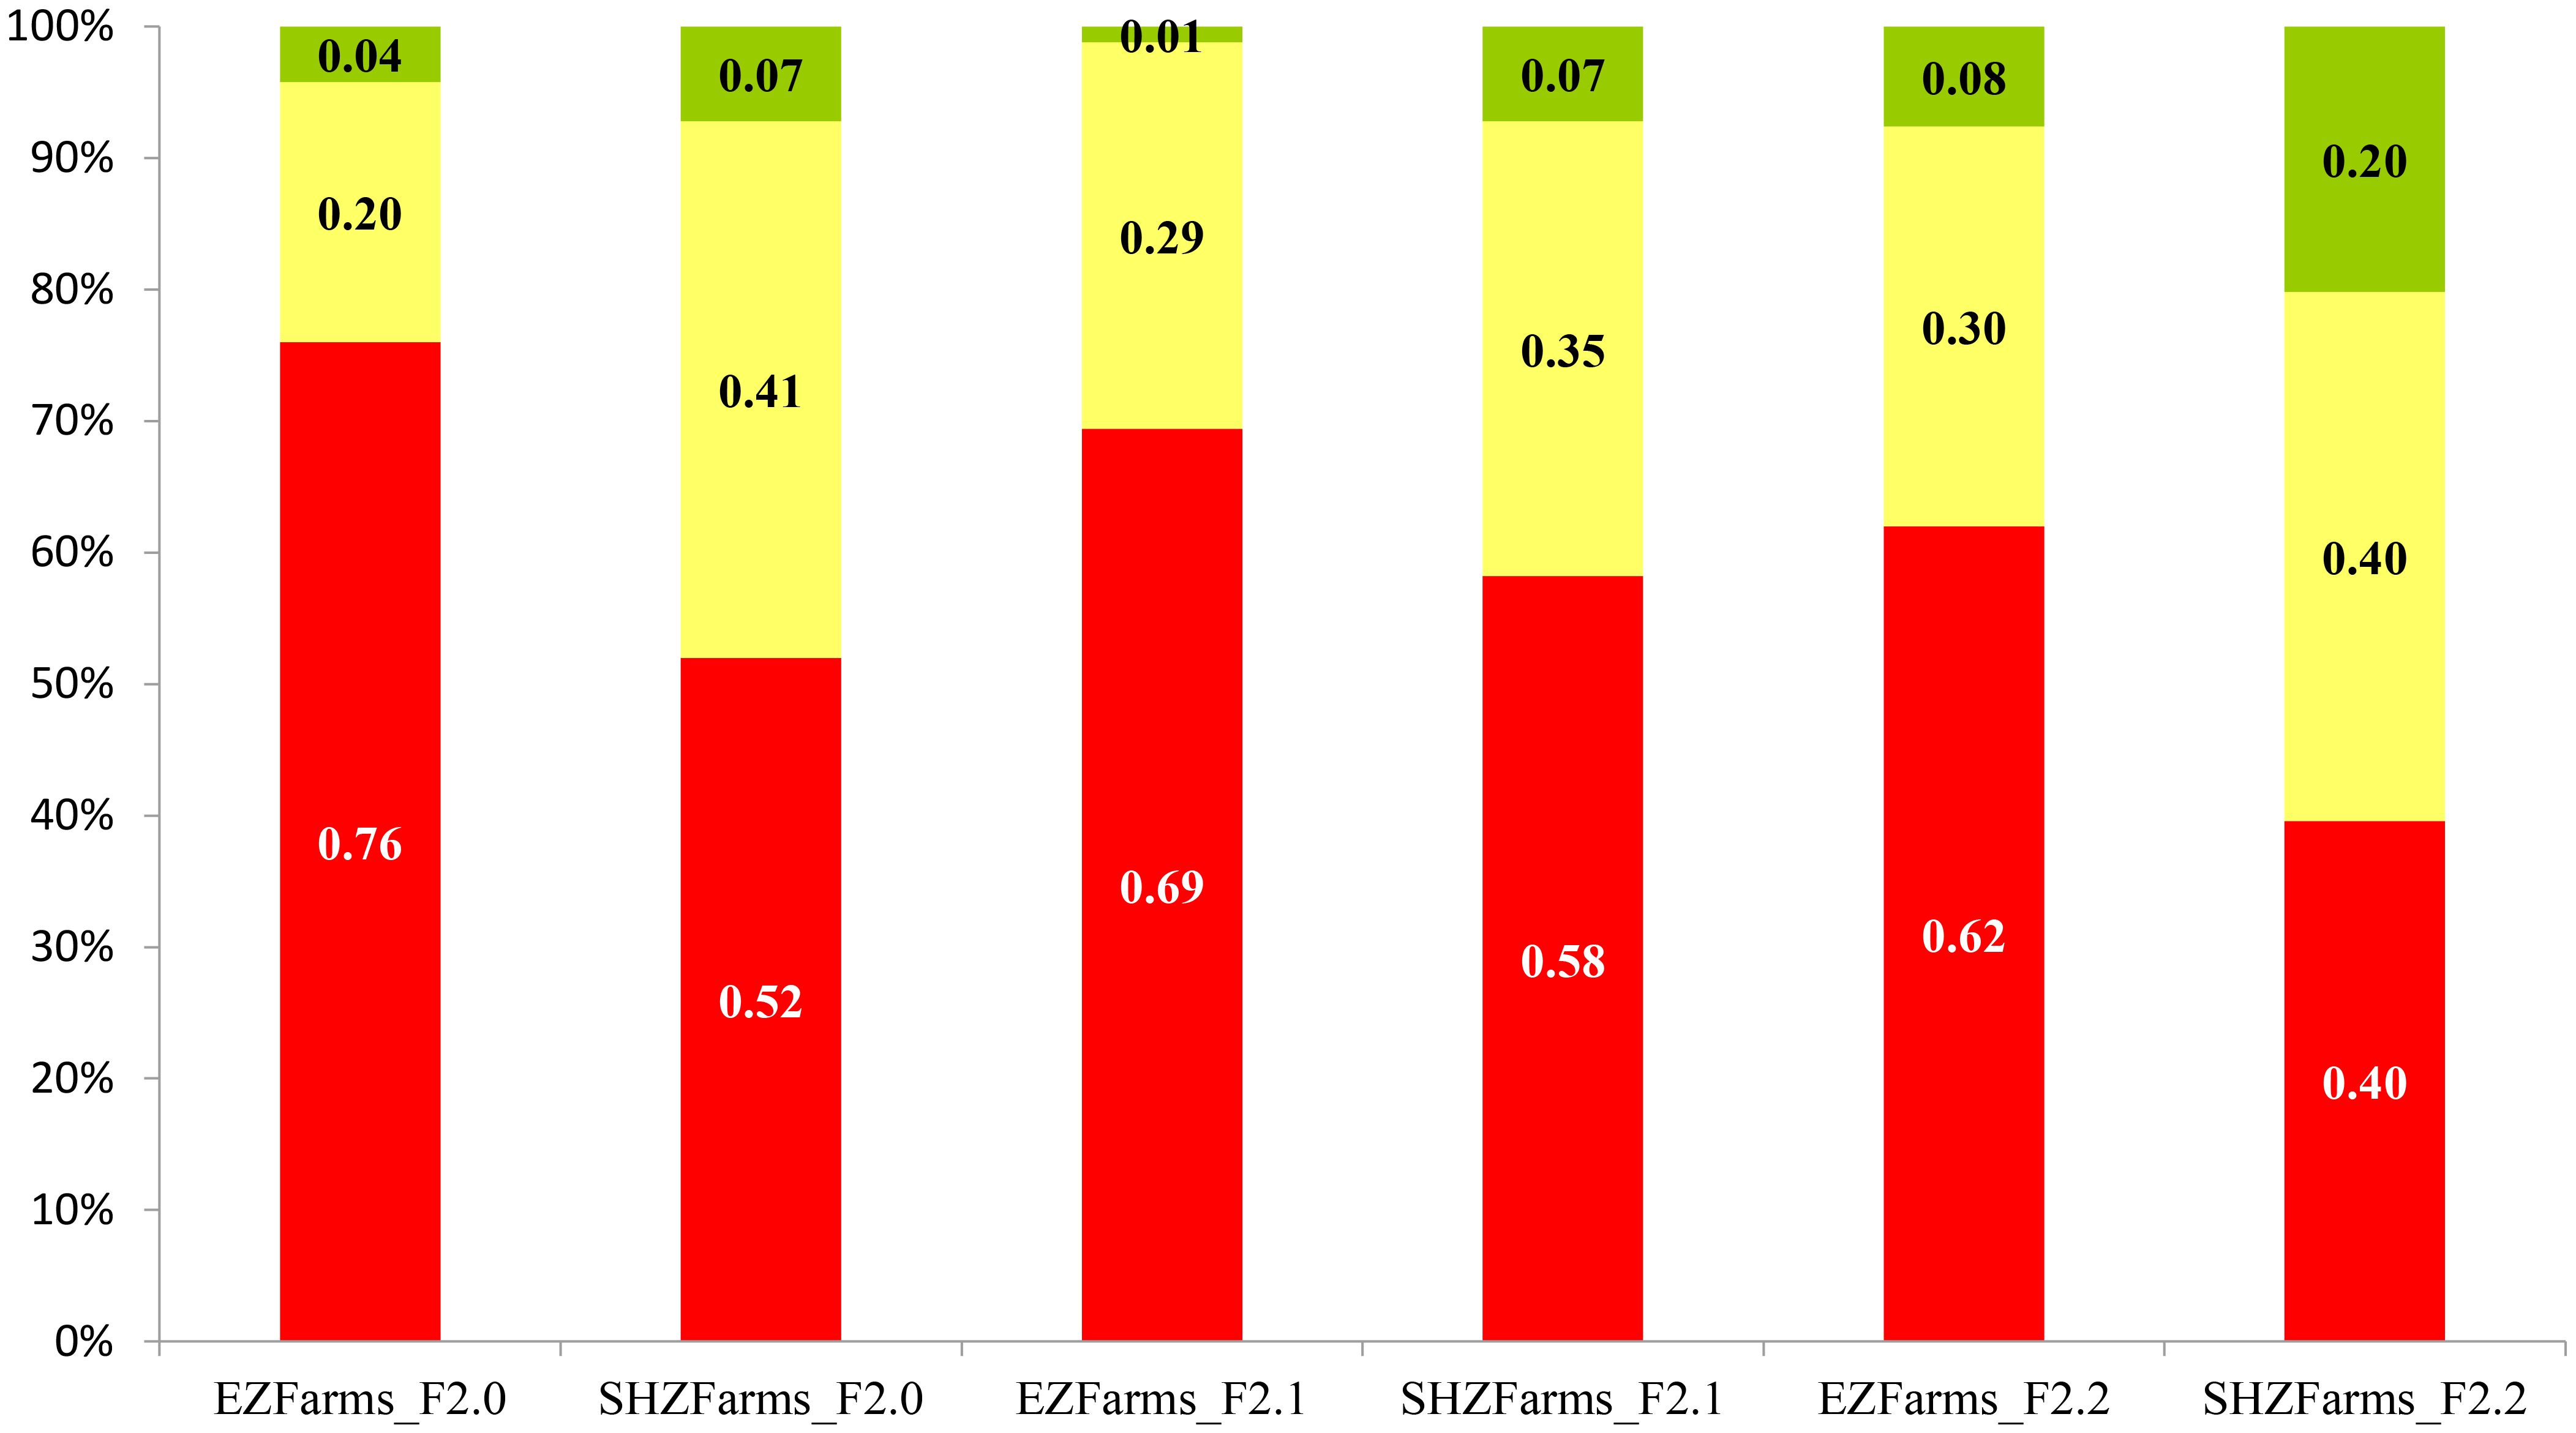
Figure 8. The probabilities of NFI falling above the maximum threshold of TZS 4.0 million/ha (in green) and less than the minimum NFI of TZS 2.0 million/ha (in red), and the probability of falling between the two thresholds for rice farmers using improved seeds with different types of fertilizers for farms in major rice producing agroecological zones (EZ & SHZ) in Tanzania. Note: EZFarms_F2.0 = improved seeds without fertilizers in the Eastern Zone; SHZFarms_F2.0 = improved seeds without fertilizers in the Southern Highlands Zone. EZFarms_F2.1 = improved seeds with organic fertilizers in Eastern Zone; SHZFarms_F2.1 = improved seeds with organic fertilizers in Southern Highlands Zone; EZFarms_F2.2 = improved seeds with inorganic fertilizers in Eastern Zone; SHZFarms_F2.2 = improved seeds with inorganic fertilizers in Southern Highlands Zone.
When organic fertilizers are used (F2.1), there is a noticeable decrease in the probability of NFIs falling below the minimum threshold, especially in the Eastern and Coastal regions (from 76% to 69%). Likewise, the likelihood of NFI exceeding 2.0 million/ha increased slowly in the EZ (30%), with a slight decrease in the SHZ (42%). Additionally, the probability of exceeding the maximum NFI threshold remained the same in the SHZ, with a noticeable decrease in the EZ, indicating potential high-cost implications associated with organic manure in the SHZ. The use of inorganic fertilizers (F2.2) shows an improvement trend, with a reduction in the likelihood of NFIs falling below the minimum threshold. The response to inorganic fertilizers, particularly in the Southern Highlands Zone, is far better, with a lower probability (40%) of NFIs below the minimum threshold and, to a certain degree, a higher likelihood (20%) of exceeding the maximum threshold compared to the Eastern, which is only 8%.
The Southern Highlands consistently outperforms the Eastern Zone, even with improved seeds. For example, inorganic fertilizers reduce low-income probabilities to 40% in SHZ but only marginally improve EZ (72% remain below TZS 2.0 million/ha). This disparity aligns with Sanchez et al. (1997), who notes that SHZ’s volcanic soils have higher nutrient retention and organic matter, enhancing responsiveness to inputs. In contrast, EZ’s sandy, saline soils (FAO & ITPS, 2015) limit fertilizer efficacy, perpetuating low yields despite improved seeds. Organic fertilizer users + improved seeds experience a modest reduction in EZ’s low-income probability (76% to 69%), which reflects organic fertilizers’ gradual soil health benefits, such as improved water retention and microbial activity (Vanlauwe et al., 2010). However, their limited impact in SHZ (low-income probability remains high at 52%) suggests that organic inputs alone cannot meet the nutrient demands of high-yielding improved seeds in fertile zones. Inorganic fertilizer users in SHZ experienced a 20% probability of exceeding TZS 4.0 million/ha, highlighting the synergy between improved seeds and inorganic fertilizers, which provide immediate, concentrated nutrients (Sheahan et al., 2014). EZ’s stagnation (an 8% upper threshold probability) underscores the need for soil-specific amendments (e.g., lime for acidity) to unlock the inorganic fertilizer potential (Place et al., 2003).
Despite SHZ’s gains, 40% of farmers using inorganic fertilizers remain below the NFI threshold. Duflo et al. (2008) attribute this to high input costs and inconsistent access to quality fertilizers, which deters smallholders from maximizing returns. In EZ, smaller landholdings and limited market integration exacerbate these challenges as farmers struggle to offset input costs, a barrier emphasized by Jayne et al. (2016) in their analysis of Tanzanian agriculture. SHZ’s strong response to inorganic fertilizers justifies targeted subsidies, while EZ requires blended interventions (e.g., saline-tolerant seeds + gypsum) to address soil constraints (Russ et al., 2020). Likewise, institutional support and the ISFM approach, which combines organic and inorganic fertilizers as advocated by Vanlauwe et al. (2010), could enhance long-term soil health and yield stability in both zones. Furthermore, strengthening extension services through training farmers in EZ on cost-effective organic composting and SHZ on balanced fertilizer use could optimize input efficiency and unlock the full potential of improved seeds plus fertilizer in Tanzania (Kahimba et al., 2016; Omar et al., 2024).
4 Conclusions
This study demonstrates that while improved seeds and inorganic fertilizers significantly enhance rice farm profitability in Tanzania, their impact is strongly conditioned by agroecological and institutional contexts. The Southern Highlands Zone (SHZ), with its fertile soils and favorable rainfall, showed the highest probability of farms surpassing the TZS 4.0 million/ha income threshold, underscoring the role of environmental suitability in amplifying input effectiveness. In contrast, regions such as the Eastern and Coastal Zone (ECZ) and Zanzibar, constrained by saline soils, land fragmentation, and limited institutional support, experienced significantly lower returns despite adopting similar technologies. This spatial disparity signals that a one-size-fits-all approach to agricultural intensification is insufficient. The findings advocate for tailored policy responses. High-potential areas like SHZ would benefit from scaling up subsidized input programs, especially for improved seeds and inorganic fertilizers, facilitated through efficient delivery systems such as digital vouchers. In lower-performing zones, strategies should emphasize integrated soil fertility management, including site-specific soil testing, organic amendments, and the adoption of salt-tolerant seed varieties. Strengthening rural infrastructure, extension services, and climate-smart innovations (e.g., irrigation, drought-tolerant varieties) is also essential for bridging productivity gaps. Furthermore, future work should disaggregate performance by gender and farm size to inform inclusive policy formulation, utilizing rich data sources such as the Tanzania National Panel Survey. Ultimately, bridging profitability gaps across diverse agroecological zones will require both targeted technological interventions and broader systemic reforms to ensure sustainable transformation of rice-based farming systems and progress toward SDG 2 (Zero Hunger).
Data availability statement
The original contributions presented in the study are included in the article/Supplementary Material. Further inquiries can be directed to the corresponding author.
Author contributions
IK: Writing – original draft, Data curation, Software, Formal Analysis, Visualization, Methodology, Validation, Investigation, Writing – review & editing, Conceptualization. SS: Investigation, Funding acquisition, Supervision, Resources, Writing – review & editing.
Funding
The author(s) declare that no financial support was received for the research, and/or publication of this article.
Acknowledgments
We wish to acknowledge the invaluable contributions of the Simetar® team (www.simetar.com), particularly Dr. James W. Richardson, former Regents Professor at Texas A&M University, for his expert guidance and continued mentorship in the application of Monte Carlo Simulation protocols.
Conflict of interest
The authors declare that the research was conducted in the absence of any commercial or financial relationships that could be construed as a potential conflict of interest.
Generative AI statement
The author(s) declare that no Generative AI was used in the creation of this manuscript.
Any alternative text (alt text) provided alongside figures in this article has been generated by Frontiers with the support of artificial intelligence and reasonable efforts have been made to ensure accuracy, including review by the authors wherever possible. If you identify any issues, please contact us.
Publisher’s note
All claims expressed in this article are solely those of the authors and do not necessarily represent those of their affiliated organizations, or those of the publisher, the editors and the reviewers. Any product that may be evaluated in this article, or claim that may be made by its manufacturer, is not guaranteed or endorsed by the publisher.
Supplementary material
The Supplementary Material for this article can be found online at: https://www.frontiersin.org/articles/10.3389/fagro.2025.1617173/full#supplementary-material
Supplementary Table 1 | Summary statistics of the yield distribution of rice farms using local seeds with and without fertilizers.
Supplementary Table 2 | Summary statistics of the yield distribution of rice farms using improved seeds with and without fertilizers.
Supplementary Table 3 | Summary statistics of production costs under different rice farming practices for farms using local vs improved seeds with and without fertilizers (organic/inorganic) across all farms in Tanzania.
Supplementary Table 4 | Summary statistics of production costs under different rice farming practices for farms using local vs improved seeds with and without fertilizers (organic/inorganic) across all farms in mainland Tanzania.
Supplementary Table 5 | Summary statistics of production costs under different rice farming practices for farms using local vs improved seeds with and without fertilizers (organic/inorganic) across all farms in Zanzibar, Tanzania.
Supplementary Table 6 | Summary statistics for farm gate prices of local and improved rice varieties in Tanzania.
References
Altieri M. A. and Nicholls C. I. (2017). The adaptation and mitigation potential of traditional agriculture in a changing climate. Climatic Change 140, 33–45. doi: 10.1007/s10584-013-0909-y
Andreoni A., Mushi D., and Therkildsen O. (2021). Tanzania’s ‘rice bowl’: Production success, scarcity persistence and rent seeking in the East African Community. Anti-Corruption Evidence Working Paper 34.
Badiane O., Diao X., and Jayne T. (2021). Africa’s unfolding agricultural transformation. Agric. Dev. New Perspect. Change World 2021, 153–192.
Barrett C. B., Christian P., and Shiferaw B. A. (2017). The structural transformation of African agriculture and rural spaces: Introduction to a special section. Agric. Economics 48, 5–10. doi: 10.1111/agec.12382
Cai W., Li K., Liao H., Wang H., and Wu L. (2017). Weather conditions conducive to Beijing severe haze more frequent under climate change. Nat. Climate Change 7, 257–262. doi: 10.1038/nclimate3249
Chalchisa S. S. T. and Sani S. (2016). Farmers’ perception, impact and adaptation strategies to climate change among smallholder farmers in sub-Saharan Africa: A systematic review. J. Resour. Dev. Manage. 26, 32–39.
Dorward A. and Chirwa E. (2012). The Malawi agricultural input subsidy programme: 2005/06 to 2008/09. Sustain. Intensification 9, 232–247. doi: 10.3763/ijas.2010.0567
Duflo E., Kremer M., and Robinson J. (2008). How high are rates of return to fertilizer? Evidence from field experiments in Kenya. Am. economic Rev. 98, 482–488. doi: 10.1257/aer.98.2.482
Duflo E., Kremer M., and Robinson J. (2011). Nudging farmers to use Fertilizer: Evidence from Kenya, forthcoming in. Am. Economic Review 101, 2350–2390. doi: 10.1257/aer.101.6.2350
FAO & ITPS (2015). Status of the world’s soil resources (SWSR) – main report (Rome, Italy: Food and Agriculture Organization of the United Nations and Intergovernmental Technical Panel on Soils). Available online at: https://openknowledge.fao.org/server/api/core/bitstreams/6ec24d75-19bd-4f1f-b1c5-5becf50d0871/content (Accessed March 15, 2025).
Feder G. and Savastano S. (2017). “Modern agricultural technology adoption in sub-Saharan Africa: A four-country analysis,” in Agriculture and rural development in a globalizing world (Routledge), 11–25.
Gashu D., Demment M. W., and Stoecker B. J. (2019). Challenges and opportunities to the African agriculture and food systems. Afr. J. Food Agriculture Nutr. Dev. 19, 14190–14217. doi: 10.18697/ajfand.84.BLFB2000
Jayne T. S., Chamberlin J., Traub L., Sitko N., Muyanga M., Yeboah F. K., et al. (2016). Africa’s changing farm size distribution patterns: the rise of medium-scale farms. Agric. Economics 47, 197–214. doi: 10.1111/agec.12308
Jayne T. S., Wineman A., Chamberlin J., Muyanga M., and Yeboah F. K. (2022). Changing farm size distributions and agricultural transformation in sub-Saharan Africa. Annu. Rev. Resource Economics 14, 109–130. doi: 10.1146/annurev-resource-111220-025657
Kadigi I. L., Kadigi M. L., Nyange D., and Sieber S. (2025b). Impacts of inorganic and organic fertilizers coupled with improved seeds on maize yield in Tanzania’s agroecological zones. Eur. J. Agron. 170, 127772. doi: 10.1016/j.eja.2025.127772
Kadigi I. L., Mkuna E., and Sieber S. (2025a). Exploring the impact of improved maize seeds on productivity of Tanzanian family farms: A maize seed stochastic simulation (MaizeSim) approach. Agronomy 15, 1167. doi: 10.3390/agronomy15051167
Kadigi I. L., Richardson J. W., Mutabazi K. D., Philip D., Bizimana J. C., Mourice S. K., et al. (2020). Forecasting yields, prices and net returns for main cereal crops in Tanzania as probability distributions: A multivariate empirical (MVE) approach. Agric. Syst. 180, 102693. doi: 10.1016/j.agsy.2019.102693
Kahimba F. C., Ali R. M., and Mahoo H. F. (2016). Research note: evaluation of irrigation water quality for paddy production at Bumbwisudi Rice Irrigation Scheme, Zanzibar. Tanzania J. Agric. Sci. 15, 114–119.
Kangalawe R. Y. M. and Lyimo J. G. (2013). Climate change, adaptive strategies and rural livelihoods in semiarid Tanzania. Natural Resour. 4, 266–278. doi: 10.4236/nr.2013.43034
Kanyama-Phiri G., Snapp S., and Wellard K. K. (2000). Towards integrated soil fertility management in Malawi: incorporating participatory approaches in agricultural research. Available online at: https://www.iied.org/sites/default/files/pdfs/migrate/7422IIED.pdf?.
Lewis P., Monem M. A., and Impiglia A. (2018). Impacts of climate change on farming systems and livelihoods in the Near East North Africa. With a special focus on small-scale family farming. Cairo: FAO. p. 92. Available at: https://openknowledge.fao.org/handle/20.500.14283/ca1439en.
Makate C., Angelsen A., Holden S. T., and Westengen O. T. (2023). Evolution of farm-level crop diversification and response to rainfall shocks in smallholder farming: Evidence from Malawi and Tanzania. Ecol. Economics 205, 107736. doi: 10.1016/j.ecolecon.2022.107736
Masso C., Nziguheba G., Mutegi J., Galy-Lacaux C., Wendt J., Butterbach-Bahl K., et al. (2017). Soil fertility management in sub-Saharan Africa. In: Lichtfouse E. (eds) Sustainable Agriculture Reviews, vol 25. Cham: Springer. p. 205–231. doi: 10.1007/978-3-319-58679-3_7
Mertz O., Halsnæs K., Olesen J. E., and Rasmussen K. (2009). Adaptation to climate change in developing countries. Environ. Manage. 43, 743–752. doi: 10.1007/s00267-008-9259-3
Moh’d I. S., Omar Mohammed M., and Saiti B. (2017). The problems facing agricultural sector in Zanzibar and the prospects of Waqf-Muzar’ah-supply chain model: The case of clove industry. Humanomics 33, 189–210. doi: 10.1108/H-02-2017-0033
Morris M., Kelly V. A., Kopicki R. J., and Byerlee D. (2007). Fertilizer Use in African Agriculture (Washington, DC: The World Bank).
Mwesige F. F., Mulashani G. R., Mjanja B. E., and Amuri N. A. (2024). Salt affected soils in sub-Saharan Africa: an analysis of distribution from 1970 to the present. J. Curr. Opin. Crop Sci. 5, 264–277. doi: 10.62773/jcocs.v5i4.291
Ogeto R. M. and Jiong G. (2019). Fertilizer underuse in sub-Saharan Africa: evidence from maize. J. Agric. Econ. Dev. 7, 11–28.
Omar M. D. M., Massawe B. H., Shitindi M. J., Pedersen O., Meliyo J. L., and Fue K. G. (2024). Assessment of salt-affected soil in selected rice irrigation schemes in Tanzania: understanding salt types for optimizing management approaches. Front. Soil Sci. 4, 1372838. doi: 10.3389/fsoil.2024.1372838
Onyutha C., Ayugi B., Tabari H., Ngoma H., and Ongoma V. (2022). “Drought across East Africa under climate variability,” in Climate Impacts on Extreme Weather (Elsevier), 159–173.
Place F., Barrett C. B., Freeman H. A., Ramisch J. J., and Vanlauwe B. (2003). Prospects for integrated soil fertility management using organic and inorganic inputs: evidence from smallholder African agricultural systems. Food Policy 28, 365–378. doi: 10.1016/j.foodpol.2003.08.009
Richardson J. W., Herbst B. K., Outlaw J. L., and Gill R. C. (2007). Including risk in economic feasibility analyses: the case of ethanol production in Texas. J. Agribus. 25, 115–132.
Richardson J. W., Feldman P., and Schuemann K. (2003). Simetar™. Department of Agricultural Economics, Texas A&M University. College Station, TX.
Richardson J. W., Klose S. L., and Gray A. W. (2000). An applied procedure for estimating and simulating multivariate empirical (MVE) probability distributions in farm-level risk assessment and policy analysis. J. Agric. Appl. Economics 32, 299–315. doi: 10.1017/S107407080002037X
Richardson J. W., Schumann K. D., and Feldman P. A. (2008). Simetar: simulation & econometrics to analyze risk (Texas: College Station, Texas A&M University).
Rowhani P., Lobell D. B., Linderman M., and Ramankutty N. (2011). Climate variability and crop production in Tanzania. Agric. For. meteorol. 151, 449–460. doi: 10.1016/j.agrformet.2010.12.002
Russ J. D., Zaveri E. D., Damania R., Desbureaux S. G., Escurra J. J., and Rodella A. S. (2020). Salt of the earth: quantifying the impact of water salinity on global agricultural productivity (World Bank Policy Research Working Paper, (9144)).
Sanchez P. A., Shepherd K. D., Soule M. J., Place F. M., Buresh R. J., Izac A. M. N., et al. (1997). “Soil fertility replenishment in Africa: an investment in natural resource capital,” in Replenishing soil fertility in Africa, vol. 51. p. 1–46.
Savary S., Willocquet L., Pethybridge S. J., Esker P., McRoberts N., and Nelson A. (2019). The global burden of pathogens and pests on major food crops. Nat. Ecol. Evol. 3, 430–439. doi: 10.1038/s41559-018-0793-y
Schumann K. D., Feldman P. A., and Richardson J. W. (2011). SIMETAR©: Simulation & econometrics to analyze risk (Agricultural and Food Policy Center, College Station, Texas A and M University, TX).
Shackleton S., Ziervogel G., Sallu S., Gill T., and Tschakert P. (2015). Why is socially-just climate change adaptation in sub-Saharan Africa so challenging? A review of barriers identified from empirical cases. Wiley Interdiscip. Reviews: Climate Change 6, 321–344. doi: 10.1002/wcc.335
Sheahan M., Barrett C. B., and Sheahan M. B. (2014). Understanding the agricultural input landscape in sub-Saharan Africa: Recent plot, household, and community-level evidence Vol. 7014) (World Bank Policy Research Working Paper). Available online at: https://ssrn.com/abstract=2487612.
Smil V. (2004). Enriching the earth: Fritz Haber, Carl Bosch, and the transformation of world food production (MIT press).
Snapp S. S. (1998). Soil nutrient status of smallholder farms in Malawi. Commun. Soil Sci. Plant Anal. 29, 2571–2588. doi: 10.1080/00103629809370135
Thornton P., Herrero M., Nelson G., and Mayberry D. (2024). Resilient livelihoods in Africa’s pastoral–agropastoral transition zones will increasingly depend on heat stress adaptation and systemic change. Nat. Food 5, 976–981. doi: 10.1038/s43016-024-01079-7
United Republic of Tanzania – URT (2021). National sample census of agriculture. National report. Available online at: https://www.nbs.go.tz/uploads/statistics/documents/sw-1705482872-2019-20_Agri_Census_%20Main_Report.pdf (Accessed March 15, 2025).
Vanlauwe B., Bationo A., Chianu J., Giller K. E., Merckx R., Mokwunye U., et al. (2010). Integrated soil fertility management: operational definition and consequences for implementation and dissemination. Outlook Agric. 39, 17–24. doi: 10.5367/000000010791169998
Vanlauwe B., Descheemaeker K., Giller K. E., Huising J., Merckx R., Nziguheba G., et al. (2015). Integrated soil fertility management in sub-Saharan Africa: unravelling local adaptation. Soil 1, 491–508. doi: 10.5194/soil-1-491-2015
Vanlauwe B. and Giller K. E. (2006). Popular myths around soil fertility management in sub-Saharan Africa. Agriculture Ecosyst. Environ. 116, 34–46. doi: 10.1016/j.agee.2006.03.016
Vanlauwe B., Kihara J., Chivenge P., Pypers P., Coe R., and Six J. (2011). Agronomic use efficiency of N fertilizer in maize-based systems in sub-Saharan Africa within the context of integrated soil fertility management. Plant Soil 339, 35–50. doi: 10.1007/s11104-010-0462-7
Keywords: local seeds, rice, improved seeds, fertilizers, net farm income, Tanzania, Simulation Model
Citation: Kadigi IL and Sieber S (2025) Impacts of fertilizers coupled with improved seeds on rice profitability in Tanzania: evidence from the national sample census of agriculture 2019/20. Front. Agron. 7:1617173. doi: 10.3389/fagro.2025.1617173
Received: 24 April 2025; Accepted: 28 July 2025;
Published: 04 September 2025.
Edited by:
Min Huang, Hunan Agricultural University, ChinaReviewed by:
Waheed Akram, University of the Punjab, PakistanMichael Kadigi, Sokoine University of Agriculture, Tanzania
Copyright © 2025 Kadigi and Sieber. This is an open-access article distributed under the terms of the Creative Commons Attribution License (CC BY). The use, distribution or reproduction in other forums is permitted, provided the original author(s) and the copyright owner(s) are credited and that the original publication in this journal is cited, in accordance with accepted academic practice. No use, distribution or reproduction is permitted which does not comply with these terms.
*Correspondence: Stefan Sieber, c3RlZmFuLnNpZWJlckB6YWxmLmRl