 Isabeli Pereira Bruno
 Vinicius Ide Franzini2
- 1Agrometeorology, Ecophysiology and Food Technology Department, Rural Development Institute of Paraná (IDR-Paraná), Londrina, Brazil
- 2Soils and Plant Nutrition Department, Brazilian Agricultural Research Corporation - Embrapa Uva e Vinho, Bento Gonçalves, Brazil
- 3Soil Fertility Department, Center for Nuclear Energy in Agriculture (CENA), University of São Paulo (USP), Piracicaba, Brazil
Nitrogen (N) is essential for plant growth and, consequently, a key factor in the productivity and sustainability of agriculture. Soybean and maize require large amounts of N during the growing season. Although soybean primarily relies on biological nitrogen fixation, this source alone does not meet the crop’s total N requirements. Maize-soybean rotation is common under no-tillage systems, but the contribution of maize stover and N fertilizer to the subsequent soybean crop had been unclear. This study used a two-season field experiment to quantify N uptake and recovery in maize and the following soybean crop. Maize was fertilized with increasing rates of N-urea, and 15N tracing was used to assess N dynamics in the shoots of both maize and the subsequent soybean. Most of the N in maize shoot was derived from the soil, with up to 37% originating from fertilizer. In both crops, grains were the primary N sink, and high yields were achieved. In soybean, N uptake from maize stover and residual fertilizer was minimal, with a maximum recovery of 9% in the grain. These findings reveal for the first time the limited short-term contribution of N-urea applied to maize and its stover to soybean nutrition, suggesting that soil N plays an important role in supplying N to the soybean system.
1 Introduction
Nitrogen (N) is a crucial component of essential molecules in plants and is among the most consumed nutrients. To illustrate its importance, N can account for as much as 5% of a plant’s dry matter. This nutrient is a constituent of nucleic acids and proteins, coenzymes, phytohormones, and secondary metabolites. While certain plant species establish symbiotic relationships with N-fixing soil bacteria, the vast majority rely on the availability of mineral N in the rhizosphere to support their growth and development. Among the symptoms of N deficiency are leaf narrowing, stunted growth, and chlorosis, which begins in the older leaves as N is remobilized to the younger ones. As a result, N-deficient crops typically exhibit a pale green or yellow coloration. Its deficiency can lead to a rapid decline in plant growth, directly affecting crop yield. Nitrogen nutrition influences the sustainability of agroecosystems, making its management a critical factor for agricultural production (Epstein and Bloom, 2006; Govindasamy et al., 2023; Hawkesford et al., 2023).
Considering the fundamental role of N in plant development, understanding its dynamics in major crops such as soybean and maize, which are among the most widely cultivated plants globally, is essential. Soybean (Glycine max L.) and maize (Zea mays L.) are two major industrial agricultural crops, ranking among the six mainly components of the current global food base (Singh et al., 2022). According to the most recent data from the Food and Agriculture Organization of the United Nations, approximately 371,000,000 tons of soybean and 1,242,000,000 tons of maize were produced in 2023. Brazil stood out as the world’s largest soybean producer and the third-largest maize producer (FAOSTAT, 2025). For the 2024/2025 cropping season, Brazil is expected to produce around 167,000,000 tons of soybean and nearly 123,000,000 tons of maize (CONAB, 2025).
Focusing on soybean, its N demand is notably high due to the protein-rich composition of its grains (Hungria and Mendes, 2015). At maturation, a soybean plant typically contains 5 g kg-1 of N in the roots, 2 g kg-1 of N in the stem, 50 g kg-1 of N in the pods, and 66 g kg-1 of N in the grains (Zambon et al., 2023). The main source of N for soybean is undoubtedly atmospheric N2, and its transfer to the plant is made by nitrogen-fixing bacteria through symbiosis – the biological nitrogen fixation (BNF). Other sources of N include non-biological N2 fixation, N fertilizers (both organic and mineral), and the soil, through N compounds mainly found in organic matter derived from residues of previously grown crops (Ambrosini et al., 2024; Hungria et al., 2001; Epstein and Bloom, 2006).
The contribution of BNF depends on multiple factors and varies widely, ranging from 53 to 80% of the total N consumed by a soybean plant during a growing season (Alves et al., 2005; Ambrosini et al., 2024; Herridge et al., 2008; Hungria and Mendes, 2015). Thus, we can affirm that at least 20% of the N required for soybean to complete its cycle must be obtained from another source. Since N fertilizers are barely used in Brazilian soybean production, and non-biological N2 fixation is scarce and highly variable (Hungria et al., 2001; Hungria and Mendes, 2015), fertilizers applied in previous crops and crop residues can be considered the second N source in soybean production, and their contribution should not be overlooked.
In Brazil, where soybean and maize are extensively cultivated, the no-tillage system is widely adopted, influencing N cycling and crop rotation (Fuentes-Llanillo et al., 2021). However, despite crop rotation with different species being a key principle of this system, for years farmers have been adopting a practice they call no-tillage, but with rotation of only these two species. In this approach, soybean is sown in the summer and, generally, maize in the winter – the second-crop maize (Passos et al., 2018). Considering the high N demand by soybean and the limited diversity of species providing crop residues, understanding how much N soybean absorbs from previously grown maize is a significant step towards the sustainability of the agroecosystem.
Beyond the well-established importance of BNF in soybean nutrition, a notable lack of information remains regarding N derived from other sources, such as fertilization and residues from previous crops. Unlike previous studies focusing on N contributions from legumes to subsequent crops (e.g., Ambrosano et al., 2011; Louarn et al., 2024; Silva et al., 2006, 2009), this work addresses a critical knowledge gap by investigating N sources beyond those supplied by BNF. These information has important implications for optimizing soil management strategies aimed at sustaining N sources that meet the soybean’s requirements other than those supplied by BNF during a growing season.
Given these gaps, we hypothesize that, in soybean, most N not derived from BNF originates from urea applied during the preceding maize cultivation. To test this hypothesis and provide new insights into N dynamics in no-tillage systems, we evaluated the contribution of N from second-crop maize (residues and fertilization) to the N nutrition of soybean cultivated immediately thereafter, under a no-tillage system, using 15N isotopic techniques. We also assessed the partitioning of N from 15N-labeled urea in the shoot biomass fertilized with increasing N rates, alongside the yields of both crops.
2 Materials and methods
2.1 Experimental set up
The field experiment was conducted over two growing seasons between 2019 and 2020 at the Experimental Station of Institute for Rural Development of Paraná (23° 21’ 52.4” S and 51° 09’ 58.7” W, altitude 585 m ASL), in Londrina, Paraná State, Brazil. The climate is humid subtropical (Cfa), with a mean annual temperature of 21°C and an average annual rainfall of 1,600 mm (Nitsche et al., 2019). Due to below-average rainfall during both growing seasons, supplemental irrigation was applied when necessary using a cannon sprinkler. Table 1 displays the monthly average temperature (°C), as well as the accumulated amounts of rainfall and irrigation (mm).
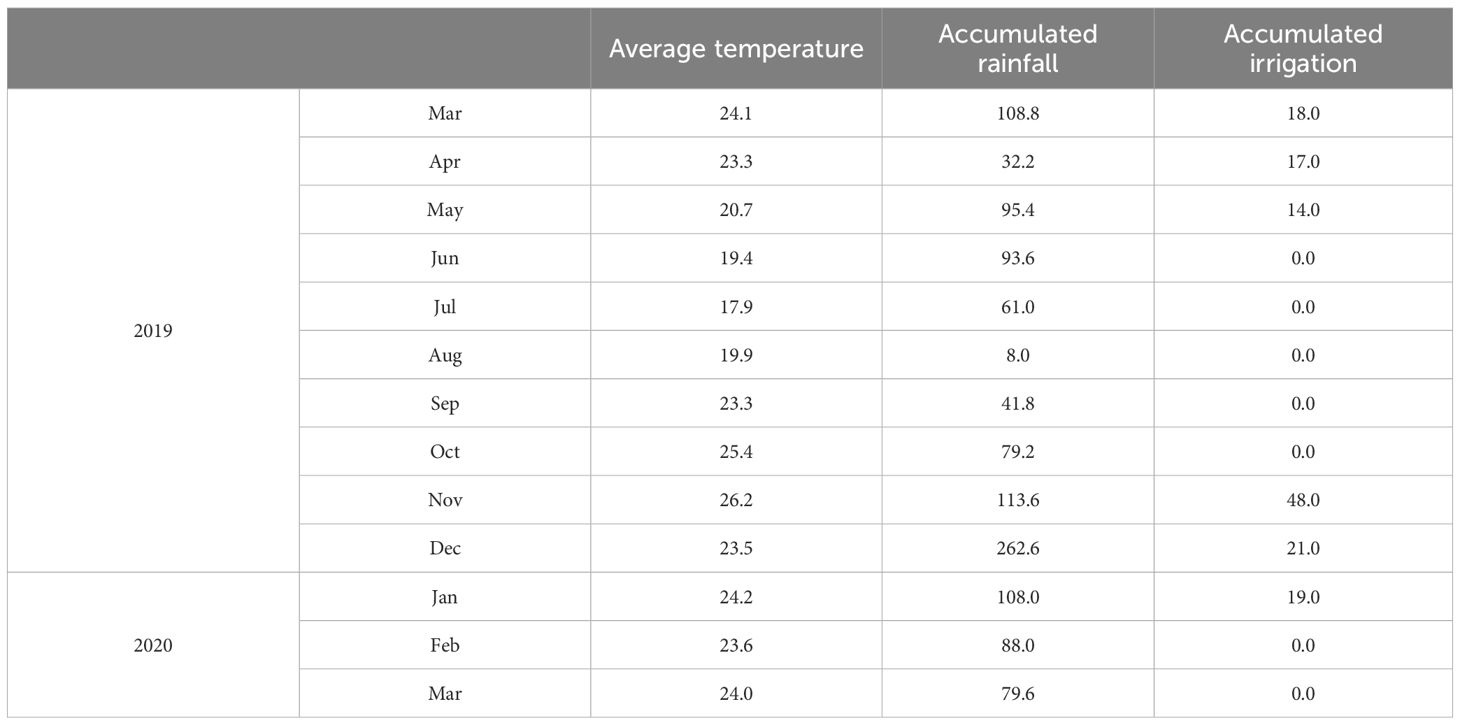
Table 1. Monthly average temperature (°C), accumulated rainfall (mm), and accumulated irrigation (mm) from 2019 to 2020. Londrina, Brazil.
The area had been under no-tillage for 11 years, with black oats in winter and alternating maize and soybeans in summer. In the two years prior to the experiment, a maize (winter) – soybean (summer) rotation was followed.
The soil is clayey (82% clay, 13% silt, and 5% sand), classified as a eutrophic Red Latosol (Santos et al., 2018). The chemical analysis of the soil before the beginning of the experiment is presented in Table 2. Phosphorus was extracted using the Mehlich I method. Organic matter content was calculated from carbon determined by the Walkley-Black method, applying the conversion factor of 1.724. Soil pH was measured in a 0.01 M CaCl2 solution. Aluminum, calcium, and magnesium contents were extracted with 1 M KCl solution. Potassium was extracted by the Mehlich I method. Potential acidity (H+Al) was also determined. The sum of bases (SB) was calculated by adding the concentrations of potassium, calcium and magnesium. The cation exchange capacity (CEC) at pH 7 was determined by adding the sum of bases to the potential acidity (SB + H + Al). Base saturation (V) was calculated as (SB x 100)/CEC (Teixeira et al., 2017).
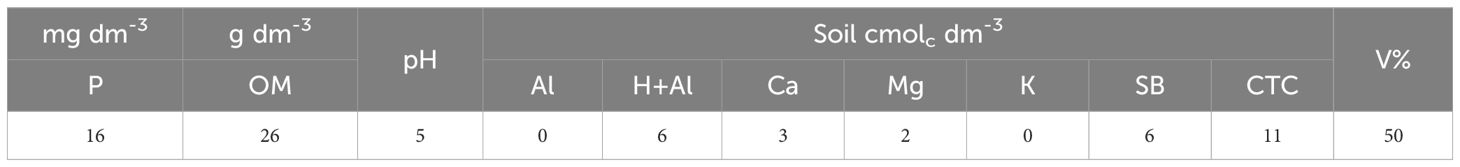
Table 2. Chemical characterization of the soil in the 0 to 20 cm depth layer, included: phosphorus (P), organic matter (OM), hydrogen ion potential (pH), aluminum (Al), potential acidity (H+Al), calcium (Ca), magnesium (Mg), potassium (K), sum of bases (SB), cation exchange capacity (CEC), and base saturation (V). Londrina, Brazil.
2.1.1 Winter cropping season – second-crop maize
For the second-crop maize grown in the winter of 2019 (March 4–August 6, 2019), five treatments and four replicates were used in a randomized block design. The treatments included a control (no N fertilization) and the following N rates: 30, 60, 90, and 120 kg N ha-1, applied as urea. The doses were split as shown in Table 3, for both 15N-urea and common urea.
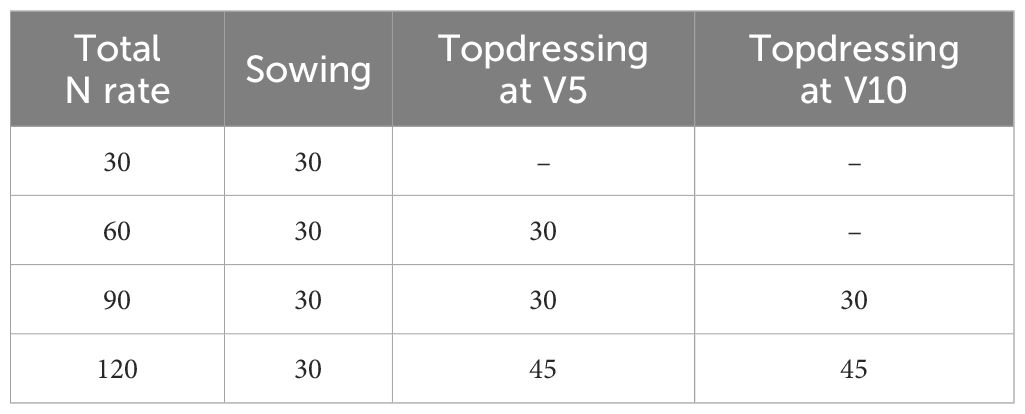
Table 3. Nitrogen application rates and timing (kg ha−¹) in second-crop maize (2019).
To distinguish, in the subsequently cultivated soybean, how much of the N originated from the shoot biomass of maize or from the fertilization with urea labeled with the 15N isotope (15N-urea) applied to maize, two subplots were established within each main plot. Thus, for each subplot fertilized with different rates of 15N-urea, there was a corresponding subplot fertilized with non-labeled urea (common urea). During the winter cropping season, only the maize plants from the subplots fertilized with 15N-urea were sent for analysis, while the plants from the subplots without labeled fertilization were used only for stover exchange, preceding soybean sowing. A schematic representation of this stover exchange can be seen in Figure 1.
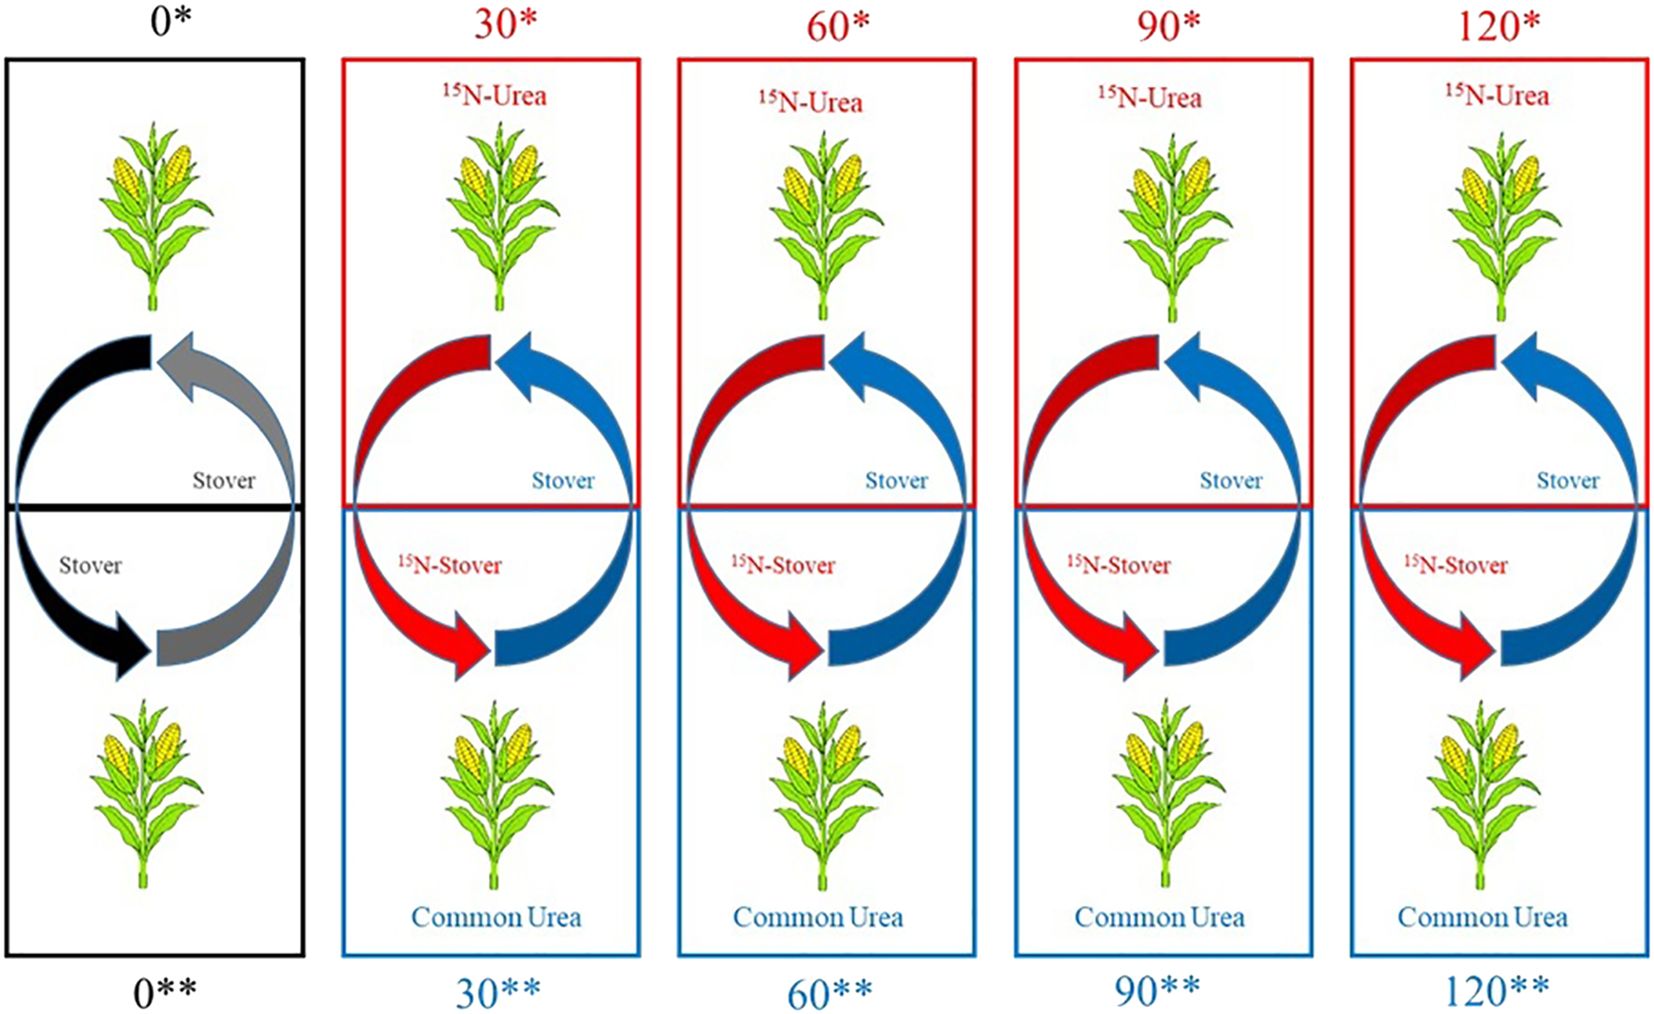
Figure 1. Schematic representation of stover exchange in subplots with common urea or 15N-urea after the second-crop maize harvest.
Each plot had an area of 16 m2, and each subplot had an area of 2.4 m2, consisting of 3 rows, with the remaining area serving as a border. The maize sowing (variety IPR 164) was carried out on March 4, 2019, with a spacing of 0.8 x 0.2 m.
The maize in the subplots with isotopic labeling was fertilized with urea enriched with 4% of 15N atoms, while the plants in the subplots without isotopic labeling were fertilized with common urea PA.
Before maize sowing, fertilization with phosphorus and potassium was performed according to the soil analysis and the crop recommendations (Pauletti and Motta, 2019). Crop management practices followed the technical guidelines for maize. The same procedures were adopted in both the microplots with 15N-urea and those with common urea.
At the physiological maturation stage of maize, the shoot of two maize plants labeled with 15N from the central line of each microplot was collected to determine dry matter mass and analyses of N concentration and 15N abundance. The maize shoot was cut close to the soil surface and separated into: ‘grains,’ ‘cob + husk,’ and ‘leaf + stalk.’ In this study, it was not possible to analyze the maize root system and the soil. The leaves and stalks were washed in running water and distilled water, dried in a forced-air oven (60°C) until constant weight. Each sample was weighed separately using an analytical balance to determine the dry matter mass, and then ground separately in a Wiley mill. The samples were analyzed for N concentration and 15N isotopic abundance using a mass spectrometer (IRMS) interfaced with an elemental N analyzer. Details of the methodology used can be found in Barrie and Prosser (1996) and Unkovich et al. (2001).
Using the results of dry matter mass, N concentration, and 15N isotopic abundance for each treatment (t = N rate applied as 15N-urea) and plant compartments (i = cob + husk, or leaf + stalk, or grains) of the maize plant, the following calculations were performed as detailed in Equations 1–5:
Where NAti is the total quantity of N accumulated in the plant (kg ha-1), CNti is the N concentration (g kg-1), and MSti is the dry matter mass in treatment t, compartment i (kg ha-1).
Where Nddfti is the percentage of N derived from fertilizer (%), a is the excess 15N atom percentage in treatment t and compartment i (%), and b is the excess 15N atom percentage in the 15N-urea (%).
Where QNddfti is the quantity of N derived from fertilizer (kg ha−¹), in treatment t and compartment i.
Where Rti is the recovery of N from 15N-urea (%) in treatment t and compartment i, and NUt is the 15N-urea rate applied in each treatment t (kg ha-1)
Where QNddstPA is the quantity of N derived from the soil in the shoot (sum of the cob + husk, leaf + stalk, and grains compartments) of maize (kg ha-1), NAtPA is the N accumulated in the shoot of maize (kg ha-1), and QNddftPA is the quantity of N derived from fertilizer in the shoot of maize (kg ha-1), in treatment t.
At physiological maturation, the grain yield was also evaluated in each microplot fertilized with 15N-urea, for each treatment. The grains were standardized with a maximum moisture content of 14%, and then the yield was calculated in kg ha-1. It is important to note that yield was calculated from the results of all the maize plants in the microplot that received 15N-urea, while the dry matter mass of grains was calculated from the two plants collected for isotopic analyses.
2.1.2 Summer cropping season - soybean
The experiment with soybean was conducted during the 2019/2020 summer cropping season (October 25, 2019 – March 11, 2020). Before soybean sowing, the stover from the remaining plants in each microplot of maize fertilized with 15N-urea was transferred to the microplot fertilized with common urea, and vice versa (Figure 1). In each microplot, the stover was shredded to simulate the action of a roller-crimper.
The randomized blocks, plots, and microplots used for the soybean crop were the same as those previously used for the maize crop, respecting the different N rates during the exchange of maize stover.
In this second experiment, nine treatments and four replicates were used, as follows:
Control - soybean crop sown in microplots where maize was cultivated without N fertilization and on stover from maize also grown without N fertilization;
Urea maize 30 - soybean crop sown in microplots where maize was fertilized with 15N-urea and on stover from maize fertilized with common urea at a rate of 30 kg ha-1;
Stover 30 - soybean crop sown in microplots where maize was fertilized with common urea and on stover from maize fertilized with 15N-urea at a rate of 30 kg ha-1;
Urea maize 60 - soybean crop sown in microplots where maize was fertilized with 15N-urea and on stover from maize fertilized with common urea at a rate of 60 kg ha-1;
Stover 60 - soybean crop sown in microplots where maize was fertilized with common urea and on stover from maize fertilized with 15N-urea at a rate of 60 kg ha-1;
Urea maize 90 - soybean crop sown in microplots where maize was fertilized with 15N-urea and on stover from maize fertilized with common urea at a rate of 90 kg ha-1;
Stover 90 - soybean crop sown in microplots where maize was fertilized with common urea and on stover from maize fertilized with 15N-urea at a rate of 90 kg ha-1;
Urea maize 120 - soybean crop sown in microplots where maize was fertilized with 15N-urea and on stover from maize fertilized with common urea at a rate of 120 kg ha-1;
Stover 120 - soybean crop sown in microplots where maize was fertilized with common urea and on stover from maize fertilized with 15N-urea at a rate of 120 kg ha-1.
An illustration representing the nine treatments can be observed in Figure 2.
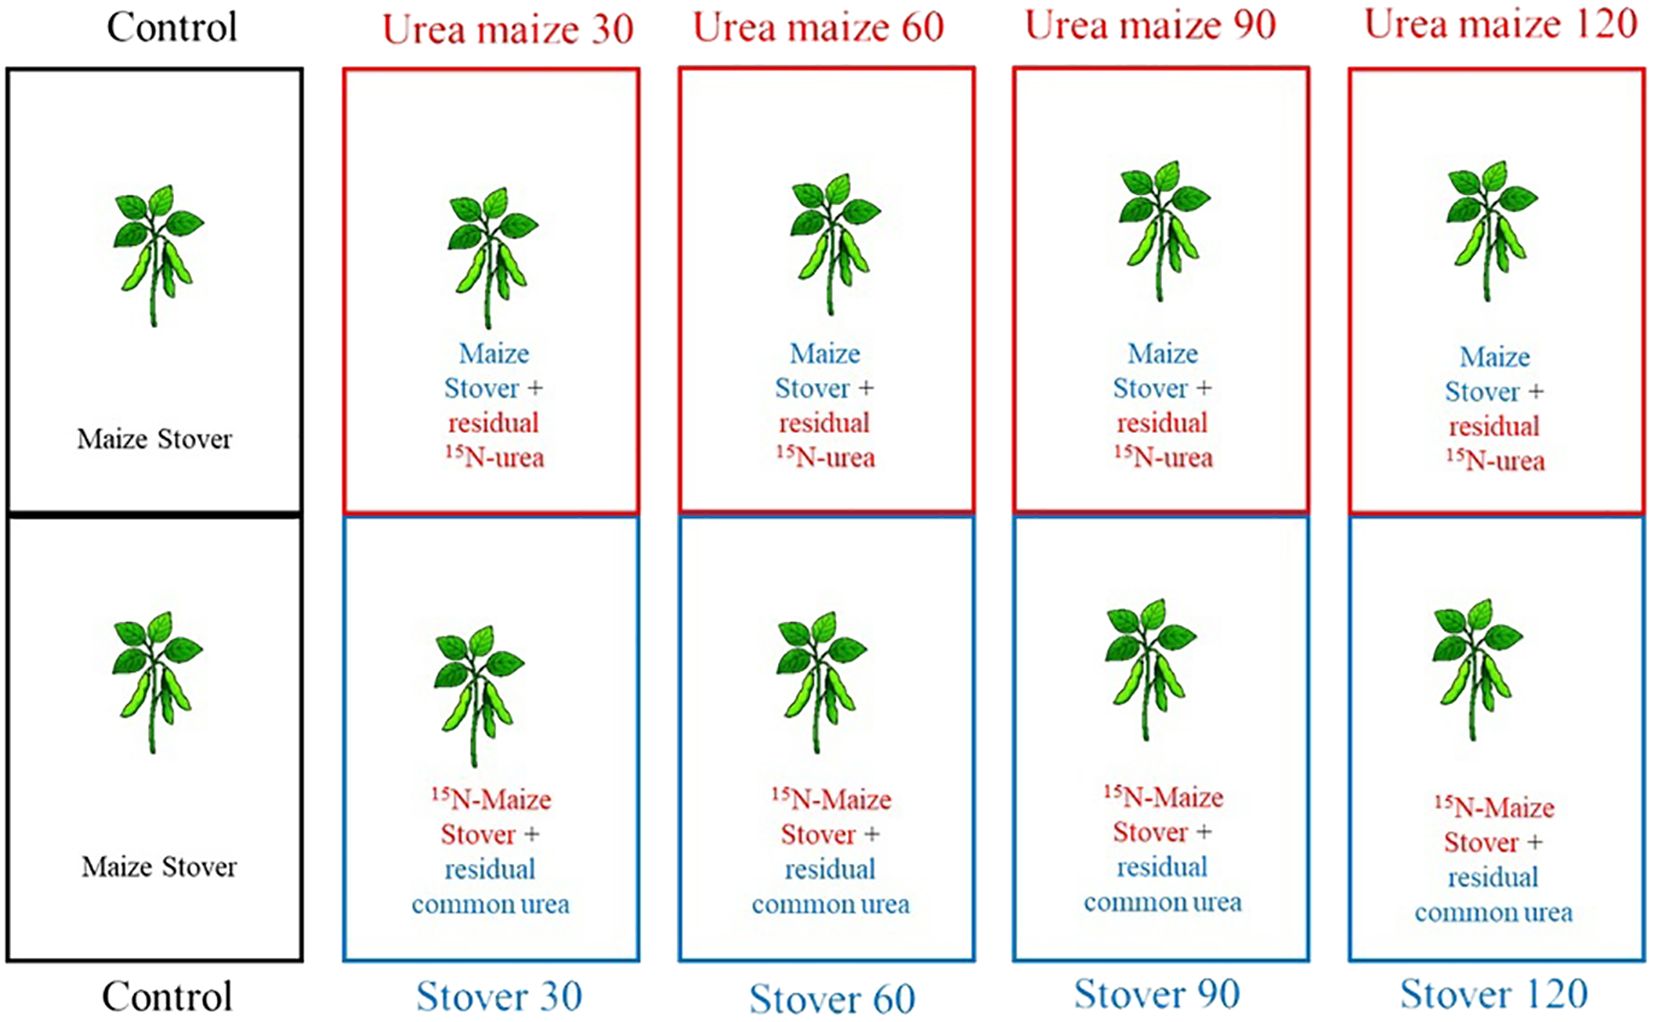
Figure 2. Schematic representation of the nine treatments in the soybean experiment.
Phosphorus and potassium fertilization was carried out according to soil analysis and crop recommendations (Pauletti and Motta, 2019). Soybean of the cultivar BMX Potência RR was sown with 0.45 m row spacing and 13 soybean plants per meter. All plots were inoculated with Bradyrhizobium japonicum. Pest and disease control practices were performed as needed and according to crop recommendations.
At the physiological maturation stage of soybean (R8 stage, 95% mature pods), both the collection of the soybean shoot for laboratory analyses and the harvest of grains for yield calculation were performed.
For laboratory analyses, all plants from the central row (average of 13 plants) were used to evaluate dry matter mass, for subsequent processing of grain and shoot samples separately. The soybean plants were divided into the following compartments: shoot (stem, leaves, petioles, and pod husks) and grains. In addition, the litter compartment was also assessed, which refers to the plant material (leaves and petioles) collected throughout the cropping season from the central row of each microplot. The processing and analysis of the soybean samples for N concentration and 15N abundance were the same as those described for maize.
The calculations for soybean utilization of N from maize stover labeled with 15N (15N-stover), and from 15N-urea applied to maize (both according to the different N rates applied to maize), were made separately for each treatment t, and for each compartment i (i = shoot, grains, or litter of soybean), as follows as detailed in Equations 6–10:
Where NAti is the N accumulated (kg ha-1), CNti is the N concentration (g kg-1), and MSti is the dry matter mass (kg ha-1), in treatment t, compartment i.
Where Nddpti is the percentage of N derived from 15N-stover (%), Ndumti is the percentage of N derived from 15N-urea applied to maize (%) in treatment t, compartment i, c is the percentage of excess 15N atoms in treatment t, compartment i (%), and d is the percentage of excess 15N atoms in 15N-stover or 15N-urea applied to maize in treatment t, compartment i (%).
It is important to highlight that in the case of Ndum, although the sources of N for soybean were both the residual 15N-urea and the roots of maize labeled with 15N-urea, our focus was to determine how much of the fertilization applied to the maize cultivated previously was recovered by the soybean in the subsequent crop. The same reasoning applies to the formulas derived from Ndum.
Where QNddpti is the quantity of N derived from 15N-stover (kg ha−¹), and QNdumti is the quantity of N derived from 15N-urea applied to maize (kg ha-1), in treatment t, compartment i.
Where Rpti is the recovery of N from 15N-stover and Rumti is the recovery of N from 15N-urea applied to maize, in treatment t, compartment i (%), Npt is the quantity of N applied to the soybean plot in the form of 15N-stover in treatment t, and NUt is the N rate applied to maize in the form of 15N-urea in treatment t (kg ha-1).
Where QNdofpti is the quantity of N derived from other sources (e.g., BNF, soil) in soybean cultivated in microplots where 15N-stover from maize was applied (kg ha-1), and QNdofumti is the quantity of N derived from other sources (e.g., BNF, soil) in soybean cultivated in microplots where 15N-urea was applied in the previous maize crop (kg ha-1), in treatment t, compartment i.
For yield estimation, the grains were standardized to a maximum moisture content of 14%, and then yield was calculated in kg ha-1 for each treatment. The yield calculation was based on the results from all plants in each microplot, while the dry matter mass of grains represents only the plants from the central row, which were collected for isotopic analysis.
2.2 Statistical analysis
Both maize and soybean datasets were analyzed for normality using the Shapiro-Wilk test, followed by analysis of variance with the F-test. When significant differences were detected, the multiple comparison test used for maize was Tukey’s (p < 0.05), and for soybean, the Scott-Knott test (p < 0.05). All statistical analyses were conducted using the free software SISVAR® 5.8 (Ferreira, 2019).
3 Results
Table 4 presents the average percentages of CN, the abundance of 15N, and Nddf for the different compartments of maize. A significant difference (p < 0.05) was only observed for CN in the leaf+stalk compartment, which increased from 0.81% to 1.25%, respectively, from the control treatment to the dose of 120 kg ha-1 of N (Table 4).
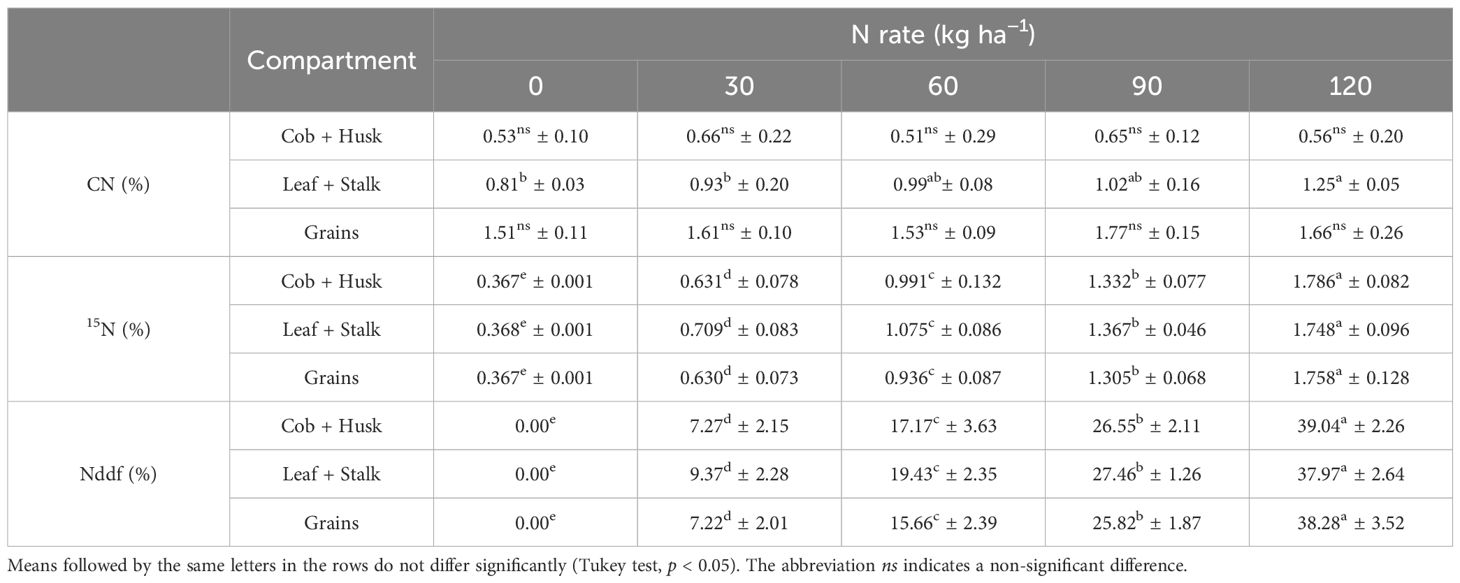
Table 4. Mean and standard deviation of nitrogen concentration (CN), 15N abundance (15N), and nitrogen derived from fertilizer (Ndff) in second-crop maize compartments under different nitrogen (N) rates.
The abundance of 15N (Table 4) was significantly different among all treatments (p < 0.05), increasing from the no fertilization treatment to the highest N rate applied, in all maize compartments. The percentage of 15N abundance varied in a very similar manner across the different compartments, ranging from natural abundance for plants that did not receive fertilizer to approximately 1.8% of 15N for the highest N rate applied. Similarly, the fraction of Nddf showed little variation when observing the different plant compartments. As with the abundance of 15N, the percentage of Nddf increased with the increasing N rate applied across all compartments, with an average of about 38% in the highest rate.
There was no significant difference among the treatments for maize yield (4705 to 5260 kg ha-1), not even between plants that did not receive fertilization and those fertilized with different N doses (Figure 3).
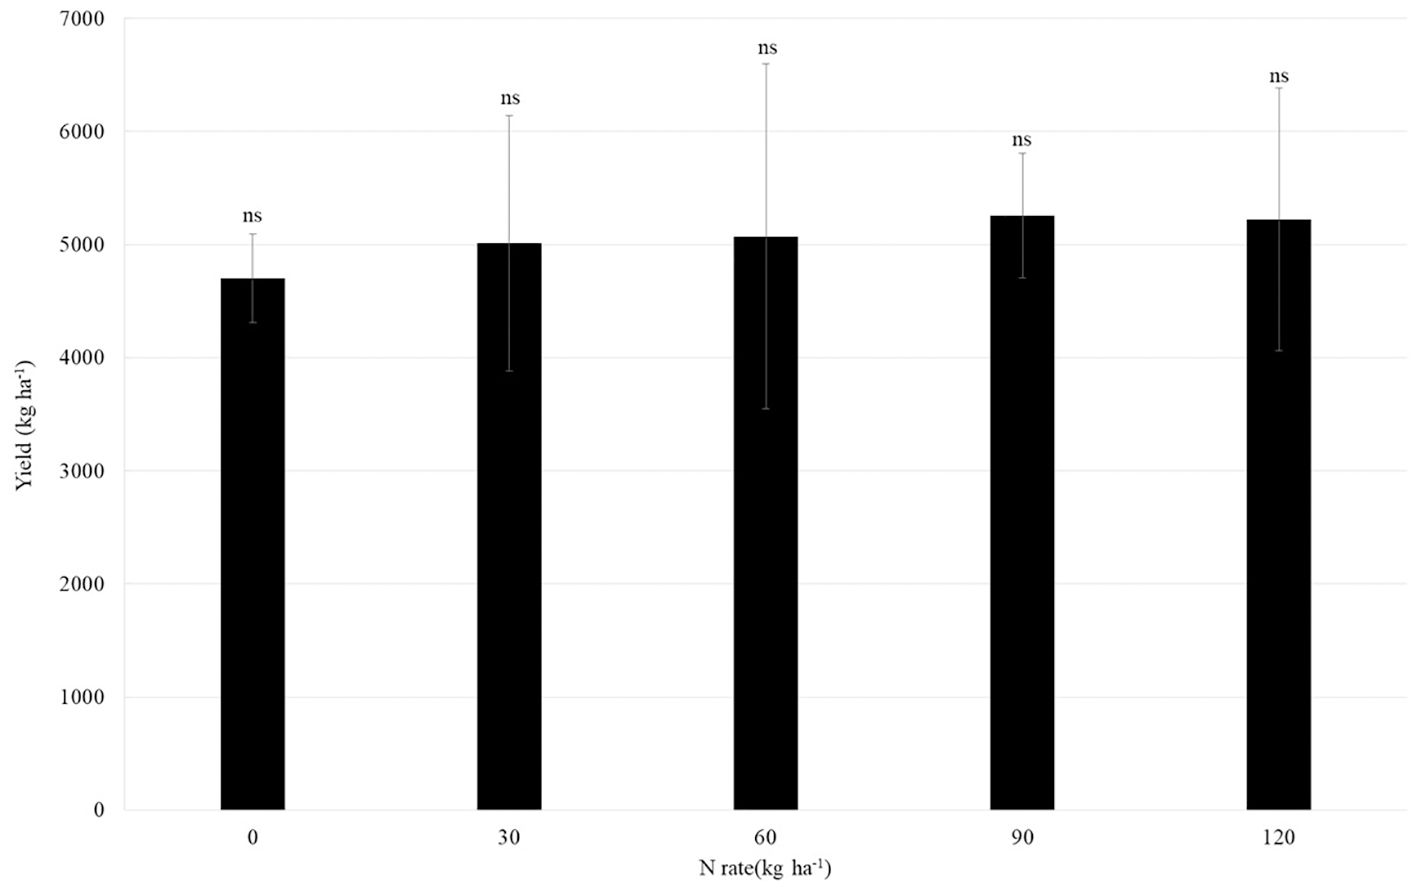
Figure 3. Mean yield and standard deviation of second-crop maize under different nitrogen (N) rates. The abbreviation ns indicates a non-significant difference (Tukey test, p < 0.05).
Figure 4 shows the amount of NA and QNddf (kg ha-1) for different compartments of maize. The average amount of NA in the assessed compartments of the maize did not differ among treatments, with approximately 10 kg ha-1 of NA in the cob+husk, 61 kg ha-1 in the leaf+stalk compartment, and 96 kg ha-1 in the grains.
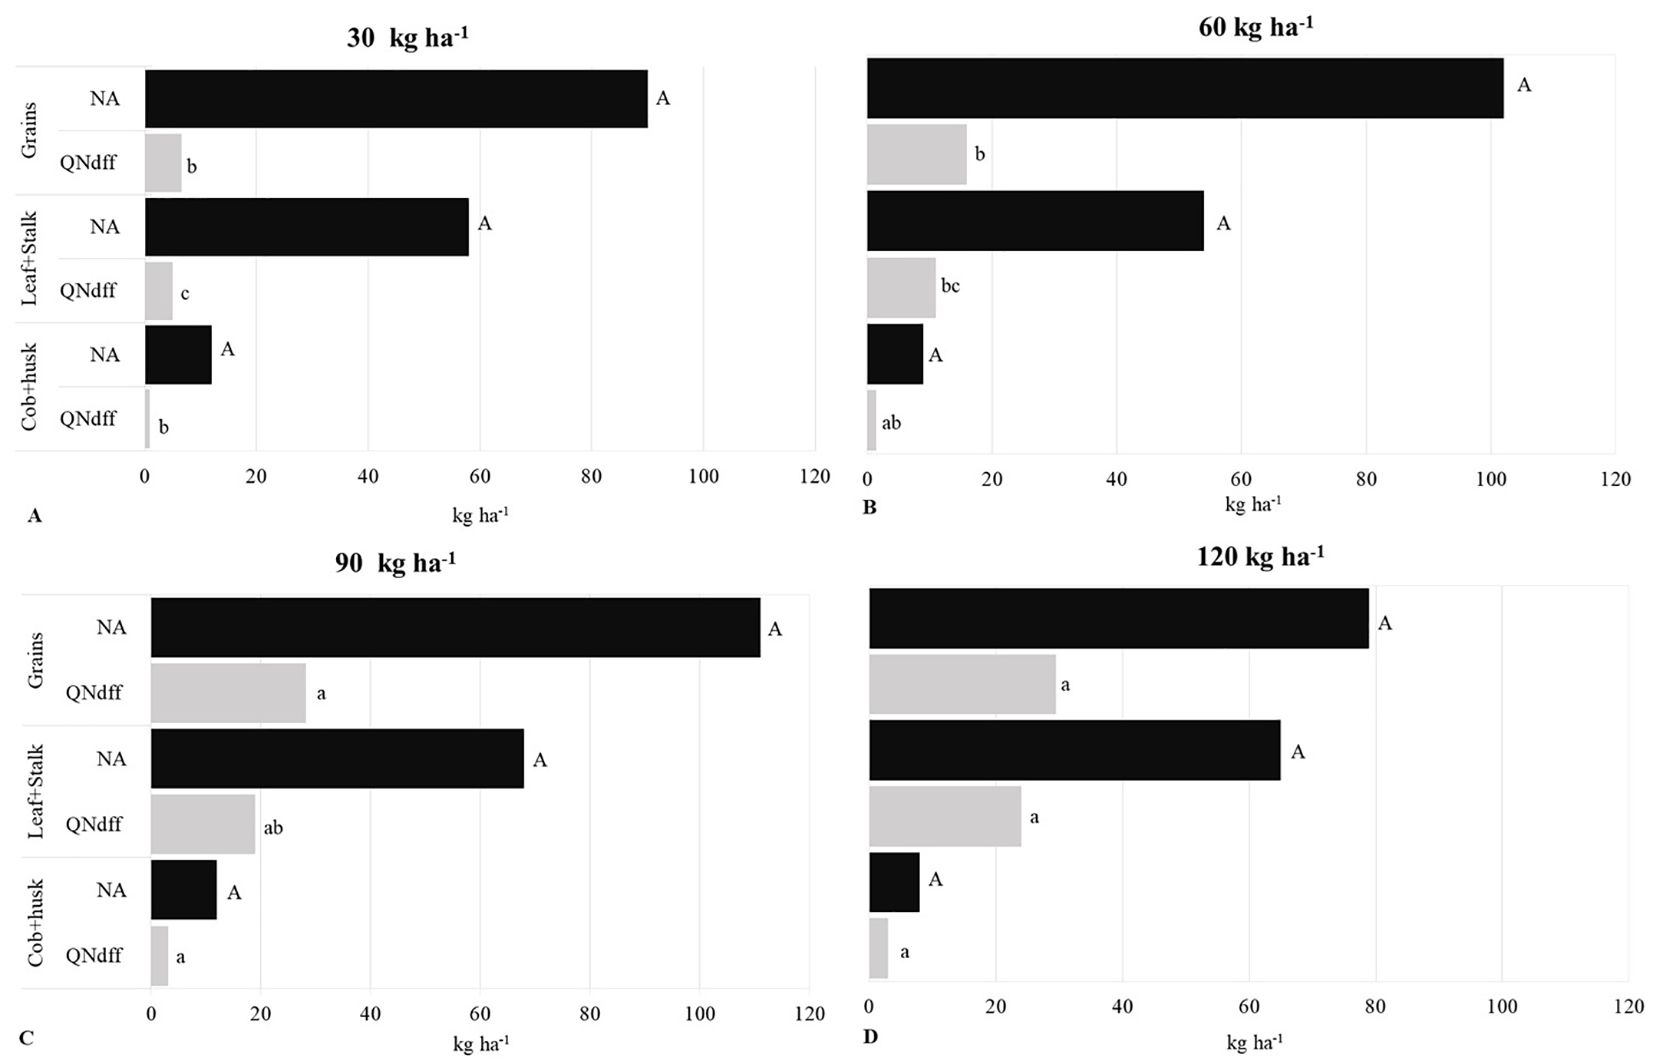
Figure 4. Mean total nitrogen accumulated (NA) and quantity of nitrogen derived from fertilizer (QNddf) in second-crop maize compartments under nitrogen rates of 30 (A), 60 (B), 90 (C), and 120 kg ha-1 (D) applied as 15N-urea. Means followed by the same uppercase letters within each compartment do not differ significantly for NA, and means followed by the same lowercase letters within each compartment do not differ significantly for QNddf (Tukey test, p < 0.05).
In contrast to NA, there was a significant difference (p < 0.05) in QNddf between the treatments for all the assessed compartments of maize. The highest N rates applied as fertilizer resulted in higher QNddf. In the cob+husk, QNddf ranged from 1 to 3 kg ha-1, in the leaf+stalk compartment from 5 to 24 kg ha-1, and in the grains from 7 to 30 kg ha-1 (Figure 4).
The 120 kg ha-1 N rate applied via 15N-urea contributed the most to the NA in the grains, as of the 79 kg ha-1 of NA, 30 kg ha-1 came from the fertilizer (Figure 4).
Considering all treatments, on average, 6% of the NA in the maize shoot was allocated to the cob+husk compartment, 36% to the leaf+stalk, while the grains accumulated the largest amount of N, around 58% (data not shown).
Figure 5 shows the percentage and average of QNddf and QNdds in the maize shoot (sum of cob+husk, leaf+stalk, and grains). The sum of QNddf and QNdds represents the amount of NA in the shoot, which ranged from 147 to 191 kg ha-1, with no significant difference among treatments. QNddf ranged from 12 to 56 kg ha-1 between the lowest and highest N rates applied. As the N rate increased, there was also a growth in the proportion of QNddf relative to the NA in the shoot, ranging from 8 to 37% coming from the fertilizer, with the remaining amount derived from the soil.
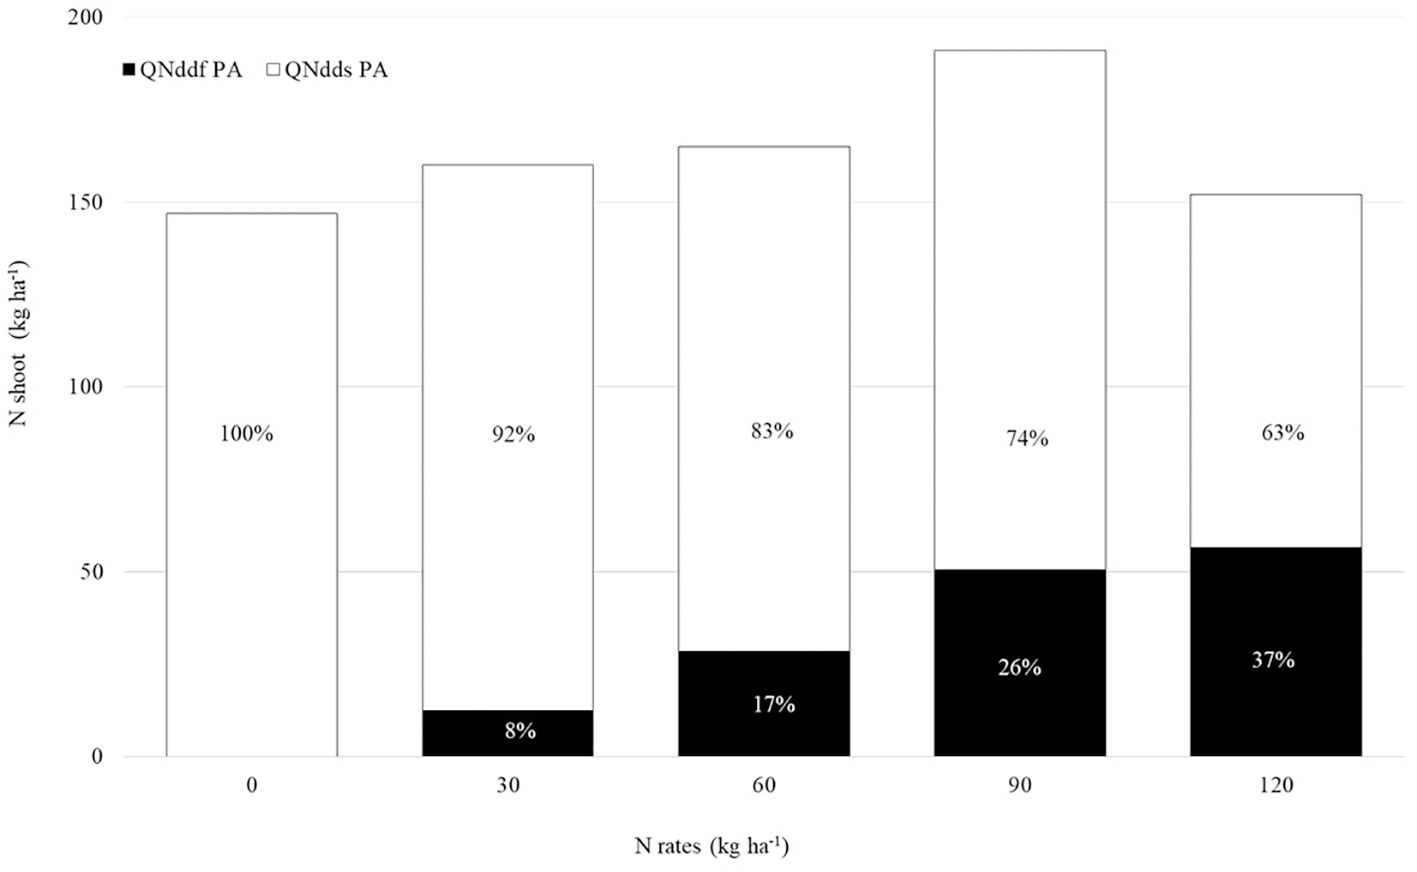
Figure 5. Percentage and mean quantity of nitrogen (N) derived from fertilizer (QNddf PA) and from soil (QNdds) in the shoot of second-crop maize under different N rates (15N-urea).
There was no significant difference in the average dry matter mass in any of the maize plant compartments, regardless of the 15N-urea rate applied, which averaged 1663 kg ha-1 for cob+husk, 5890 kg ha-1 for leaf+stalk, and 5834 kg ha-1 for grains (Figure 6).
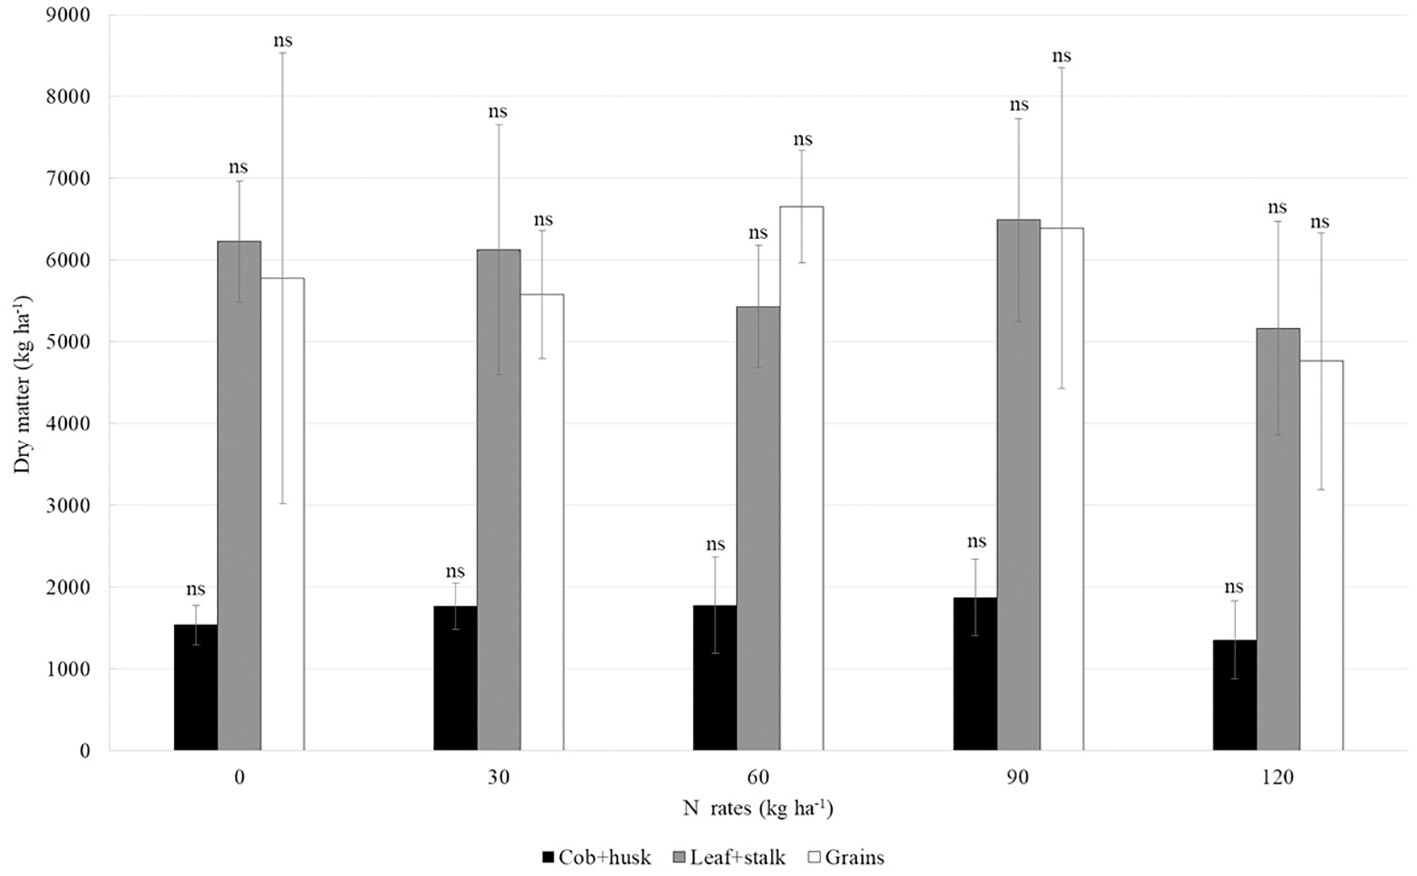
Figure 6. Mean and standard deviation of dry matter mass in second-crop maize compartments under different nitrogen rates (15N-urea). The abbreviation ns indicates a non-significant difference between the means within each compartment (Tukey test, p < 0.05).
Figure 7 shows the average percentage of N recovery in the cob+husk (2 to 4%), leaf+stalk (18 to 21%), and grains (22 to 32%) compartments of maize, with no significant difference among the treatments.
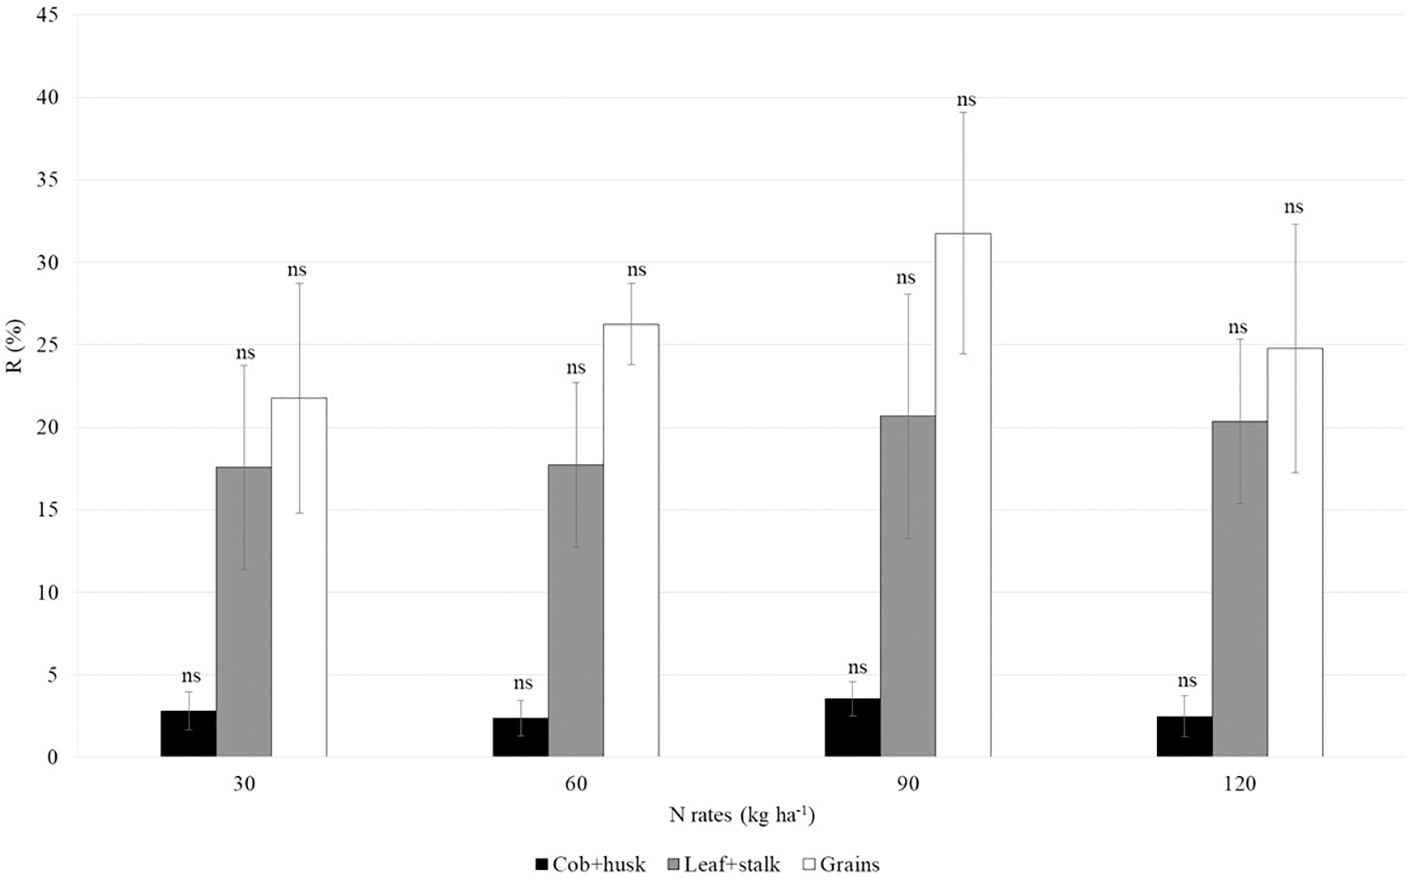
Figure 7. Mean and standard deviation of nitrogen recovery from 15N-urea in second-crop maize compartments under different nitrogen rates. The abbreviation ns indicates a non-significant difference between the means within each compartment (Tukey test, p < 0.05).
The average percentages of CN, 15N, Nddp, and Ndum in the shoot, litter, and grains compartments of soybean plants, under different treatments, can be seen in Table 5.
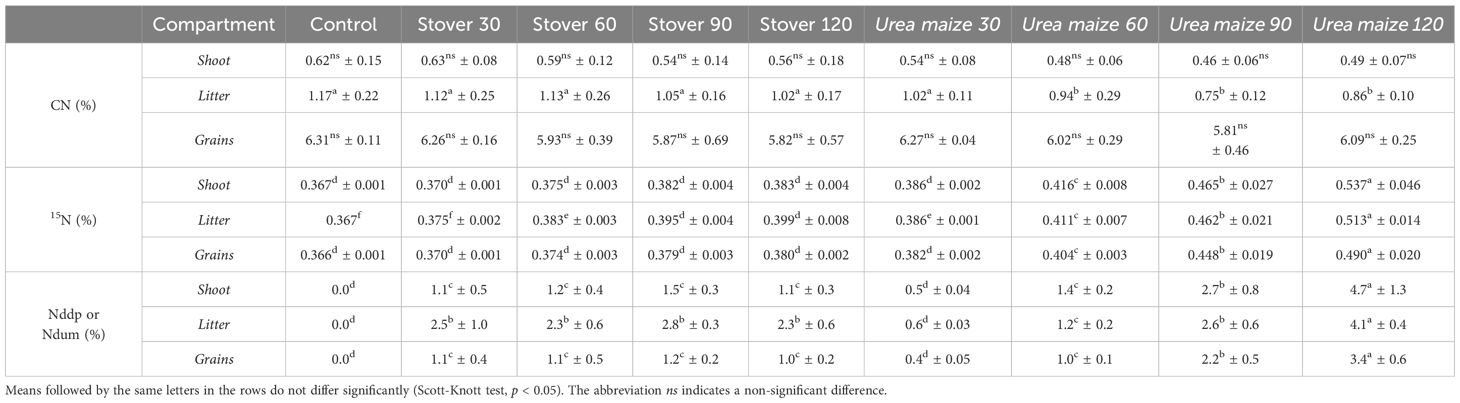
Table 5. Mean and standard deviation of nitrogen concentration (CN), 15N abundance (15N), and nitrogen derived from maize stover labeled with 15N (Nddp) or from urea labeled with 15N applied to second-crop maize grown before soybean (Ndum), in the soybean plant compartments under different treatments.
The CN was only different in the litter compartment, where the urea maize 60, 90, and 120 treatments showed significantly (p < 0.05) lower nutrient concentration compared to the others (Table 5).
In general, in all compartments, the abundance of 15N, as well as Nddp and Ndum, was lower in the stover treatments, following the N rate previously applied to the maize (Table 5).
Table 6 shows the amount of NA and QNddp or QNdum, as well as the percentage of N derived from the 15N-stover or 15N-urea applied to maize relative to the total NA, in the three compartments assessed in soybean.
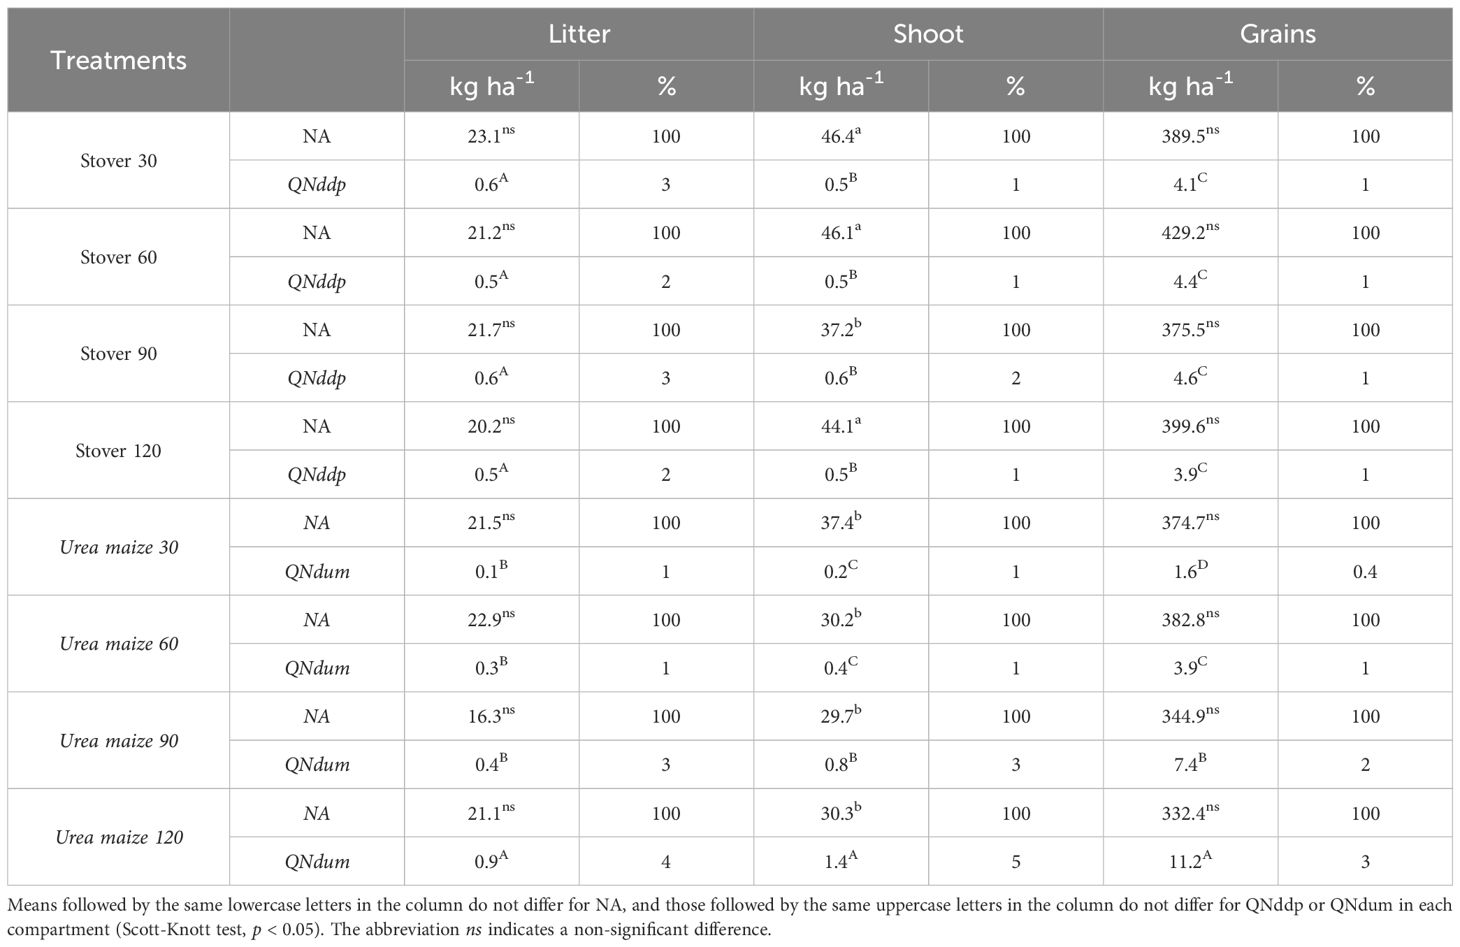
Table 6. Mean amount and percentage of accumulated nitrogen (NA), nitrogen derived from maize stover labeled with 15N (QNddp) or nitrogen derived from urea labeled with 15N applied to second-crop maize grown before soybean (QNdum) in compartments of soybean under different treatments.
The amount of NA was significantly (p < 0.05) different among the treatments only for the soybean shoot, with the highest values found in soybean grown under the stover 30, 60, and 120 treatments (Table 6).
The urea maize 120 treatment was the largest source of N in both the litter, shoot, and grains. However, in the litter compartment, the urea maize 120 treatment was not significantly different from all the stover treatments, while in the other compartments, there was a significant difference (p < 0.05) between urea maize 120 and all other treatments. Regardless of the treatment, the grains accumulated more N and had higher values of QNddp and QNdum (Table 6).
The soybean grain is the main N sink, as, when considering all plant compartments (litter, shoot, and grains) and all treatments, on average, 87% of the accumulated N is found in the grains (data not shown).
Table 7 shows the quantity of N derived from stover, maize fertilization, or other sources in the shoot, grains, and litter compartments of soybean. In both the stover and urea maize treatments, at all rates, the majority of N in all compartments came from other sources. In the shoot, the largest contribution came from the urea maize 120 treatment, which contributed 1.4 kg ha-1, significantly differing (p < 0.05) from the others. The contribution from other sources was higher in the control and in the stover treatments, except for stover 90. In the grains, the maximum contribution was 11.2 kg ha-1 for urea maize 120, which significantly differed (p < 0.05) from the other treatments, while the contribution of N from other sources reached 321 kg ha-1. In the litter, all stover treatments and the urea maize 120 treatment had the highest contribution, ranging from 0.5 to 0.9 kg ha-1 of N, and significantly differing (p < 0.05) from the others. Regarding other sources, there was no significant difference between the treatments.
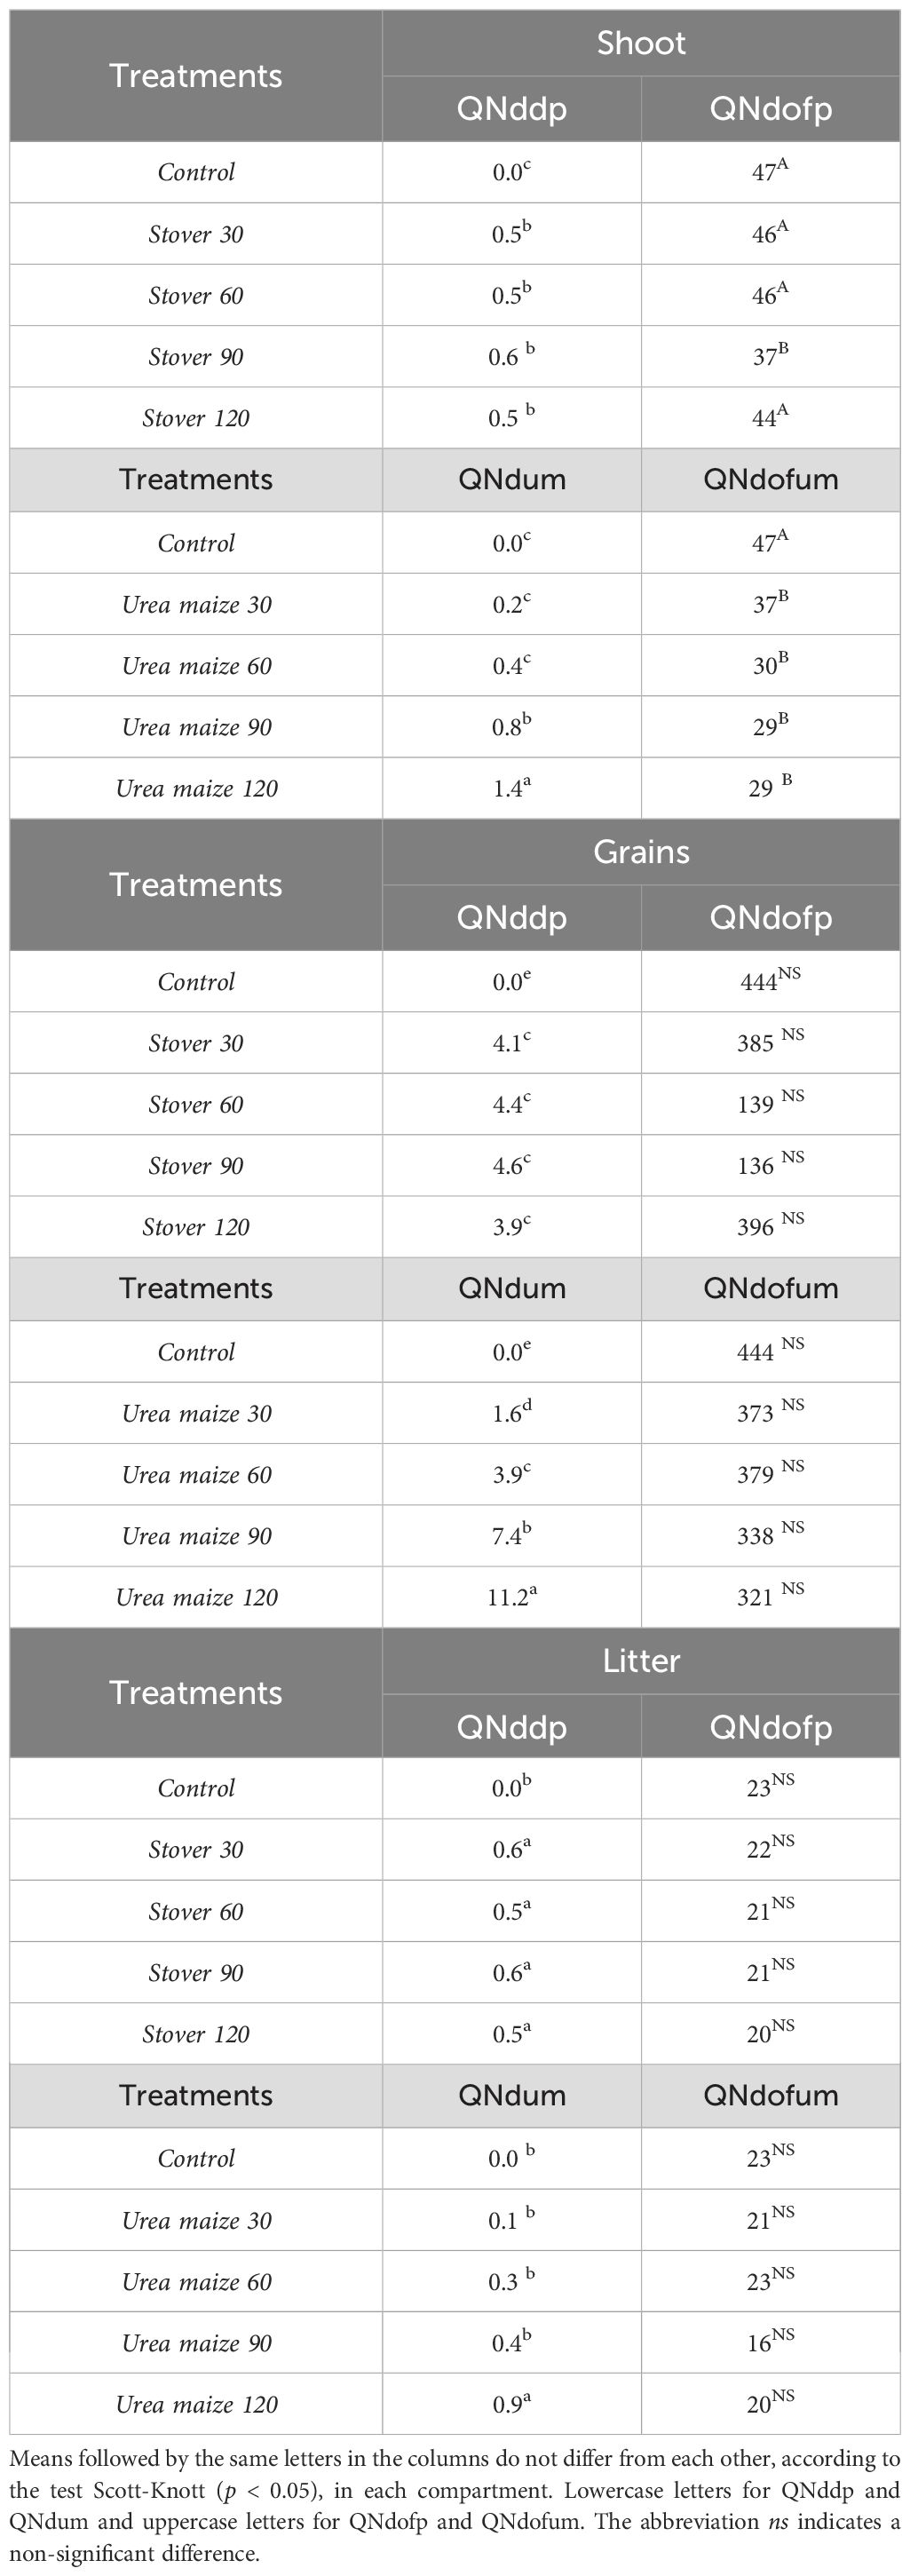
Table 7. Quantity of nitrogen derived from maize stover labeled with 15N (QNddp) or other sources (QNdofp), and urea labeled with 15N applied to maize (QNdum) or other sources (QNdofum), in kg ha-1, in different compartments of soybean under different treatments.
On average, across all treatments, QNddp contributed 1% of the N in the shoot, 1% of the N in the grains, and 1% of the N in the litter, while QNdum contributed 2% of the N in the shoot, 0.4% of the N in the grains, and 1% of the N in the litter (data not shown).
The soybean yield (kg ha-1), calculated from the data of all plants in each subplot, under different treatments is presented in Figure 8. There was no significant difference among the treatments for yield, which averaged 6,266 kg ha-1.
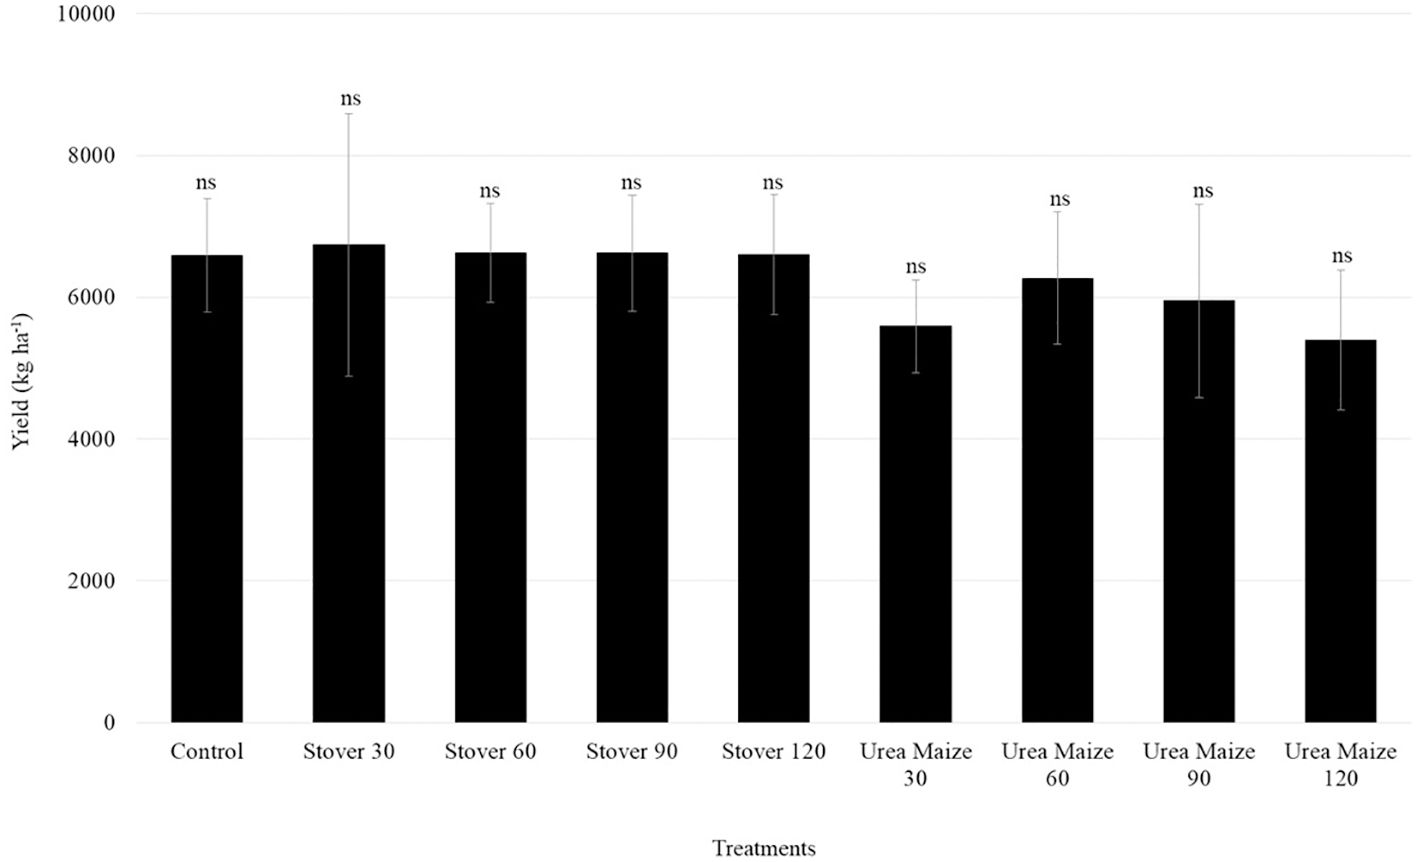
Figure 8. Mean yield and standard deviation of soybean under different treatments. The abbreviation ns indicates a non-significant difference (Scott-Knott, p < 0.05).
Regarding dry mass, there was a significant difference only for the shoot, with all urea maize treatments and stover 90 showing significantly (p < 0.05) lower values than the others, including the control treatment (Figure 9).
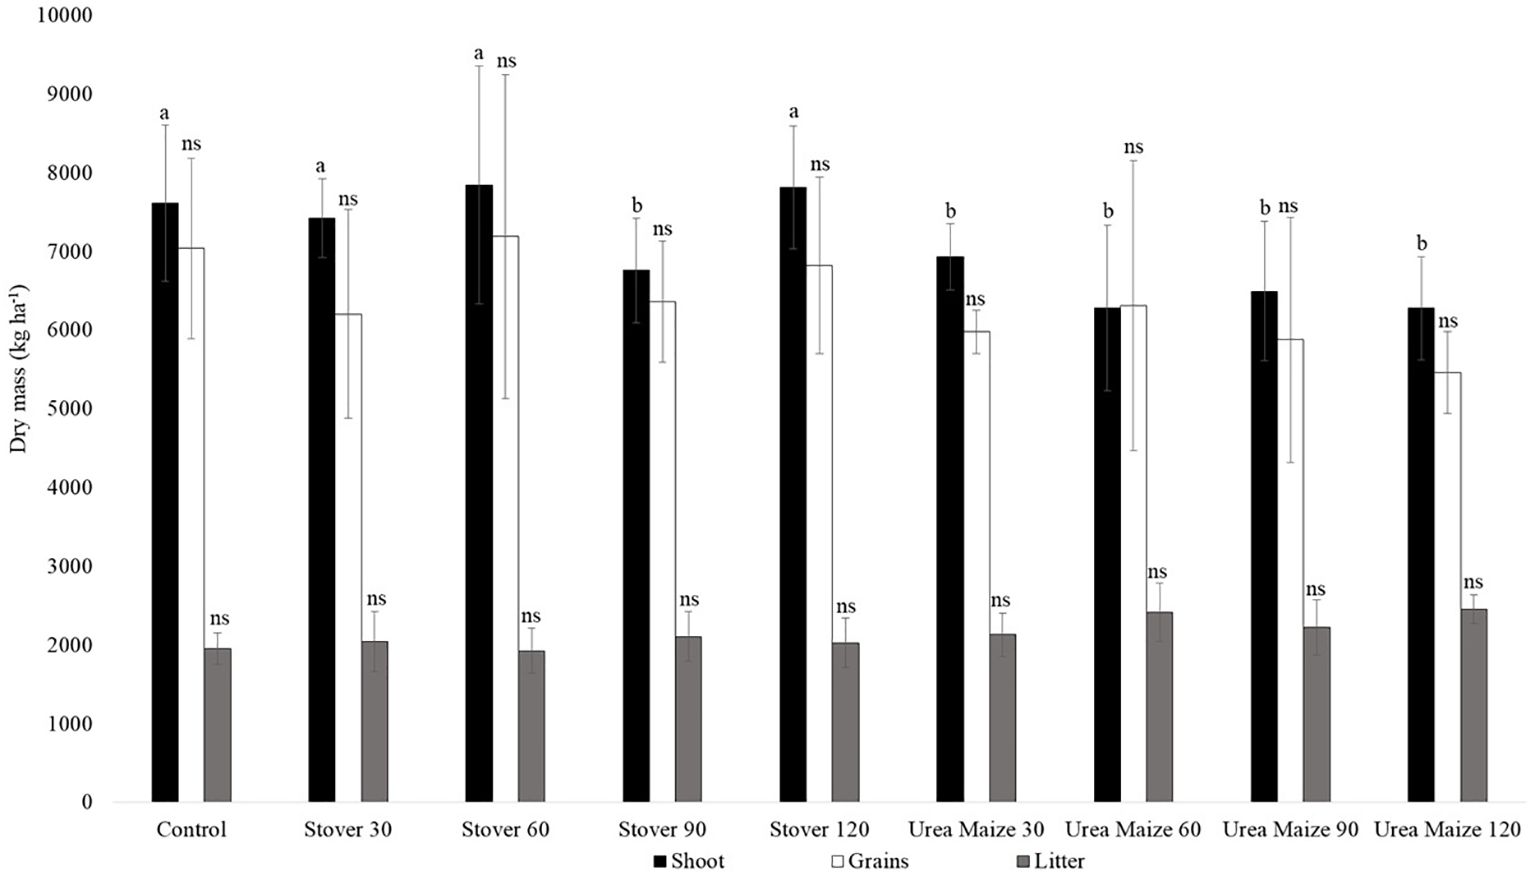
Figure 9. Mean and standard deviation of dry matter mass in soybean compartments under different treatments. Means followed by the same letters do not differ significantly within each compartment. The abbreviation ns indicates a non-significant difference between the means within each compartment (Scott-Knott test, p < 0.05).
The percentages of Rp and Rum in the shoot, grains, and litter compartments can be seen in Figure 10. The percentage of N recovery from both the stover and the urea applied to maize was higher in the grains than in the other compartments. Only the litter compartment showed a significant difference (p < 0.05) among treatments, with lower recovery in urea maize 30, 60, and 90. This indicates that the N derived from maize stover, as well as from the highest rate of fertilizer applied in the previous crop, was more efficiently utilized by the parts of the soybean plant that were detached throughout the cropping season, which form the litter.
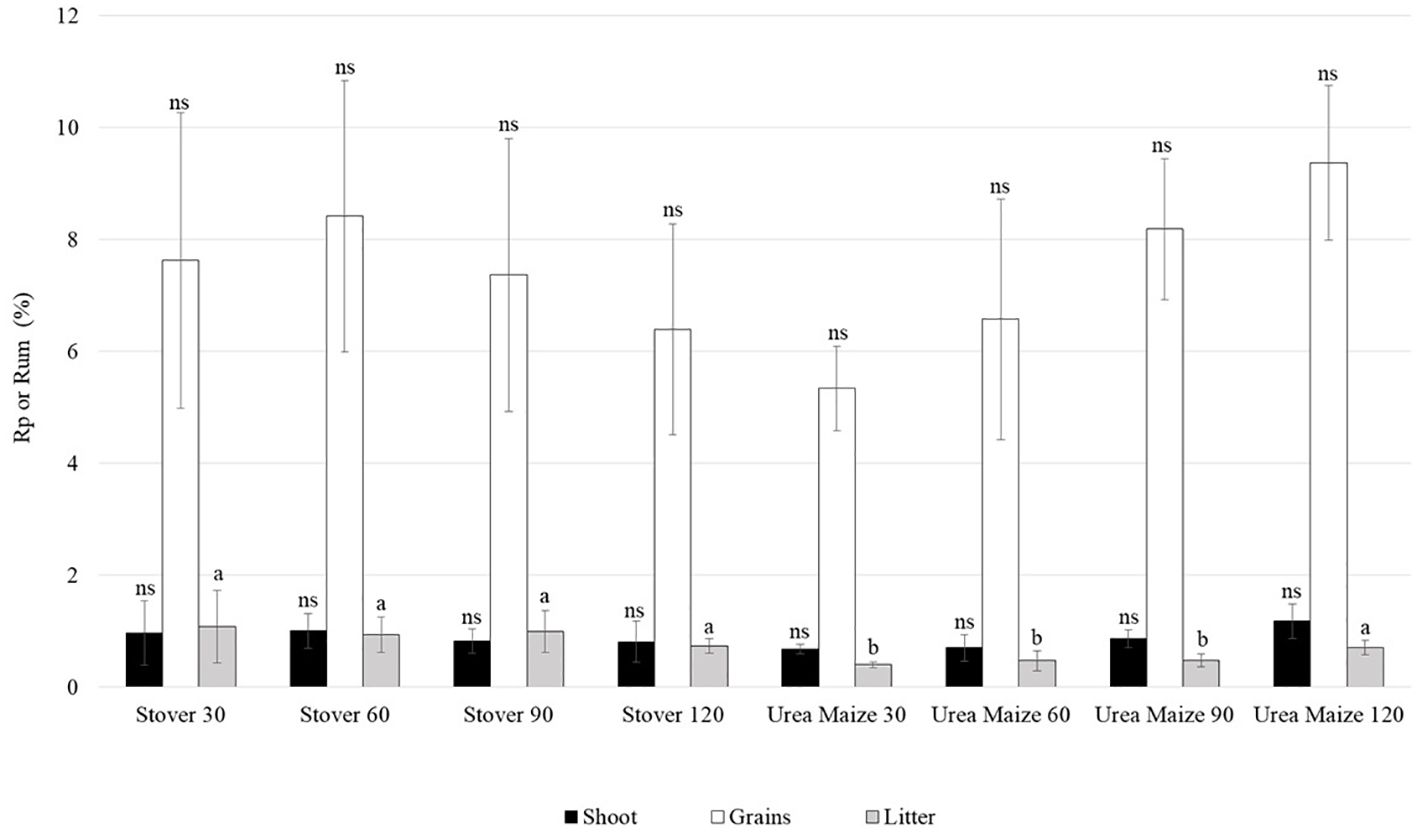
Figure 10. Mean and standard deviation of nitrogen recovery from stover (Rp, %) or from 15N-urea applied to previously grown maize (Rum, %) in soybean compartments under different treatments. Means followed by the same letters do not differ significantly within each compartment. The abbreviation ns indicates a non-significant difference between the means within each compartment (Scott-Knott test, p < 0.05). *indicates the plots where 15N-urea was applied to maize and its unfertilized control; ** indicates the plots where common urea was applied to maize and its unfertilized control.
4 Discussion
Regarding the CN percentages (Table 4), previous studies on maize analyzed the leaf separately, with values ranging from 2.3% to 5.5% (Malavolta et al., 1997; Souza and Melo, 2000; Silva et al., 2005; Ferreira et al., 2009), which is well above the values found in the leaf+stalk compartment of the present study. This variation can be attributed to the genetic diversity present among the different maize genotypes (Barbosa et al., 2016). However, it is noticeable that different N rates significantly (p < 0.05) affected the concentration of this nutrient in the leaf+stalk compartment, increasing with higher application rates - an effect not observed in the other plant compartments. This pattern likely reflects that, as soil N availability increases following fertilization, uptake may exceed the plant’s assimilation capacity, leading to accumulation of excess N in the leaf+stalk (Taiz et al., 2017). The grains had a higher CN than the other compartments, with values consistent with previous studies, ranging from 1.2% to 1.6% (Silva et al., 2005; Veloso et al., 2010). This is because plants allocate a greater proportion of nutrients, including N, to seeds compared to other tissues, as the vigor of the subsequent generation relies on these reserves, which are primarily stored as proteins (Epstein and Bloom, 2006).
Ndff reveals greater N allocation from urea in maize tissues (Table 4) than that reported by Schoninger et al. (2018), who observed Nddf values of 13-33% for whole plants and 5-15% for the cob+husk under a single topdressing application (140 kg ha-1) at different phenological stages. Our two split applications at V5 and V10 stages likely enhanced N contribution from fertilizer indicating that further fractionation into at least three applications would be a good strategy to increase fertilizer N efficiency under the highest doses.
The high yield of second-crop maize observed across all treatments in this study (Figure 3) reflects the good soil fertility, as there was no significant difference between the control and the N-fertilized treatments. Such high-fertility conditions are common in soils of commercial production areas in Brazil, as the country is among the world’s largest consumers of fertilizer (FAOSTAT, 2025). Additionally, although a maize variety was used, the yield was very close to the national average for second-crop maize of that year, which was 5,500 kg ha-1 (CONAB, 2019).
The distribution of NA in the different compartments of the maize shoot (Figure 4) is similar to that reported by Gava et al. (2006) in a 15N balance study with maize, which showed that most of the N was allocated to the grains. This prevalence of NA in the grains is due to the high N demand for protein synthesis during grain filling, which directly affects grain quality (Epstein and Bloom, 2006).
The QNddf distribution among maize shoot compartments (Figure 4) was consistent with that obtained by Gava et al. (2006) under no-tillage, with the majority of QNdff concentrated in the grains. Increasing N rates enhanced QNddf in maize, indicating that while the total amount of NA did not vary significantly among treatments, the N source used by the plant depended on the applied rate. Silva et al. (2006) similarly observed an increase in QNdff in the maize shoot – including the grains – at different N rates (30 to 180 kg ha-1) reaching a maximum of 68 kg ha-1. Like most nutrients, N uptake in plants is tightly regulated by its availability, whereby uptake peaks under high supply – such as at the highest N application rates – and surplus N is stored in tissues for subsequent use (Epstein and Bloom, 2006).
Although the QNddf showed a more significant (p < 0.05) contribution in the grains compared to the other compartments, this contribution did not even reach half of the NA for any of the treatments (Figure 4). This result indicates that the organic matter present in the soil, which acts as a source of N, is very important for providing this nutrient to maize, even when cultivated with high N rates. A similar conclusion was made by Silva et al. (2006) in a study evaluating the amount of native soil N absorbed by maize in no-tillage. Those authors found that the soil provided most of the N for maize when compared to inorganic fertilizers and green manures.
Most of the N in the maize shoot originates from non-fertilizer sources (Figure 5), as shown in previous studies (e.g., Silva et al., 2006; Ambrosano et al., 2011). In studies using the 15N tracer method, this can be attributed to pool substitution, that can increase the release of native soil inorganic N, which may be accessible to crops, increasing the absorption of N from soil instead from fertilizer (Sun and Zhu, 2022), explaining the lower QNddf in the shoot despite increasing N rates. Supporting this, Schoninger et al. (2018) found that up to 88% of maize NA comes from other soil N sources, while Quan et al. (2020) and Ding et al. (2019) reported soil contributions of 64% and nearly 60%, respectively, highlighting the role of fertilizer in replenishing soil N depleted by crops and the potential of organic residues to sustainably supply nutrients.
The fact that there was no difference in dry matter mass (Figure 6), even between the fertilized treatments and the control, indicates good soil fertility. Soil analysis showed a carbon content of 15 g dm-3, equivalent to 26 g dm-3 organic matter (Table 2), which is considered high (Pauletti and Motta, 2019) and likely served as a source of N (Lal, 2020). The study conducted by Gava et al. (2006) also found no differences between treatments, and the soil in that experiment exhibited similarly high levels of all soil fertility parameters. However, Gava et al. (2010), in a study where maize plants were subjected to different N rates (0 to 200 kg ha-1), on high fertility soil, observed differences in the leaf and grain compartments, with the highest production at the 100 kg ha-1 rate. Although the high fertility may limit the generalizability of our findings to most agricultural soils, they remain relevant for no-tillage systems, where soil organic matter and fertility levels are generally higher (e.g., Ramos et al., 2018; Sapkota et al., 2012; Tiecher et al., 2017).
Although not significantly different among treatments, the N recovery values (Figure 7) align with previous studies, showing lower recovery in the cob+husk and leaf+stalk compartments than in the grains. This likely reflects limited soil N availability late in the crop season, prompting remobilization from vegetative tissues, which supply a large portion of the N found in the grains (Epstein and Bloom, 2006). Similarly, Gava et al. (2010) reported lower N recovery in the maize vegetative compartments relative to grains, and noted that increasing N application rates did not necessarily improve recovery. Another maize study, found no significant differences in N recovery among treatments across plant parts, with the highest values observed in grains (Gava et al., 2006). Comparable values were also reported by Schoninger et al. (2018).
In soybean, the significantly lower CN observed only in the litter of the urea maize 60, 90, and 120 treatments (Table 5) suggests enhanced remobilization of N from senescent tissues to growing organs, reducing litter CN, as proposed by Xing et al. (2019). The lower shoot CN across all treatments may support this conjecture. On the other hand, the absence of differences in shoot or grain CN among treatments suggests possible N translocation to the roots – a hypothesis that can only be confirmed through root system analysis. This represents a limitation of the present study and underscores the need to include root assessment in future research.
In general, similar studies only analyze the leaves during the vegetative phase and the grains, making it difficult to compare the data obtained here. The CN in the shoot was much lower than the literature results for leaves, which typically range around 4.5% (Farhangi-Abriz and Torabian, 2018; Teixeira et al., 2018). Grain CN indicates that they are the primary N sinks, exceeding the 5.5 and 5.7% reported by Esper Neto et al. (2021) and Filippi et al. (2021), respectively. This discrepancy likely reflects variations in genetic material and yield levels, which directly affect CN in soybean grains (Filippi et al., 2021).
The 15N abundance, Nddp, and Ndum in soybean (Table 5) show that N from the maize stover contributed less to soybean N nutrition than N derived from higher maize fertilization rates. While CN in the shoot and grains did not differ significantly among treatments, differences in Nddp and Ndum suggest that the N source utilized by soybean varied with treatment. Specifically, higher Nddp and Ndum values in the urea maize 90 and 120 treatments imply a greater contribution of maize fertilization N to the soybean nutrition compared to maize stover N (Table 5). This likely reflects the greater availability of residual fertilizer N for the succeeding soybean crop, contrasting with the slower N release from maize stover. The amount of plant-available N released from organic sources such as stover depends on multiple factors affecting N mineralization, immobilization, and losses (Havlin et al., 2005).
Because NA reflects both CN and biomass, and shoot biomass is much greater than litter biomass (Figure 9), NA values were higher in the shoot than litter (Table 6), unlike CN. Regardless, the NA data reinforce the designation of grains as the primary nitrogen sink in soybean. Contrary to expectations, NA was significantly higher in the shoot of soybean plants grown under the stover treatments than in those with urea-maize treatments (Table 6). This is certainly due to what Kuzyakov et al. (2000) define as positive real priming effect, caused by the addiction of mineral N fertilizer, which can accelerate the mineralization of soil organic matter by lowering the C:N ratio.
For all compartments, the percentage contribution of QNddp and QNdum to the NA was very low, reaching a maximum of 5% (1.4 kg ha-1) with the ureia milho 120 treatment in the shoot (Table 6). Given that no studies were found on the contribution of N from grasses to legumes, we will use the work by Ding et al. (2019) for comparison, where they found that in wheat, 9.2% of the N came from maize stover labeled with 15N, 31% originated from urea, and the largest portion, 59.5%, came from the soil. This is likely due to the positive apparent priming effect described by Kuzyakov et al. (2000) as pool substitution through immobilization following the addition of 15N mineral fertilizer.
The contribution of maize stover and urea to soybean N nutrition was low in all compartments, with most N derived from other sources (Table 7), underscoring the importance of BNF and soil organic matter. Globally, the average value of BNF contribution to soybeans is 58% (Herridge et al., 2008) while in Brazil this contribution is around 80-84% (Alves et al., 2005; Hungria et al., 2006). Considering this and the ~2% (Table 7) N from maize stover or urea found here, roughly 14-16% likely originates from soil organic matter formed from the plant residues of previous crops. The higher N contribution from 120 urea maize to soybean shoots (Table 7) aligns with the expectation that recovery from organic sources is lower shortly after application (Luo et al., 2004).
The shoot dry mass was lower in the treatments with maize urea (Figure 9), even though these treatments contributed more to the N supply (Table 7), also indicating a possible positive real priming effect.
No significant difference in soybean yield (Figure 8) was observed among treatments, possibly due to the high soil fertility, effective inoculant and supplemental irrigation (Tables 1, 2). The average yield exceeded the 2019/2020 national average of 3,379 kg ha-1 (CONAB, 2020), suggesting that soybean production in these conditions is not influenced by the amount of N fertilizer applied to the preceding maize crop. Although supplemental irrigation is uncommon, the soil fertility and management practices used here are typical of Brazilian soybean-producing regions, making these results relevant to those areas.
The N recovery from the maize stover or urea by soybeans was very low, around 1% in the litter and shoot, and even in the grains, the highest recovery percentage did not exceed 9.4% (Figure 10). It is important to note that the limited study period, as well as the lack of evaluation of root nitrogen uptake and microbial nitrogen transformations, suggest the need for long-term studies focusing on these processes to better understand N use by soybean beyond BNF. Due to mechanisms such as pool substitution and priming effects, only long-term 15N studies can accurately quantify the true contribution of maize residual N and stover to soybean.
5 Conclusions
Grains were the primary N sink in both maize and soybean, showing the highest N recovery. Despite urea application, the majority of N taken up by maize originated from the soil, likely due to mechanisms such as pool substitution. The highest urea rate applied to maize resulted in the greatest fertilizer-derived N in the shoot.
Although N fertilization affected the source of N absorbed, the contribution of maize-applied urea and stover to the N nutrition of the subsequent soybean crop was minimal, contradicting the initial hypothesis that residual urea maize would be the main N source beyond BNF. Among soybean treatments, urea maize 120 showed the highest percentage and amount of N derived from urea or stover across all plant compartments, and recovery to shoot and grains.
These findings highlight the limited short-term contribution of residual maize N to soybean nutrition and underscore the need for long-term studies to accurately assess N dynamic within maize-soybean crop rotation systems.
Data availability statement
The raw data supporting the conclusions of this article will be made available by the authors, without undue reservation.
Author contributions
IP: Conceptualization, Data curation, Formal Analysis, Funding acquisition, Investigation, Project administration, Writing – original draft. VI: Conceptualization, Formal Analysis, Methodology, Writing – review & editing. TM: Conceptualization, Methodology, Supervision, Writing – review & editing.
Funding
The author(s) declare financial support was received for the research and/or publication of this article. This work was supported by the National Council for Scientific and Technological Development (CNPq) under the research grant funding modality (Process: 409789/2016-0).
Acknowledgments
The authors would like to thank to Dr. Augusto G. Araújo and Audilei S. Ladeira (IDR-Paraná) for their invaluable assistance in the field; Dr. Ivan Bordin and Dr. Rafael Fuentes-Llanillo (IDR-Paraná) for their institutional support; and to CENA-USP for their outstanding laboratory analysis.
Conflict of interest
The authors declare that the research was conducted in the absence of any commercial or financial relationships that could be construed as a potential conflict of interest.
Generative AI statement
The author(s) declare that no Generative AI was used in the creation of this manuscript.
Publisher’s note
All claims expressed in this article are solely those of the authors and do not necessarily represent those of their affiliated organizations, or those of the publisher, the editors and the reviewers. Any product that may be evaluated in this article, or claim that may be made by its manufacturer, is not guaranteed or endorsed by the publisher.
References
Alves B. J. R., Zotarelli L., Araújo E. S., Fernandes F. M., Heckler J. C., Medeiros A. F. A., et al. (2005). “N balance in crop rotation under zero-tillage in Dourados, MS,” in Boletim de Pesquisa e Desenvolvimento, 07 (Embrapa Agrobiologia, Seropédica).
Ambrosano E. J., Trivelin P. C. O., Cantarella H., Rossi F., Mendes F. L., Muraoka T., et al. (2011). 15N-labeled nitrogen from green manure and ammonium sulfate utilization by the sugarcane ratoon. Sci. Agric. 68, 361–368. doi: 10.1590/S0103-90162011000300014
Ambrosini V. G., Ciampitti I. A., Fontoura S. M. V., Tamagno S., Moraes R. P., Schwalbert R. A., et al. (2024). Environmental variables controlling biological nitrogen fixation in soybean. Symbiosis 93, 43–55. doi: 10.1007/s13199-024-00988-2
Barbosa J. Z., Ferreira C. F., Santos N. Z., Motta A. C. V., Prior S., and Gabardo J. (2016). Production, carbon and nitrogen in stover fractions of corn (Zea mays L.) in response to cultivar development. Ciênc. Agrote. 40, 665–675. doi: 10.1590/1413-70542016406020316
Barrie A. and Prosser S. J. (1996). “Automated analysis of light-element stable isotopes by isotope ratio mass spectrometry,” in Mass Spectrometry of Soils. Eds. Boutton T. W. and Yamasaki S. (Marcel Dekker, New York), 1–46.
CONAB (2019). Acompanhamento da safra brasileira de grãos, n. 1, v (Brasília, Brazil: Companhia Nacional de Abastecimento).
CONAB (2020). Acompanhamento da safra brasileira de grãos, n. 1, v (Brasília, Brazil: Companhia Nacional de Abastecimento).
CONAB (2025). Acompanhamento da safra brasileira de grãos, n. 6, v (Brasília, Brazil: Companhia Nacional de Abastecimento).
Ding W., Li S., He P., and Huang S. (2019). Contribution and fate of maize residue-15N and urea-15N as affected by N fertilization regime. PloS One 14, e0210176. doi: 10.1371/journal.pone.0210176
Epstein E. and Bloom A. (2006). Nutrição Mineral de Plantas: Princípios e Perspectivas (Londrina: Editora Planta), 403 p.
Esper Neto M., Lara L. M., Oliveira S. M., Santos R. F., Braccini A. L., Inoue T. T., et al. (2021). Nutrient removal by grain in modern soybean varieties. Front. Plant Sci. 12, 615019. doi: 10.3389/fpls.2021.615019
FAOSTAT (2025). Food and Agriculture Organization of the United Nations (Rome, Italy: FAOSTAT Statistical Database). Available online at: https://www.fao.org/faostat/en/#data/QCL/visualize.
Farhangi-Abriz S. and Torabian S. (2018). Biochar improved nodulation and nitrogen metabolism of soybean under salt stress. Symbiosis 74, 215–223. doi: 10.1007/s13199-017-0509-0
Ferreira A. O., Sá J. C. M., Briedis C., and Figueiredo A. G. (2009). Desempenho de genótipos de milho cultivados com diferentes quantidades de palha de aveia-preta e doses de nitrogênio. Pesq. Agropec. Bras. 44, 173–179. doi: 10.1590/S0100-204X2009000200009
Ferreira D. F. (2019). Sisvar: a computer analysis system to fixed effects split plot type designs. Rev. Bras. Biom. 37, 529–535. doi: 10.28951/rbb.v37i4.450
Filippi D., Denardin L. G. O., Ambrosini V. G., Alves L. A., Flores J. P. M., Martins A. P., et al. (2021). Concentration and removal of macronutrients by soybean seeds over 45 years in Brazil: a meta-analysis. Rev. Bras. Cienc. Solo 45, e0200186. doi: 10.36783/18069657rbcs20200186
Fuentes-Llanillo R., Telles T. S., Soares Junior D., Melo T. R., Friedrich T., Kassam A., et al. (2021). Expansion of no-tillage practice in conservation agriculture in Brazil. Soil Tillage Res. 208, 104877. doi: 10.1016/j.still.2020.104877
Gava G. J. C., Oliveira M. W., Silva M. A., Jerônimo E. M., Cruz J. C. S., and Trivelin P. C. O. (2010). Phytomass production and nitrogen accumulation in maize cultivated with different doses of 15N-urea. Semina Cienc. Agrar. 31, 851–862. doi: 10.5433/1679-0359.2010v31n4p851
Gava G. J. C., Trivelin P. C. O., Oliveira M. W., Heinrichs R., and Silva M. A. (2006). Balanço do nitrogênio da ureia (15N) no sistema solo-planta na implantação da semeadura direta na cultura do milho. Bragantia 65, 477–486. doi: 10.1590/S0006-87052006000300014
Govindasamy P., Muthusamy S. K., Bagavathiannan M., Mowrer J., Jagannadham P. T. K., Maity A., et al. (2023). Nitrogen use efficiency—a key to enhance crop productivity under a changing climate. Front. Plant Sci. 14, 1121073. doi: 10.3389/fpls.2023.1121073
Havlin J. L., Beaton J. D., Tisdale S. L., and Nelson W. L. (2005). Soil fertility and fertilizers: an introduction to nutrient management. 7th ed (Upper Saddle River, NJ: Pearson Prentice Hall).
Hawkesford M. J., Cakmak I., Coskun D., De Kok L. J., Lambers H., Schjoerring J. K., et al. (2023). “Functions of macronutrients,” in Marschner’s Mineral Nutrition of Plants, 4th ed. Eds. Rengel Z., Cakmak I., and White P. J. (London, United Kingdom: Academic Press), 201–281.
Herridge D. F., Peoples M. B., and Boddey R. M. (2008). Global inputs of biological nitrogen fixation in agricultural systems. Plant Soil 311, 1–18. doi: 10.1007/s11104-008-9668-3
Hungria M., Campo R. J., and Mendes I. C. (2001). Biological nitrogen Fixation with the soybean crop (Londrina: Embrapa Soja), 48 p. Circular Técnica Embrapa Soja, 35/Circular Técnica Embrapa Cerrados, 13.
Hungria M., Franchini J. C., Campo R. J., Crispino C. C., Moraes J. Z., Sibaldelli R. N. R., et al. (2006). Nitrogen nutrition of soybean in Brazil: Contributions of biological N2 fixation and N fertilizer to grain yield. Can. J. Plant Sci. 86, 927–939. doi: 10.4141/P05-098
Hungria M. and Mendes I. C. (2015). “Nitrogen fixation with soybean: the perfect symbiosis?,” in Biological Nitrogen Fixation, vol. 2 . Ed. de Bruijn F. (John Wiley & Sons, Inc., New Jersey), 1005–1019.
Kuzyakov Y., Friedel J. K., and Stahr K. (2000). Review of mechanisms and quantification of priming effects. Soil Biol. Biochem. 32, 1485–1498. doi: 10.1016/S0038-0717(00)00084-5
Lal R. (2020). Soil organic matter content and crop yield. J. Soil Water Conserv. 75, 27A–32A. doi: 10.2489/jswc.75.2.27A
Louarn G., Edouard S., Barre P., Julier B., and Gastal F. (2024). The older the better? Delayed complementarity, overyielding, and improved residue composition in ageing alfalfa-fescue mixtures. Plant Soil 499, 553–567. doi: 10.1007/s11104-024-06479-z
Luo L., Kondo M., and Itoh S. (2004). Fate of 15N derived from composts and urea in soils under different long-term N management in pot experiments. Compost Sci. Util. 12, 18–24. doi: 10.1080/1065657X.2004.10702153
Malavolta E., Vitti G. C., and Oliveira S. A. (1997). Avaliação do Estado Nutricional das Plantas: Princípios e Aplicações. 2nd ed (Piracicaba: Associação Brasileira para Pesquisa da Potassa e do Fosfato).
Nitsche P. R., Caramori P. H., Ricce W. S., and Pinto L. F. D. (2019). Atlas Climático do Estado do Paraná (Londrina: Instituto Agronômico do Paraná).
Passos A. M. A., Alvarenga R. C., and Santos F. C. (2018). “Sistema de plantio direto,” in Agricultura de Baixo Carbono: Tecnologias e Estratégias de Implantação. Eds. Nobre M. M. and Oliveira I. R. (Embrapa, Brasília).
Pauletti V. and Motta A. C. V. (2019). Manual de Adubação e Calagem para o Estado do Paraná. 2nd ed (Curitiba: Sociedade Brasileira de Ciência do Solo).
Quan Z., Li S., Zhang X., Zhu F., Li P., Sheng R., et al. (2020). Fertilizer nitrogen use efficiency and fates in maize cropping system across China: Field 15N tracer studies. Soil Tillage Res. 197, 104498. doi: 10.1016/j.still.2019.104498
Ramos F. T., Dores E. F. G. C., Weber O. L. S., Beber D. C., Campelo J. H. Jr., and Maia J. C. S. (2018). Soil organic matter doubles the cation exchange capacity of tropical soil under no-till farming in Brazil. J. Sci. Food Agric. 98, 3595–3602. doi: 10.1002/jsfa.8881
Santos H. G., Jacomine P. K. T., Anjos L. H. C., Oliveira V. A. V., Lumbreras J. F., Coelho M. R., et al. (2018). Sistema Brasileiro de Classificação de Solos. 5th ed (Brasília: Embrapa).
Sapkota T. B., Mazzoncini M., Bàrberi P., Antichi D., and Silvestri N. (2012). Fifteen years of no till increase soil organic matter, microbial biomass and arthropod diversity in cover crop-based arable cropping systems. Agron. Sustain. Dev. 32, 853–863. doi: 10.1007/s13593-011-0079-0
Schoninger E. L., Villalba H. A. G., Bendassolli J. A., and Trivelin P. C. O. (2018). Corn grain yield and 15N-fertilizer recovery as a function of urea sidedress timing. An. Acad. Bras. Ciênc. 90, 3299–3312. doi: 10.1590/0001-3765201820170432
Silva E. C., Buzetti S., Guimarães G. L., Lazarini E., and Sá M. E. (2005). Rates and timing of nitrogen application in corn under no-tillage on a red latosol. Rev. Bras. Ciênc. Solo 29, 353–362. doi: 10.1590/S0100-06832005000300005
Silva E. C., Muraoka T., Buzetti S., Veloso M. E. C., and Trivelin P. C. O. (2006). Absorption of soil native nitrogen by corn under no-tillage in succession to cover crops. Rev. Bras. Ciênc. Solo 30, 723–732. doi: 10.1590/S0100-06832006000400013
Silva E. C., Muraoka T., Villanueva F. C. A., and Espinal F. S. C. (2009). Nitrogen utilization by corn as affected by green manures and nitrogen and phosphorus fertilizers. Pesqui. Agropecu. Bras. 44, 118–127. doi: 10.1590/S0100-204X2009000200002
Singh R. K., Sreenivasulu N., and Prasad M. (2022). Potential of underutilized crops to introduce the nutritional diversity and achieve zero hunger. Funct. Integr. Genomics 22, 1459–1465. doi: 10.1007/s10142-022-00898-w
Souza W. J. O. and Melo W. J. (2000). Teores de nitrogênio no solo e nas frações da matéria orgânica sob diferentes sistemas de produção de milho. Rev. Bras. Ciênc. Solo 24, 885–896. doi: 10.1590/S0100-06832000000400020
Sun Z. and Zhu B. (2022). Rethinking discrepancies between difference and 15N methods for estimating fertilizer nitrogen recovery. Biol. Fertil. Soils 58, 855–869. doi: 10.1007/s00374-022-01672-7
Taiz L., Zeiger E., Møller I. M., and Murphy A. (2017). Fisiologia e desenvolvimento vegetal (Porto Alegre: Artmed).
Teixeira P. C., Donagemma G. K., Fontana A., and Teixeira W. G. (2017). Manual de métodos de análise de solo. 3rd (Brasília: Embrapa).
Teixeira W. F., Fagan E. B., Soares L. H., Soares J. N., Reichardt K., and Dourado-Neto D. (2018). Seed and foliar application of amino acids improve variables of nitrogen metabolism and productivity in soybean crop. Front. Plant Sci. 9, 396. doi: 10.3389/fpls.2018.00396
Tiecher T., Calegari A., Caner L., and Rheinheimer D. S. (2017). Soil fertility and nutrient budget after 23-years of different soil tillage systems and winter cover crops in a subtropical Oxisol. Geoderma 308, 78–85. doi: 10.1016/j.geoderma.2017.08.028
Unkovich M., Pate J., McNeill A., and Gibbs D. J. (2001). Stable Isotope Techniques in the Study of Biological Processes and Functioning of Ecosystems (Dordrecht: Kluwer Academic Publishers), 289 p.
Veloso M. E. C., Duarte S. N., Dourado-Neto D., Silva E. C., and Blanco F. F. (2010). “Produtividade de palha, teor de N total na palha e nos grãos de milho cultivado sob diferentes doses de N em solo de várzea,” in Reunião Brasileira de Manejo e Conservação do Solo e da Água, vol. 18. (Sociedade Brasileira de Ciência do Solo, Teresina), 1–4.
Xing Y., Jiang W., He X., Fiaz S., Ahmad S., Lei X., et al. (2019). A review of nitrogen translocation and nitrogen-use efficiency. J. Plant Nutr. 42, 2624–2641. doi: 10.1080/01904167.2019.1656247
Keywords: crop residues, 15N, isotopes, Zea mays L., Glycine max L.
Citation: Bruno IP, Franzini VI and Muraoka T (2025) Contribution of maize crop residues and fertilization to nitrogen nutrition of soybean grown under no-tillage system. Front. Agron. 7:1621756. doi: 10.3389/fagro.2025.1621756
Received: 01 May 2025; Accepted: 22 July 2025;
Published: 20 August 2025.
Edited by:
Ioannis Roussis, Agricultural University of Athens, GreeceReviewed by:
Carmen Arena, University of Naples Federico II, ItalyP. Sivasakthivelan, Annamalai University, India
Marta Jańczak-Pieniążek, University of Rzeszow, Poland
Copyright © 2025 Bruno, Franzini and Muraoka. This is an open-access article distributed under the terms of the Creative Commons Attribution License (CC BY). The use, distribution or reproduction in other forums is permitted, provided the original author(s) and the copyright owner(s) are credited and that the original publication in this journal is cited, in accordance with accepted academic practice. No use, distribution or reproduction is permitted which does not comply with these terms.
*Correspondence: Isabeli Pereira Bruno, aXNhYmVsaWJydW5vQGdtYWlsLmNvbQ==