 Kulpreet Singh1†
 Lakesh Sharma
 Hardeep Singh
- 1West Florida Research and Education Center, Agronomy Department, University of Florida, Jay, FL, United States
- 2Soil, Water, and Ecosystem Sciences Department, University of Florida, Gainesville, FL, United States
Ammonia (NH3) volatilization is a significant pathway for nitrogen (N) loss. The acidic, sandy soils of Florida offer ideal conditions for NH3 losses in rainfed cotton production systems. To assess NH3 losses under various N placement methods and rates, the experiment was conducted in 2023 and 2024 using a randomized complete block design with four replications. The study employed two placement methods: surface broadcasting and subsurface banding, and two N rates: 67.5 and 102 kg N/ha. Ammonia emissions were measured using open-chamber traps, with sampling conducted multiple times per week. Daily NH3 emissions (g/ha/day) were averaged over each week, and cumulative emissions (g/ha) were calculated by summing weekly averages across the sampling period. These cumulative values were then used to estimate total NH3-N losses, expressed as a percentage of the total N applied. Sampling weeks were referenced as WAF (weeks after fertilization) to standardize timing across both years. Results indicated that both daily and cumulative NH3; emissions were significantly higher with subsurface banding compared to surface broadcasting, leading to greater N-NH3; losses under banding. In addition, neither placement method nor N rate significantly influenced cotton lint yield. These findings suggest that, under the conditions of this study, subsurface banding increased NH3 volatilization losses in rainfed cotton grown on sandy soils in Florida.
1 Introduction
Global agricultural production has increased over the past century, along with the increased use of nitrogen (N) fertilizers (FAO, 2020). The increased use of N fertilizers has led to higher N losses through ammonia (NH3) volatilization, nitrate leaching, and nitrous oxide emissions, resulting in harmful environmental impacts (Stark and Richards, 2008). These losses can result in lower nitrogen use efficiency (NUE). According to Delgado (2002), global NUE ranges between 33% and 50%, and unaccounted N can be more than $15 billion, resulting in high economic losses. Lower NUE indicates higher N losses, and NH3 volatilization is a major concern, as more than 60% of applied N can be lost through volatilization (Rochette et al., 2013). However, N fertilizer placement can improve NUE by reducing N losses and enhancing N conservation in soil (Reiter et al., 2008; Li et al., 2018; McClanahan et al., 2020; Singh et al., 2023).
Surface application, such as broadcasting, exposes fertilizers to rapid volatilization due to greater NH3 diffusion into the atmosphere (Götze et al., 2023). In contrast, subsurface banding is reported to reduce volatilization losses by increasing NH4+ retention and limiting NH3 escape (Nkebiwe et al., 2016). Previous studies have demonstrated that banded N remains available to crops for a longer duration and enhances fertilizer use efficiency compared to broadcast applications (Canatoy et al., 2024). The field studies have reported one to nine times lower NH3 losses under subsurface banding of fertilizer compared to surface broadcasting (Bouwman et al., 2002; Prasertsak et al., 2002). However, several studies have reported contradicting results showcasing higher NH3 losses under subsurface band than surface broadcasting (Rochette et al., 2009a, 2009b).
Ammoniacal N fertilizers, such as urea, undergo conversion to NH4+ and nitrate to be available for plant uptake, a process that begins with urease enzyme-mediated hydrolysis in the soil (Wang et al., 2014, Motasim et al., 2024). The hydrolysis process is facilitated by the consumption of H+ ions from the soil, resulting in an increase in soil pH in the vicinity of applied urea (Harty et al., 2023). Increasing soil pH can increase NH3 concentration and, thus, increased NH3 volatilization. However, the changes in pH depend on soil buffering capacity and concentration of NH3 source in soil, influencing the emissions (Rochette et al., 2009a; Harty et al., 2023). The banding of a large amount of N can result in a higher soil pH and may lead to increased NH3 volatilization, especially in soils with low buffering capacity (Rochette et al., 2009a). Therefore, the efficiency of placement methods to improve NH3 volatilization depends on soil properties and microbial activity.
In the Florida Panhandle, sandy-textured soils combined with low pH result in a very low buffering capacity, making the soil highly susceptible to pH changes following N fertilization. Surface broadcasting of N fertilizers, a common practice among farmers in this region, often leads to substantial NH3 volatilization losses, particularly under the humid environmental conditions prevalent in the Panhandle. Among commonly used fertilizers, urea is especially prone to such losses when left exposed on the soil surface. Given these challenges and mixed effect of subsurface band in literature, there is a critical need to evaluate subsurface banding NH3 volatilization under these conditions as an alternative placement method. Therefore, we conducted a two-year field study to assess the effectiveness of subsurface banding compared to surface broadcasting in reducing NH3 emissions. We hypothesized that subsurface banding would reduce the NH3 emissions compared to surface broadcasting.
2 Materials and methods
2.1 Experiment site and materials
Field experiments were conducted in 2023 and 2024 at the University of Florida/IFAS West Florida Research and Extension Center, Jay, FL (30°46′34.5″N, 87°08′15.9″W). Although both trials were conducted at the same research station, they were established in different fields each year to accommodate spatial variability and maintain consistent rotation practices across the station. Soil at the experimental site was a Red Bay fine sandy loam (fine-loamy, kaolinitic, thermic Rhodic Kandiudults) with 0 to 2% slope. The soil properties for both study years are listed in Table 1. For 2023, soil pH was 6.4 and CEC was 7.5 cmol/kg, and for 2024, soil pH was 6.3 and CEC was 8.8 cmol/kg. The minor differences in initial soil pH and CEC between years reflect this inherent variability across field locations within the research station. Weather data during the study were collected from stations operated by the Florida Automated Weather Network, located within 1 km of the experimental site. The field was disked, leveled with a field cultivator, and strip-tilled before planting. Cotton was planted at a seed rate of 89,700 seeds/ha with 91 cm row spacing in 7.62 m × 3.65 m plots using Monosem planter (Monosem NG Plus, A.T.I. Inc., Kansas). Pre-plant soil samples (0–0.30 m depth) were taken in March for both years and were sent to Waters Lab, Camilla, GA, for analysis using Mehlich 3 method (Ziadi and Tran, 2007). Basal fertilizers were applied using Waters lab recommendation, excluding N.
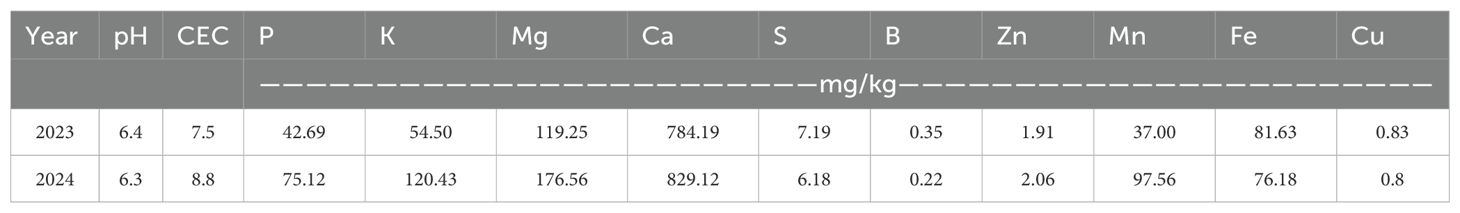
Table 1. Soil properties across 0-30 cm depth in 2023 and 2024 at the study site.
2.2 Experimental design and treatments
The experiment followed a randomized complete block design with a 2 × 2 factorial arrangement and four replications. The treatments consisted of two N application rates (67.5 kg N/ha and 102 kg N/ha) and two N placement methods (surface broadcast and subsurface banding). Urea (46-0-0) (Nutrien Ag., Loveland, CO) was applied in two splits: 33.3% at emergence (3 weeks after planting) and 66.6% before the pinhead growth stage (6–7 weeks after planting). Urea was applied using a Gandy spreader (Gandy Company, Owatonna, MN) for broadcast treatments and a band applicator (First Products, Tifton, GA) for subsurface banding (at >5 cm depth). The depth below 5 cm represents the subsurface banding practice adapted at our research site to ensure soil coverage of fertilizer. Other than that, literature highlights depths above 5 cm as the optimum depth to decrease the diffusion of NH3 into the atmosphere (Canatoy et al., 2024). Ammonia traps were deployed before each fertilizer application.
2.3 Ammonia measurement
Ammonia sampling was conducted using open-chamber traps as described by Jantalia et al. (2012). These traps, placed between the second and third rows of cotton, consisted of cotton wicks soaked in sulfuric acid to capture NH3. The wicks and containers were replaced at each sampling to ensure accurate measurements. To protect the traps from rainfall and maintain sampling consistency, each trap was covered by attaching the bottom half of a plastic bottle over the top of the chamber (Supplementary Figure 1). Following rainfall events, any wet traps were promptly replaced with dry ones to minimize sampling bias and ensure data reliability. Each collected sample was analyzed for NH3 concentration using a phenol-hypochlorite assay, which measured absorbance at 630 nm using a spectrometer (Thermo Fisher Scientific, Waltham, MA). A standard curve was generated using predetermined concentrations of NH3-N ranging from 0 to 8 mM, and absorbance values were plotted against millimolar concentrations of NH3-N. The relationship between absorbance (y) and NH3-N concentration in millimolar (x) was described by the linear regression Equation 1:
This equation was used to convert absorbance values to NH3-N concentration (mM) which was converted to milligrams (mg). The trap area (0.01008 m²) was used to calculate the amount of fertilizer (mg) applied in that specific area.
Sampling was done over multiple days in a week, and daily NH3 emissions (g/ha/day) were averaged over weeks. Averaging daily values helped reduce variability caused by day-to-day fluctuations in weather conditions, thereby improving data interpretability and allowing for clearer comparisons across treatments. However, this conservative approach may have limited the detection of short-term emission peaks that could occur immediately following fertilization or rainfall events. Despite this limitation, the method aligned with our primary objective of assessing broader emission trends under different N management practices.
Daily NH3 emissions over weeks were summed to calculate cumulative NH3 emissions (g/ha). These cumulative NH3 emissions were used to determine total NH3-N losses (%) as percentage loss of total applied N. In this study, “NH3 emissions” represents the emission loss on a weekly basis from the treatments, whereas “NH3-N loss” represents the percentage of N applied which was lost as NH3.
In 2023, samples were taken at 1, 2, 3, 4, and 5 weeks after fertilization (WAF). In 2024, samples were collected at 1, 2, 3, 4, 5, 6, 7, 8, and 9 WAF. The WAF represents weeks after the first application. Sampling was continued after the second application in both years. In 2023, the second application was done at 3 WAF, whereas, in 2024, it was done at 4 WAF.
2.4 Lint yield estimation
Seed cotton yield was estimated by harvesting two non-border rows with a two-row John Deere cotton picker (John Deere, Moline, IL). Seed cotton subsample (300 g) was ginned using a micro-gin to determine lint turnout (%), which was then used to estimate lint yield.
2.5 Data analysis
Data was analyzed using the lmer (Nagle, 2018), agricolae (Kozak, 2020), and doebioresearch packages in R Studio (v 4.2.2) (R Core Team, 2021). A generalized linear mixed-effects model was employed, incorporating blocks and years as random effects and N placement methods and rates and their interaction as fixed effects. The data was assessed for constant variance using the Levene test and normality using the Shapiro-Wilk test, with log transformations applied when assumptions were violated. Treatment means were separated using the Tukey test at 95% significance level (p ≤ 0.05). Graphs were designed using the ggplot2 package in R studio (Wickham and Sievert, 2009).
3 Result and discussion
3.1 Daily and cumulative ammonia emissions, and total N-NH3 loss (%)
For 2023, there was no significant difference in daily NH3 emissions between the treatments at any time point (Figure 1A) (p = 0.81). The highest emissions were observed after the application of second fertilizer split (at 3 WAF) for all the treatments (Figure 1A). In 2023, fertilizer application was followed by heavy rainfall at both, which might have resulted in leaching down of N and resulted in no significant differences (Figure 2). However, in 2024, there was a significant effect of placement method on emissions (Figure 1B). Daily emissions were significantly higher under subsurface banding at 1 WAF (772 g/day/ha) as compared to surface broadcast (392 g/day/ha) (p = 0.028). However, there was no difference between daily emissions at any other time point. At 1 WAF, the first split was followed by a small amount of rain and dry period, which might have helped in the accumulation of NH3 emissions. However, the second application was followed by constant rain, which might have resulted in leaching of N (Figure 2).
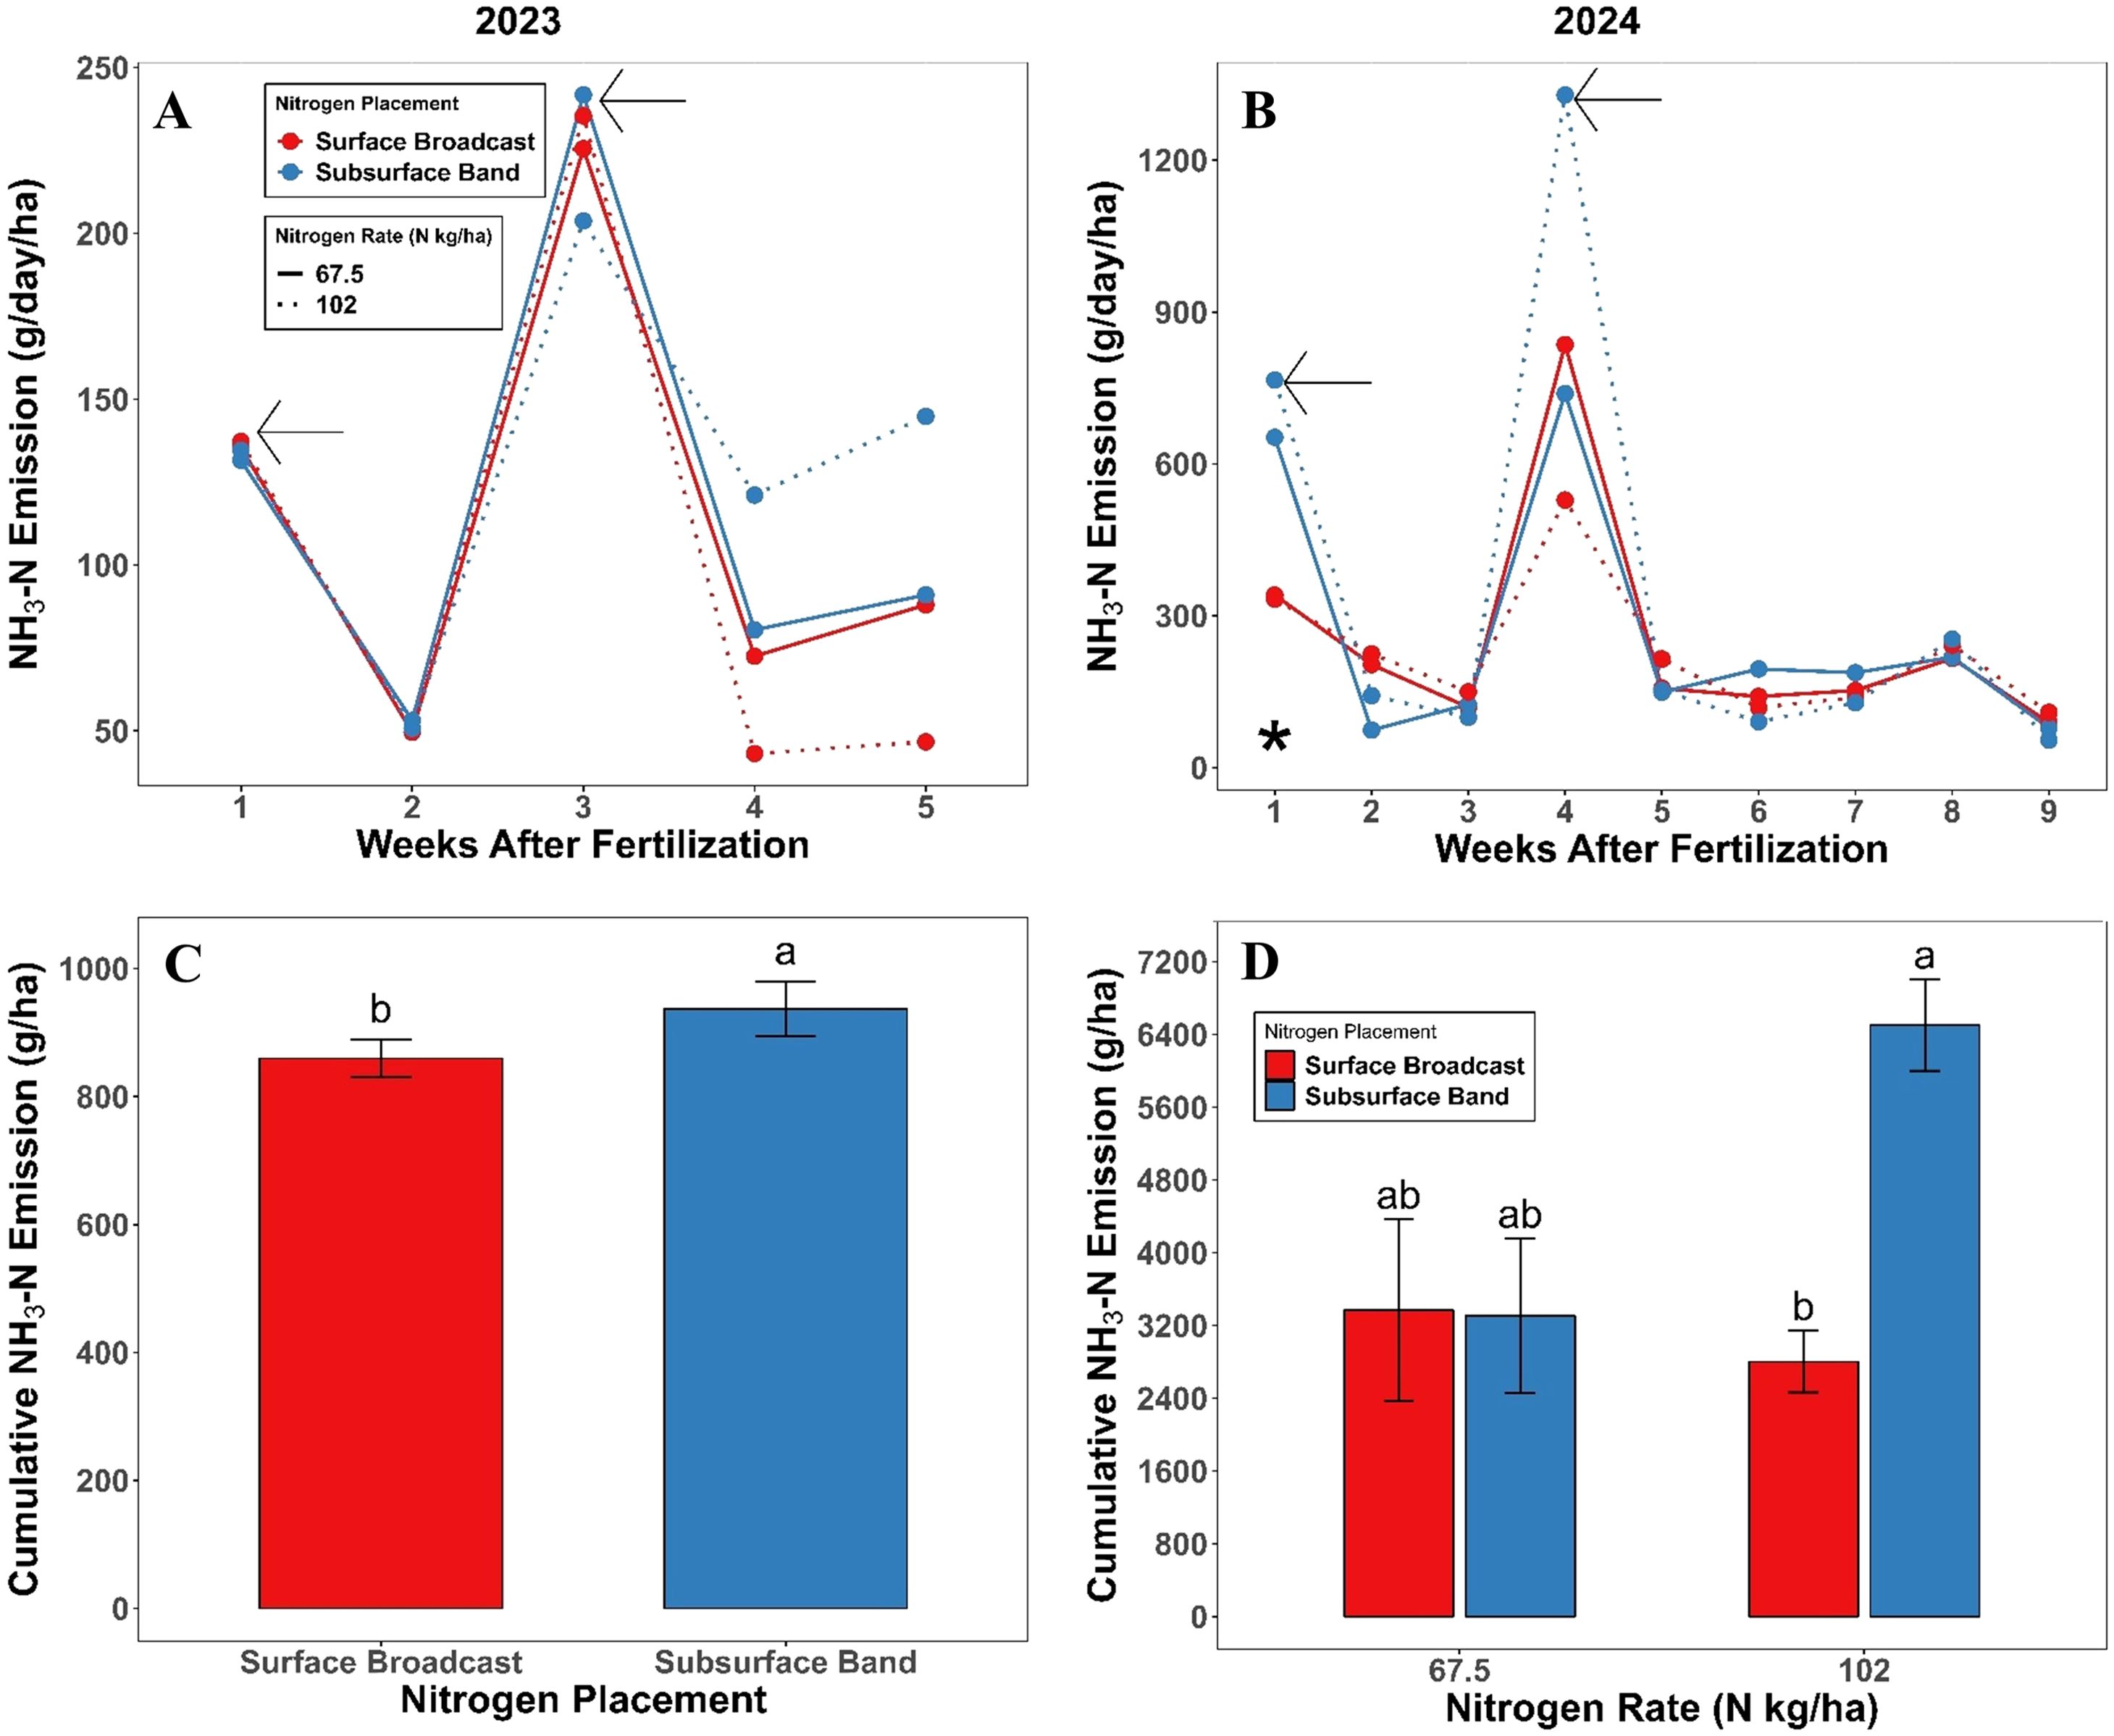
Figure 1. (A) Daily ammonia emissions from surface broadcast and subsurface band placement of urea at the rate of 67.5 and 102 kg N/ha in 2023. The arrow at 1 week after fertilization (WAF) represents the first split (33.33% of total nitrogen) application and arrow at 3 WAF indicates the second split (66.66% of total nitrogen) of fertilization. (B) Daily ammonia emissions from surface broadcast and subsurface band placement of urea at the rate of 67.5 and 102 kg N/ha in 2024. The arrows in B at 1 and 4 WAF represent first and second split of fertilization, respectively. (C) effect of placement method on cumulative ammonia emissions in 2023. (D) Interaction effect of placement method and nitrogen rates on cumulative ammonia emissions in 2024. Means followed by different letters in C and D represents significant differences between treatments at p <0.05. The asterisk "*" sign in B indicate that the ammonia emissions were significantly different at that time point.
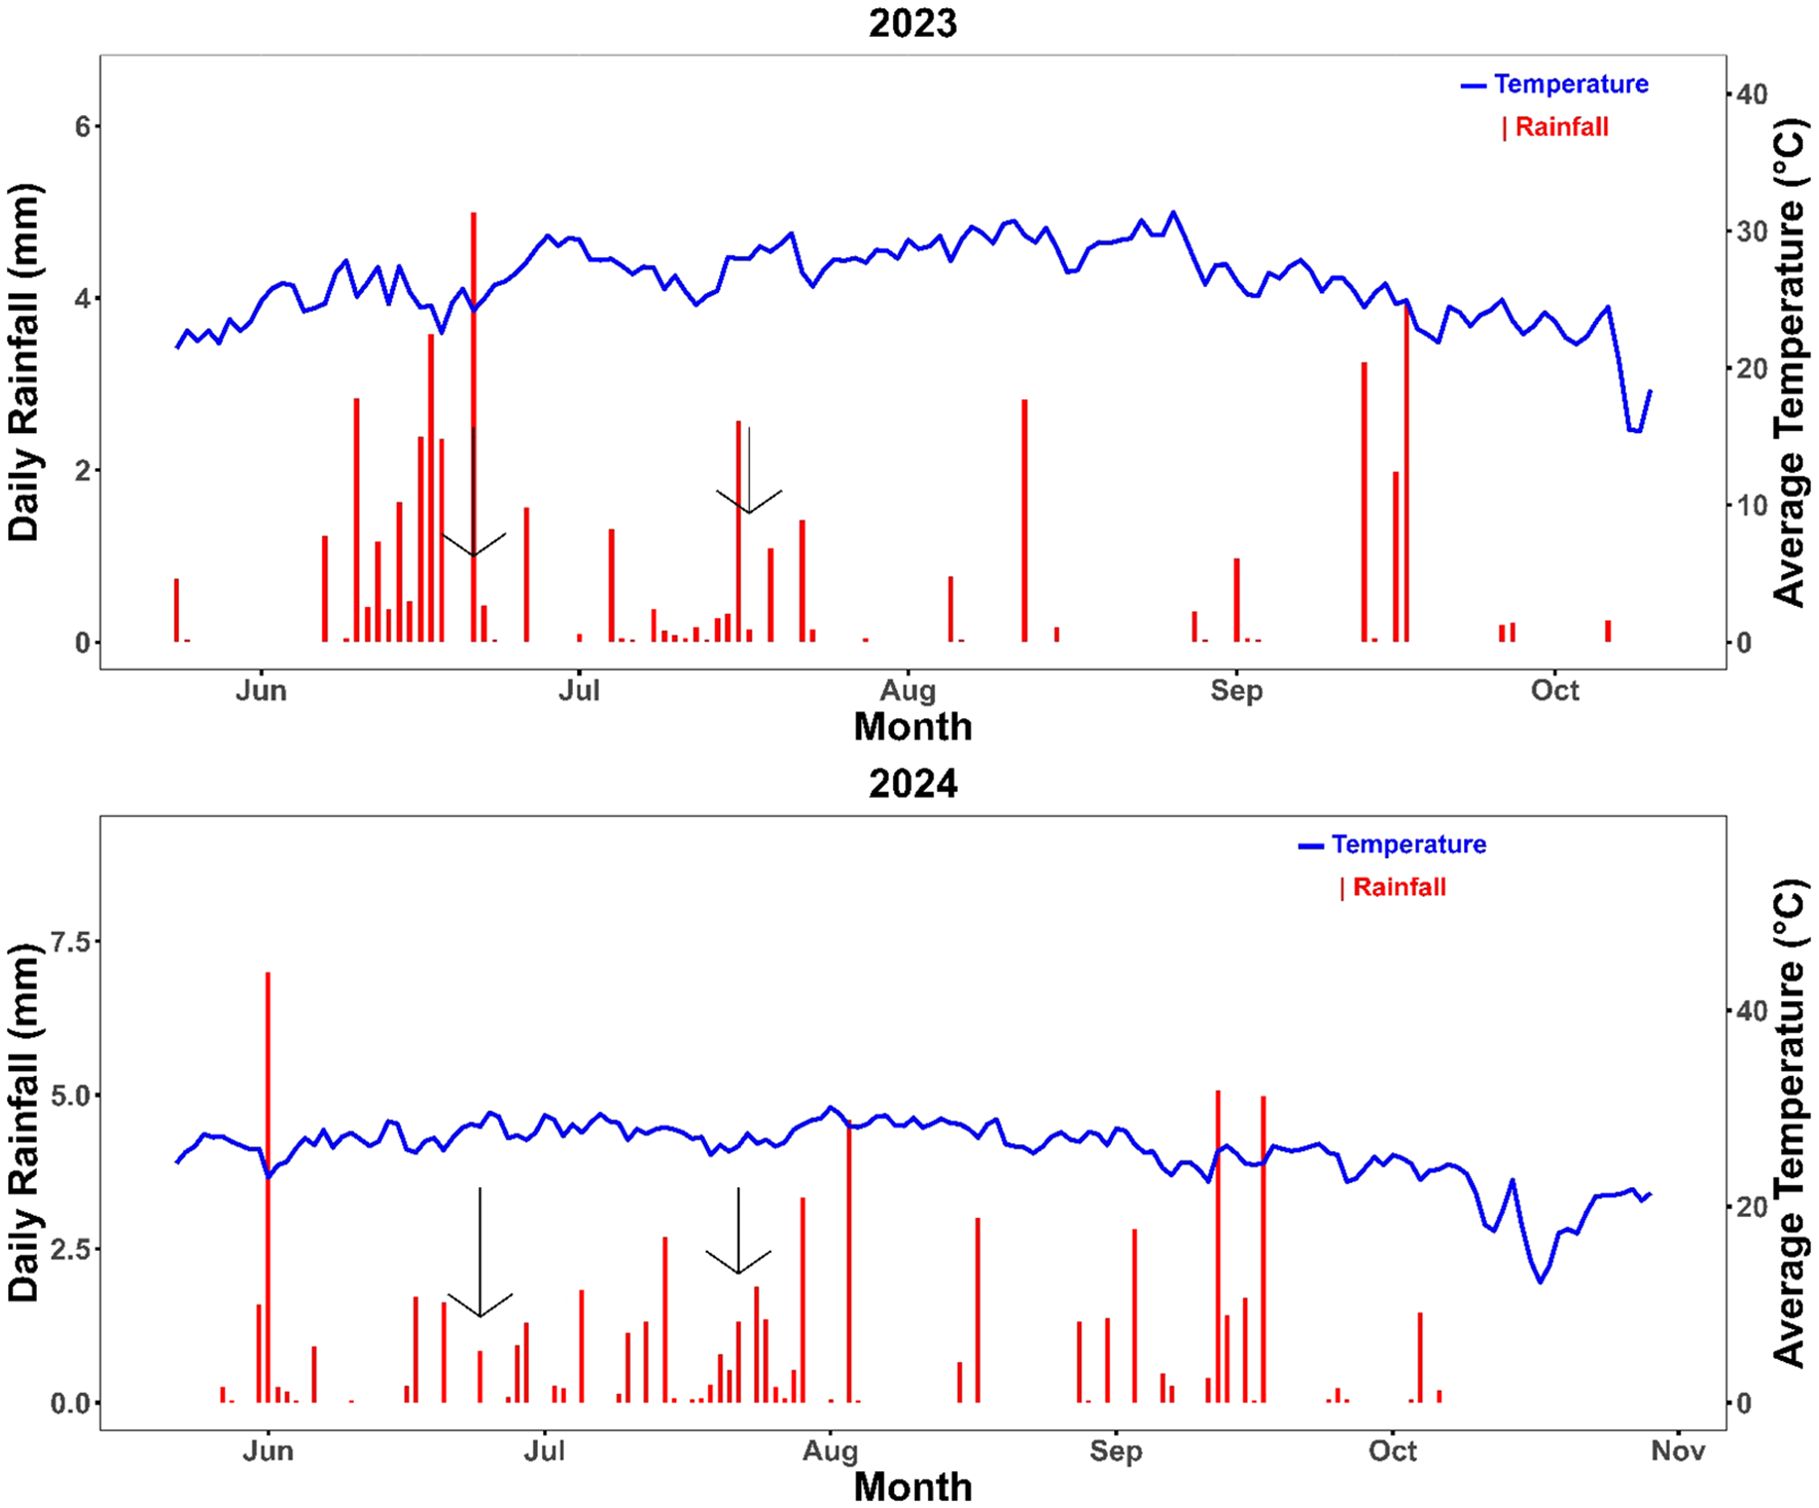
Figure 2. Daily rainfall and average temperature data for years 2023 and 2024 throughout the study period. The arrows indicate the dates when fertilizers were applied.
In 2023, a significant effect of the placement method on cumulative NH3 emissions was observed (Figure 1C) (p = 0.01). The subsurface band resulted in significantly higher cumulative emissions (932 g/ha) compared to surface broadcast (860 g/ha) across both rates. In 2024, the interaction effect was observed on cumulative NH3 emissions (Figure 1D) (p = 0.001). At 67.5 kg N/ha, there was no difference between the placement methods; however, surface broadcast resulted in reduced cumulative NH3 emissions (2802 g/ha) at higher N rate (102 kg N/ha) than subsurface band (6502 g/ha).
Results from the current study indicate that the subsurface band was unable to reduce daily NH3; emissions and cumulative NH3; emissions compared to surface broadcast, which is contradictory to previous findings by Huijsmans et al. (2001); Bittman et al. (2005), and Pfluke et al. (2011). These studies reported that the subsurface band can reduce diffusion of NH3 into the atmosphere by creating resistance or by reducing the surface area exposed to the atmosphere in surface band. However, NH3 volatilization is influenced by the complex interactions among soil properties, the urease enzyme, placement method, and N rates. Surface broadcasting distributes fertilizer across a wider soil area, leading to lower localized concentrations. In contrast, subsurface banding concentrates urea in a narrow zone, resulting in higher N concentration and more intense pH increases in the surrounding soil (Rochette et al., 2009b; Tewolde et al., 2023). As mentioned earlier, the low buffering capacity of sandy soil can lead to higher soil pH under the subsurface band, resulting in higher NH3 emissions and higher N-NH3 losses. Under the sandy loam texture of acidic soils at research site, this localized pH spike can intensify NH3; volatilization. This effect appeared more prominent at the higher N rate (102 kg N/ha), where subsurface banding resulted in 132% increase in NH3; emissions compared to surface broadcast (Figure 1D). This interaction observed between placement and rate may therefore be attributed to the compounded effect of high N concentration and limited pH buffering in the band zone, amplifying NH3; losses under banded applications at higher rates (Figure 3).
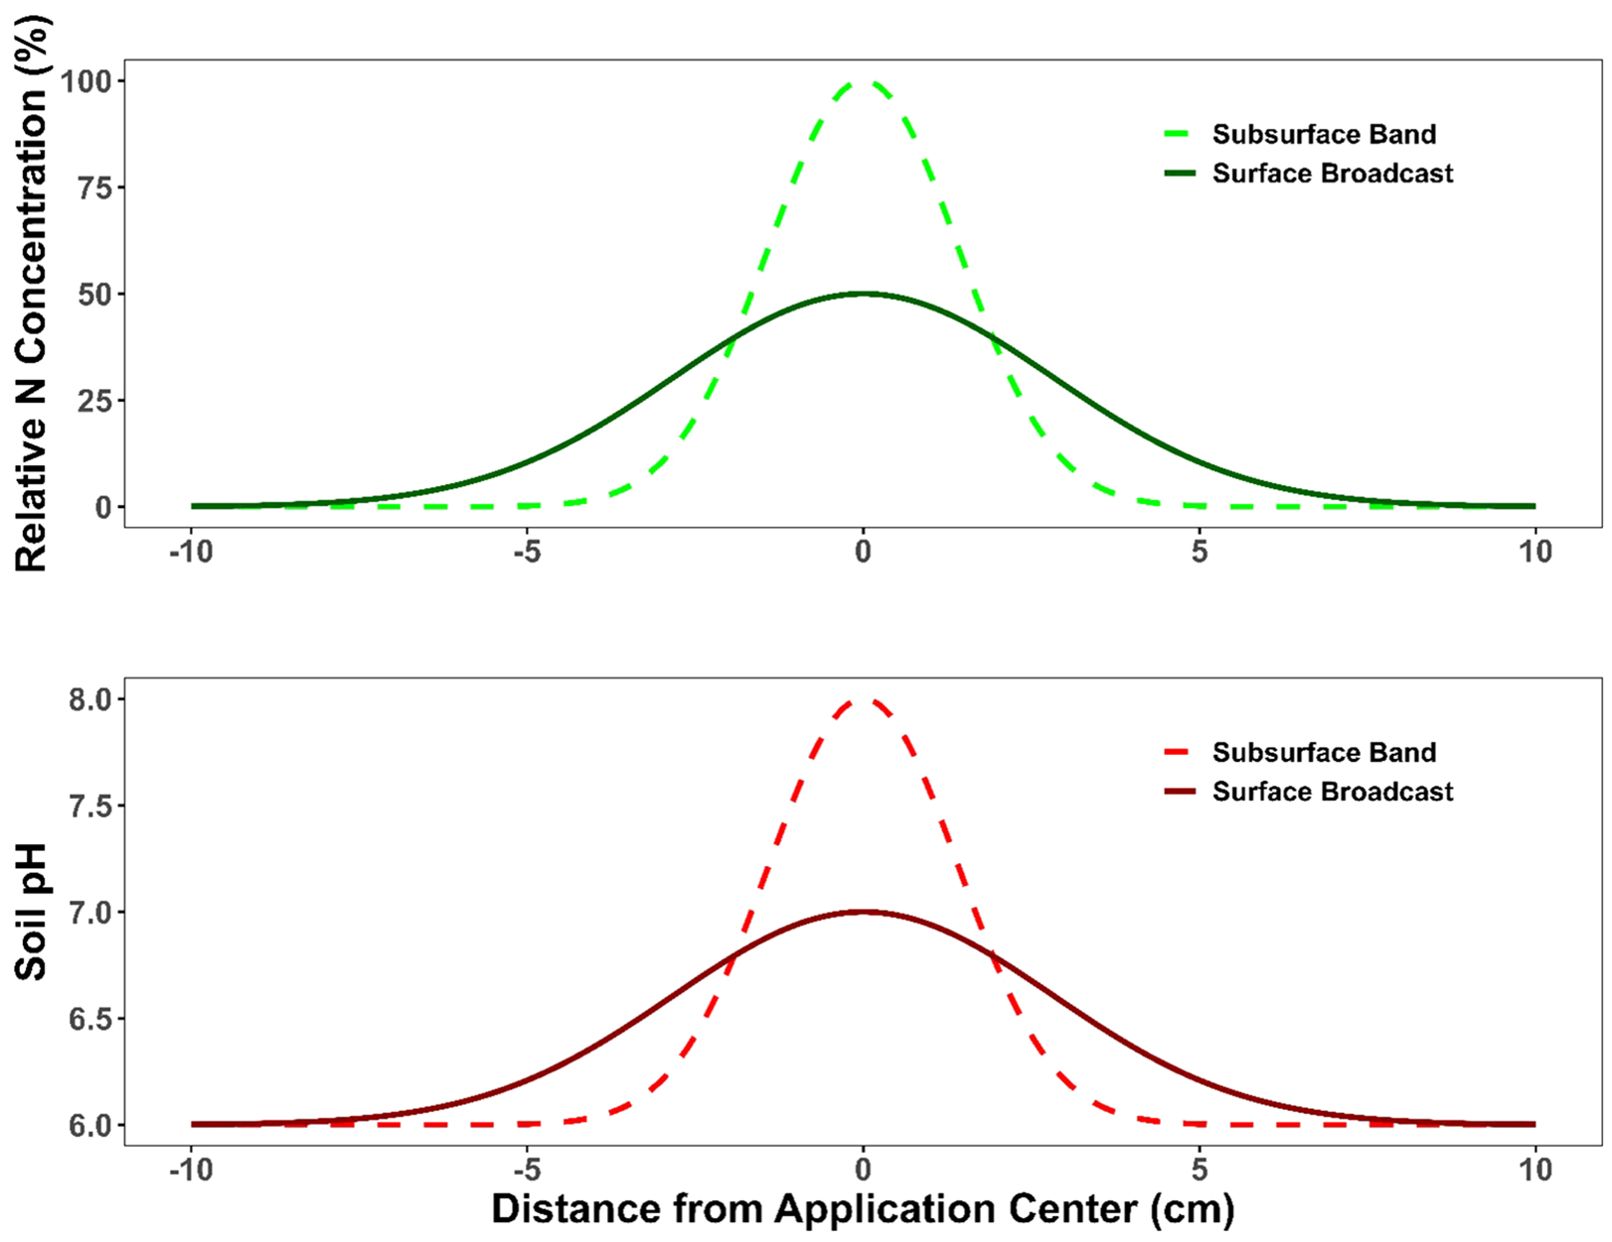
Figure 3. Conceptual illustration of relative N concentration and soil pH changes around subsurface band (dashed) and surface broadcast (solid) applications in sandy soils. Subsurface banding creates higher localized N and pH spikes than surface broadcasting.
A significant effect of the placement methods was observed for total N-NH3 loss (%) across 2023 and 2024 (p< 0.001) (Figure 4A). The subsurface band resulted in a significantly higher N loss (4.9%) compared to surface broadcast (3.1%). The NH3-N losses were very low in general in the current study, which can be attributed to acidic nature soil, favoring NH4+ than NH3 (Harty et al., 2023). The higher NH3-N losses under subsurface band can be explained by a higher concentration of N in bands. Our study focused on cotton production with 91-cm row spacing, resulting in a higher concentration of urea (g m-1 of the band) in bands to compensate for the large row spacing (Rochette et al., 2009b) which might have resulted in higher NH3-N losses (%). Similarly, Rochette et al. (2009b) reported higher NH3 concentration and emissions with band application of urea than surface broadcasting. The authors also reported an increase in pH from 6.0 to 8.7 upon band application. From the results of the current study, we can infer that surface broadcasting is more efficient in managing NH3 losses at higher N rates than subsurface banding on sandy soils.
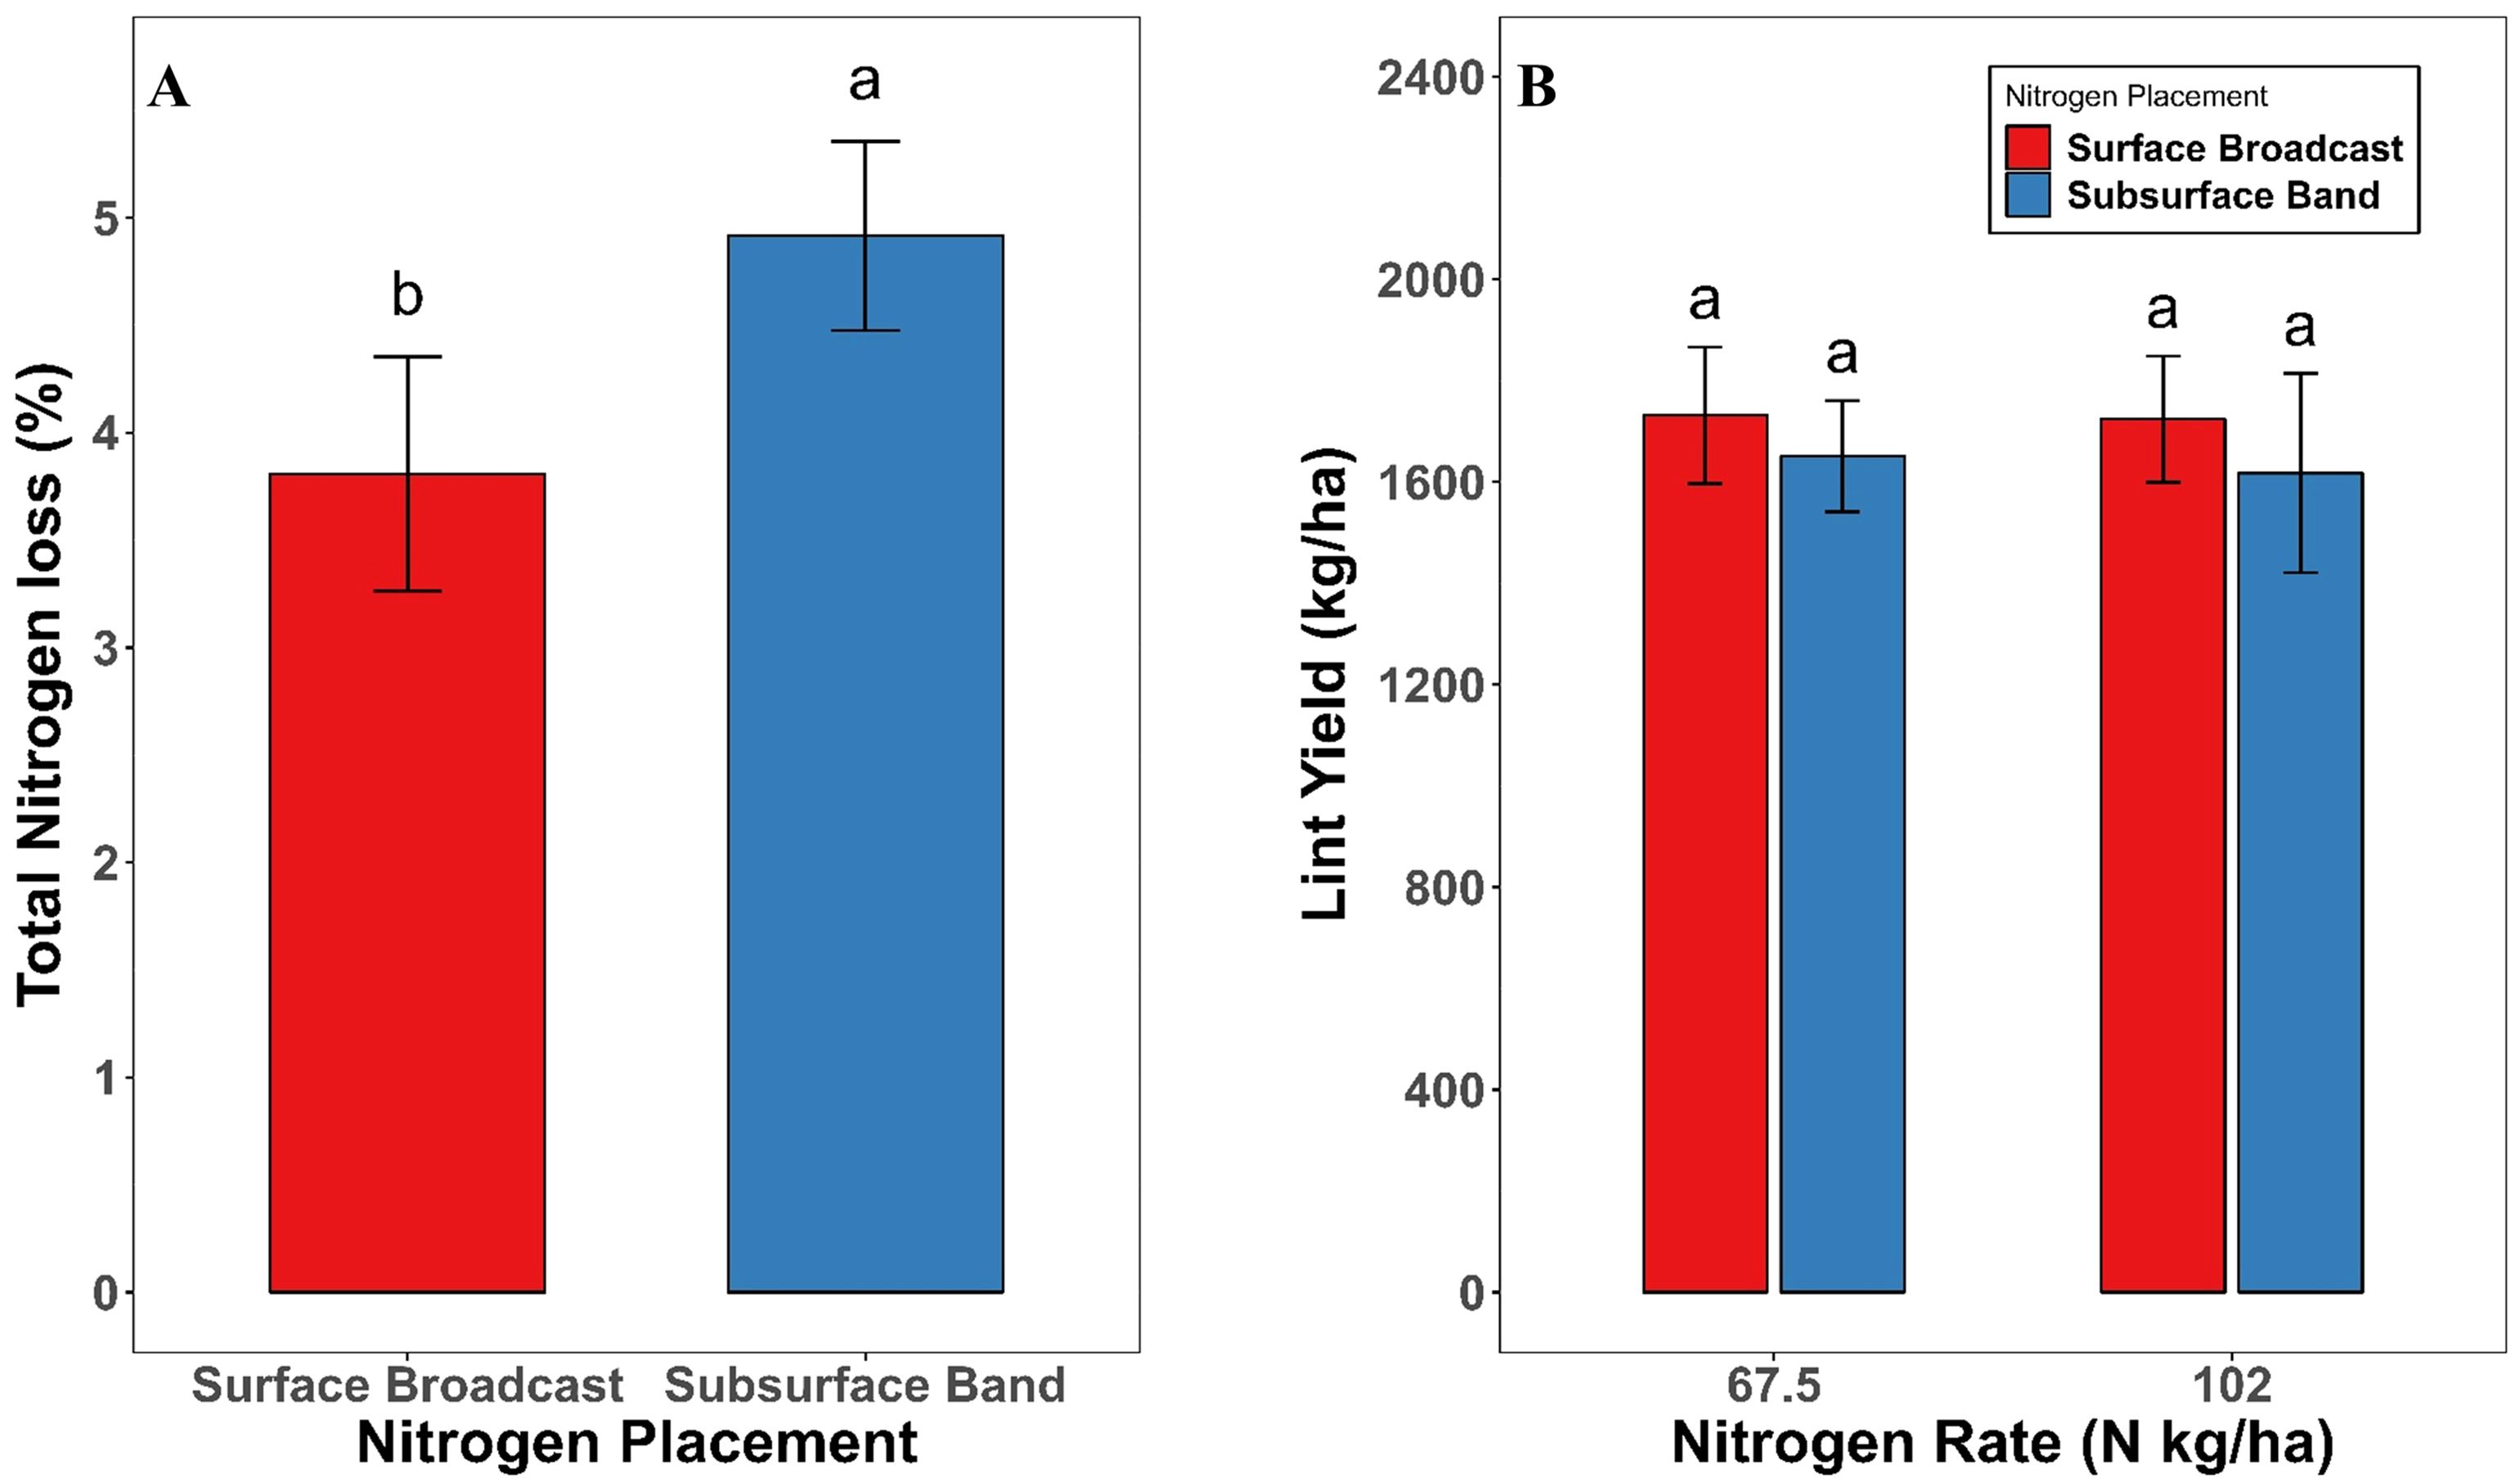
Figure 4. (A) Total nitrogen loss (%) across nitrogen placement methods for 2023 and 2024. Different letters represent significant differences between placement methods at p <0.05. (B) Combined lint yield (kg/ha) across different nitrogen placement methods and rates for 2023 and 2024. The same letters indicate that there was no significant difference in lint yield among nitrogen placement methods and rates.
3.2 Lint yield
There was no significant difference in lint yield among treatments across both study years (p = 0.46) (Figure 4B). Lint yield ranged from 1617 to 1732 kg/ha across all treatments. Although NH3 losses were higher under subsurface band, the lint yield was comparable to surface broadcasting. Lint yield is a complex trait in cotton, influenced by the interplay of various factors, including weather conditions, soil properties, N availability, and N uptake (Cetin and Basbag, 2010). Nevertheless, the findings of the present study align with previous research (Warren et al., 2008; Halvorson and Del Grosso, 2013), which also reported no significant differences in yield between subsurface banding and surface broadcasting. The application through subsurface band results in a higher concentration of N in narrow bands, which can result in an increase in soil pH (Rochette et al., 2009b). The sudden changes in soil pH might result in a lower N uptake in cotton (Guo et al., 2022). The lower N uptake coupled with higher NH3-N losses under subsurface band might have resulted in no differences in lint yield in the current study. Results of the current study are in contradiction with other studies which have reported a positive effect of subsurface band over surface broadcast in cotton and corn (Zea mays L.) (Tewolde et al., 2009; Tewolde et al., 2023). However, these studies differed from the current study in terms of N source and soil texture. Tewolde et al. (2009) used poultry litter in the experiment with N content of 2-3% whereas Tewolde et al. (2022) conducted experiment on clay loam soil, which has higher buffering capacity than sandy soil. The N uptake and NH3 losses are influenced by soil properties and N sources, which might have resulted in contradicting results in the current study.
Considering the lack of yield advantage with subsurface banding and the higher NH3; losses observed under this method, surface broadcasting may present a more practical option for growers in similar production systems. Furthermore, subsurface banding typically requires more passes and specialized equipment, resulting in higher labor and fuel demands, whereas surface broadcasting is faster and uses simpler machinery (Way et al., 2013). These factors, coupled with comparable lint yields, suggest that surface broadcasting may be a more efficient and feasible N placement method under the conditions of this study.
4 Conclusion
Subsurface band resulted in higher NH3 emissions compared to surface broadcast. When N was applied at a higher rate, subsurface band resulted in significantly higher cumulative N-NH3 emissions as compared to surface broadcast. Although NH3 losses were higher under the subsurface band, there was no difference in lint yield between the subsurface band and surface broadcast. The findings of the current study highlight that subsurface banding was ineffective in reducing NH3 losses in cotton production systems.
Data availability statement
The raw data supporting the conclusions of this article will be made available by the authors, without undue reservation.
Author contributions
KS: Data curation, Formal analysis, Methodology, Writing – original draft. ED: Validation, Writing – review & editing. SS: Data curation, Writing – review & editing. AS: Data curation, Writing – review & editing. LS: Project administration, Writing – review & editing. HS: Conceptualization, Funding acquisition, Investigation, Project administration, Resources, Supervision, Validation, Visualization, Writing – review & editing.
Funding
The author(s) declare financial support was received for the research and/or publication of this article. This research was funded by Florida Department of Agriculture and Consumer Services (AWD17077).
Acknowledgments
The authors thank the Cropping System crew, West Florida Research and Education Center, for assisting in data collection and the Dubeux lab at the North Florida Research and Education Center for analyzing NH3 samples.
Conflict of interest
The authors declare that the research was conducted in the absence of any commercial or financial relationships that could be construed as a potential conflict of interest.
Generative AI statement
The author(s) declare that no Generative AI was used in the creation of this manuscript.
Publisher’s note
All claims expressed in this article are solely those of the authors and do not necessarily represent those of their affiliated organizations, or those of the publisher, the editors and the reviewers. Any product that may be evaluated in this article, or claim that may be made by its manufacturer, is not guaranteed or endorsed by the publisher.
Supplementary material
The Supplementary Material for this article can be found online at: https://www.frontiersin.org/articles/10.3389/fagro.2025.1625163/full#supplementary-material
Abbreviations
N, Nitrogen; NH3, Ammonia; WAF, Weeks after fertilization.
References
Bittman S., van Vliet L. J., Kowalenko C. G., McGinn S., Hunt D. E., and Bounaix F. (2005). Surface-banding liquid manure over aeration slots: A new low-disturbance method for reducing ammonia emissions and improving yield of perennial grasses. Agron. J. 97, 1304–1313. doi: 10.2134/agronj2004.0277
Bouwman A. F., Boumans L. J. M., and Batjes N. H. (2002). Estimation of global NH3 volatilization loss from synthetic fertilizers and animal manure applied to arable lands and grasslands. Global Biogeochemical Cycles 16, 1024. doi: 10.1029/2000GB001389
Canatoy R. C., Cho S. R., Galgo S. J. C., Kim P. J., and Kim G. W. (2024). Reducing ammonia volatilization in rice paddy: the importance of lower fertilizer rates and soil incorporation. Front. Environ. Sci. 12, 1479712. doi: 10.3389/fenvs.2024.1479712
Cetin O. and Basbag S. (2010). Effects of climatic factors on cotton production in semi-arid regions—A review. Res. Crops 11, 785–791.
Delgado J. A. (2002). Quantifying the loss mechanisms of nitrogen. Journal of Soil and Water Conservation 57 (6), 389–398.
FAO. (2020). FAOSTAT. Food and Agriculture Organization of the United Nations, Rome, Italy. http://www.fao.org/faostat/en/#home (Accessed January 13, 2024).
Götze H., Saul M., Jiang Y., and Pacholski A. (2023). Effect of incorporation techniques and soil properties on NH3 and N2O emissions after urea application. Agronomy 13, 2632. doi: 10.3390/agronomy13102632
Guo J. X., Lu X. Y., Tao Y. F., Guo H. J., Hou Z. A., and Min W. (2022). Effects of saline and alkaline stresses on growth and nutrient uptake of cotton. Agricultural Research in the Arid Areas, 40 (04), 23-32. doi: 10.7606/j.issn.1000-7601.2022.04.03
Halvorson A. D. and Del Grosso S. J. (2013). Nitrogen placement and source effects on nitrous oxide emissions and yields of irrigated corn. J. Environ. Qual. 42, 312–322. doi: 10.2134/jeq2012.0315
Harty M. A., McDonnell K. P., Whetton R., Gillespie G., and Burke J. I. (2024). Comparison of ammonia‐N volatilization losses from untreated granular urea and granular urea treated with NutriSphere‐N®. Soil Use and Management 40 (1), e12891.
Huijsmans J. F. M., Hol J. M. G., and Hendriks M. M. W. B. (2001). Effect of application technique, manure characteristics, weather and field conditions on ammonia volatilization from manure applied to grassland. NJAS-Wageningen J. Life Sci. 49, 323–342. doi: 10.1016/S1573-5214(01)80021-X
Jantalia C. P., Halvorson A. D., Follett R. F., Rodrigues Alves B. J., Polidoro J. C., and Urquiaga S. (2012). Nitrogen source effects on ammonia volatilization as measured with semi‐static chambers. Agronomy Journal 104 (6), 1595–1603.
Kozak M. (2020). lattice: Easy construction of professional graphs for agricultural research in R environment. Scientia Agricola 77, e20190122. doi: 10.1590/1678-992x-2019-0122
Li M., Wang Y., Adeli A., and Yan H. (2018). Effects of application methods and urea rates on ammonia volatilization, yields and fine root biomass of alfalfa. Field Crops Res. 218, 115–125. doi: 10.1016/j.fcr.2018.01.011
McClanahan S., Frame W. H., Stewart R. D., and Thomason W. E. (2020). Cotton yield and lint quality responses to nitrogen rate and placement in the humid southeast. Agronomy Journal 112 (5), 4276–4286.
Motasim A. M., Samsuri A. W., Nabayi A., Akter A., Haque M. A., Abdul Sukor A. S., et al. (2024). Urea application in soil: Processes, losses, and alternatives—A review. Discover Agric. 2, 42. doi: 10.1007/s44279-024-00060-z
Nagle C. (2018). An Introduction to fitting and evaluating mixed-effects models in R. Pronunciation Second Lang. Learn. Teach. Proc. 10, 82–105.
Nkebiwe P. M., Weinmann M., Bar-Tal A., and Müller T. (2016). Fertilizer placement to improve crop nutrient acquisition and yield: A review and meta-analysis. Field Crops Res. 196, 389–401. doi: 10.1016/j.fcr.2016.07.018
Pfluke P. D., Jokela W. E., and Bosworth S. C. (2011). Ammonia volatilization from surface-banded and broadcast application of liquid dairy manure on grass forage. J. Environ. Qual. 40, 374–382. doi: 10.2134/jeq2010.0102
Prasertsak P., Freney J. R., Denmead O. T., Saffigna P. G., Prove B. G., and Reghenzani J. R. (2002). Effect of fertilizer placement on nitrogen loss from sugarcane in tropical Queensland. Nutrient Cycling Agroecosystems 62, 229–239. doi: 10.1023/A:1021279309222
R Core Team (2021). R: A language and environment for statistical computing (Vienna, Austria: R Foundation for Statistical Computing). Available online at: https://www.R-project.org/ (Accessed September 20, 2024).
Rochette P., Angers D. A., Chantigny M. H., Gasser M. O., MacDonald J. D., Pelster D. E., et al. (2013). NH3 volatilization, soil concentration and soil pH following subsurface banding of urea at increasing rates. Can. J. Soil Sci. 93, 261–268. doi: 10.4141/cjss2012-095
Rochette P., Angers D. A., Chantigny M. H., MacDonald J. D., Gasser M. O., and Bertrand N. (2009a). Reducing ammonia volatilization in a no-till soil by incorporating urea and pig slurry in shallow bands. Nutrient Cycling Agroecosystems 84, 71–80. doi: 10.1007/s10705-008-9227-6
Rochette P., MacDonald J. D., Angers D. A., Chantigny M. H., Gasser M. O., and Bertrand N. (2009b). Banding of urea increased ammonia volatilization in a dry acidic soil. J. Environ. Qual. 38, 1383–1390. doi: 10.2134/jeq2008.0295
Stark C. H. and Richards K. G. (2008). The continuing challenge of agricultural nitrogen loss to the environment in the context of global change and advancing research. Dynamic Soil, Dynamic Plant 2 (1), 1–12.
Singh H., Sharma L., Johnson L., Carter E., and Devkota P. (2023). Mitigating Nitrogen Losses in Row Crop Production Systems: SS-AGR-471/AG467, 1/2023. EDIS 20231.
Reiter M. S., Reeves D. W., and Burmester C. H. (2008). Cotton Nitrogen Management in a High‐Residue Conservation System: Source, Rate, Method, and Timing. Soil Science Society of America Journal 725, 1330–1336.
Tewolde H., Armstrong S., Way T. R., Rowe D. E., and Sistani K. R. (2009). Cotton response to poultry litter applied by subsurface banding relative to surface broadcasting. Soil Sci. Soc. America J. 73, 384–389. doi: 10.2136/sssaj2008.0127
Tewolde H., Way T. R., Buehring N., and Jenkins J. N. (2023). Fertilizer value of poultry litter applied by subsurface band vs. surface broadcast in corn production. J. Plant Nutr. 46 (99), 2044–2059. doi: 10.1080/01904167.2022.2118133
Warren J. G., Sistani K. R., Way T. R., Mays D. A., and Pote D. H. (2008). A new method of poultry litter application to perennial pasture: Subsurface banding. Soil Sci. Soc. America J. 72, 1831–1837. doi: 10.2136/sssaj2007.0423
Wang J. J., Zhang K. R., Wu C., and Zhang Q. F. (2014). Wet deposition of atmospheric nitrogen of the Jinshui watershed in the upper Hanjiang River. Huan Jing ke Xue = Huanjing Kexue 351, 66–72.
Way T. R., Watts D. B., Tewolde H., Sistani K. R., and Torbert H. A. (2013). Implement with adjustable band spacing for subsurface band application of poultry litter. Appl. Eng. Agric. 29, 831–839. doi: 10.13031/aea.29.10137
Keywords: ammonia volatilization, nitrogen, subsurface band, surface broadcast, cotton
Citation: Singh K, Dar EA, Singh S, Shah A, Sharma L and Singh H (2025) Subsurface banding increases ammonia emissions under rainfed cotton in Florida sandy soils. Front. Agron. 7:1625163. doi: 10.3389/fagro.2025.1625163
Received: 08 May 2025; Accepted: 09 July 2025;
Published: 15 August 2025.
Edited by:
Tajamul Hussain, Oregon State University, United StatesReviewed by:
Ronley C. Canatoy, Central Mindanao University, PhilippinesVaibhav Shrivastava, Swedish University of Agricultural Sciences, Sweden
Copyright © 2025 Singh, Dar, Singh, Shah, Sharma and Singh. This is an open-access article distributed under the terms of the Creative Commons Attribution License (CC BY). The use, distribution or reproduction in other forums is permitted, provided the original author(s) and the copyright owner(s) are credited and that the original publication in this journal is cited, in accordance with accepted academic practice. No use, distribution or reproduction is permitted which does not comply with these terms.
*Correspondence: Hardeep Singh, aGFyZGVlcC5zaW5naDFAdWZsLmVkdQ==
†ORCID: Kulpreet Singh, orcid.org/0009-0009-4959-3445
Hardeep Singh, orcid.org/0000-0002-6880-0085