 Sijia Wang
 Jinghua Zhao
 Chunxia Wang
 Tingrui Yang
- 1College of Water Resources and Civil Engineering, Xinjiang Agricultural University, Urumqi, Xinjiang, China
- 2Xinjiang Key Laboratory of Hydraulic Engineering Safety and Water Disaster Prevention and Control, Xinjiang Agricultural University, Urumqi, Xinjiang, China
- 3College of Water Resources and Architectural Engineering, Shihezi University, Shihezi, Xinjiang, China
Introduction: Excessive nitrogen application poses a multifaceted challenge to modern intensive agriculture, causing adverse effects including soil acidification, groundwater contamination and greenhouse gas emissions. These environmental consequences threaten the sustainability of global agricultural systems and impair cotton growth performance and resource-use efficiency. Under China’s national policy of zero-growth in fertilizer application, it is critical to elucidate the spatial distribution patterns of cotton root systems under nitrogen reduction conditions, quantify the contributions of water and nitrogen inputs to total nitrogen accumulation in different cotton organs, and analyze water-nitrogen management interactions to enhance water and nitrogen use efficiency in cotton cropping systems.
Methods: In this study, three irrigation quotas (488 mm, 444 mm, and 400 mm are denoted as W1, W2, and W3) and four nitrogen fertilization levels (440 kg ha–1, 387 kg ha–1, 336 kg ha–1, and 294 kg ha–1, respectively) were implemented in 2023 through root box and field experiments to investigate root growth dynamics and nitrogen accumulation in cotton fields. Water-nitrogen interactions significantly affected cotton root morphology.
Results: The mean root diameter in the 15–50 cm soil layer exhibited strong responsiveness to irrigation, with optimal growth observed under the W3N3 treatment (400 mm irrigation and 336 kg ha-1 nitrogen). Under W1 irrigation (488 mm), root length density (RLD) and diameter showed minimal differences between N1 and N2 treatments, whereas root surface area density (RSAD) of the N4 treatment demonstrated significant irrigation-dependent variation. Total nitrogen content across cotton organs followed the order: leaves > stems > roots, showing positive correlation with nitrogen application rate. The irrigation quota (48.0%–51.3%) was found to contribute more to plant nitrogen content than nitrogen application (22.7%–48.7%). Nitrogen application was identified as the primary contributor to soil total nitrogen accumulation in all soil layers within the limited-area study; however, in the open-field experiment, it was observed to contribute most significantly (27.4%) to soil total nitrogen accumulation specifically in the 0-40 cm soil layer.
Discussion: This study provides theoretical and technical support for optimizing cotton production, enhancing water-nitrogen use efficiency, and promoting environmental sustainability in Xinjiang’s arid farming systems.
1 Introduction
Soil moisture and nitrogen availability are critical factors regulating cotton growth dynamics (Zhou, 2024). As a universal solvent, water facilitates the dissolution of both inorganic minerals and organic compounds, while regulating nutrient transport and spatial redistribution within plant vascular systems. This aqueous medium couples the soil-plant-atmosphere continuum (SPAC) through critical hydraulic processes including water uptake, xylem transport, and transpiration (Song et al., 2025). Nitrogen serves as a fundamental structural component, mediating plant assimilation processes and regulating essential developmental stages such as cell division and organ differentiation, thus acting as a key driver of crop growth and development (Araus et al., 2020). Appropriate water-nitrogen management enhances soil fertility by optimizing soil physico-chemical properties, improving aeration status and water retention capacity. Such optimized soil conditions stimulate microbial activity, enhance root nutrient uptake efficiency, and ultimately improve both crop yield and quality parameters (Li et al., 2023).
Cotton, as a globally significant fiber crop, represents a major global commodity with extensive cultivation. In 2024, China’s cotton production reached 6.164 million tonnes, reinforcing its status as the world’s leading cotton producer. Xinjiang, the nation’s primary cotton cultivation region, contributed 5.686 million tonnes, representing 92.2% of the total national output. Xinjiang’s arid climate makes agricultural irrigation the primary water source for cotton cultivation. However, growers’ excessive water and nitrogen inputs aimed at yield enhancement have caused environmental degradation, including progressive soil acidification, aquifer contamination, and nutrient imbalance. These anthropogenic management practices collectively degrade soil health and compromise regional ecological equilibrium. Concurrently, resource overuse induces physiological stress in cotton plants, manifesting as premature defoliation, excessive vegetative growth, and yield reduction – outcomes that contradict intended productivity objectives (Ding et al., 2024; Li et al., 2020a).
As an important hub for water and nutrient transport among the soil-plant-atmosphere continuum, the root system’s absorption capacity is also an important determinant of nitrogen fertilizer utilization (Chen et al., 2018a), which is of critical importance in the process of crop growth and yield formation (Huo et al., 2025). The growth and distribution of crop root systems under nitrogen reduction management and water regulation are the key to coping with nitrogen fertilizer stress and water alteration, Reasonable water and nitrogen regulation can improve the water storage capacity of soil (Ye et al., 2022) and some scholars have shown that applying additional nitrogen fertilizer under water-deficient conditions can effectively promote cotton’s nitrogen absorption. When nitrogen levels are low (Liao et al., 2024), crops can improve their nitrogen supply level by changing the volume of the root system and increasing the root-crown ratio (Du et al., 2008), reasonable water and nitrogen regulation positively affects the growth of the root system (Wang et al., 2023), which strengthens the root system by enhancing root development, promoting root elongation, increasing the proportion of roots in deep soil, and enhancing root water and nitrogen uptake capacity (Luo et al., 2023); many studies reported that the negative effect of mild drought stress on cotton root growth could be reduced by increasing the level of nitrogen supply (Zhang et al., 2017), and this study obtained similar results in rice (Bai et al., 2007) and wheat (Liang and Chen, 1995); Moreover, among the characteristic parameters of the root system, total root dry weight and total root surface area were significantly affected by water, whereas nitrogen fertilizer was the main influencing factor for total root length. For root system research methods, the Ota field destructive sampling method completely captures the spatial configuration of the root system (Gregory et al., 2006). At the same time, the complex and ever-changing external environment makes the root system highly variable. Therefore, the root box planting method is used to reduce external influences during root system research and more clearly reflect the differences in the root system under different treatments. At this stage, domestic and foreign research on nitrogen fertilizer reduction to regulate cotton growth and production is relatively extensive, but under nitrogen reduction conditions in Xinjiang, there is a lack of systematic and comprehensive evaluation of how water and nitrogen application affects the growth and distribution of cotton root systems in single plants, as well as their contribution to the depth of water and nitrogen uptake.
In summary, this study combines root box and field tests, focusing on single-plant and group-scale cotton root distribution. By establishing different nitrogen-reduction levels and irrigation volumes, we analyze their impact on cotton root spatial growth. The goal is to explore efficient water-nitrogen use pathways, reveal interactions and contributions to crop growth mechanisms, and clarify optimal application and management strategies. This work provides a theoretical and technical foundation for guiding cotton growth in Northern Xinjiang. It aims to promote efficient water-nitrogen use, reduce pollution, advance low-nitrogen agriculture, and address agricultural water challenges.
2 Materials and methods
2.1 Study sites
The experiment was conducted from April to October 2023 in Shihezi City (44°19’N, 85°59’E). Temperate continental climate, large temperature difference between day and night, strong surface evaporation, soil quality is chalky sandy loam, the test area is 451 m above sea level, the average ground slope is 6‰, the average multi-year temperature is 8.3 °C, the average annual evapotranspiration is 1,660 mm, the average annual precipitation is 207 mm, the frost-free period is 170 d, the depth of the groundwater is about 8 m, the average electrical conductivity of the soil 0-80 cm is The average conductivity of soil 0-80 cm was 5726.57 μS cm-1, and the organic matter content was 22.32 g kg-1. The basic soil properties of the experimental area are shown in Table 1, and the air temperature and rainfall during the reproductive period of cotton in 2023 are shown in Figure 1.
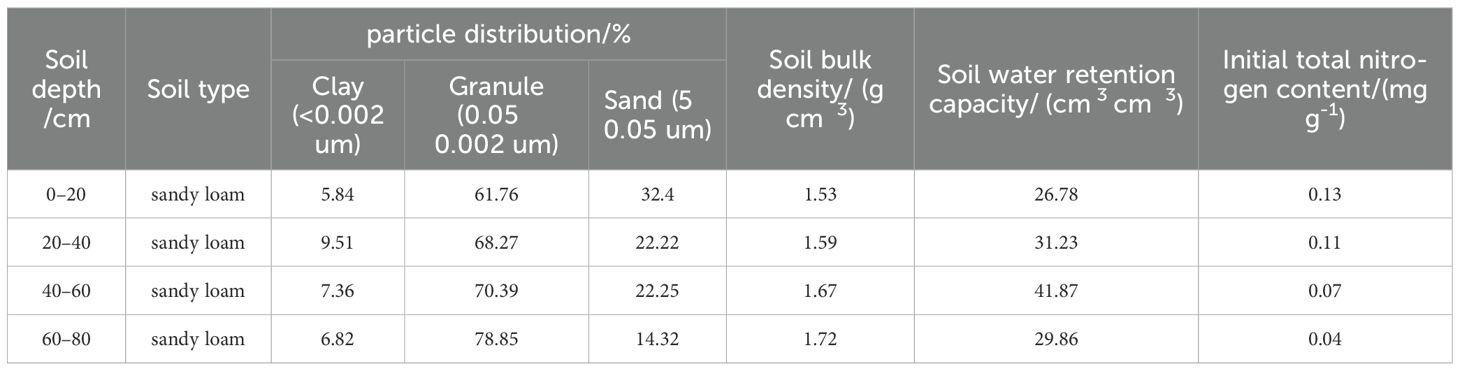
Table 1. Basic soil parameters.
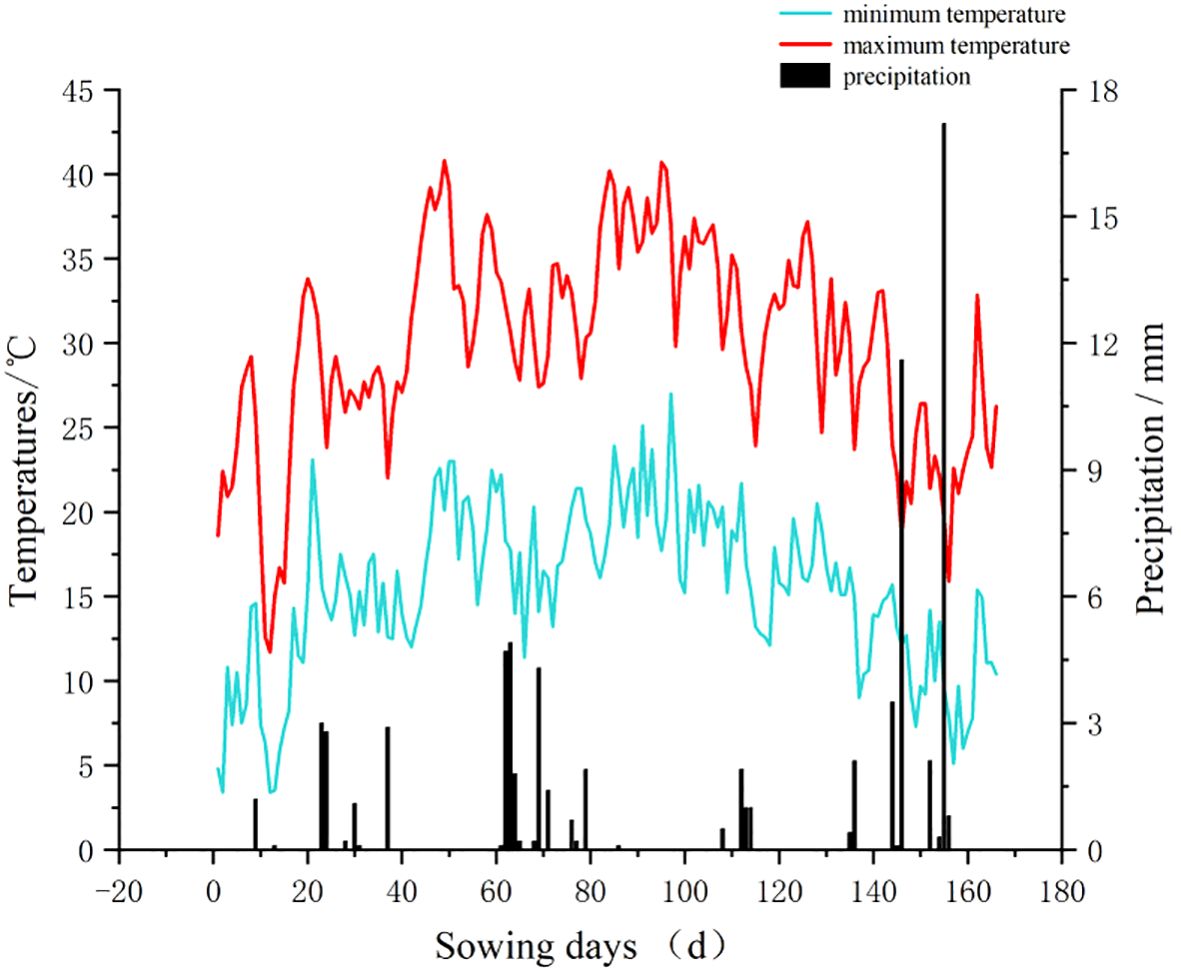
Figure 1. Meteorological data during the reproductive period of cotton, 2022–2023.
2.2 Experimental design
Using field and root box tests, the experiment set three different irrigation quotas, W1:488 mm (conventional irrigation +10%), W2:444 mm (conventional irrigation) and W3:400 mm (conventional irrigation -10%), based on the conventional irrigation level and nitrogen application level of cotton in the northern border; The four levels of nitrogen fertilizer applied were N1:440 kg ha–1 (conventional nitrogen application), N2:387 kg ha–1 (-10% nitrogen fertilizer), N3:336 kg ha–1 (- 20% N fertilizer), N4:294 kg ha–1 (-30% N fertilizer). The fertilizers used in the experiment were urea and potassium dihydrogen phosphate, respectively, and the phosphorus fertilizer for each treatment was invariant 210 kg ha–1 in a completely randomized trial with three replications for each treatment. The irrigation system is shown in Table 2.
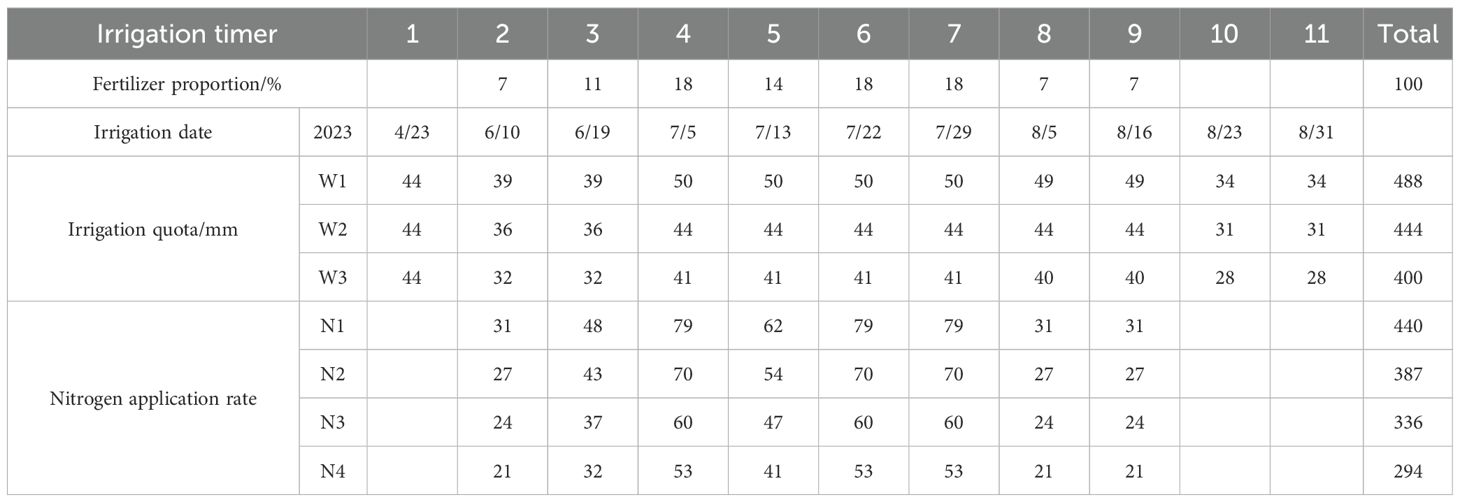
Table 2. Cotton irrigation system table for the year 2022–2023.
The test cotton variety is Xinlu 42, the field adopts ‘1 film, 2 tubes, 4 rows’ planting mode, the sowing time is 23 April 2023, and the area of a single experimental plot is 1.1 m×5 m. Irrigation is carried out by drip irrigation system, with a single-wing labyrinth-type drip irrigation system for the capillary tube, a drip head with a spacing of 30 cm, and a flow rate of 2.6 L h-1. The sowing spacing is 15 cm-20 cm-40 cm-20 cm-15 cm, the mulching width is 1.1 m, and the plant spacing is 10 cm, the layout of cotton is shown in Figures 1, 2. Spacing 15 cm-20 cm-40 cm-20 cm-15 cm, mulching width 1.1 m, plant spacing 10 cm, cotton layout form see Figure 2. root box for the test soil from the field test site, the use of liquid delivery devices to simulate drip irrigation irrigation, the root box used 5 mm thickness, the thickness of 5 mm, the thickness of 5 mm, the thickness of 5 mm, the thickness of 5 mm, the thickness of 5 mm, the thickness of 5 mm. The root box was assembled with transparent glass with a thickness of 5 mm, a length of 60 cm, a width of 15 cm and a height of 50 cm, and all glass surfaces were wrapped with black insulation cotton. The air-dried soil, sieved through a 5 mm sieve, was loaded according to the bulk weight of each layer of soil, irrigated to 80% of the field water holding capacity, and finally the root box was tilted at 45° and placed on a pre-made iron frame (Yang, 2017). In the root box were from the short side of the two sides of the 20 cm sowing, each position sowing 5 cotton seeds, to be consistent with the growth of seedlings after the seedling set 1 plant. The specific arrangement is shown in Figure 3 below.
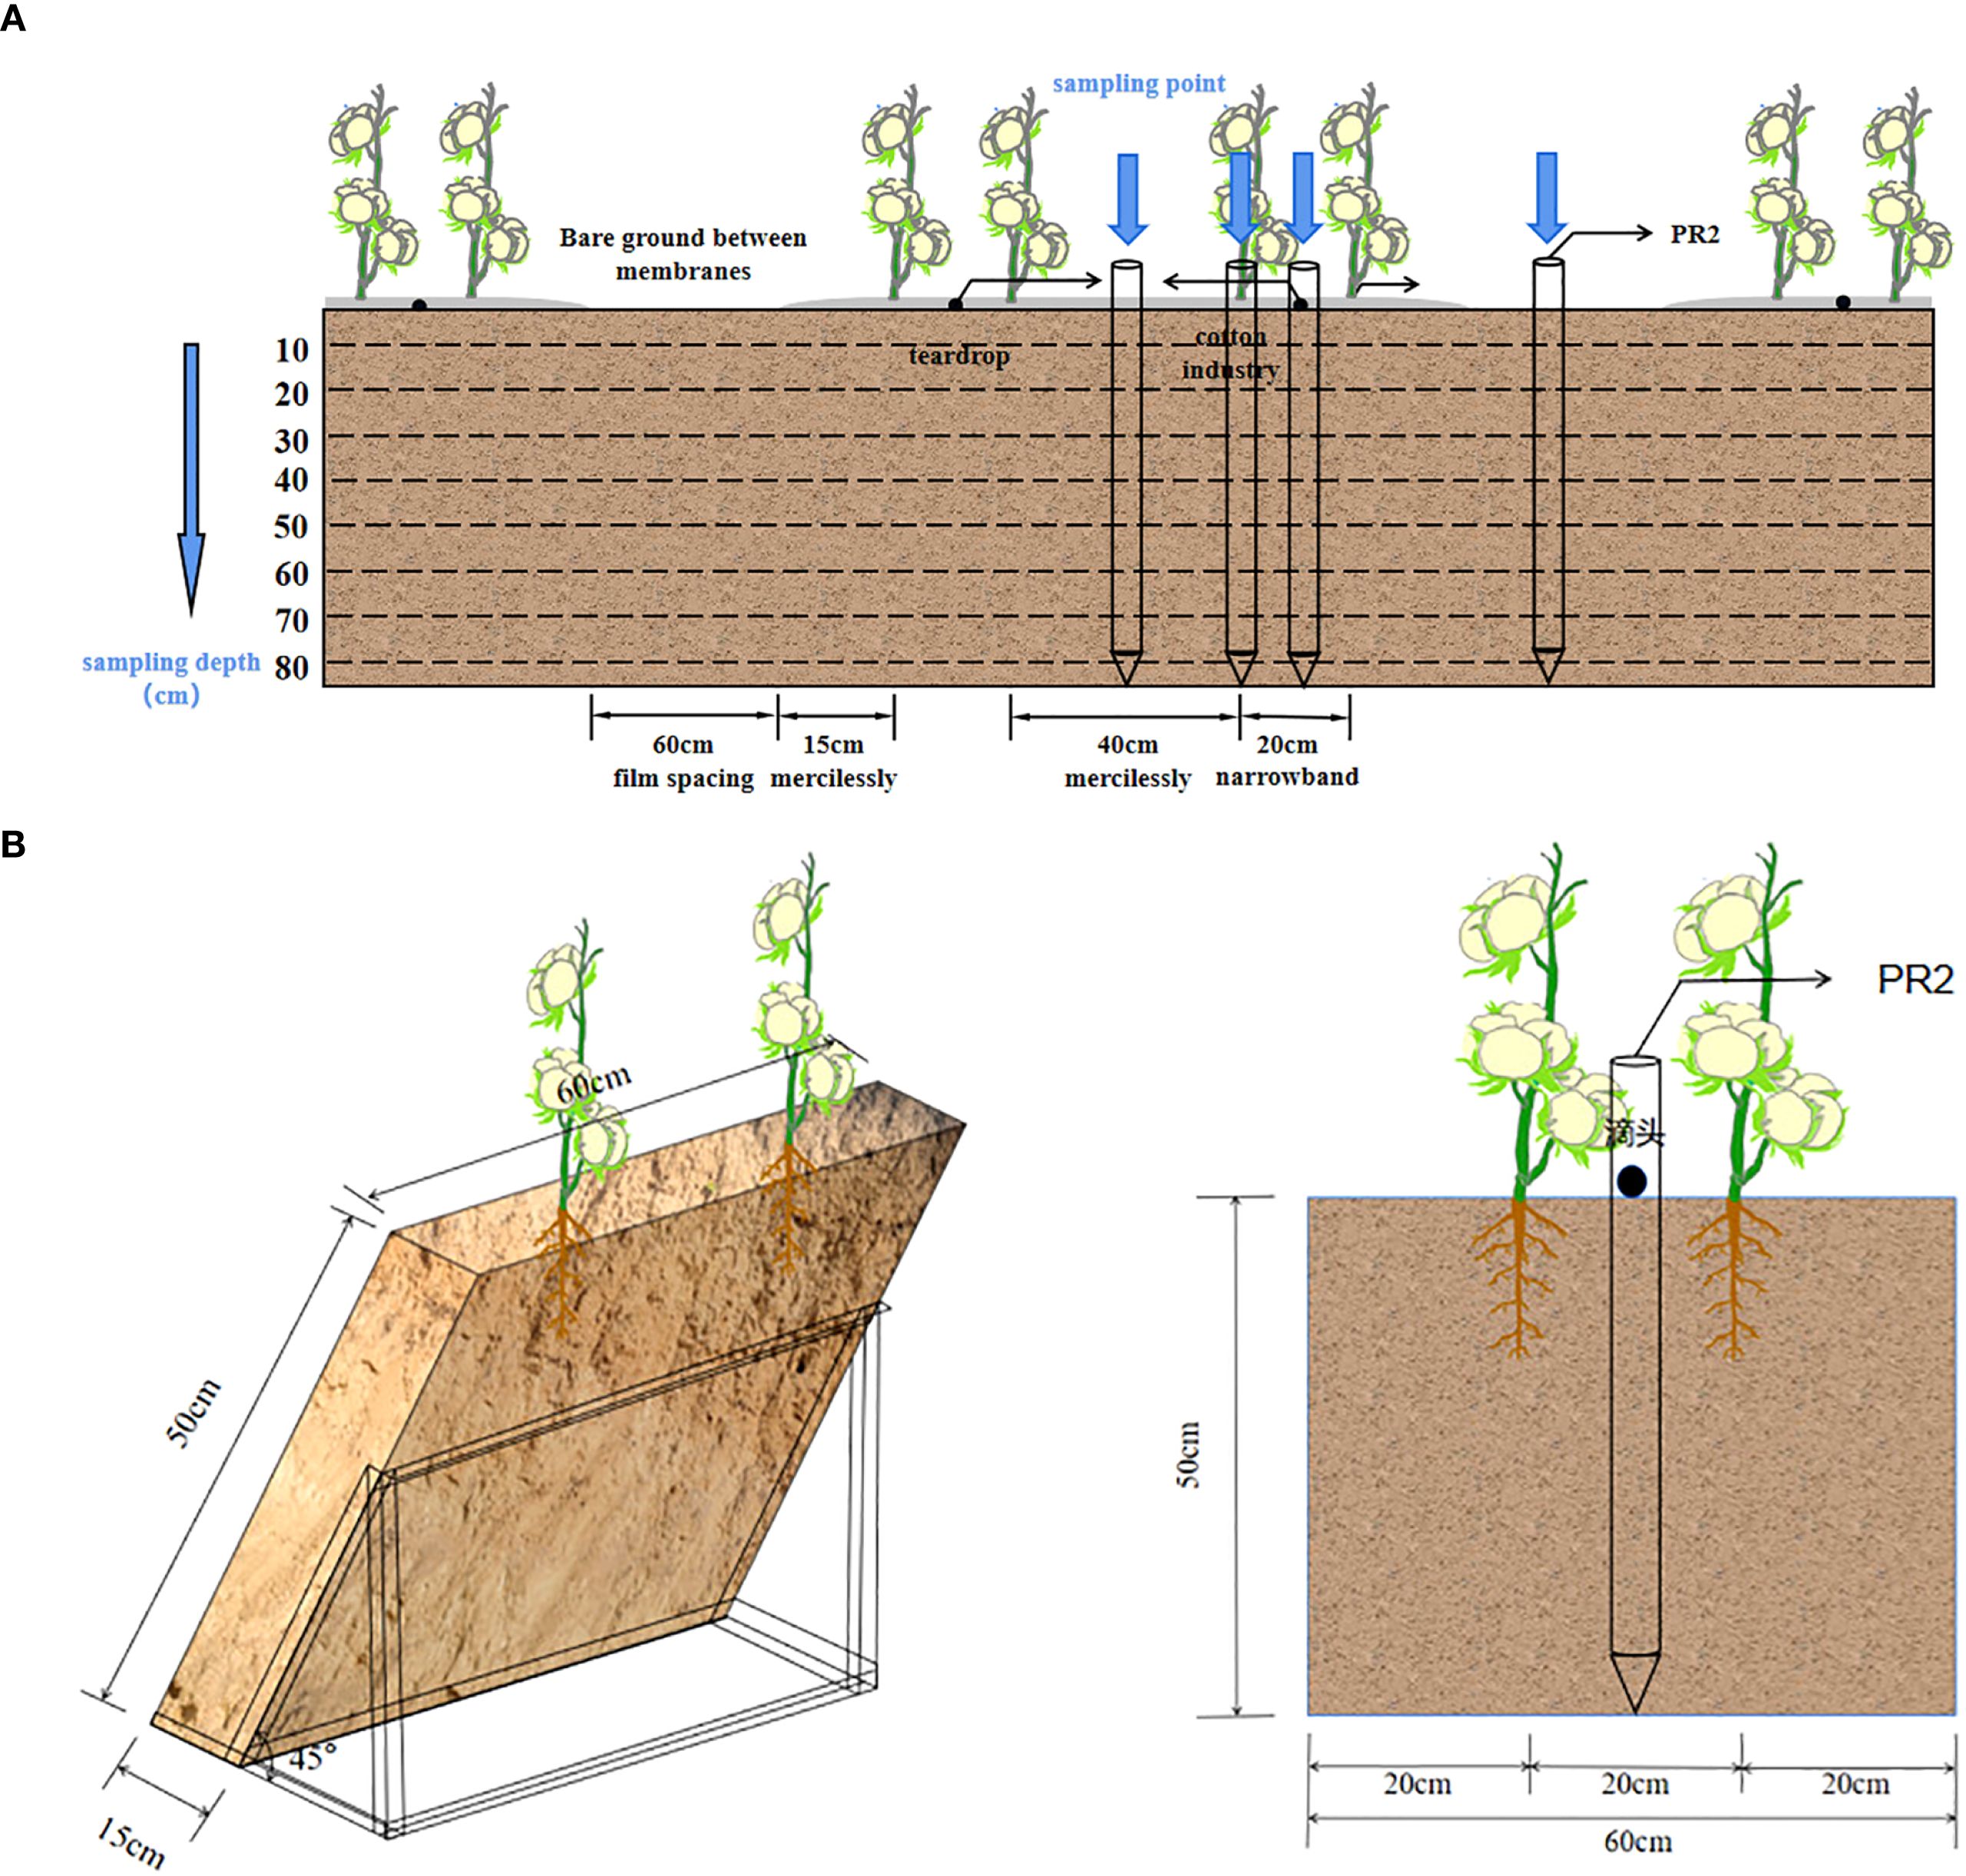
Figure 2. Cotton arrangement form (A) Descriptive diagram of field trial design; (B) Root box cotton arrangement form.
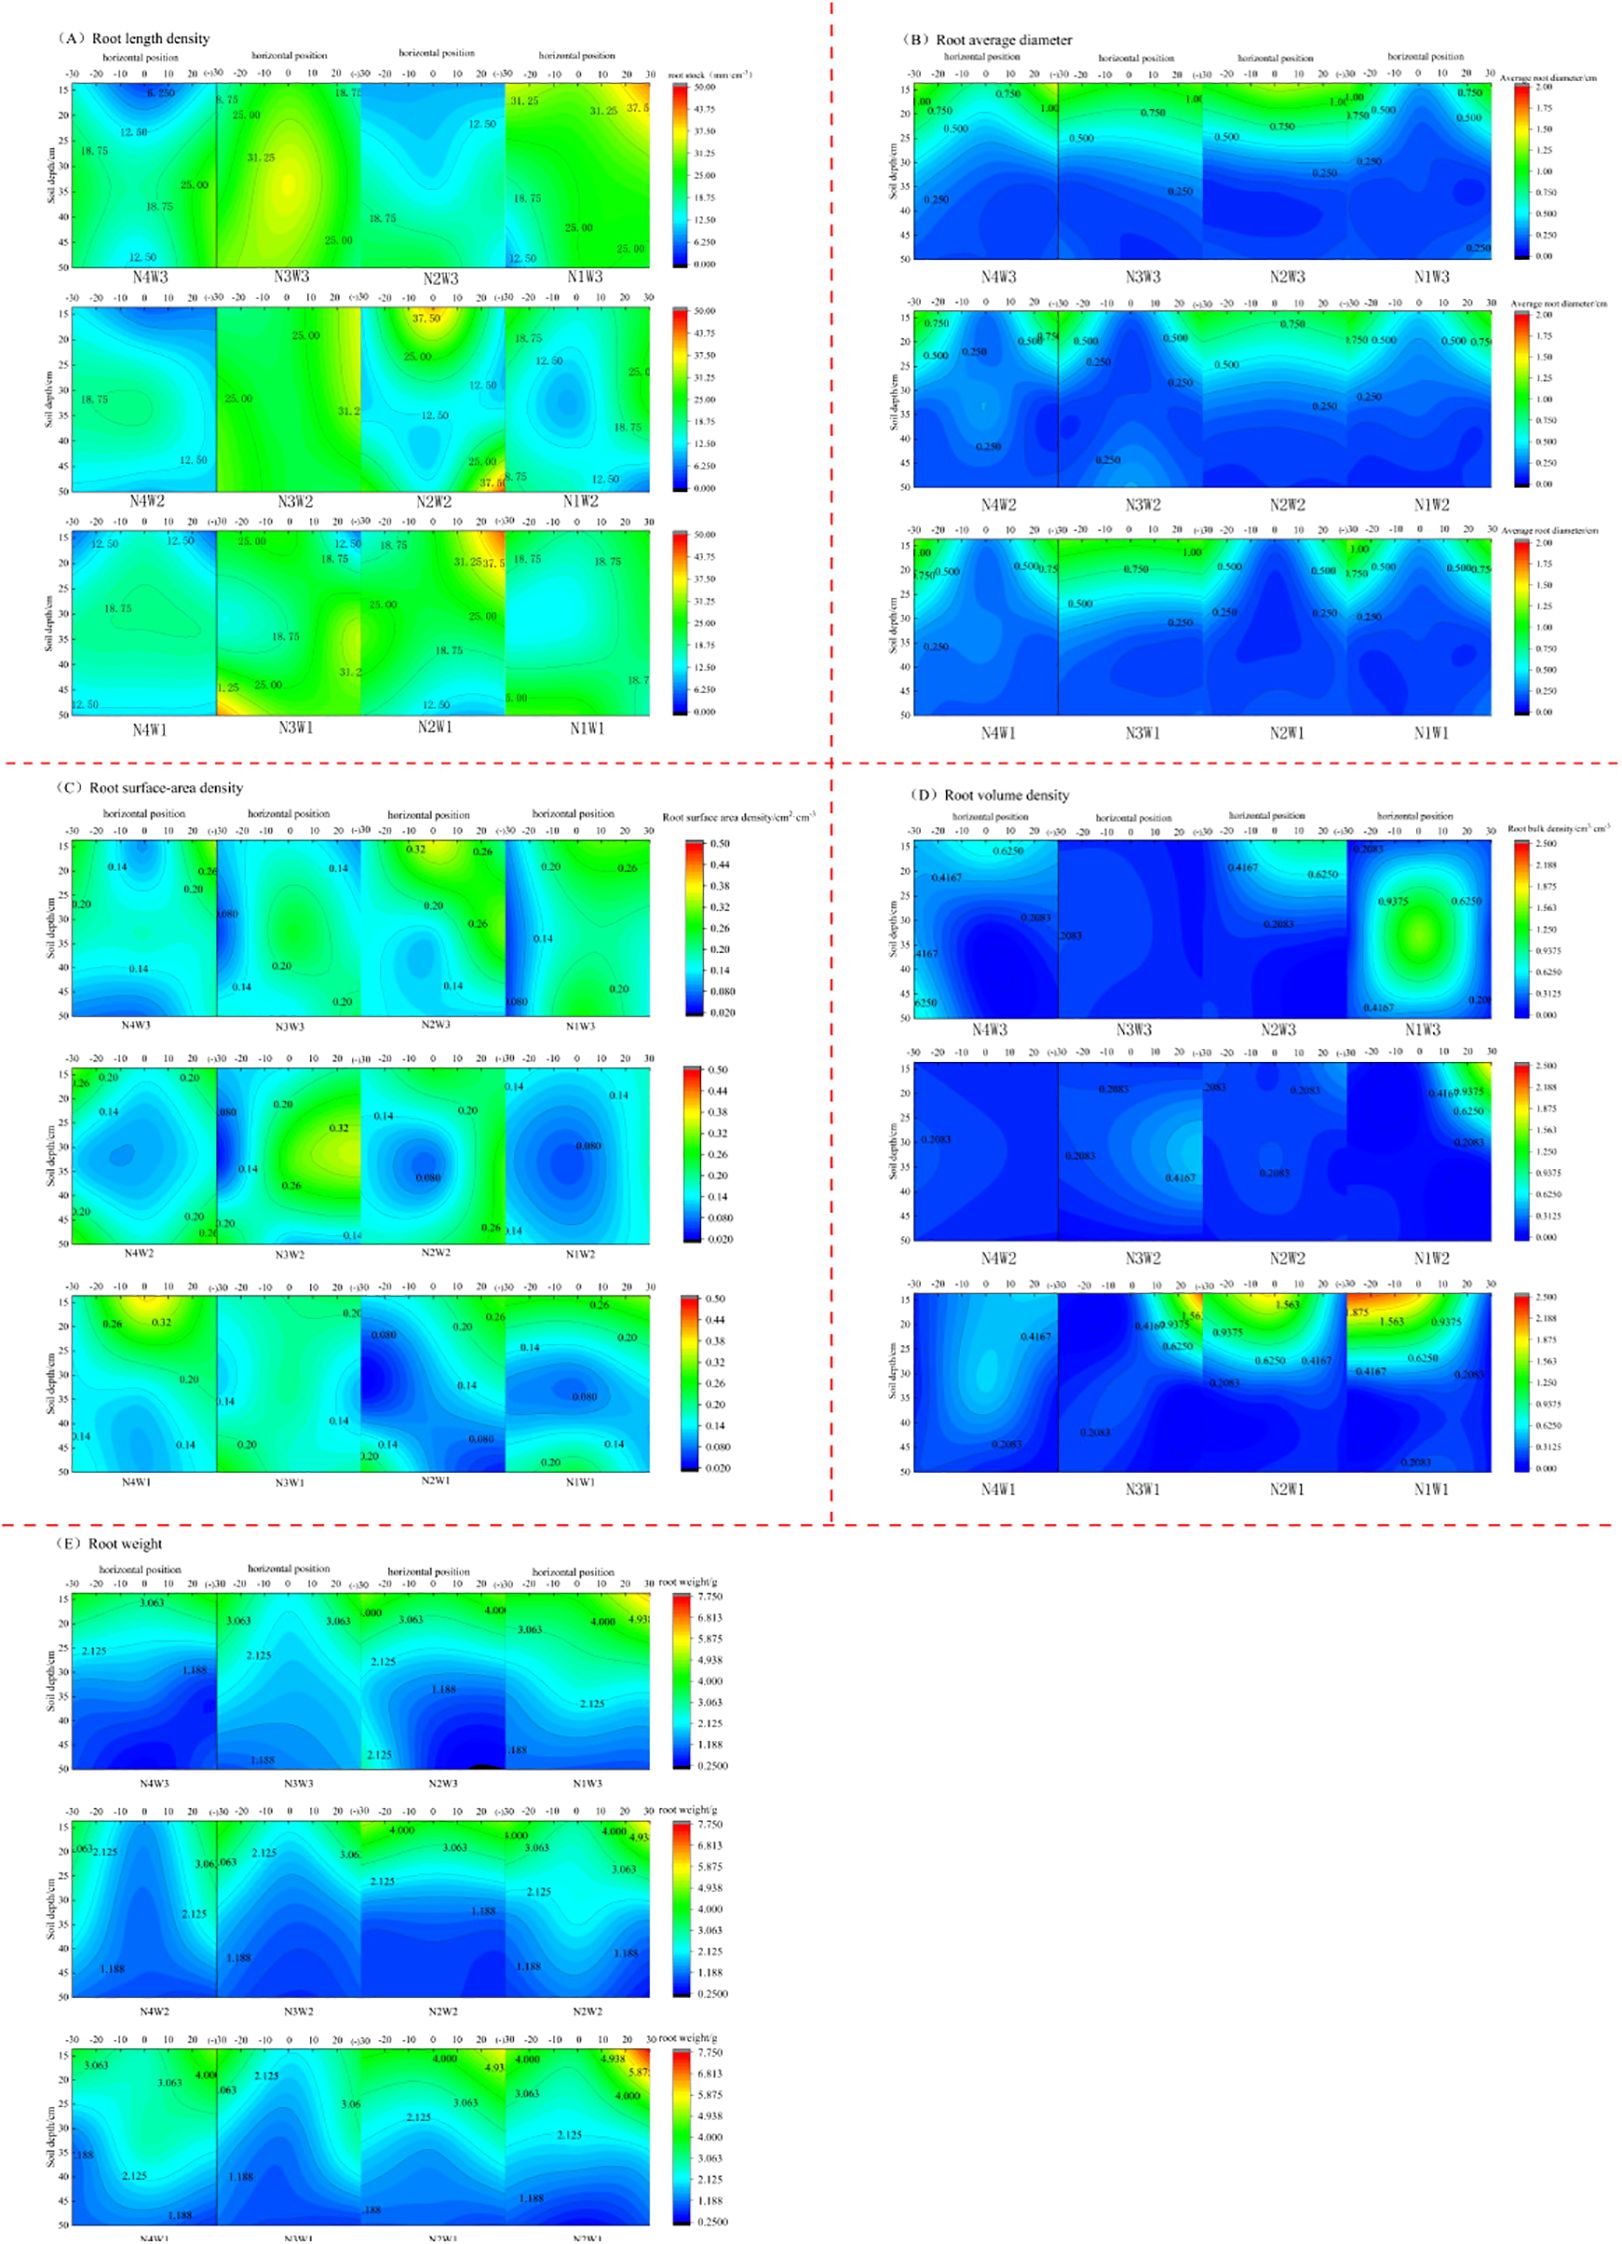
Figure 3. At the end of the growing season, the root growth indices of cotton plants in each treatment in the root box were measured (A) root length density; (B) root mean diameter density; (C) root surface area density; (D) root volume density; and (E) root weight. Horizontal coordinates at 0 cm are below the drop head, and 10 cm and -10 cm are at the cotton row.
2.3 Soil sampling
Soil samples were collected at the tasseling and boll formation stages before the first irrigation, and the sampling points were distributed in the wide rows, directly under the cotton rows, narrow rows and inter-membrane zones. The sampling depth of the field experiment was divided into 0-60 cm layers, with 20 cm as the basic sampling unit. Soil samples were collected from the 0-40 cm and 40-60 cm layers at the end of the reproductive period in the root box test. Homogenized samples from the same strata were allowed to dry naturally in a ventilated cool place and mixed thoroughly before being crushed in an agate mortar and sieved through a 100 mesh nylon sieve (0.15 mm). Treated samples were sealed and stored at 4°C before analysis. The total nitrogen content was quantified by semi-micro Kjeldahl method (GB 7173-87).
2.4 Plant sampling
Plant total nitrogen determination: Three cotton plants of approximately the same vigour were selected from the field plots and root boxes. Specimens were rinsed with deionized water to remove surface-adhered contaminants, then dissected into root, stem, leaf, boll and other organs. Tissues underwent thermal deactivation at 105°C for 30 minutes followed by drying at 80°C to constant mass. Dried samples were mechanically homogenized and sieved through 0.3-mm stainless steel sieve (60-mesh). Processed powders were stored in gas-tight aluminized bags. Total nitrogen content was determined using semi-micro Kjeldahl method (GB 7173-87).
Root growth parameters: At the end of the reproductive period of cotton in the field experiment, three representative cotton plants of uniform vigour were selected for each treatment. Aboveground biomass was excised from the ground. In the root box test, soil monoliths were divided into nine equidimensional grids after harvest. Roots were manually extracted intact, gently aqueously cleaned and surface moisture balanced using blotting paper. The prepared roots were scanned and kept axially aligned using an Epson Expression 12000XL root scanner. Morphometric parameters including total root length, projected surface area, bulk density, mean diameter and oven-dried biomass (105°C, 15 h) were quantified by the WinRHIZO Pro 2021a image analysis system.
2.5 Statistical analyses
Variable significance was assessed using the Random Forest algorithm, followed by statistical analyses via SPSS 26.0 for multivariate ANOVA and significance tests. Graphical visualization was achieved through OriginPro 2018.
3 Results
3.1 Cotton root growth distribution
3.1.1 Distribution of root growth in single cotton plants
Root architecture parameters describe the spatial development of the root system and its ability to access water/nutrients. Root length density (RLD) was positively correlated (p<0.05) with irrigation quota in cotton rows (Figure 3). Root length density was synergistically associated with increases in irrigation quota and N application in the 0–15 cm soil layer, but this N response was significantly weaker at depths below 40 cm. The greatest changes in root diameter occurred below the drip emitter, where the W3 treatment was 3.57% and 11.94% higher than W2 and W1, respectively, while the N3 treatment was 60.75%, 56.17%, and 44.70% higher than N1, N2, and N4, respectively. In the 15–30 cm soil layer, the average root diameter increased significantly with increased irrigation amount, while reducing nitrogen fertilizer stress showed no obvious pattern in root diameter changes. With the increase in irrigation amount, root surface area density below the drip emitter showed a trend of decreasing and then increasing. The W3 treatment was 20.58% and 57.64% higher than the W1 and W2 treatments, respectively, while no obvious pattern was observed with nitrogen application changes; In the 0–15 cm soil layer, root surface area density showed a trend of decreasing and then increasing with the increase in irrigation amount, while the opposite pattern was observed in the 15–50 cm soil layer. The W2 treatment showed a significant increase compared with the W1 and W3 treatments. In the 15–50 cm soil layer, the opposite pattern was observed: the W2 treatment was 16.71% and 15.46% higher than the W1 and W3 treatments, respectively. Below the cotton rows, root bulk density first increased with higher irrigation amount and then decreased with reduced nitrogen fertilizer stress, showing a “rise-fall-rise” trend. The N1 treatment was 27.71%, 20.63%, and 25.58% higher than the N2, N3, and N4 treatments, respectively, Root bulk density in the 0–15 cm and 30–50 cm soil layers showed a decreasing and then increasing trend with the increase in irrigation amount, but the increasing trend was not significant in deeper soil layers. The average weight of the root system increased with the decrease of nitrogen fertilizer stress at the bottom of the cotton rows, and decreased and then increased at the bottom of the drip emitters, and showed a trend of ‘slow decrease–slow increase’ with the increase of irrigation amount in all soil layers; in the 0–15 cm soil layer, the average weight of the root system increased with the decrease of nitrogen fertilizer stress and then increased with the increase of irrigation amount. In the 0–15 cm soil layer, the total root weight increased with the decrease of nitrogen fertilizer stress, and the total root weight was the largest in the N3 treatment.
3.1.2 Distribution of cotton root growth in cluster plants
Root system indexes to a certain extent reflect the growth and development status and nutrient uptake capacity, and indirectly characterize the growth and nutritional status of the crop.
Root length density showed an overall increasing trend with the decrease of water and nitrogen stress (Figure 4), with the smallest variation between the N2 and N1 treatments in the W1 treatment, and the greatest influence of nitrogen application in the W2 treatment; the changes in root length density between the W1 and W2 treatments with the same amount of nitrogen application were not significant, with a range of 7.49%–15.68%, with the smallest in the N4 treatment and the largest in the N1 treatment. The minimum and maximum occurred at the N1 treatment. The average diameter of the root system was positively correlated with the irrigation amount and the amount of nitrogen applied, which increased by 11.29% and 27.41% in W1 compared with W2 and W3 treatments, respectively, and the increase in the average root diameter showed an increasing-then-decreasing trend with reduced nitrogen fertilizer application in W3 or W2 treatments. The increase was the largest in N3 and N2 treatments, and the smallest increase (11.11%) in the average root diameter occurred when nitrogen application increased from N1 to N2 under the W1 treatment. The smallest increase (11.11%) was only 11.11%. Root surface area increased significantly between N2 and N1 treatments when the irrigation amount was increased from W2 to W1. Under N4 treatment, the increase in irrigation amount resulted in a steady increase in the surface area of the root system, with an increase of 18.71% and 52.36% in W1N4 compared to W2N4 and W3N4, respectively; he change in root volume was not significant between treatments. W1 was 8.25% and 14.31% higher than W2 and W3, respectively. At the same irrigation amount, the differences among N4, N3, and N2 treatments were not significant. At the same nitrogen application level, root volume showed an increasing trend with the increase in irrigation amount. Root weight varied among the treatments depending on the irrigation amount and the degree of nitrogen stress. At the same irrigation amount, the smallest variation in root weight was observed between the N2 and N3 treatments; The largest variation in root weight between the N1 and N2 treatments was observed at the irrigation amount of W1, and the largest variation in root weight between the N3 and N4 treatments was observed at the irrigation amount of W3. The smallest difference in the mean value of root weight was observed between the N2W3 and the N3W1 treatments, which was only 0.02 g.
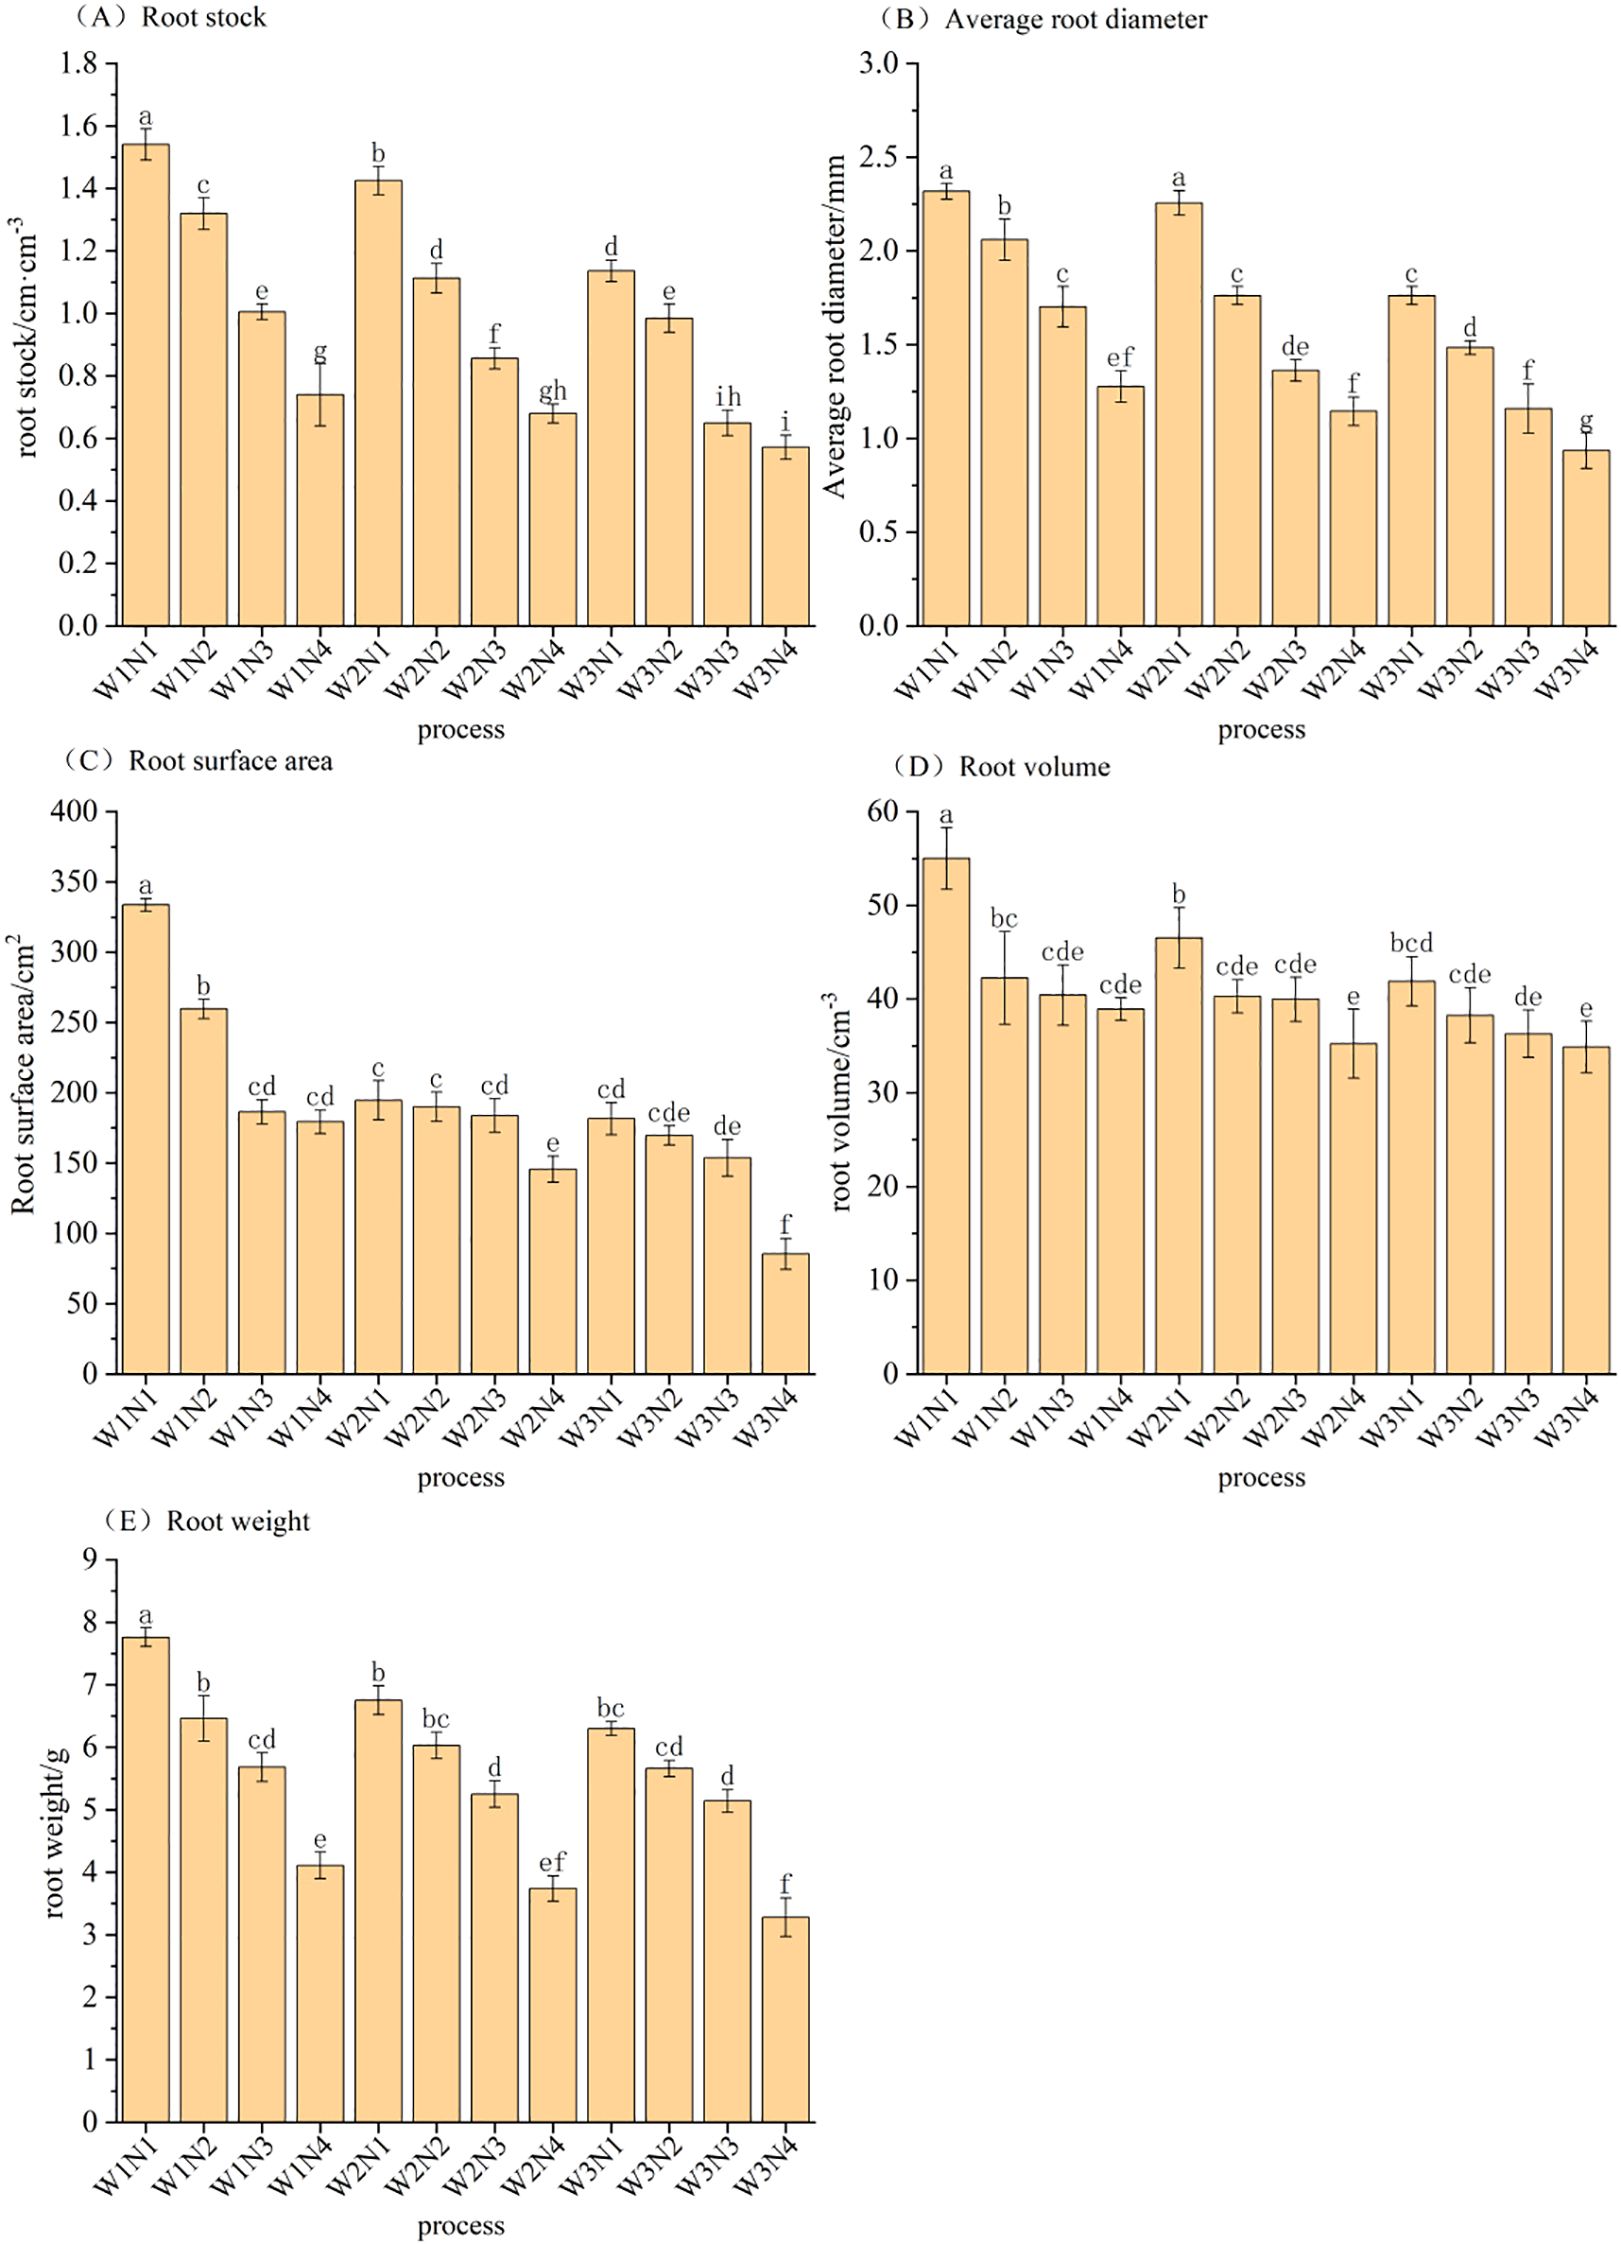
Figure 4. At the end of the growing season, the root growth indices of cotton under various treatments in the field were as follows (A) root length density; (B) root mean diameter density; (C) root surface area density; (D) root volume density; and (E) root weight. Horizontal coordinates at 0 cm are below the drop head, and 10 cm and -10 cm are at the cotton row. The lowercase letters in the figure are used to indicate statistically significant groupings. Different lowercase letters indicate significant differences between treatments.
3.2 Soil total nitrogen accumulation and distribution of total nitrogen content in various organs of cotton plants
3.2.1 Root box soil total nitrogen accumulation and distribution of total nitrogen content in various organs of single cotton plants
In the root box test, the total nitrogen content of cotton among treatments was not found to be significantly different, and the total nitrogen content of roots was kept at 1.592-1.898 mg/g. There was a positive correlation between the total root nitrogen content and nitrogen application, with the greatest increase (5.43%) between the N3 and N2 treatments, and the smallest increase (1.69%) between the N2 and N1 treatments. The difference in the total nitrogen content of stems among treatments was the least, with N1 increasing by 0.81%, 2.51%, and 1.91% compared to the N2, N3, and N4 treatments, respectively. The difference in the total nitrogen content of stems among treatments was the smallest, with an increase of 0.81%, 2.51%, and 1.91% in N1 compared to the N2, N3, and N4 treatments, respectively; and the difference in the total nitrogen content of leaves among treatments was the largest, with an increase of 6.23%, 6.07%, and 7.39% in N1 compared to the N2, N3, and N4 treatments, respectively. With the increase of irrigation amount, the increase in the total nitrogen content of each organ showed a slow decreasing trend. The increase was only 1.62% between the W1 and W2 treatments, and the total nitrogen content of leaves was most significantly affected by the irrigation amount.
The soil in the root box was homogeneous, and the initial nitrogen content was consistent in all soil layers. When the total nitrogen accumulation in the soil is positive, it indicates that the amount of nitrogen applied is higher than the total nitrogen uptake by the plants from the soil. Additionally, the total nitrogen content of the soil at the end of the reproductive period has increased compared to its initial content (Figure 5). With the increase of nitrogen application amount and irrigation amount, there is a significant increasing trend in the total nitrogen accumulation in the soils at the depth of 0-17 cm and 34-50 cm. The differences between N4W1 and N3W3, between N3W1 and N2W3, and between N2W1 and N1W3 were relatively small, with the maximum difference being only 0.002 mg/g.
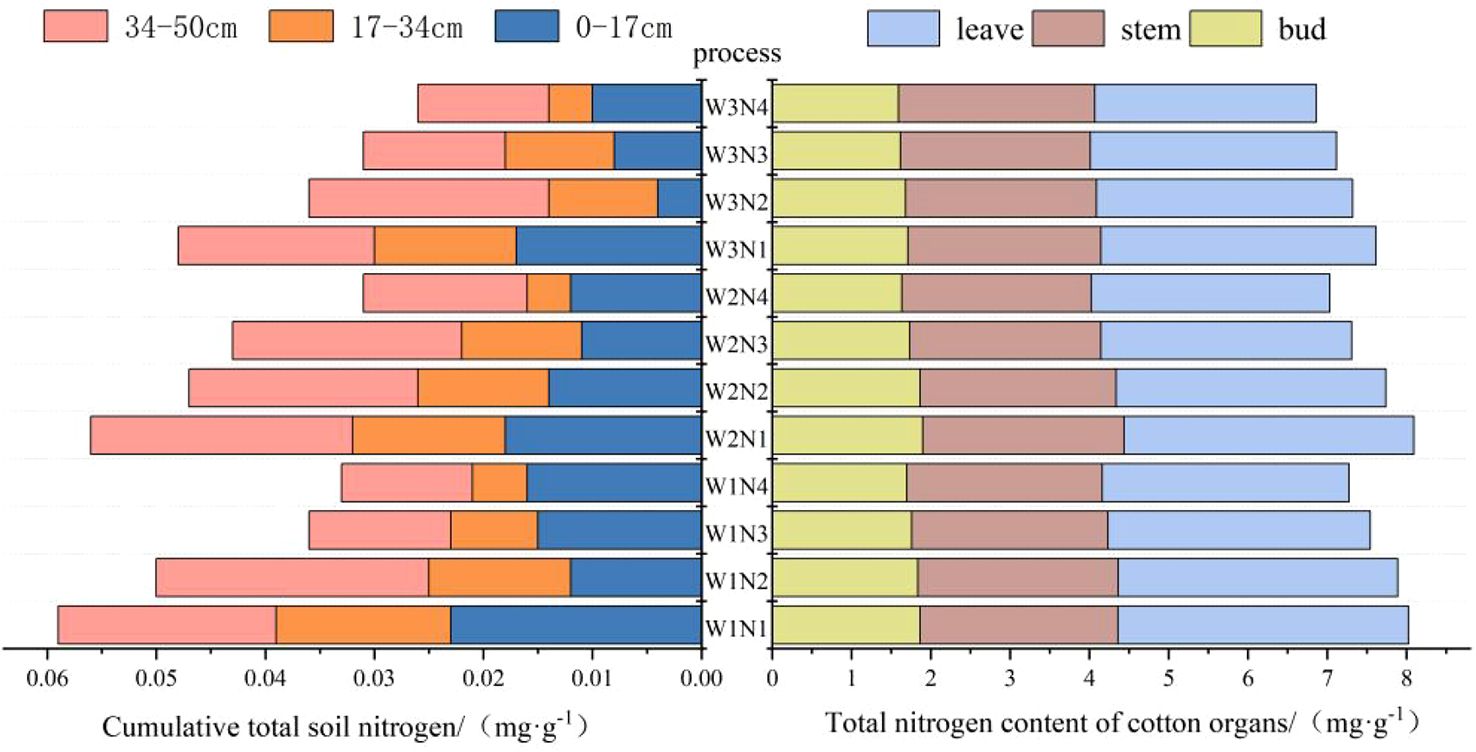
Figure 5. Total nitrogen accumulation in each soil layer of root box and total nitrogen content in each organ of cotton.
3.2.2 Soil total nitrogen accumulation in the field and the distribution of total nitrogen content in various organs of cotton in group plants
The total nitrogen nutrient uptake by each organ of cotton can characterize its nutrient supply capacity under the regulation of water and nitrogen. The nitrogen content of each organ was demonstrated as leaf>stem>root (Figure 6). Hydro-nitrogen interactions enhanced the total nitrogen absorption capacity of cotton organs. The nitrogen uptake of each organ reached the maximum under the N2 treatment. Among them, the nitrogen content of the root system displayed the most significant change, increasing by 12.06%, 11.82%, and 22.24% compared to that of N1, N3, and N4, respectively. The irrigation amount was positively correlated with the total nitrogen content uptake by cotton organs. Compared with the W2 and W3 treatments, the nitrogen content in roots, stems, and leaves increased by 6.74%, 24.83%, 15.10%, 16.14%, 9.13%, and 26.57%, respectively, under the W1 treatment.
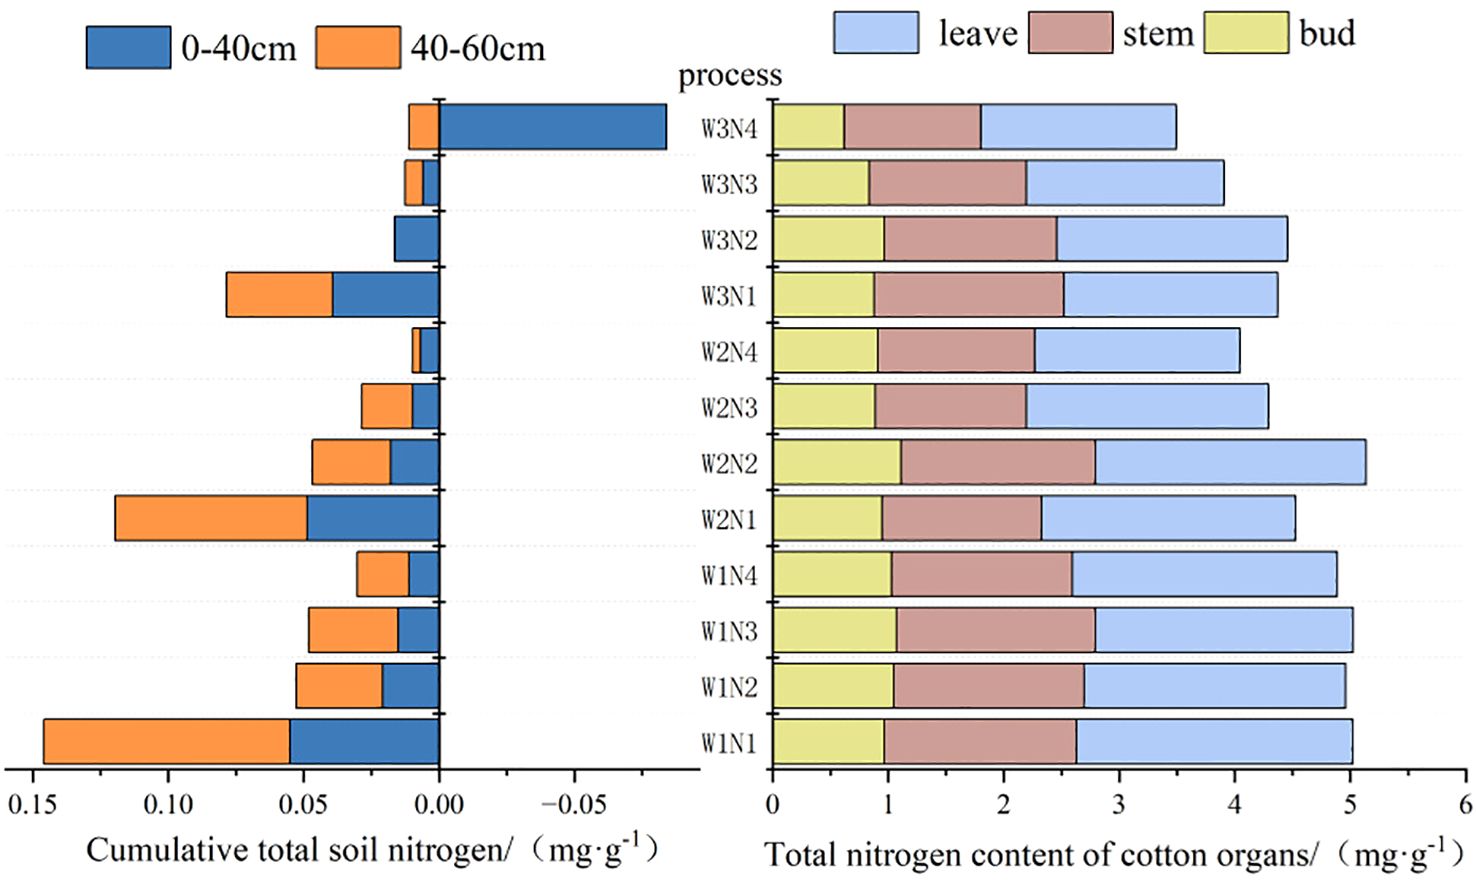
Figure 6. Soil-level total nitrogen accumulation in the root zone and total nitrogen content of various organs in cotton in the field.
The accumulation of total soil nitrogen at the end of the reproductive period exhibited an increasing trend with the increase in irrigation amount and nitrogen application. Conversely, the accumulation of total nitrogen content in the 0 - 40 cm soil layer displayed a decreasing trend under the lowest levels of irrigation amount and nitrogen application. The accumulation of soil nitrogen in each soil layer was more significantly affected by nitrogen application, and it showed a decreasing trend as nitrogen application decreased.
3.3 Contribution analysis of soil and plant total nitrogen transformations
3.2.1 Analysis of the contribution of root box soils to total nitrogen transformation in cotton with a single plant
There was a correlation among the total nitrogen content of the plant, the nitrogen application amount, the irrigation amount, and the total nitrogen accumulation in each soil layer (Figure 7). The total nitrogen content of cotton was mainly derived from nitrogen application and the initial soil nitrogen content. The total soil nitrogen content was mainly derived from nitrogen application, the total nitrogen uptake by cotton, and the influence of adjacent soil layers. There was a significant positive correlation between the irrigation amount and the total nitrogen accumulation in the 0 - 17 cm soil layer. This correlation decreased as the soil depth increased; The correlation between plant nitrogen uptake and total nitrogen accumulation was the greatest in the 17 - 34 cm soil layer, and this correlation was even more pronounced in the 34 - 50 cm soil layer. The correlation between plant nitrogen uptake and total nitrogen accumulation was the greatest in the 17 - 34 cm soil layer. In contrast, the total nitrogen accumulation in the 34 - 50 cm soil layer was less affected by the irrigation amount and nitrogen application rate.
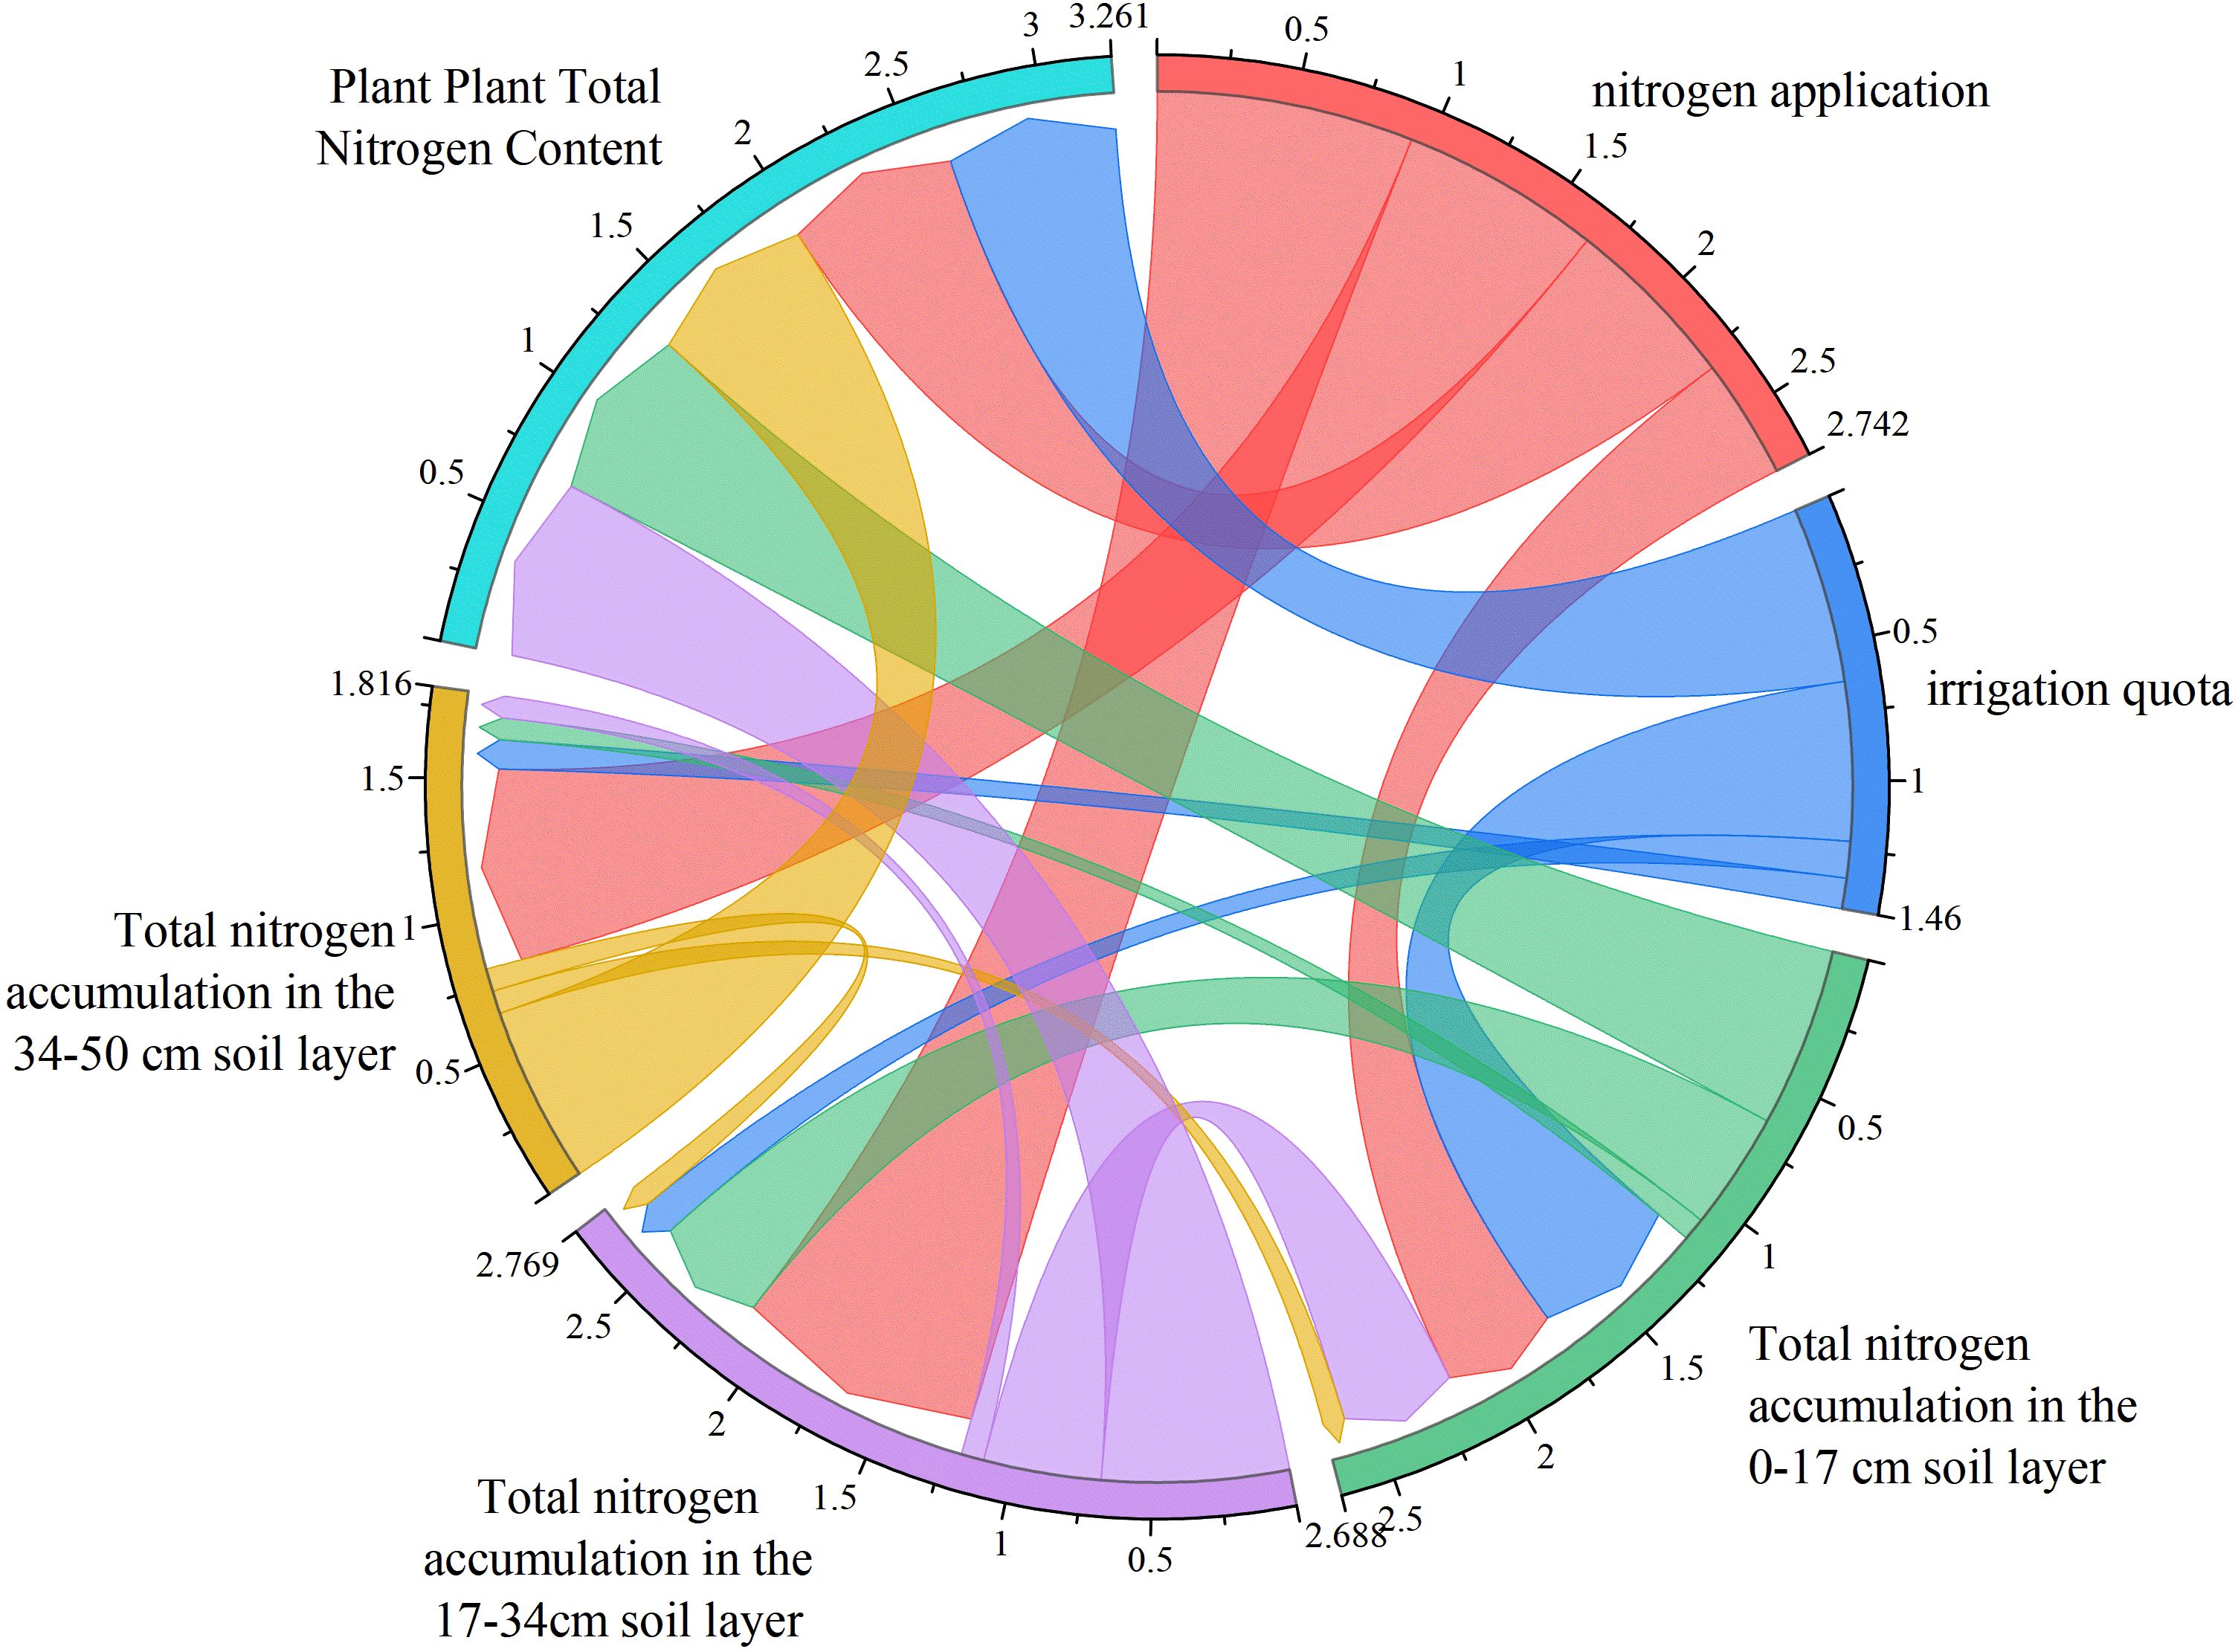
Figure 7. Interrelationships between nitrogen application, irrigation schedules, root box soil total nitrogen content and cotton total nitrogen content.
The contributions of irrigation amount, nitrogen application, and plant nitrogen content to plant nitrogen content and soil nitrogen accumulation in each soil layer were quantified by the random forest model (Table 3). The contribution of water to plant nitrogen content was slightly greater than that of nitrogen fertilizer. Regarding the contributions of each factor to soil nitrogen accumulation, the order was nitrogen application > plant nitrogen uptake > irrigation amount, and this pattern was more pronounced in the 34 - 50 cm soil layer.
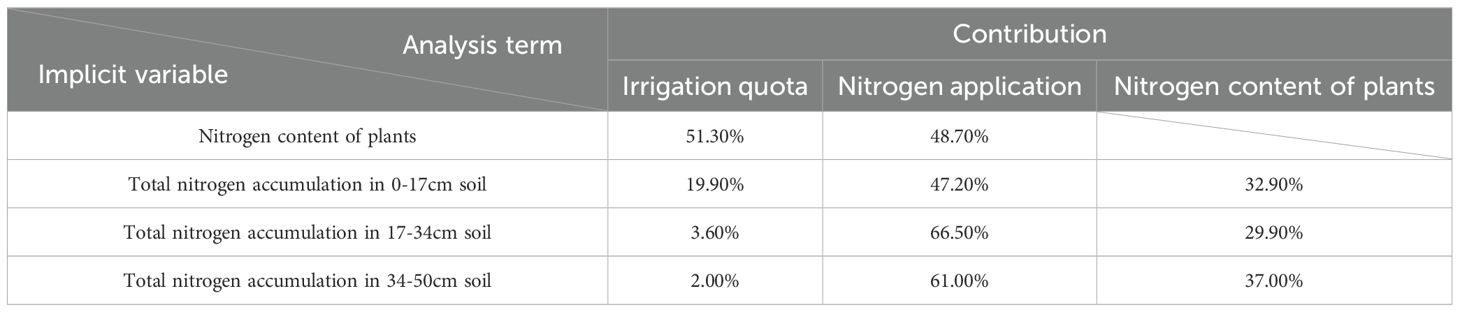
Table 3. Weighting analysis of different factors on nitrogen content of root box plants and total soil nitrogen accumulation based on the random forest model.
3.2.2 Contribution analysis of total nitrogen transformation of cotton in field soil and cluster plant
The total nitrogen accumulation in cotton and all soil layers was affected by the irrigation amount and nitrogen application (Figure 8). The total nitrogen accumulation in the 0 - 60 cm soil layer during the reproductive period was positively correlated with the irrigation amount and nitrogen application, and the correlation with the irrigation amount was the greatest. The total nitrogen content in the 0 - 40 cm soil layer was affected by the direct effects of irrigation and nitrogen application. When the nitrogen application rate remained unchanged. When the nitrogen application amount remained unchanged, an increase in the irrigation amount was conducive to the dissolution and transfer of nitrogen fertilizer. Moreover, the increase in the irrigation amount facilitated the transport of nitrogen from the upper layers to the 40 - 60 cm soil layer, thereby increasing the total nitrogen accumulation; The total nitrogen content of plants was positively correlated with the nitrogen application amount, the total nitrogen accumulation in the 0 - 40 cm layer, the irrigation amount, and the total nitrogen accumulation in the 40 - 60 cm layer. The correlation between the plant total nitrogen content and nitrogen application, the total nitrogen accumulation in the 0 - 40 cm soil layer, the irrigation amount, and the total nitrogen accumulation in the 40 - 60 cm soil layer exhibited a decreasing trend, and this correlation was significantly affected by nitrogen application.
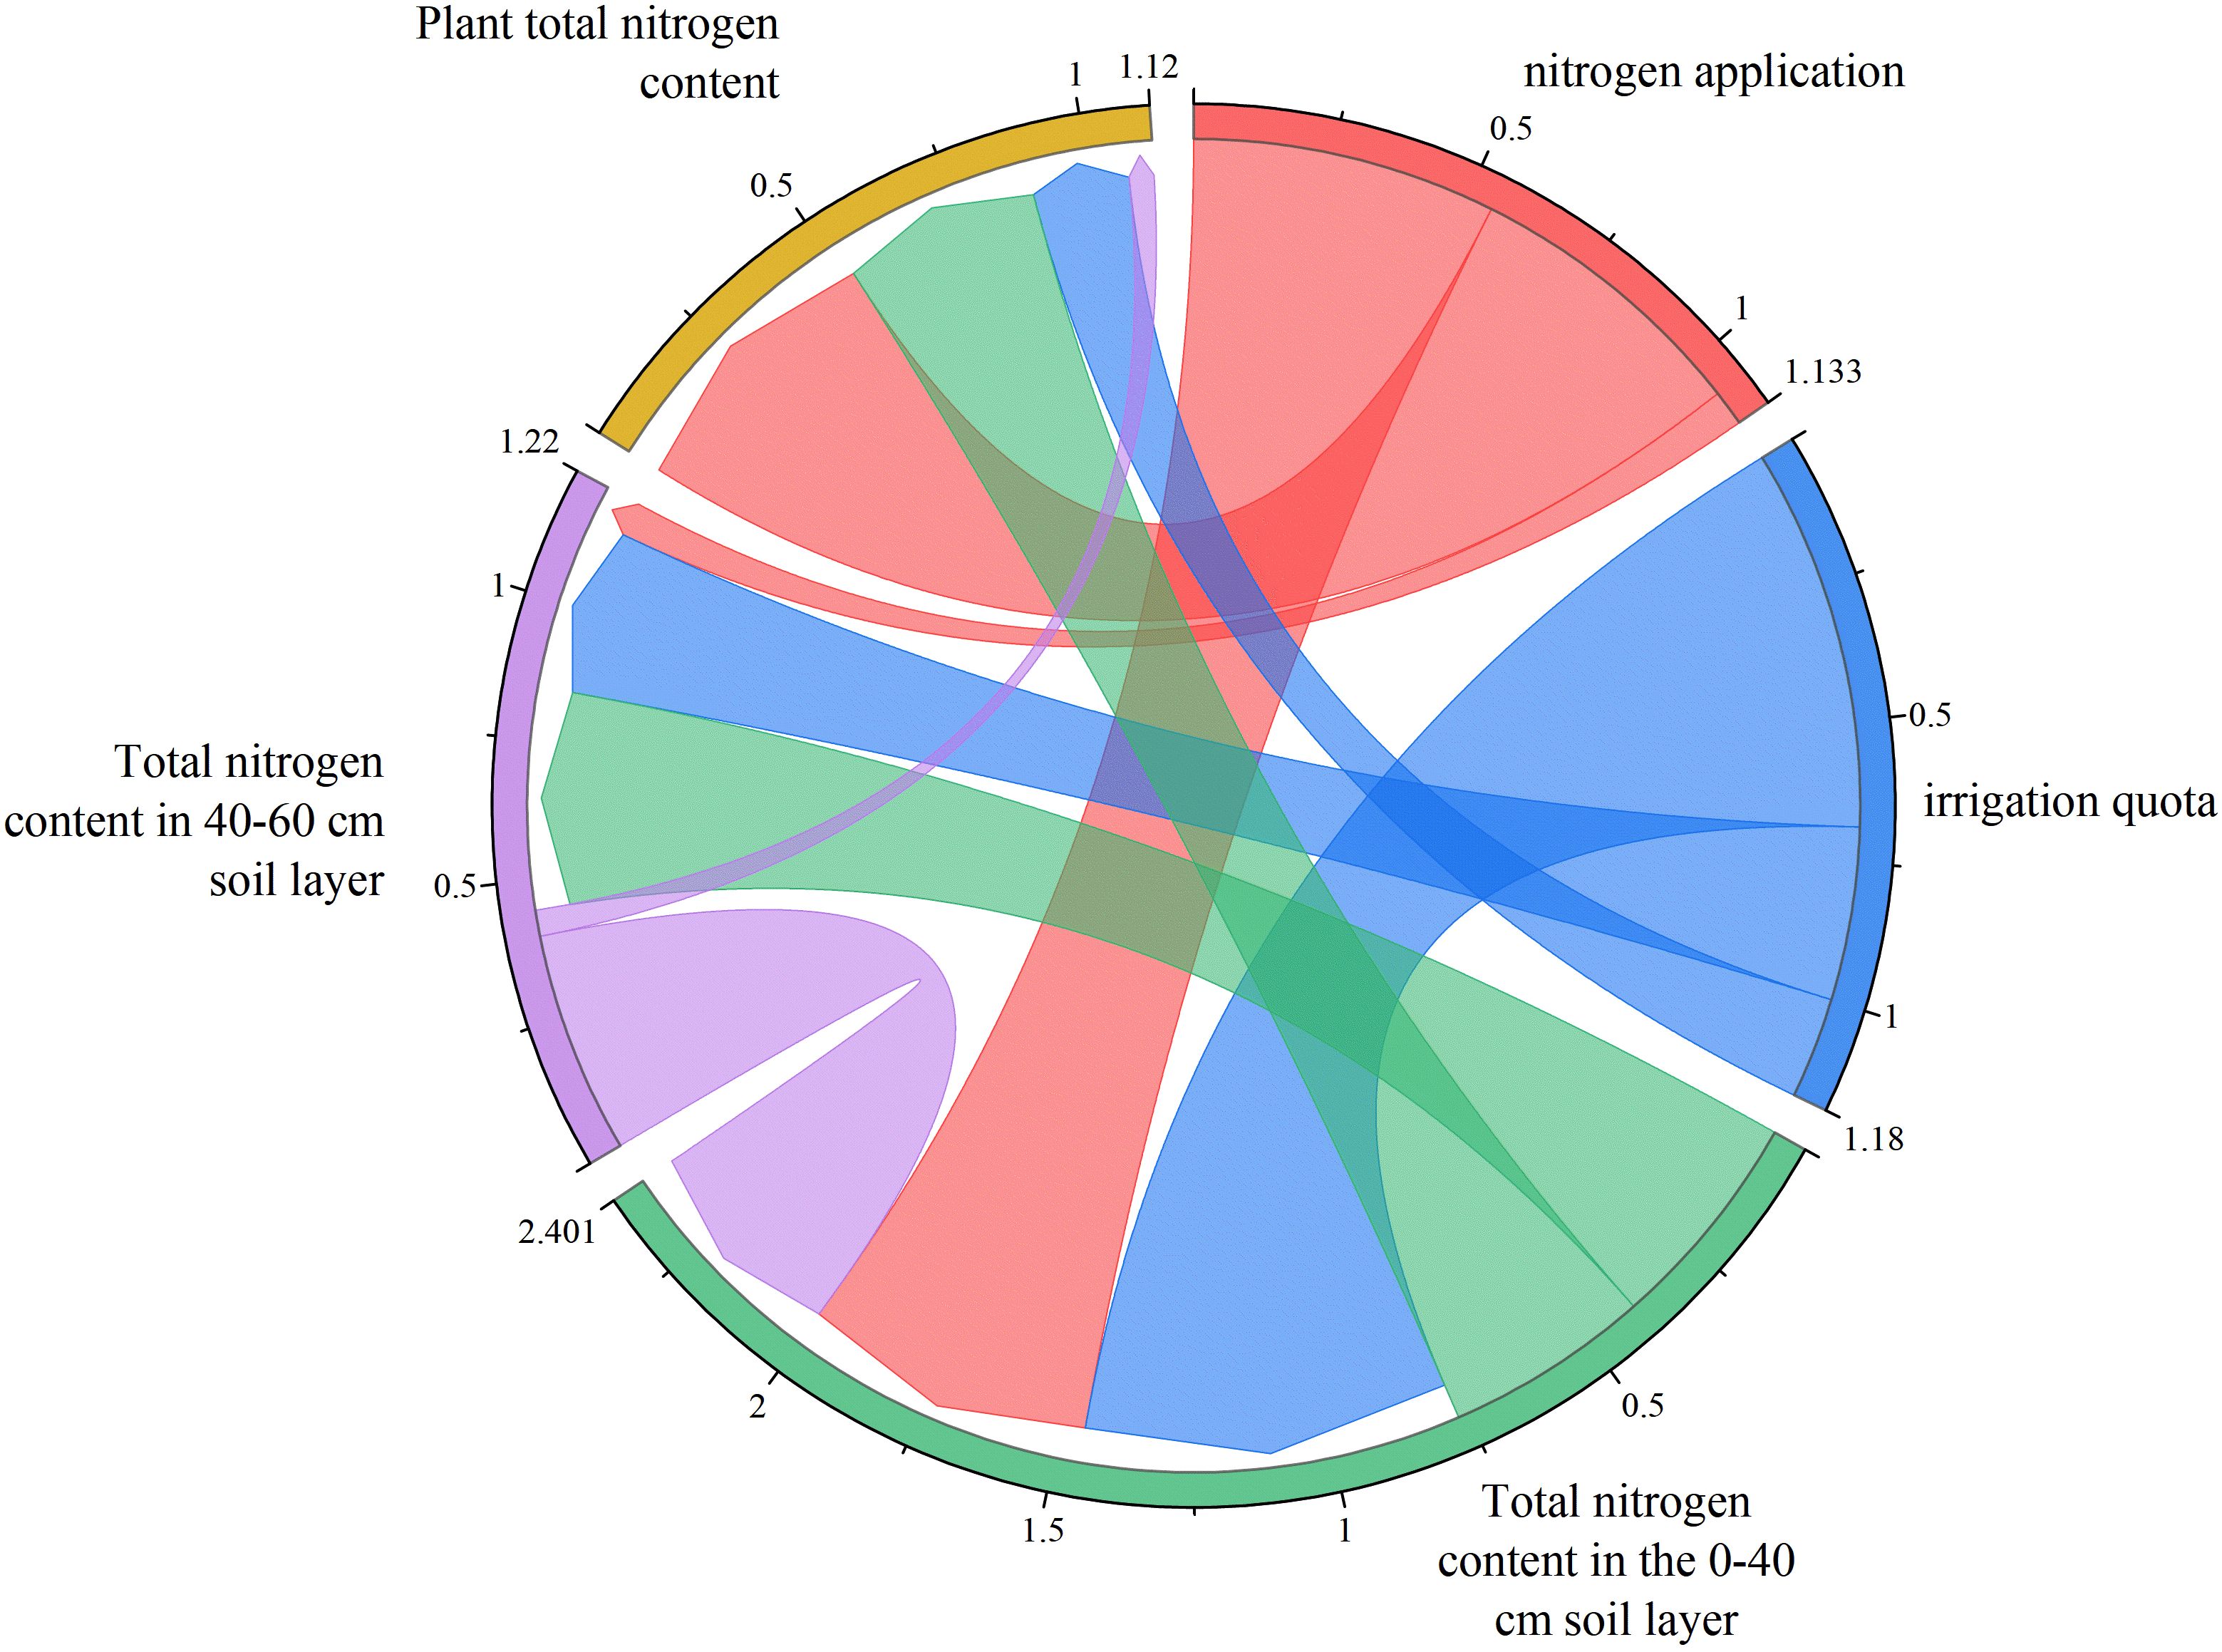
Figure 8. Interrelationships between nitrogen application, irrigation quotas, field soil total nitrogen content and cotton total nitrogen content.
The contribution of each feature was obtained by normalizing the importance scores of the features in the random forest modelling (Table 4). This table characterizes the contributions of nitrogen application, irrigation amount, the initial nitrogen content of the 0 - 40 cm and 40 - 60 cm soil layers, and plant nitrogen content to plant nitrogen content, as well as the total nitrogen accumulation in the 0 - 40 cm and 40 - 60 cm soil layers, respectively. The contribution of the irrigation amount to plant nitrogen content was relatively large (48.00%); regarding the contribution to the total nitrogen accumulation in the 0 - 40 cm soil, plant nitrogen content had the greatest contribution (28.6%), while the irrigation amount had the least (0.4%). For the total nitrogen accumulation in the 40 - 60 cm soil, the order of contribution magnitudes was as follows: initial nitrogen content in the 0 - 40 cm soil > nitrogen application > plant nitrogen content > irrigation amount.
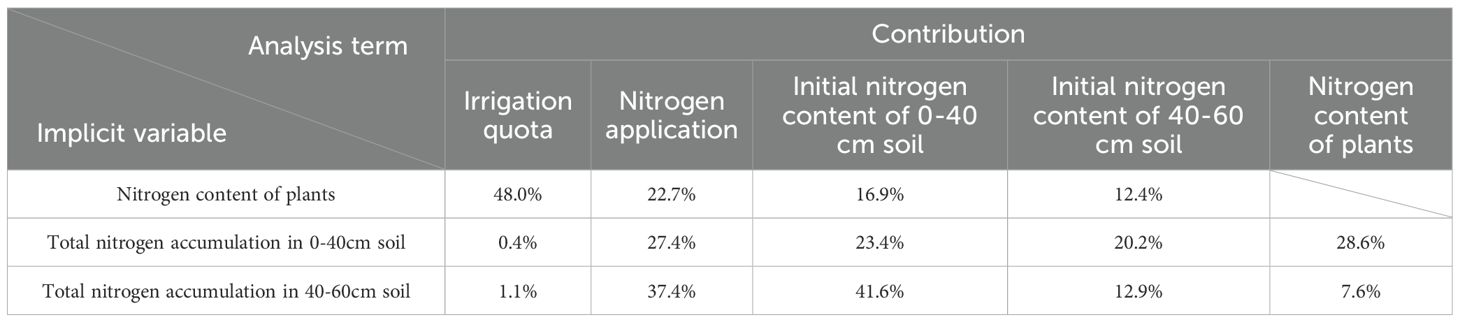
Table 4. Weighting analysis of different factors on nitrogen content of field plants and total nitrogen accumulation in soil based on the random forest model.
4 Discussion
4.1 Effect of reduced nitrogen fertilizer application on cotton root growth
As a key functional organ for crop water and nutrient uptake and transport, the three - dimensional structure of the root system regulates the transport pathways of soil water and nutrients. This spatial structure forms a synergistic mechanism with the partitioning of canopy photosynthetic products, which together determine the dynamics of above - ground crop accumulation and the efficiency of coupled water and nitrogen resource utilization (Zhang et al., 2017). The root length and density of both single - plant and clustered cotton were positively correlated with the irrigation amount and nitrogen application rate; In contrast, for the remaining root indicators, single cotton plants were more significantly influenced by water and nitrogen in the shallow soil layer (0 - 15 cm). In the deeper soil layers, due to a more dispersed root system with weaker water and nitrogen - holding capacity, the plants showed no significant response to water and nitrogen during growth (Li et al., 2020b). The overall impact of irrigation amount and nitrogen application on group - plant cotton is relatively small. This is because the root system of single - plant cotton is free from inter - plant competition, enabling more concentrated water and nutrient uptake, and the root system exhibits stronger growth potential. However, the limited space and environmental conditions impose certain constraints on its growth, ultimately leading to differences in the root growth distribution between single - plant and group - plant cotton. Overall, during the cotton growth period, when the irrigation amount is decreased, the root system tends to grow towards the water source, especially towards the drip emitter and deeper soil layers, in order to meet its own water requirements (Luo et al., 2024). Under higher nitrogen stress, root growth is inhibited, which reduces the root’s ability to acquire soil water and nutrients. However, an appropriate reduction in nitrogen fertilizer application can instead promote root elongation. This promotes increased access to and uptake of water and nutrients, which are essential for plant growth. A reduction in water - nitrogen application also leads to the development of more root hairs in the root system (Zhang et al., 2018), This increases the contact area with the soil, enhances the nutrient uptake capacity, meets the material requirements for aboveground physiological growth, and promotes the crop’s reproductive growth in the later stag (Xie et al., 2009). Root development can be enhanced by moderately increasing the irrigation amount without changing the nitrogen application rate. Therefore, the rational allocation of water and nitrogen fertilizer can facilitate the healthy growth of cotton.
4.2 Effect of reduced nitrogen fertilizer application on the distributional characteristics of total nitrogen content and the contribution of transformation in soil and group plant cotton
After absorbing total nitrogen from the soil, the root system transported it to various organs through the vascular bundle system, leading to differences in the amount of nitrogen acquired and absorbed by various organs. As the main organs for photosynthesis and respiration in cotton, leaves and stems had a higher nitrogen content than the root system. Among them, the nitrogen content in leaves was most responsive to the combined effects of the irrigation amount and nitrogen application rate (Lv et al., 2015). In contrast, the root system’s ability to absorb total nitrogen was influenced by its growth distribution, which decreased with increasing soil depth. At the end of the reproductive period, the total nitrogen content of each soil layer was affected by nitrogen application during this period, uptake and utilization by the cotton root system, nitrogen transport driven by irrigation, and the impact of the microenvironment. Results from both root box and field experiments showed that soil water can promote nutrient uptake and utilization by crop roots. However, over - irrigation will cause total nitrogen to be transported with water to the lower soil layer, thereby limiting nutrient uptake by crop roots (Xu et al., 2021; Liao et al., 2024) ;In addition, in the root box, which is a closed space, nutrient transport is restricted. The shallow soil is the direct area for nitrogen fertilizer acquisition. During the reproductive period, it is most affected by the external environment. The accumulation of total nitrogen and the upward migration of total nitrogen make the total nitrogen content of this soil layer higher at the end of the reproductive period. Moreover, the subsoil is affected by the nitrogen fertilizer from the upper soil layer due to the effects of rainfall, irrigation, etc. Meanwhile, the root system has a lower capacity for nitrogen uptake, which leads to the continuous accumulation of total nitrogen in this layer. In the soil layer ranging from 15 to 35 cm, the root system was more developed and had a stronger ability to absorb total nitrogen. However, due to the influence of nutrient migration, the accumulation of total nitrogen in this layer was relatively less.
4.3 Differential analysis of cotton root growth and total nitrogen content between single and group plants
The root system indicators of single - plant and group - plant cotton under the same unit water and nitrogen conditions are different (Wang et al., 2024), The average values of root system indicators under unit - water conditions are higher than those in the field trial (Table 5). This is because the amount of water applied in the field is relatively small, resulting in better overall growth of root system indicators. Moreover, due to spatial confinement, the root system remains more intact. In the field trial, however, large - scale irrigation led to incomplete access of the cotton root system (Chen et al., 2018b; Zhao et al., 2025), causing the indicators to be relatively low. When facing the same external environmental changes, single - plant cotton was more affected than group - plant cotton. Since the amount of nitrogen fertilizer applied in the root box test was significantly smaller than that in the field test, and the enclosed space of the root box prevented lateral seepage and deep leakage, the recovery and utilization efficiency of nitrogen fertilizer was relatively high (Kang et al., 2025). Even when affected by external environmental factors, the root system indicators per unit of nitrogen fertilizer were significantly higher than those in the field experiment. the root system indicators per unit of nitrogen fertilizer were significantly higher than those in the field test. Under unit water and nitrogen fertilization conditions, the root system indicators generally showed greater variability in the root box test. This is because in the field trial, the differences in water treatments significantly affect the changes in the main root system. In contrast, in the root box, the differences in water treatments are not significant, and due to the limited size of the enclosed space reducing the water loss pathway, the root system shows less variability among treatments.
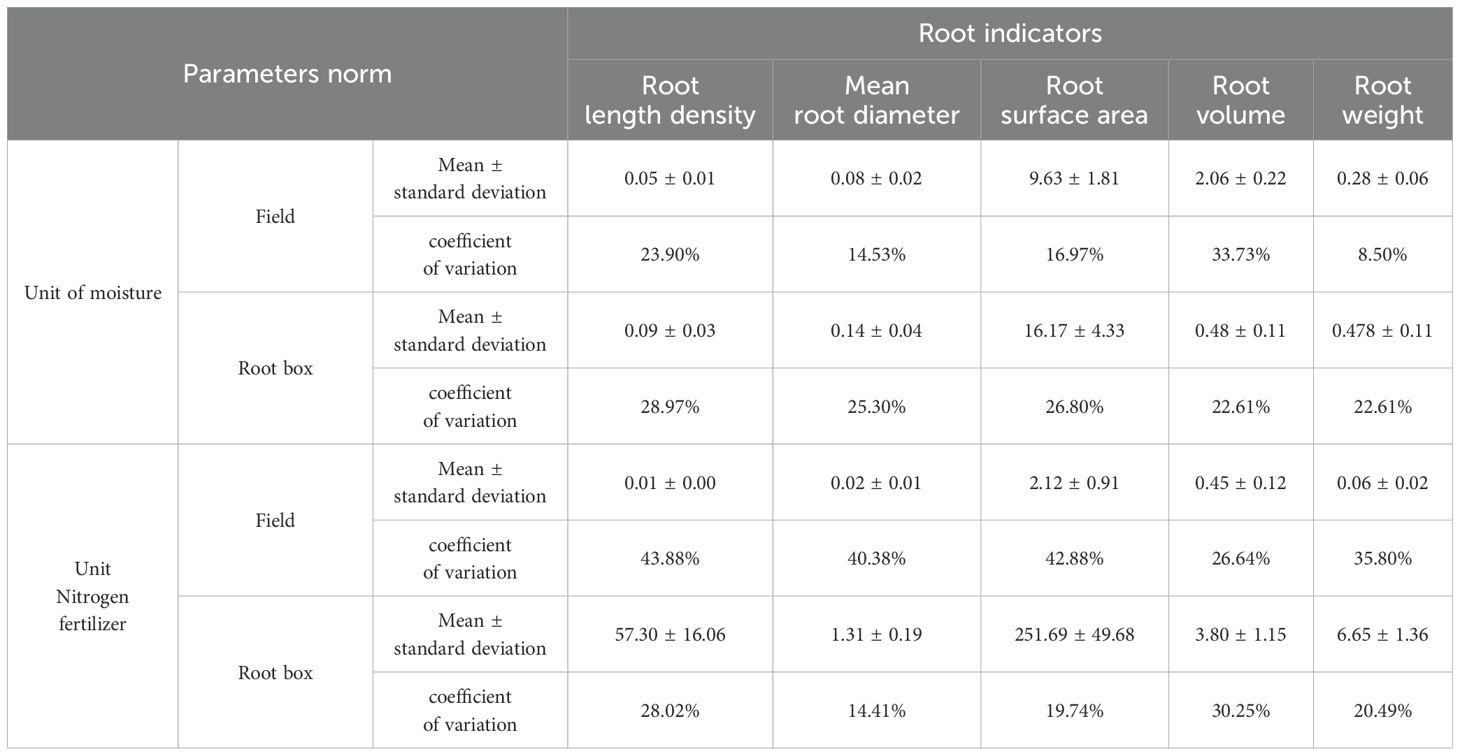
Table 5. Differential analysis of various indicators of unit water and nitrogen root system in root box and field trials.
The nitrogen content in single - plant and group - plant cotton, as well as the nitrogen accumulation in the soil layers of cotton (Table 6) fields, differ. Regarding the nitrogen content of cotton plants in the root box and field tests, the average nitrogen content of all organs of cotton in the root box test is higher than that in the field test. Meanwhile, the variability in the average total nitrogen content of roots and stems is relatively small. This is because, in the field test, group - plant cotton growth is affected by competition and interference among plants. In contrast, the root box has a limited space, and the differences in single irrigation amount and nitrogen application rate among treatments are not very significant. Moreover, the closed area of the root box blocks the nitrogen fertilizer loss pathway, resulting in smaller differences in plant nitrogen content and a higher plant nitrogen content compared to the field trial. The total nitrogen accumulation in the soil layer was similar to that in the plants. In the root box trial, due to its smaller scale, the soil quality and initial nutrients were more homogeneous. In contrast, in the field trial, the homogeneity of the soil quality was affected by factors such as topography, soil type, and geographical location. Additionally, soil nutrients were influenced by the soil micro - environment, groundwater, and weed growth, leading to variations in nutrient content among different locations and soil layers.
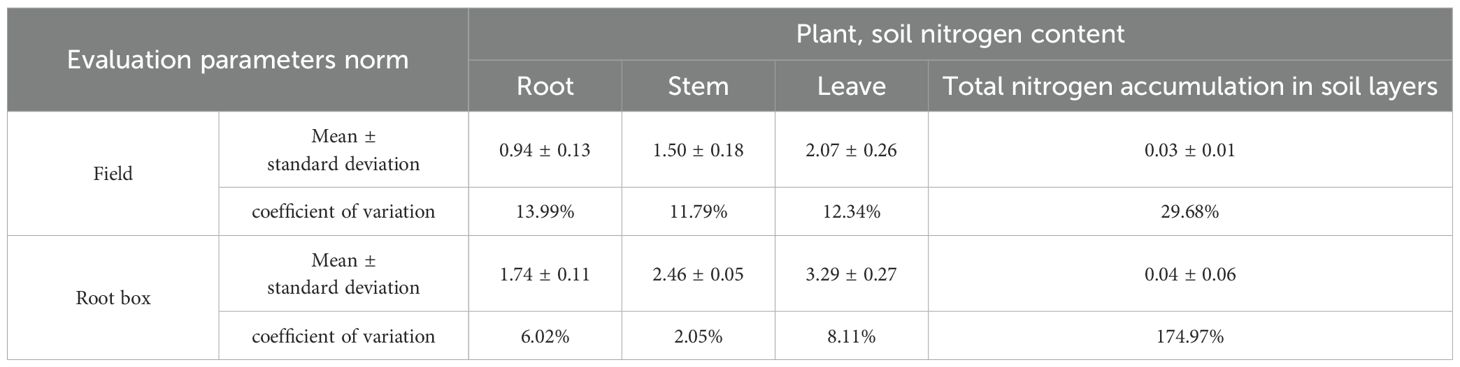
Table 6. Differential analysis of plant and soil nitrogen content in root box and field trials.
5 Conclusion
(1) Cotton root system indicators are significantly affected by water - nitrogen interactions. In the 15 - 50 cm soil layer, the average diameter of the single - cotton root system responds more strongly to water, and some indicators exhibit a better growth trend under the W3N3 treatment. For group - plant cotton, under the W1 treatment, the differences in root length density and diameter between the N1 and N2 treatments are small. However, under the N4 treatment, the root surface area density shows a significant response to irrigation. Moreover, the maximum difference in root weight occurs between the N1 and N2 treatments under W1 and between the N3 and N4 treatments under W3. (2) The total nitrogen content of all organs of cotton plants followed the order: leaf > stem > root, and it was positively correlated with the amount of nitrogen applied. The nitrogen content of cotton plants in the root box was significantly and positively correlated with all influencing factors. In contrast, the nitrogen content of cotton plants in the field showed a weak correlation with other factors. (3) In the root box test, the contribution of nitrogen application to the total nitrogen accumulation in each soil layer was the largest (accounting for 47.2% - 44.5%). In the field test, the initial total nitrogen content of the 0 - 40 cm soil layer had the greatest proportion (41.6%) in the total nitrogen accumulation of the 40 - 60 cm soil layer. (4) For both single and group cotton plants, their responses to water and nitrogen are basically the same. Under conditions of moderate nitrogen reduction and water conservation, they can unleash their own growth potential. Moreover, these conditions can reduce nitrogen leaching from the soil, enhance nitrogen utilization efficiency, and mitigate the environmental risks caused by excessive nitrogen application.
Data availability statement
The raw data supporting the conclusions of this article will be made available by the authors, without undue reservation.
Author contributions
SW: Methodology, Conceptualization, Writing – original draft, Data curation, Validation. JZ: Supervision, Writing – review & editing, Conceptualization, Funding acquisition. CW: Funding acquisition, Conceptualization, Supervision, Writing – review & editing, Methodology. TY: Data curation, Validation, Writing – original draft.
Funding
The author(s) declare that financial support was received for the research and/or publication of this article. This work was supported by Xinjiang Uygur Autonomous Region 14th Five Year Plan Major Special Project (2023A02002-5), Xinjiang Key Laboratory of Hydraulic Engineering Safety and Water Disaster Prevention and Control Project (ZDSYS-YJS-2022-03)), and Supported by the Core Program for Agriculture, Rural Areas and Farmers (2024SNGGGCC021).
Conflict of interest
The authors declare that the research was conducted in the absence of any commercial or financial relationships that could be construed as a potential conflict of interest.
Generative AI statement
The author(s) declare that no Generative AI was used in the creation of this manuscript.
Publisher’s note
All claims expressed in this article are solely those of the authors and do not necessarily represent those of their affiliated organizations, or those of the publisher, the editors and the reviewers. Any product that may be evaluated in this article, or claim that may be made by its manufacturer, is not guaranteed or endorsed by the publisher.
References
Araus V., Swift J., Alvarez J. M., Henry A., and Coruzzi G. M. (2020). A balancing act: how plants integrate nitrogen and water signals. J. Exp. Bot. 71, 4442–4451. doi: 10.1093/jxb/eraa054
Bai Y., Shen H., Xue Q., Ni M., Wang J., and Qian X. (2007). Effect of root growth of different genotype rice under the condition of different water and nitrogen forms. J. Irrigation Drainage 26, 69–72. doi: 10.13522/j.cnki.ggps.2007.06.018
Chen W., Jin M., Ferré T., Liu Y., Xian Y., Shan T., et al. (2018b). Spatial distribution of soil moisture, soil salinity, and root density beneath a cotton field under mulched drip irrigation with brackish and fresh water. Field Crops Res. 215, 207–221. doi: 10.1016/j.fcr.2017.10.019
Chen J., Liu L., Wang Z., Sun H., Zhang Y., and Lu Z. (2018a). Determining the effects of nitrogen rate on cotton root growth and distribution with soil cores and minirhizotrons. PLoS One 13, e0197284. doi: 10.1371/journal.pone.0197284
Ding W., Zeng K., Wu P., Li P., Wu Y., Yi Q., et al. (2024). Effect of magnesium, boron and zinc with lime application on grain yield, quality and improvement of acidified soil of double-cropped rice in South China. Chin. J. Eco-Agriculture, 1–11. doi: 10.12357/cjea.20240773
Du T., Kang S., Zhang J., and Li F. (2008). Water use and yield responses of cotton to alternate partial root-zone drip irrigation in the arid area of north-west China. Irrigation Sci. 26, 147–159. doi: 10.1007/s00271-007-0081-0
Gregory P. J. (2006). Roots, rhizosphere and soil: the route to a better understanding of soil science? Eur. J. Soil Sci. 57 (1), 1–12. doi: 10.1111/j.1365-2389.2005.00778.x
Huo J., Yu A., Wang Y., Wang P., Yin B., Liu Y., et al. (2025). Effect of organic manure substitution for chemical fertilizer on yield, quality, and nitrogen utilization of sweet corn in oasis irrigation areas. Acta Agronomica Sin., 1–15. Available online at: http://kns.cnki.net/kcms/detail/11.1809.S.20250507.1420.010.html.
Kang M., Xu M., Guo Y., Qiao L., He X., and Lan X. (2025). Strategies to narrow down rainfed maize yield gap by decomposing gap sources across the East Loess Plateau of China. Field Crops Res. 331, 109997. doi: 10.1016/j.fcr.2025.109997
Qiao L., He X., and Lan X. (2025). Strategies to narrow down rainfed maize yield gap by decomposing gap sources across the East Loess Plateau of China. Field Crops Res. 331, 109997. doi: 10.1016/j.fcr.2025.109997
Li L., Hu Z., Tan G., Fan J., Chen Y., Xiao Y., et al. (2023). Enhancing plant growth in biofertilizer-amended soil through nitrogen-transforming microbial communities. Front. Plant Sci. 14, 1259853. doi: 10.3389/fpls.2023.1259853
Li D., Li M., Shen X., Zhou X., Sun H., Zhao Y., et al. (2020b). Response of spatial structure of cotton root to soil–wetting patterns under mulched drip irrigation. Int. J. Agric. Biol. Eng. 13, 153–162. doi: 10.25165/j.ijabe.20201305.5790
Li X., Liu H., and Lin E. (2020a). Analysis of nitrogen utilisation of drip irrigated grapes in arid area based on 15N tracer technology. J. Nucl. Agric. Sci. 34, 2551–2560. doi: 10.11869/j.issn.100-8551.2020.11.2551
Liang Y. and Chen P. (1995). Effects of water stress and nitrogen nutrition on root and seedling growth and water use efficiency of wheat. Acta Botanica Boreali-Occidentalia Sin. 15, 21–25. doi: 10.13287/j.1001-9332.20150820.003
Liao H., Liu K., Hao H., Yong Y., Zhang W., and Hou Z. (2024). Effects of irrigation amount and nitrogen rate on cotton yield, nitrogen use efficiency, and soil nitrogen balance under drip irrigation. Agronomy 14, 1671. doi: 10.3390/agronomy14081671
Luo L., Xiao Q., Dong H., Xu W., Li P., Ma Y., et al. (2023). Response of cotton root distribution to irrigation frequency under the one film-three rows cultivation mode in southern Xinjiang. Cotton Sci. 35, 51–62. doi: 10.11963/cs20220029
Luo Y., Yin H., Ma Y., Wang J., Che Q., Zhang M., et al. (2024). Optimizing nitrogen fertilizer for improved root growth, nitrogen utilization, and yield of cotton under mulched drip irrigation in southern Xinjiang, China. Sci. Rep. 14, 23223. doi: 10.1038/s41598-024-73350-7
Lv N., Yin F., Chen Y., Gao Z., Liu Y., and Shi L. (2015). Effects of elevated atmospheric CO2 and nitrogen application on cotton biomass, nitrogen utilization and soil urease activity. Chin. J. Appl. Ecol. 26, 3337–3344.
Song L., Wang H., and Xu Y. (2025). Characteristics of spatial and temporal evolution of water footprint of agricultural production and evaluation of water resources carrying capacity in Xingkai Lake irrigation area. J. Agric. Machinery 56, 437–450. doi: 10.6041/j.issn.1000-1298.2025.03.043
Wang S., Wang C., and Wu C. (2024). Experimental study on soil hydrothermal salt migration law in a single irrigation cycle in submembrane drip irrigated cotton fiel in Northern Xinjiang. Chin. J. Soil Sci. 55, 651–660. doi: 10.19336/j.cnki.trtb.2022111804
Wang W., Xin W., Chen N., Yang F., Li J., Qu G., et al. (2023). Transcriptome and co-expression network analysis reveals the molecular mechanism of rice root systems in response to low-nitrogen conditions. Int. J. Mol. Sci. 24, 5290. doi: 10.3390/ijms24065290
Xie Z., Tian C., and Bian W. (2009). Effect of water nitrogen on cotton root architecture under film drip irrigation. Cotton Sci. 21, 508–514. doi: 10.11963/cs090613
Xu C., Yan W., Sun N., Liu X., Zhao H., Tan H., et al. (2021). The impacts of irrigation amount on physiological characteristics and yield of spring maize. J. Irrigation Drainage 40, 7–14.
Yang R. (2017). Study on the mechanism of the interaction between water and phosphorus on the root morphology and phosphorus efficiency of cotton (Xinjiang, China: Xinjiang Agricultural University). doi: 10.13522/j.cnki.ggps.2020227
Ye T., Ma J., Zhang P., Shan S., Liu L., Tang L., et al. (2022). Interaction effects of irrigation and nitrogen on the coordination between crop water productivity and nitrogen use efficiency in wheat production on the North China Plain. Agric. Water Manage. 271, 107787. doi: 10.1016/j.agwat.2022.107787
Zhang H., Fu X., Wang X., Gui H., Dong Q., Pang N., et al. (2018). Identification and screening of nitrogen–efficient cotton genotypes under low and normal nitrogen environments at the seedling stage. J. Cotton Res. 1, 1–11. doi: 10.1186/s42397-018-0006-x
Zhang H., Khan A., Tan D., and Luo H. (2017). Rational water and nitrogen management improves root growth, increases yield and maintains water use efficiency of cotton under mulch drip irrigation. Front. Plant Sci. 8, 912. doi: 10.3389/fpls.2017.00912
Zhao B., Tong L., Liu H., Hao M., and Zhang R. (2025). Optimizing root morphology is a key to improving maize yield under nitrogen reduction and densification cultivation. Field Crops Res. 329, 109958. doi: 10.1016/j.fcr.2025.109958
Keywords: reduced nitrogen fertilization, single plant, group of plants, cotton root growth, water nitrogen contribution rate
Citation: Wang S, Zhao J, Wang C and Yang T (2025) Mechanisms of improved nitrogen utilization and root architecture in cotton under reduced fertilization: a comparative study of individual and group planting systems. Front. Agron. 7:1628600. doi: 10.3389/fagro.2025.1628600
Received: 14 May 2025; Accepted: 20 June 2025;
Published: 15 July 2025.
Edited by:
Jihong Zhang, Shihezi University, ChinaReviewed by:
Fucang Zhang, Northwest A&F University, ChinaXianghong Guo, Taiyuan University of Technology, China
Copyright © 2025 Wang, Zhao, Wang and Yang. This is an open-access article distributed under the terms of the Creative Commons Attribution License (CC BY). The use, distribution or reproduction in other forums is permitted, provided the original author(s) and the copyright owner(s) are credited and that the original publication in this journal is cited, in accordance with accepted academic practice. No use, distribution or reproduction is permitted which does not comply with these terms.
*Correspondence: Jinghua Zhao, MTA1NTEyMjc1QHFxLmNvbQ==; Chunxia Wang, NDEwNDQzMzU2QHFxLmNvbQ==