 Sophie Allebone-Webb1Felix Gossrau2
 Chloé Orland1*
 Gracian Takudzwa Bara3
 Cédric Fioekou1Annah Matsika2Karl Riber2
 Bader Mahaman Dioula1
- 1Department of Expertise and Advocacy, Action Against Hunger (Action contre la Faim), Montreuil, France
- 2Department of Operations, Action Against Hunger, Harare, Zimbabwe
- 3Department of Biological Sciences and Ecology, University of Zimbabwe, Harare, Zimbabwe
Pollinator populations have dramatically declined over the past 50 years, with over 40% of invertebrate pollinator species at risk of extinction largely due to intensive agriculture, pesticide use, habitat loss and climate change. Pollinators provide an essential ecosystem service, with about 75% of global crops relying on pollination by animals. It is therefore essential to reconsider conventional farming practices, which are largely responsible for this decline. By cultivating flowering crops known as “Marketable Habitat Enhancement Plants”, (MHEPs), alongside the edges of pesticide-free fields, the Farming with Alternative Pollinators (FAP) approach aims to enhance the presence of wild pollinators. In this study, we compared the performance of a total of 43 smallholder farmer plots using the FAP approach with plots following conventional approaches, for pollinator abundance and diversity, and for yield and income in Zimbabwe. We found significantly higher pollinator abundance and richness in FAP plots compared to control plots. There was significantly higher income and higher value of yields for all offtake in FAP plots for both crop cycles measured. Plots with higher pollinator abundance showed significantly higher income from all crops and significantly higher value of yields, showing a clear link between pollinator populations, crop production and income.
1 Introduction
Pollinator populations are declining globally, particularly in agricultural landscapes (Biesmeijer et al., 2006; Gill et al., 2016; Goulson, 2019; Goulson et al., 2015; Potts et al., 2010), largely due to multiple anthropogenic pressures such as land-use changes, agricultural intensification, monoculture, pollution (mainly by pesticides and fertilisers), pathogens, invasive species, and climate change (Gill et al., 2016; Potts et al., 2010; Sánchez-Bayo and Wyckhuys, 2019). An estimated 87% of flowering plants are dependent on pollinators, with this figure increasing to 94% in tropical communities (Ollerton et al., 2011). Consequently, declines to pollinator populations also impact the ecosystem services provided by these flowering plants and all those that depend on them, and can lead to interlinked degradation, cascades of extinctions, yield reduction, poverty spirals, and eventually “Pollinator Loss Syndrome” (Christmann, 2019; Dirzo et al., 2014).
Pollinator declines are particularly evident in agricultural landscapes, and yet 75% of food crops depend, at least partly, on animal pollination for fertilization (Klein et al., 2007). Pollination services for food production are thus vital for food production, with an estimated value of €153 billion in 2005 (Gallai et al., 2009), as well as for maintaining genetic diversity and resilience e.g. to climate change) (Christmann and Aw-Hassan, 2012), and yet agriculture itself can negatively impact the habitats and resources needed to sustain pollinators. In addition to the drivers above, agriculture and homogenous landscapes may also negatively impact pollinators through: 1) shorter flowering periods of homogenous crops that may be less than the time needed for pollinators to complete their life cycle; 2) monoculture crops that may not be suitable for specialist pollinators (those with narrow floral choices); and 3) pollinator independent crops (e.g. cereals such as wheat) which do not provide nectar or pollen for pollinators. Addressing drivers of pollinator decline and strengthening the protection and promotion of pollinator populations and pollinator diversity particularly in agricultural landscapes is therefore critical.
Farming with Alternative Pollinators (FAP) is an approach to both conserve and promote wild pollinators (i.e. ‘alternative’ pollinators to managed honeybees) in agroecosystems and to improve production and farmer incomes. By achieving social and ecological benefits through actions that sustainably manage and restore ecosystems while simultaneously addressing a societal challenge, it constitutes a nature-based solution (Cohen-Shacham et al., 2016). Developed by the International Center for Agriculture Research in the Dry Areas (ICARDA), FAP makes use of marketable habitat enhancement plants (MHEP) cultivated alongside the edges of farmer fields (Christmann and Aw-Hassan, 2012). The planting of MHEPs in FAP plots aims to improve pollinator habitats, thus increasing the diversity and abundance of wild pollinators, and consequently crop production both in terms of quantity and quality. The goal of this integrated agro-ecological socio-economic approach is that the resultant, visible increases in farmer income per surface area will motivate farmers to permanently adopt pollinator-friendly farming practices.
The FAP approach builds on evidence showing that native wild flowering plants are important for the conservation of pollinator populations in farmlands (Dicks et al., 2015; Nicholls and Altieri, 2013) and that sown wildflower strips also attract and provide habitat for wild pollinators, increasing the abundance and diversity of bumblebees (Carvell et al., 2007). Over the last two decades, wildflower strips along fields have been introduced in several European countries within the Agri-Environmental Schemes (AES) framework, with positive impacts to biodiversity and ecosystem services (Haaland et al., 2011). However, the high and continued implementation costs of these schemes have led to doubts over their broader accessibility (Batáry et al., 2015; Christmann, 2020; Uyttenbroeck et al., 2016), particularly for low and middle-income countries. The FAP approach uses MHEPs to provide similar resources to pollinators as wildflower strips, but with additional focus on benefits to farmer productivity and incomes, and improving farmer motivation (Christmann et al., 2022). Key elements in FAP approaches are crop diversification through a combination of pollinator-friendly main crop and MHEPs, temporally sequencing the planting of crops to achieve flowering overlap, habitat enhancement for pollinators by reducing harmful practices (e.g. pesticides, insecticides) and conservation agriculture practices.
ICARDA trials in Morocco and Uzbekistan have demonstrated a visibly higher yield and higher income of FAP fields compared with control plots, alongside higher pollinator abundance and diversity in FAP plots (Bencharki et al., 2023; Sentil et al., 2022a, 2022b). The visible socioeconomic benefits through FAP consequently motivated farmers to adopt the approach and conserve pollinators. Inspired by this research, Action against Hunger (ACF; an international aid NGO with the mandate to fight against hunger and its causes) initiated a FAP research project in Zimbabwe to validate the approach in a small-holder context in sub-Saharan Africa.
The agricultural production system in Zimbabwe is dominated by the high use of agrochemicals (herbicides, fungicides and insecticides, unsustainable monoculture cropping), tree cutting for firewood and tobacco curing, and agricultural expansion, requiring clearing of land (e.g. deforestation, bushfires) (Mudimu et al., 2015; Zimba and Zimudzi, 2016). These practices all have a negative impact on the wild pollinators which provide the majority of pollination services (Chakuya et al., 2022). This threatens biodiversity and adversely affects already resource-poor smallholder farmers who rely on ecosystem services such as pollination for their agricultural production, food and nutrition security and economic livelihoods. Therefore, to address the negative impacts of the practices of conventional farming on biodiversity and particularly on pollinator loss, there is a need to develop and promote alternative and sustainable solutions to conventional farming practices. The FAP method was selected (in conjunction with the use of other agroecology and sustainable agriculture techniques) for its holistic approach to farming which includes both socioeconomic and ecological benefits, and because the method itself was deemed in conjunction with local farming techniques.
This paper presents the results of FAP trials in two districts in Zimbabwe, Gokwe North and Gokwe South. The objective was to test the replicability and impact of the FAP approach in Zimbabwe. We hypothesised that using the FAP method to improve pollinator habitat would have a positive impact on pollinator abundance and diversity, and consequently have tangible benefits on crop yield (quantity and quality) and income of smallholder farmers in Zimbabwe. This research effort aims to produce scientific evidence to contribute to the existing FAP knowledge base as generated from other contexts. To our knowledge it is the first such study from sub-Saharan Africa.
2 Materials and methods
2.1 Study area
The baseline study was conducted in two districts: Gokwe North and Gokwe South, Midlands Province, Zimbabwe (Supplementary Figure 1). Gokwe North lies north of Midlands Province and is in Natural Ecological Region IV. It experiences arid to semi-arid conditions, receiving between 250 and 800mm of rainfall annually. Gokwe South lies North-West of Midlands Province, with 40% of the district falling under Agro-ecological Region IV while 60% is in Region III, which is characterised by low and erratic rainfall patterns.
2.2 Participants and training
The project registered and trained 80 project participants (46 male, 34 female), with 40 participants per district for the two districts (Gokwe South and Gokwe North, Zimbabwe). Garden materials were distributed to the 80 farmers, consisting of diamond mesh wire for fencing the garden, treated poles and nails for fencing, a hoe, a watering can, and vegetable seeds. Control farmers received seeds for the main crop only, whilst FAP farmers received seeds for the main crop and MHEPs (8 different species: mustard rape (Brassica juncea), green pepper (Capsicum annuum), tomatoes (Solanum lycopersicum), cucumber (Cucumis Sativus), okra (Abelmoschus esculentus), pumpkin (Cucurbita spp.), butternut (Cucurbita moschata), coriander (Coriandrum sativum) and watermelon (Citrullus lanatus; see Supplementary Table 1 for details). MHEP crops were selected based on attractiveness to pollinators, farmer suggestions, and flowering periods, to ensure that MHEP crop flowering partially overlapped with main crop flowering period.
All participating farmers received training on the basics of the FAP concept and field design, biodiversity, pollinator identification and counting, as well as conservation agriculture (CA) practices for planting times, cropping density, and other aspects. The project was set up so that all farmers participating in the study used similar practices and all had access to water for irrigation. Similarly, farmers were asked not to use any fertilisers, pesticides or other amendments. However, data was not collected on actual planting densities used, and it is unlikely that pesticide or fertiliser use would have been reported, had it been used. Specific data on irrigation was also not collected.
Training was conducted by Environment Africa (EA) and Nutrition Action Zimbabwe (NAZ) who were partners of Action against Hunger in the FAP trials. Project staff and local agriculture extension agents were also trained in the FAP approach and pollinator identification and counting. A qualitative assessment of farmer perceptions towards this novel practice was also carried out to assess the buy-in from local communities (Supplementary Methods 1).
2.3 Design of the participatory fields
As per the ICARDA trials, in FAP plots, farmers participating in this research project allocated 25% of their plot to cultivating MHEPs, while the remaining 75% of the plot was cultivated with a pollinator-dependent main crop. This is compared with control plots where the main crop was cultivated over 100% of the plot area (Figure 1). All plots were set up to be the same size (30 x 10m), which is similar to the average size of small-holder plots in Zimbabwe and in Sub-Saharan Africa in general where most plots are less than 0.5 hectares. Each FAP plots had a 1m border of MHEP plants on each of its four edges. Control plots were the same size, but with only one crop (“main crop”) cultivated. All selected plots were a minimum of 2km apart from each other, to avoid plot conditions impacting neighbouring plots. This corresponds with pollinator behaviour: most wild pollinators generally work in an area of approximately 50 – 2000m radius from the nest (Kohler et al., 2008).
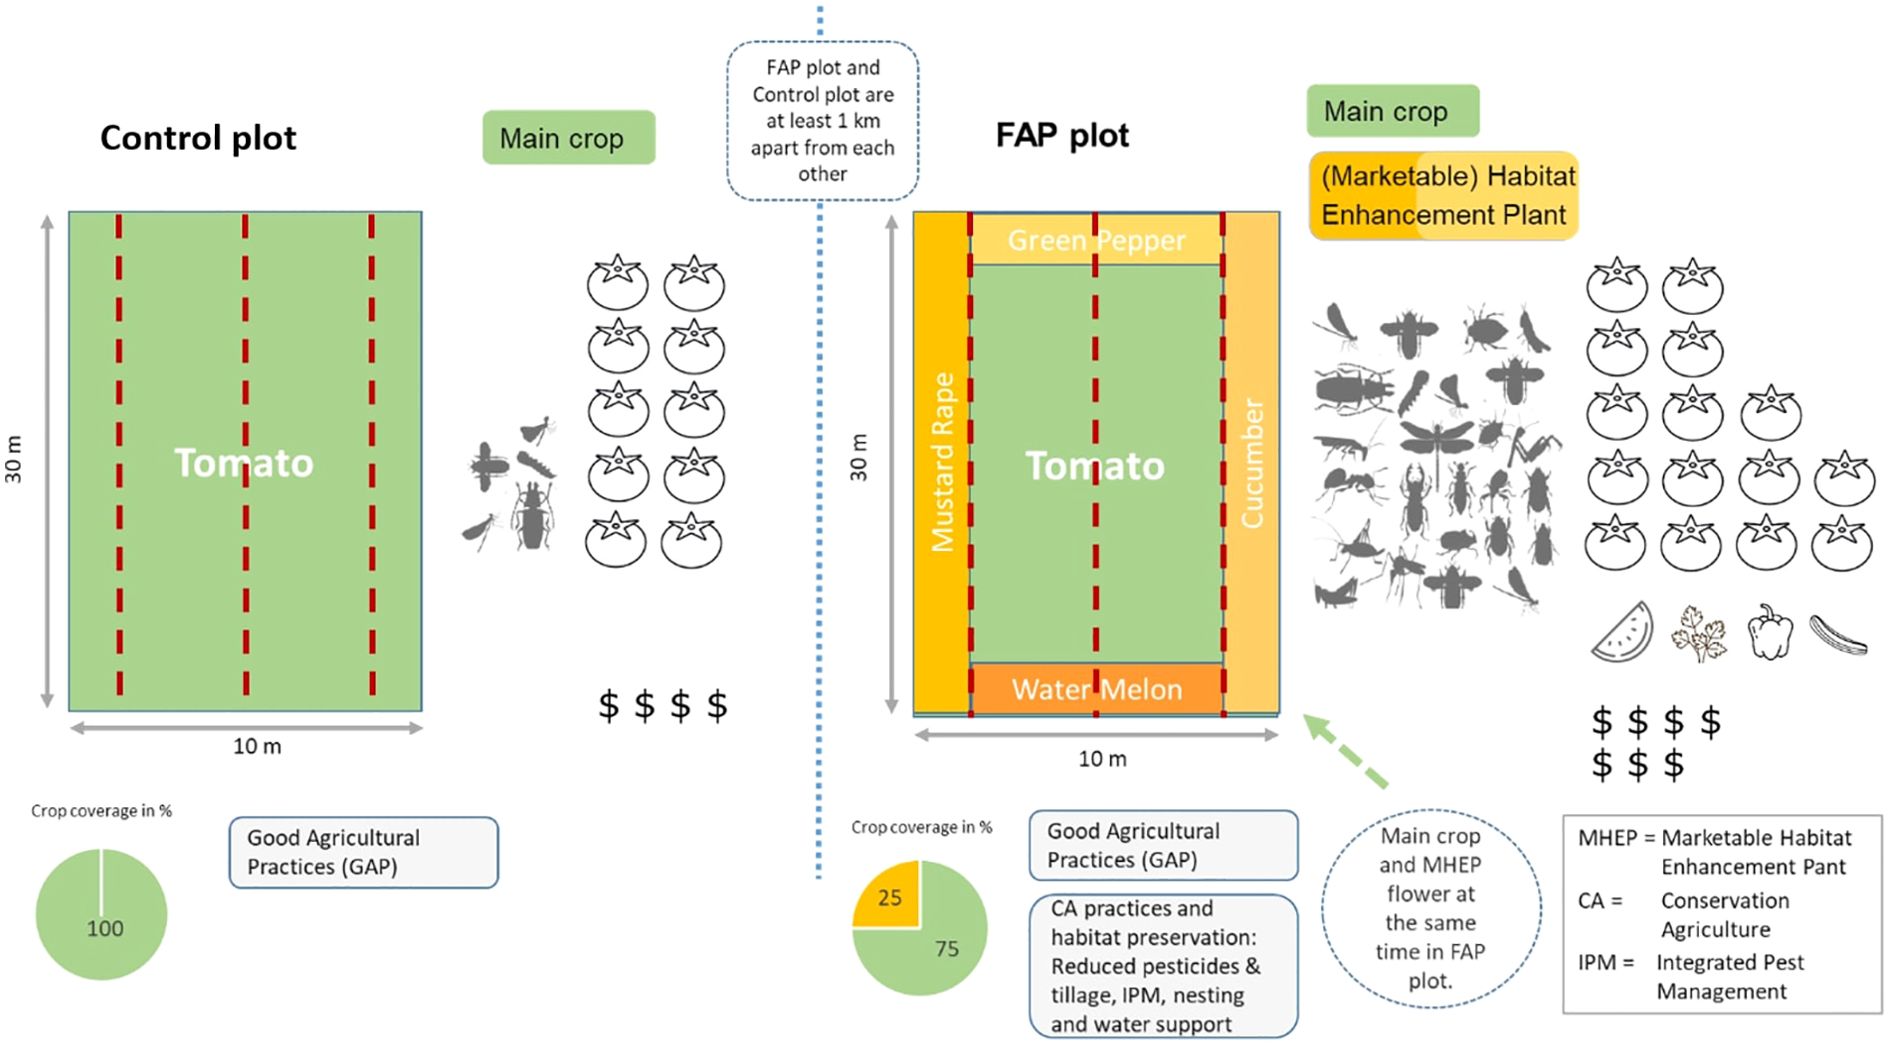
Figure 1. Principles and expectations using FAP demonstration and control plots. Pollinator transects are shown in red.
2.4 Cropping cycles
Data from three cropping cycles were collected from September 2022 to October 2023. Main crops and MHEPs varied depending on the cycle (Supplementary Table 1). The first cropping cycle began in September 2022, and all FAP farmers managed to plant the five different crops in their 30m by 10m gardens. However, in January 2023, cyclone Freddy caused widespread damage in both districts, with over 50% of farmers reporting extensive damage to crops, and the rest also reporting mild or low damage. Consequently, data from the first cycle were not included in analyses on yield and income. Data from cycle 1 were included in the pollinator counts, as these were conducted before the cyclone. As such, there were 3 cycles for the pollinator data, but only the 2nd and 3rd cycle were included for income and yield data.
2.5 Sample size
An original 80 plots were included in this pilot study, 50 FAP and 30 control plots. Of these 80 plots, the following were excluded from the analysis:
● All community plots (i.e. plots managed by multiple members of the community, rather than plots managed by individual households) were removed from the analysis (nearly half) because many were not set up following the correct experimental design, or did not follow the recommended farming techniques.
● As described previously, data from cycle 1 were not included in analyses of impacts on yield or income.
● In addition, there were no data on yields or income for 14 plots points (from 8 farms), so these were also removed, leaving 117 data points from 43 farms (for a total of 13 female farmers and 30 male farmers).
● For analyses on the value of the yield (of all crops, main crop or MHEPs), only limited data were available, so there are fewer data points than for main crop yield or total income.
2.6 Measures of pollinators
For each plot, three timed transects were conducted per cycle. Pollinator monitors walked the 1m wide transects (Figure 1) the length of the plots over 7.5 minutes counting and recording all pollinators that landed on flowers for at least 0.5 seconds. Full procedure guidelines are shown in Supplementary Methods 2.
Pollinators were identified to order, family, genus and species level where possible using dichotomous keys by Eymann et al. (2010) and Goulet and Huber (1993). Pollinator diversity was calculated using the Shannon-Weiner diversity index while the pollinator abundance was determined using pollinator counts.
Three measures of pollinators were included in the analysis:
● Pollinator abundance: total count of pollinators per plot per cycle
● Taxonomic richness: number of different taxa (identified to the lowest possible level) per plot per cycle
● Pollinator diversity: pollinator abundance and richness were used to characterise pollinator diversity and account for evenness across samples using the Shannon-Weiner diversity index (H). The higher the value of H, the higher the taxonomic diversity within a particular community.
2.7 Yield and income assessments
Farmer reports of total yield for each crop were recorded. Yield was reported in Kgs harvested for all crops except mustard rape which were measured in number of bundles harvested. Farmer recall of the amount of each crop consumed or sold (in Kg or bundles) was also recorded. Similarly, the amount sold (in Kg or bundles) and the income (in USD) for each crop was recorded. Three different measures were analysed:
● Yield: the number of kgs or bundles recorded as produced per crop, per plot, per cycle.
● Yield value: to compare yield across crop types (i.e. for plots with multiple crop plants, and across plots with different crops), the total amount of each crop produced was taken and multiplied by the average price per unit of that crop. Total value of yield for all crops from a particular plot would therefore be the monetary value (in USD) of the main crop plus the value of all MHEP crops produced from that plot (regardless of how much was actually sold). Average prices for each crop were calculated from the data recorded across both districts and both cycles.
● Income: the amount of income gained (in USD) per crop per plot. This does not include the value of any produce that was not sold (e.g. used for own consumption). Income value is generated from the harvest being sold while yield value includes the part of the harvest being sold plus the value of crops for own consumption.
2.8 Data analysis
Statistical analyses were carried out using R 4.4.1 (R Core Team, 2024). The packages stats (R Core Team, 2024), ggpubr (Kassambara, 2023), ggplot2 (Wickham, 2016), correlation (Makowski et al., 2022), pspearman (Savicky, 2022), Rcompanion (Mangiafico, 2016), FSA (Ogle et al., 2025), were used.
The impact of plot treatment (FAP vs control) on pollinators (separately: pollinator abundance, taxonomic richness, and pollinator diversity) within each of the three cycles was analysed using a Wilcoxon rank sum test with continuity correction (equivalent to the Mann-Whitney test), because data were nonparametric (Section 4.1).Comparisons of the impact of plot treatment and cycle on pollinators (separately: pollinator abundance, taxonomic richness, pollinator diversity) across all three cycles were done using a Scheirer Ray Hare test, because data were nonparametric. The same analyses were performed to assess the impact of plot treatment and district on pollinators (Section 4.1), and the impact of plot treatment and district on measures of yield and income (Section 4.2).
The correlation of pollinator abundance with yield value and with income was assessed using Spearman’s rank correlation (Section 4.3).
In cycle 3, farmers in Gokwe North planted tomatoes as their main crop, whereas farmers in Gokwe South planted watermelon as their main crop. Consequently, we did not analyse the differences in main crop yield or income within cycle 3, as it was difficult to distinguish the impacts of plot treatment and type of crop (different weights and prices of produce).
3 Results
3.1 Impact of treatment (FAP vs control) on pollinators
In total, 43 plots were included in the analyses, of which 29 were FAP plots and 14 were control plots. After removing non usable data, data were analysed from 32 plots over all three cycles (22 FAP and 10 control plots); 10 plots over two cycles (6 FAP and 4 control plots), and only 1 plot (FAP) with data from only one cycle. Data were analysed separately by cycle, and then together for all three cycles.
Pollinators belonging to 5 orders were recorded: Diptera (2), Hymenoptera (7), Lepidoptera (2), Coleoptera (1), with the Hymenoptera order having the highest number of species. The following 12 taxonomic groups were identified (we will refer to these as “pollinator groups” for the remainder of the paper):
● Mining bee, sub-family Andrenidae
● Leafcutter bee, Megachile spp.
● Carpenter bee, Xylocopa spp.
● Butterfly, order Lepidoptera
● Stingless bee, Meliponini spp.
● Sweat bee, Halictus spp.
● Hover fly, family Syrphidae
● Honeybee, Apis mellifera
● Wasp, family Vespidae
● Fly, order Diptera
● Moth, order Lepidoptera
● Beetle, order Coleoptera
For all three cycles, FAP plots had a significantly higher pollinator abundance, significantly higher taxonomic richness (number of pollinator groups counted), and significantly higher taxonomic diversity (as measured by the Shannon Index; Figure 2 and Supplementary Table 2). There was a significant difference in pollinator abundance between cycles, with a higher pollinator abundance for cycle 1 compared to cycles 2 and 3 (Scheirer Ray Hare test – Treatment: H=77.77, df=1, p<0.0001; Cycle: H=14.99, df=2, p<0.001; n=117). However, given the difference in crops planted and seasonal climate differences, it is difficult to know what factors had an impact on these differences. The data showed no significant difference in pollinator abundance between districts within cycles except for the 3rd cycle where there were significantly higher counts of pollinator abundance for Gokwe South than Gokwe North for both FAP and control plots (Scheirer Ray Hare test – Treatment: H=19.62, df=1, p<0.0001; District: H=7.53, df=1, p<0.01; n=35).
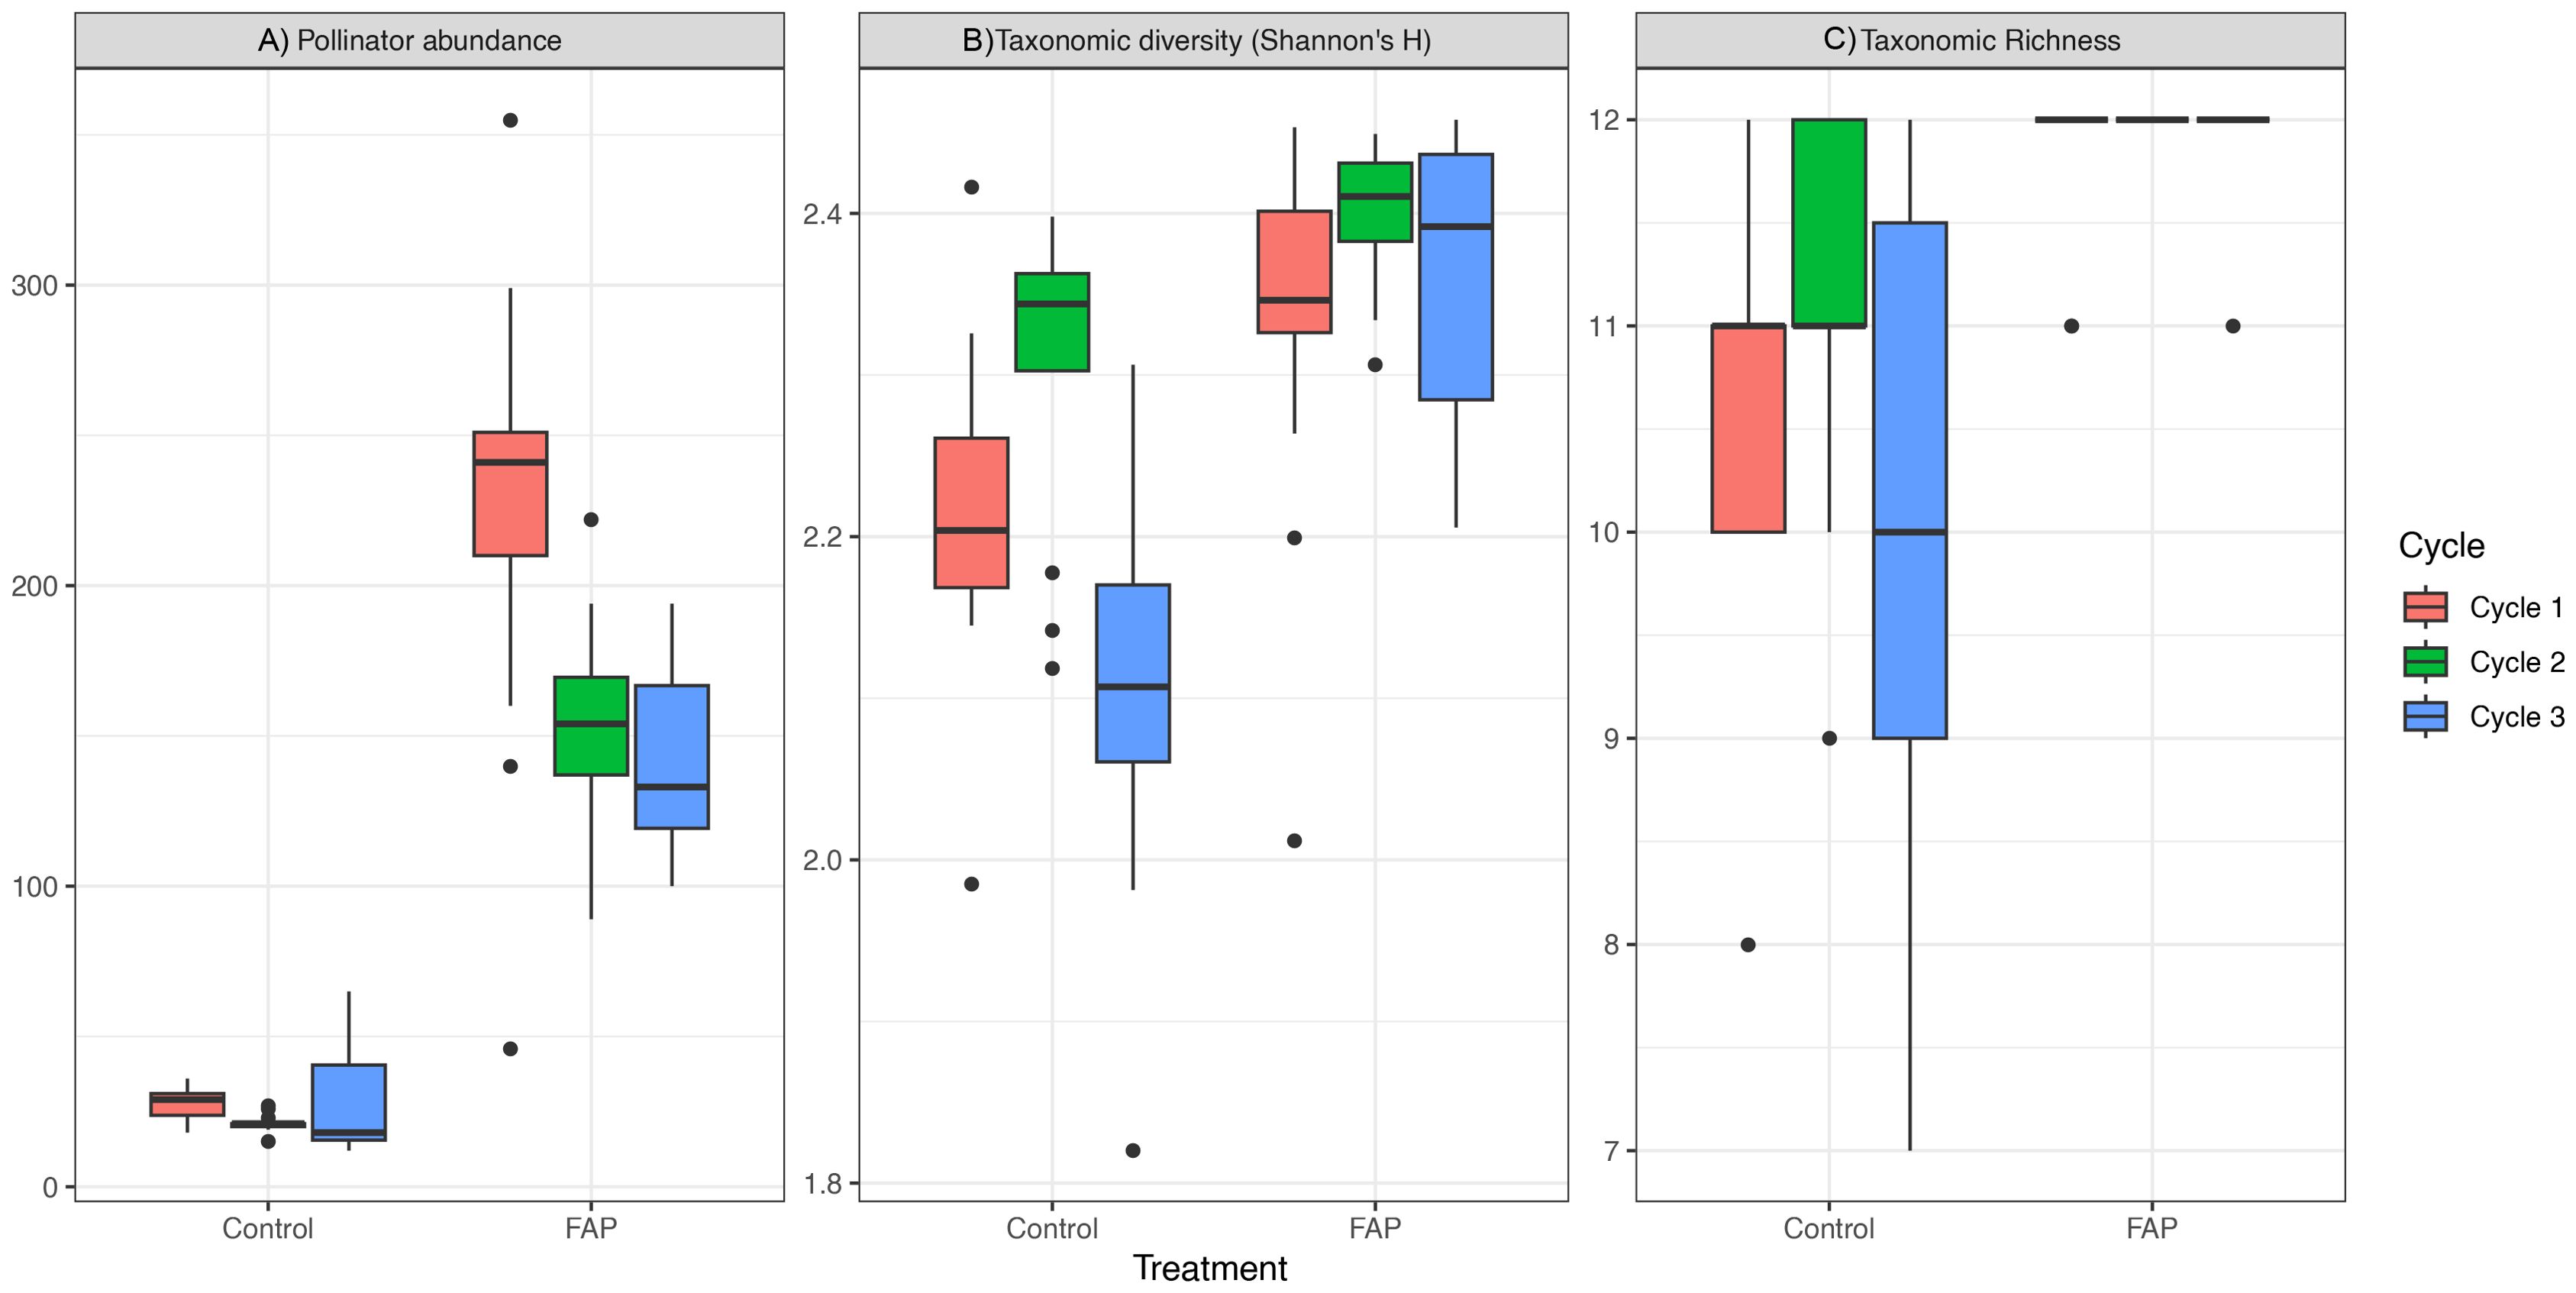
Figure 2. Data on pollinator abundance (A), taxonomic diversity (B) and taxonomic richness (C) for FAP and control plots for cycles 1, 2 and 3.
3.2 Impact of FAP on yield and income
3.2.1 Main crop yield and income, cycle 2
To avoid comparing yields as measured by weight across different crops, comparisons of yield by plot treatment were done separately by cycle and main crop. For cycle 2, the main crop was okra for all plots. Okra yield (kg) and okra income (USD) per plot for cycle 2 were not significantly different between FAP and control plots (Wilcoxon rank sum test - yield: W=166, p=0.664, n=41; income, W=158.5, df = 41, p=0.519, n=43). Given that for FAP plots, only 75% of the plot is used for cultivating the main crop (roughly 22.5m2), we also considered the yield and income per m2 for okra production, which also were not statistically significant (Wilcoxon rank sum test - yield: W=145, df = 41; p=0.306, n=43; income: W=138, df = 41, p=0.223, n=43; Supplementary Figure 2).
When taking district into account, main crop (okra) yields in cycle 2 were significantly higher in Gokwe North compared to Gokwe South (Scheirer Ray Hare - Plot type: H=0.74, df=1, p=0.391; District: H=14.63, df=1, p<0.0001; n=41). Similarly, main crop income for cycle 2 was significantly higher in Gokwe North compared to Gokwe South (Scheirer Ray Hare – Plot type: H=1.04, df=1, p=0.308; District: H=11.39, df=1, p<0.001; n=41).
The same results were true of values per m2, with main crop yields per m2 in cycle 2 being significantly higher in Gokwe North compared to Gokwe South (Scheirer Ray Hare - Plot type: H=2.10, df=1, p=0.148; District: H=15.01, df=1, p<0.0001; n=41, Supplementary Figure 2). Main crop income per m2 for cycle 2 was significantly higher in Gokwe North compared to Gokwe South (Scheirer Ray Hare – Plot type: H=2.50, df=1, p=0.114; District: H=10.84, df=1, p<0.001; n=41, Supplementary Figure 2).
3.2.2 Yield value and total income (main crop + MHEP crop), cycle 2
For cycle 2, in Gokwe North, the average total income/plot (main crop income + MHEP income) was higher in FAP plots: $144 compared to $43 in control plots. This was also observed in Gokwe South, where the average income was $92 in FAP plots compared to $7 in control plots. This means that the total income was 3.3 and 13 times higher in FAP plots for Gokwe North and South respectively, although some of this regional difference could be explained by differences in market access (prices and amounts sold). In cycle 2, total income from all crops (main crop + MHEPs) was significantly higher for FAP plots and significantly higher for Gokwe North (Scheirer Rap Hare – Plot type: H=14.87, df=1, p<0.005; District; H=5.97, df=1, p<0.05; n=4, Figure 3).
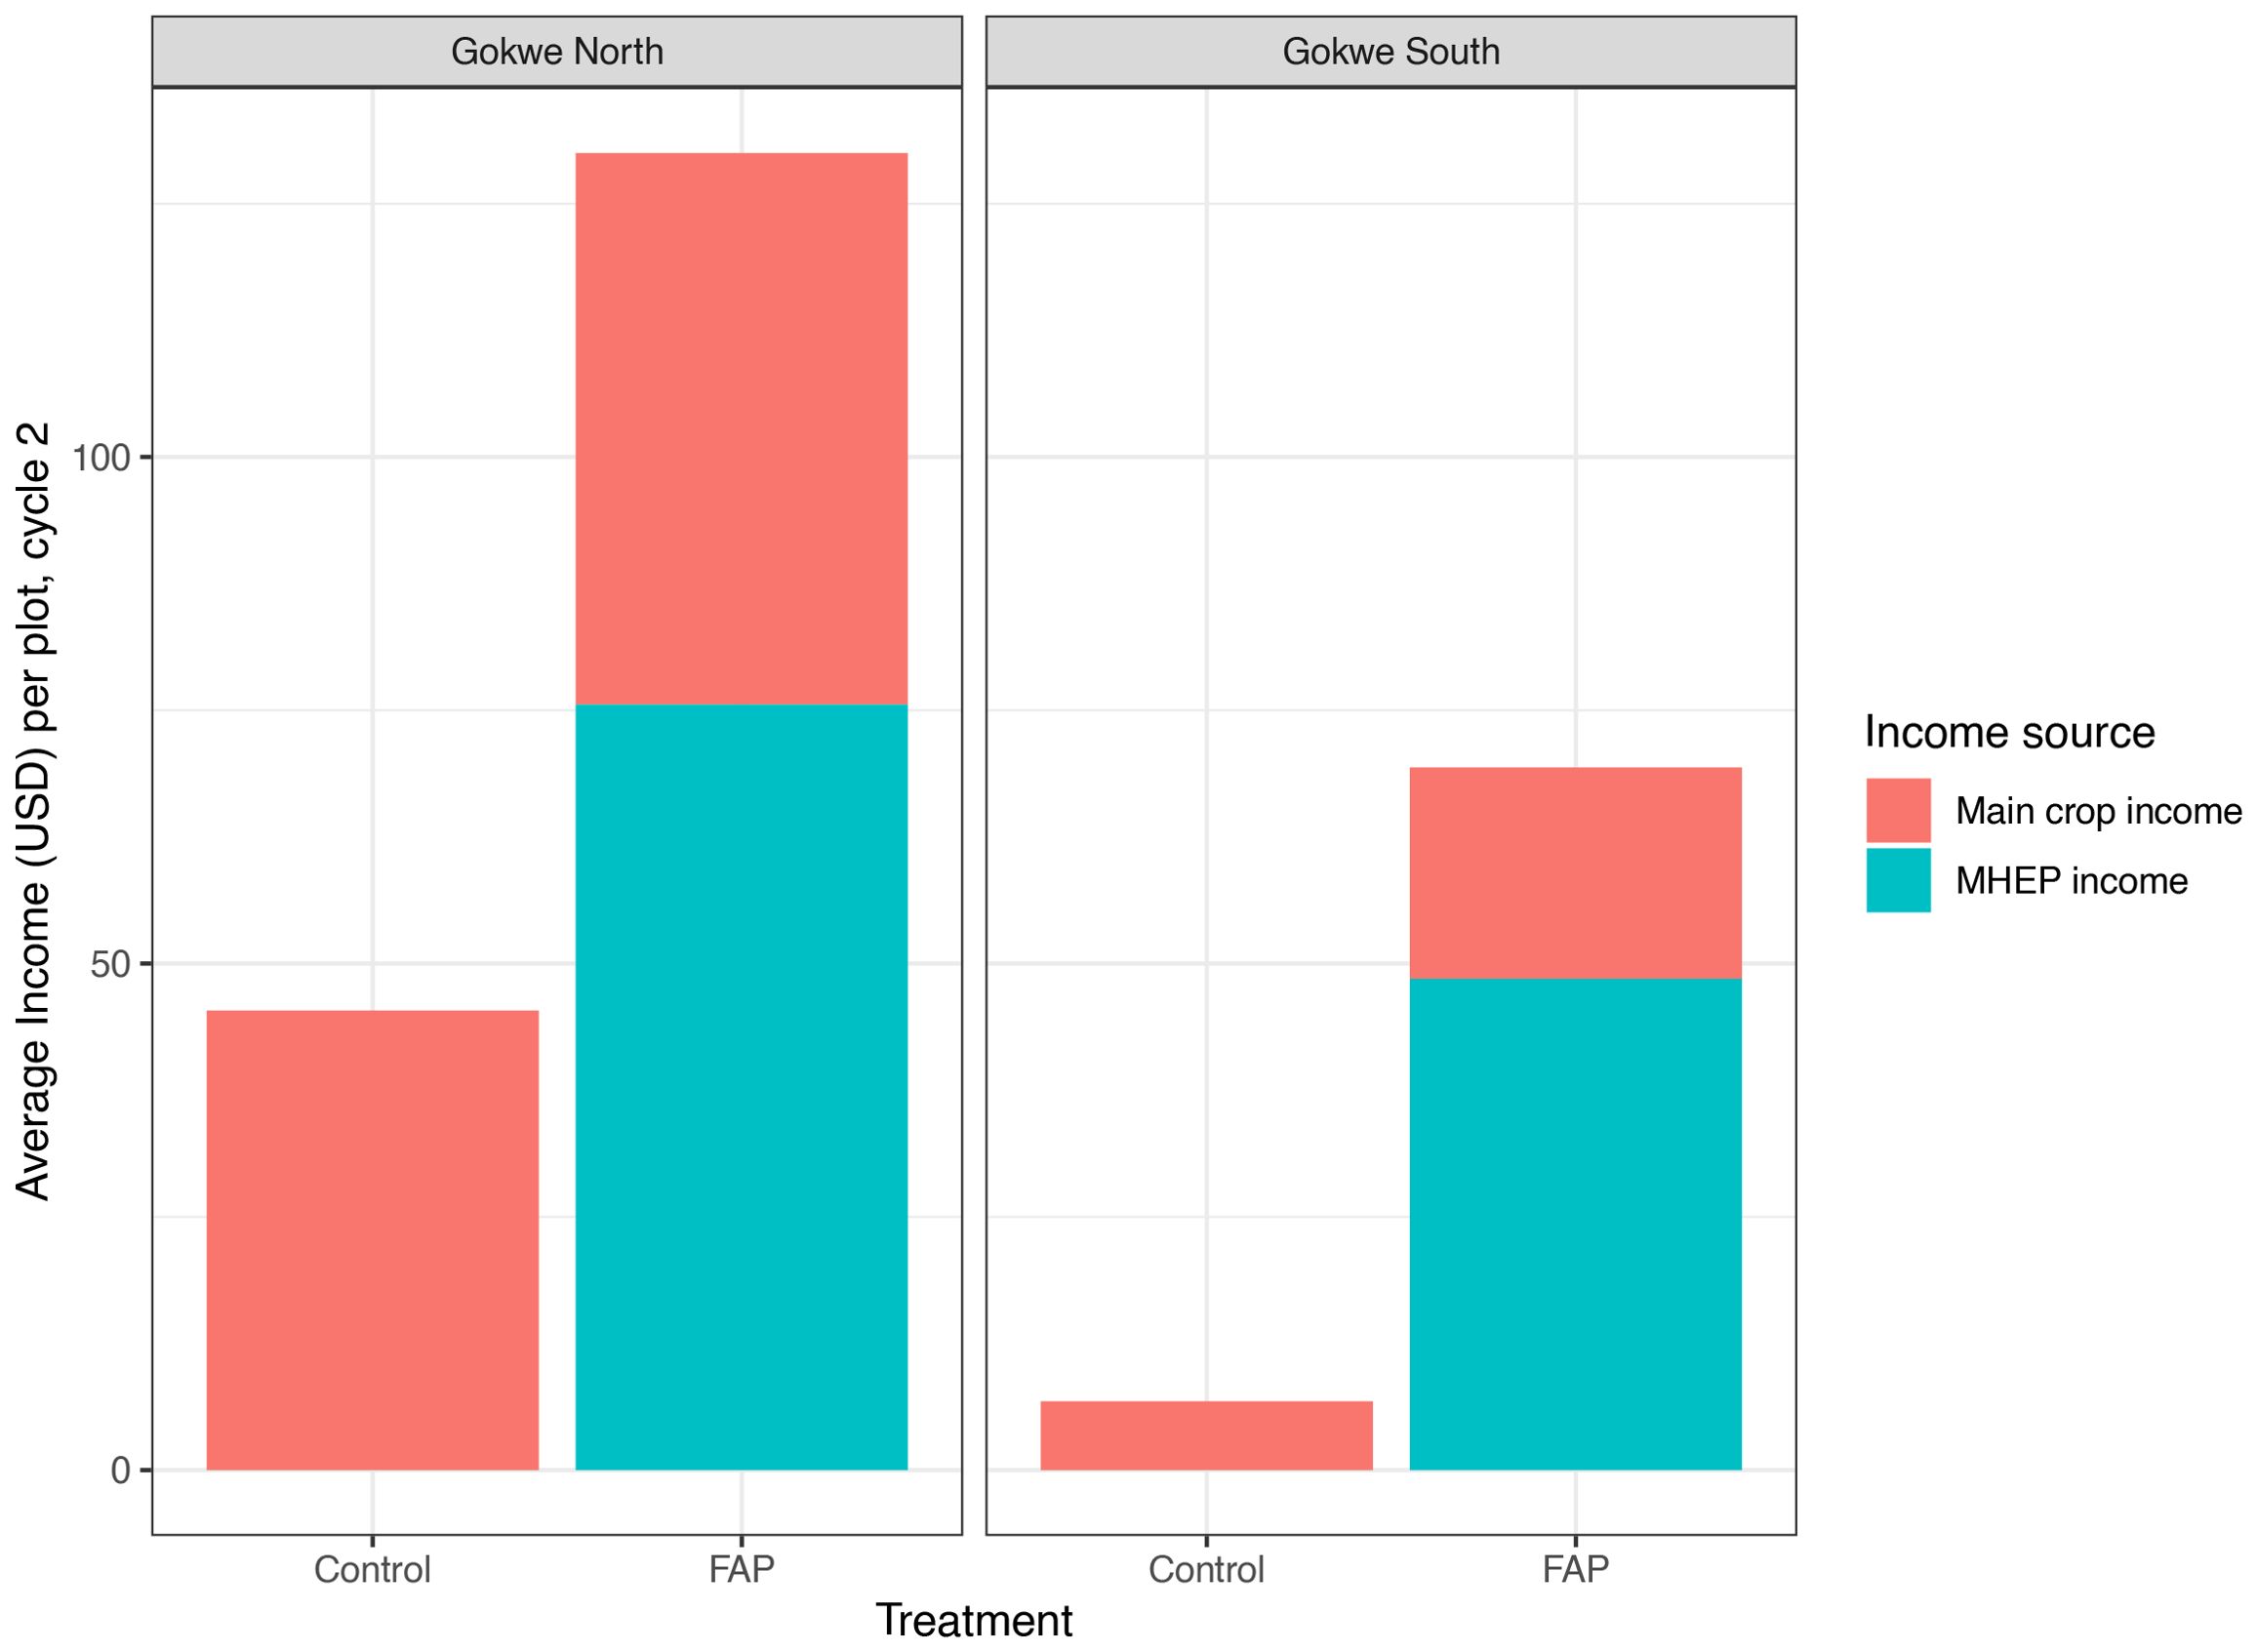
Figure 3. Overall income per plot for cycle 2 by treatment and district.
3.2.3 Impact of FAP on yield, yield value, and income across cycles (cycles 2 and 3)
When controlling for main crop type, district and cycle, main crop yields are insignificantly but marginally higher on average in FAP plots (t=1.95, df=69, p=0.055, n=76). However, there were significantly higher value yields from FAP plots compared to control plots, controlling for district, cycle and main crop (t=2.43, df=39, p<0.05, n=44, Supplementary Figure 3).
Across cycles 2 and 3, there was significantly higher income from all crops recorded from FAP plots compared to control plots (t=3.70, df=71, p<0.001, n=76), again, controlling for district, cycle and main crop. Average income from main crops was marginally higher from FAP plots compared to control plots, but it was not statistically significant (t=2.00, df=39, p=0.055, n=44). These results suggest that MHEP crops provide a significant increase in income.
3.3 Impact of pollinators on yield and income
Pollinator abundance was positively correlated with value of total yield (rho=0.63, n=44, p<0.0001, Figure 4A) and total income (Spearman’s correlation: rho=0.49, n=76, p<0.0001, Figure 4B). There were two outlier FAP plots that outperformed all other plots in both production and income. These plots were notably well maintained by very motivated farmers and were often visited as the “model” plots.
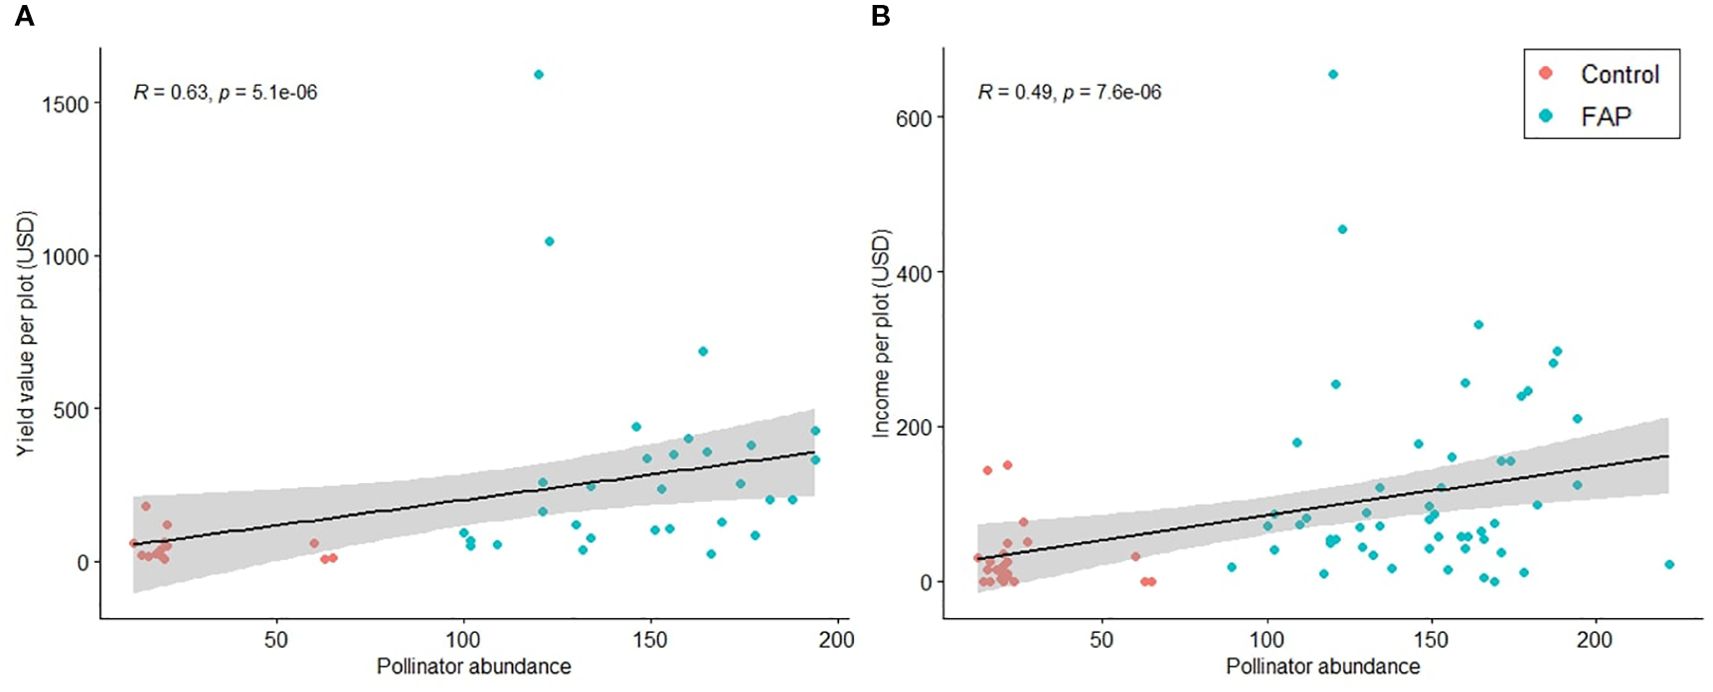
Figure 4. (A) Pollinator abundance and income from all crops (main crop and MHEP) for cycles 2 and 3. (B) Pollinator abundance and total value of yield (all crops), for cycles 2 and 3.
4 Discussion
In this study, we tested whether incorporating pollinator habitat enhancement practices in smallholder agriculture plots in Zimbabwe would significantly increase pollinator diversity and have impacts on crop yields and income. Our results are encouraging, with significantly higher counts and diversity of pollinators seen in FAP plots compared to control plots. FAP plots also had significantly higher value yields, and there was a significant correlation of pollinator abundance with yields and with total income. No single pollinator group seemed to be driving the differences observed between control and FAP plots; rather, all groups observed increased in abundance in FAP plots. It is worth noting that some pollinator groups were fairly general (e.g. butterflies), and it is possible that species diversity within these groups increased with pollinator abundance (e.g. some individual species that were not present in control plots were present in FAP plots) but this level of detail was not recorded to make monitoring accessible for field teams and to avoid taxonomic misidentification. We also did not specifically record natural enemies to crop pests, as has been done in some previous studies (Christmann et al., 2021a), the reduction in crop pests being another mechanism by which FAP may improve crop yields.
Although we did not measure pollinator abundance exclusively on the main crop but rather across the entire field, we found no significant increase in main crop yield or income in FAP plots. This indirectly suggests that FAP did not influence the abundance or richness of wild pollinators visiting the main crop or that crop production was not limited by pollinator abundance in control plots. However, our results were very close to statistical significance, aligning with previous contrasting findings on main crop yields, productivity, and pollinator abundance (e.g., increased productivity in Christmann et al., 2017; Christmann et al., 2021a; neutral effects in Zamorano et al., 2020; Sentil et al., 2024). Alternate explanations for a lack of effect of MHEP on main crops include the possibility that MHEP concentrate wild pollinator populations (Lander et al., 2011; Nicholson et al., 2019) or that time may be required for pollinators to establish around local crops (Albrecht et al., 2020).
In cycle 2, over half of income from FAP plots was from the 25% zones (MHEPs), with only moderate increases in the 75% zones (main crop) compared to control plots, suggesting that in this instance MHEPs act as a buffer against main crop income losses. Previous studies have reported income increases due to both main crop production and/or MHEP income. For example, Christmann et al. (2021a) reports that while most trials net-income increases are mainly due to increases in main crop production, during one pumpkin trial, MHEPs contributed 39% of income in a mountainous area. It may be that, in this trial, erratic crop production both between plots and potentially between years means that a buffer income source is particularly beneficial. The same study also reports only moderate benefits to okra production from increased pollinators, compared to “essential” impact of FAP for zucchini, pumpkin and melon (and “little” impact to tomatoes). Given varying impact of pollinators on crop production between crops, we might also expect different benefits of FAP to income profiles depending on the crop as well as on the risk of crop failure. To clarify this further, future research should aim to identify main crop pollinators, extend temporal coverage, and increase sampling effort.
The higher pollinator diversity and abundance in FAP plots gives an encouraging sign that FAP plots are beneficial to biodiversity as well as to the ecosystem services that those pollinators provide. Additionally, although impacts on non-pollinator diversity were not measured, anecdotal reports of benefits to fruit trees surrounding FAP fields were recorded.
The differences in pollinator abundance between Gokwe South and Gokwe North districts seen in cycle 3 may be explained by regional differences in water availability. Despite efforts to select plots with similar biogeochemical environmental conditions, future research will need to ensure additional environmental variables are recorded to ensure comparability between plots. Nevertheless, the diversity of environmental characteristics across the experimental plots, both in our work and in previous studies – including variation in soil physicochemical and biological properties (e.g. texture, pH, organic matter, microbial composition), meteorological and topographical features, as well as socioeconomic contexts – suggests that the FAP approach can be successfully applied across a wide range of landscapes and regions.
The results of our research corroborate the findings of previous FAP research conducted by ICARDA showing that plots containing MHEPs had higher wild pollinator abundance and diversity, and higher yield and income using main crops across plots as biologically and geographically varied as faba beans, eggplant, pumpkin, zucchini, tomato, apple and melon in Morrocco (Sentil et al., 2022b; Bencharki et al., 2023; Sentil et al., 2024) or sour chery and cucumber in Uzbekistan (Christmann et al., 2017). Importantly, our study demonstrates the potential of this agricultural method in a new context (i.e. sub-Saharan Africa) which is ecologically and socioeconomically distinct from previous FAP study regions, and represents an important further step towards validating this method as well as contributing more generally to the knowledge gap on pollinator biodiversity and on sustainable agriculture practices in this region. Indeed, estimating the contribution of pollinators to sustainable agriculture in sub-Saharan Africa has been constrained by limited data on pollinator species diversity and distribution and insufficient understanding of pollination gaps of pollinator-dependent crops (Tolera and Ballantyne, 2021).As with many pilot studies, there are some points to improve on for future projects. Most significant of these will be ensuring that all farmers follow the plot design and farming techniques: lack of adherence to plot standard design and common harmonised farming practices by community groups resulted in almost half of the experimental plots being excluded from the data analysis. The communal plots’ failure can be explained by a tragedy of the commons mechanism, where shared access and diffuse responsibility lead to its poor management. According to teams on the ground, individual plots did follow protocols fairly consistently, but unfortunately the failure to record the details of this (i.e. irrigation schedules, fertiliser use, etc) means that this remains anecdotal. Future studies should record these details more fully.
The visible effects of pollinator-friendly farming in the scope of the FAP trials can serve as motivation for farmers to reduce harmful behaviours that lead to pollinator decline, and indeed participating farmers were very positive about the FAP trial (Supplementary Methods 1). Such projects are not viable without farmer adhesion (Christmann et al., 2021b; Bencharki et al., 2023), and despite limited prior awareness of pollinator benefits, farmer adoption was rapid and enthusiastic, driven by the clear and quickly observable increases in crop yields and net income associated with the FAP methodology, consistent with previous findings that the method is inherently incentivizing (Christmann et al., 2021b). Our choice to use a broader taxonomic resolution allows studies to be conducted across regions without extensive specialist training; though some species-level detail is lost, key outcomes such as farmer adoption and biodiversity recovery were achieved, and the approach remains easily replicable. Building on the encouraging first results, stakeholder adherence was strengthened through “model” farmers that trained others, through word-of-mouth, and by integrating the protocols into local agricultural extension services via live training, ensuring regular follow-up and monitoring by project staff, and addressing the financial requirements needed to scale up the approach.
This research has contributed to the on-going development of new agricultural training by local authorities and to Zimbabwe’s new national agroecology policy while aligning with their existing National Biodiversity Strategy and Action Plan (NBSAP). It also supports international conventions and frameworks on biodiversity, particularly as relating to agroecological principles and agro-biodiversity, diversification of income, and input reduction. However, for FAP to have the necessary space to scale up, it needs to be promoted through advocacy based on evidence that emphasize its value and potential in enhancing pollinators and increasing small-holder farmers’ yield and income. The FAP advocacy perspective aims to influence public policy decision-makers and donors, so FAP and other nature-based solutions are put back at the heart of national agricultural strategy and policies.
Data availability statement
The original contributions presented in the study are included in the article/Supplementary Material. Further inquiries can be directed to the corresponding author.
Ethics statement
The studies involving humans were approved by Darwin Initiative Jury Board and Action Against Hunger Executive Management. The studies were conducted in accordance with the local legislation and institutional requirements. The participants provided their written informed consent to participate in this study. The manuscript presents research on animals that do not require ethical approval for their study.
Author contributions
SA-W: Software, Writing – review & editing, Visualization, Formal Analysis, Writing – original draft, Data curation, Methodology. FG: Writing – review & editing, Investigation, Methodology, Data curation, Funding acquisition, Writing – original draft, Project administration, Conceptualization, Supervision, Formal Analysis. CO: Visualization, Writing – original draft, Investigation, Writing – review & editing, Validation, Formal Analysis, Methodology, Supervision, Data curation. GB: Writing – review & editing, Data curation, Investigation, Methodology. CF: Validation, Methodology, Investigation, Conceptualization, Writing – review & editing, Supervision. AM: Data curation, Writing – review & editing, Supervision, Investigation. KR: Writing – review & editing, Supervision, Funding acquisition. BD: Formal Analysis, Validation, Methodology, Investigation, Supervision, Writing – review & editing, Funding acquisition, Conceptualization, Writing – original draft.
Funding
The author(s) declare that financial support was received for the research and/or publication of this article. This work was supported by the Darwin Initiative Innovation under grant DARNV007.
Acknowledgments
We are very grateful to the NAZ, ACF, Environment Africa and Agritex teams in the field. We thank the Fondation ACF for their support through the writing and publication of this manuscript, as well as the two anonymous reviewers for their helpful suggestions.
Conflict of interest
The authors declare that the research was conducted in the absence of any commercial or financial relationships that could be construed as a potential conflict of interest.
Generative AI statement
The author(s) declare that no Generative AI was used in the creation of this manuscript.
Any alternative text (alt text) provided alongside figures in this article has been generated by Frontiers with the support of artificial intelligence and reasonable efforts have been made to ensure accuracy, including review by the authors wherever possible. If you identify any issues, please contact us.
Publisher’s note
All claims expressed in this article are solely those of the authors and do not necessarily represent those of their affiliated organizations, or those of the publisher, the editors and the reviewers. Any product that may be evaluated in this article, or claim that may be made by its manufacturer, is not guaranteed or endorsed by the publisher.
Supplementary material
The Supplementary Material for this article can be found online at: https://www.frontiersin.org/articles/10.3389/fagro.2025.1646610/full#supplementary-material
References
Albrecht M., Kleijn D., Williams N. M., Tschumi M., Blaauw B. R., Bommarco R., et al. (2020). The effectiveness of flower strips and hedgerows on pest control, pollination services and crop yield: a quantitative synthesis. Ecol. Lett. 23, 1488–1498. doi: 10.1111/ele.13576
Batáry P., Dicks L. V., Kleijn D., and Sutherland W. J. (2015). The role of agri-environment schemes in conservation and environmental management. Conserv. Biol. 29, 1006–1016. doi: 10.1111/cobi.12536
Bencharki Y., Christmann S., Lhomme P., Ihsane O., Sentil A., El Abdouni I., et al. (2023). ‘Farming with alternative pollinators’ approach supports diverse and abundant pollinator community in melon fields in a semi-arid landscape. Renewable Agric. Food Syst. 38, e6. doi: 10.1017/S1742170522000394
Biesmeijer J. C., Roberts S. P. M., Reemer M., Ohlemüller R., Edwards M., Peeters T., et al. (2006). Parallel declines in pollinators and insect-pollinated plants in britain and the Netherlands. Science 313, 351–354. doi: 10.1126/science.1127863
Carvell C., Meek W. R., Pywell R. F., Goulson D., and Nowakowski M. (2007). Comparing the efficacy of agri-environment schemes to enhance bumble bee abundance and diversity on arable field margins. J. Appl. Ecol. 44, 29–40. doi: 10.1111/j.1365-2664.2006.01249.x
Chakuya J., Gandiwa E., Muboko N., Muposhi V. K., and Gondo R. (2022). The impact of tobacco (Nicotiana tabacum) farming on the survival of honeybees (Apis mellifera) in Nyamakate Communal Area, northern Zimbabwe. Ecosyst. People 18, 348–357. doi: 10.1080/26395916.2022.2071342
Christmann S., Aw-Hassan A., Rajabov T., Khamraev A.S., and Tsivelikas A. (2017). Farming with alternative pollinators increases yields and incomes of cucumber and sour cherry. Agron. Sustain. Dev. 37 (4), 24.
Christmann S. (2019). Do we realize the full impact of pollinator loss on other ecosystem services and the challenges for any restoration in terrestrial areas? Restor. Ecol. 27, 720–725. doi: 10.1111/rec.12950
Christmann S. (2020). Pollinator protection strategies must be feasible for all nations. Nat. Ecol. Evol. 4, 896–897. doi: 10.1038/s41559-020-1210-x
Christmann S. and Aw-Hassan A. A. (2012). Farming with alternative pollinators (FAP)—An overlooked win-win-strategy for climate change adaptation. Agriculture Ecosyst. Environ. 161, 161–164. doi: 10.1016/j.agee.2012.07.030
Christmann S., Aw-Hassan A., Güler Y., Sarisu H. C., Bernard M., Smaili M. C., et al. (2021b). Two enabling factors for farmer-driven pollinator protection in low- and middle-income countries. Int. J. Agric. Sustainability 20, 54–67. doi: 10.1080/14735903.2021.1916254
Christmann S., Aw-Hassan A., Güler Y., Sarisu H. C., Bernard M., Smaili M. C., et al. (2022). Two enabling factors for farmer-driven pollinator protection in low- and middle-income countries. Int. J. Agric. Sustainability 20, 54–67. doi: 10.1080/14735903.2021.1916254
Christmann S., Bencharki Y., Anougmar S., Rasmont P., Smaili M. C., Tsivelikas A., et al. (2021a). Farming with Alternative Pollinators benefits pollinators, natural enemies, and yields, and offers transformative change to agriculture. Sci. Rep. 11, 18206. doi: 10.1038/s41598-021-97695-5
Cohen-Shacham E., Walters G., Janzen C., and Maginnis S. (2016). Nature-based solutions to address global societal challenges (Gland, Switzerland: IUCN), xiii+ 97.
Dicks L. V., Baude M., Roberts S. P. M., Phillips J., Green M., and Carvell C. (2015). How much flower-rich habitat is enough for wild pollinators? Answering a key policy question with incomplete knowledge. Ecol. Entomology 40, 22–35. doi: 10.1111/een.12226
Dirzo R., Young H. S., Galetti M., Ceballos G., Isaac N. J. B., and Collen B. (2014). Defaunation in the anthropocene. Science 345, 401–406. doi: 10.1126/science.1251817
Eymann J., Degreef J., Hauser C., Monje J. C., and Samyn Y. (2010). Manual on field recording techniques and protocols for ATBI+M by Yves Samyn—Issuu. Available online at: https://issuu.com/ysamyn/docs/abctaxa_vol_8_part1_lr (Accessed February 10, 2023).
Gallai N., Salles J.-M., Settele J., and Vaissière B. E. (2009). Economic valuation of the vulnerability of world agriculture confronted with pollinator decline. Ecol. Economics 68, 810–821. doi: 10.1016/j.ecolecon.2008.06.014
Gill R. J., Baldock K. C. R., Brown M. J. F., Cresswell J. E., Dicks L. V., Fountain M. T., et al. (2016). “Chapter four - protecting an ecosystem service: approaches to understanding and mitigating threats to wild insect pollinators,” in Advances in ecological research, vol. 54 . Eds. Woodward G. and Bohan D. A. (London, UK: Academic Press), 135–206. doi: 10.1016/bs.aecr.2015.10.007
Goulet H. and Huber J. T. (1993). Hymenoptera of the world: An identification guide to families (Ottawa, Canada: Research Branch, Agriculture Canada Publication). Available online at: https://antcat.org/references/123041 (Accessed February 10, 2023).
Goulson D. (2019). The insect apocalypse, and why it matters. Curr. Biol. 29, R967–R971. doi: 10.1016/j.cub.2019.06.069
Goulson D., Nicholls E., Botías C., and Rotheray E. L. (2015). Bee declines driven by combined stress from parasites, pesticides, and lack of flowers. Science 347, 1255957. doi: 10.1126/science.1255957
Haaland C., Naisbit R. E., and Bersier L.-F. (2011). Sown wildflower strips for insect conservation: A review. Insect Conserv. Diversity 4, 60–80. doi: 10.1111/j.1752-4598.2010.00098.x
Kassambara A. (2023). Ggpubr: ‘ggplot2’ Based Publication Ready Plots. R package version 0.6.0. Available online at: http://CRAN.R-project.org/package=ggpubr.
Klein A.-M., Vaissière B. E., Cane J. H., Steffan-Dewenter I., Cunningham S. A., Kremen C., et al. (2007). Importance of pollinators in changing landscapes for world crops. Proc. R. Soc. B: Biol. Sci. 274, 303–313. doi: 10.1098/rspb.2006.3721
Kohler F., Verhulst J., van Klink R., and Kleijn D. (2008). At what spatial scale do high-quality habitats enhance the diversity of forbs and pollinators in intensively farmed landscapes? J. Appl. Ecol. 45, 753–762. doi: 10.1111/j.1365-2664.2007.01394.x
Lander T. A., Bebber D. P., Choy C. T., Harris S. A., and Boshier D. H. (2011). The Circe principle explains how resource-rich land can waylay pollinators in fragmented landscapes. Curr. Biol. 21, 1302–1307. doi: 10.1016/j.cub.2011.06.045
Makowski D., Wiernik B. M., Patil I., Lüdecke D., and Ben-Shachar M. S. (2022). correlation: Methods for correlation analysis (0.8.3) [R Package]. Available online at: https://CRAN.R-project/package=correlation (Accessed October 10, 2024).
Mangiafico S. S. (2016). Summary and Analysis of Extension Program Evaluation in R, version 1.23.0, revised 2025. New Brunswick, NJ: Rutgers Cooperative Extension.
Mudimu G. D., Chigume S., and Chikanda M. (2015). Pesticide use and policies in Zimbabwe. Hannover: Universität Hannover.
Nicholls C. I. and Altieri M. A. (2013). Plant biodiversity enhances bees and other insect pollinators in agroecosystems. A review. Agron. Sustain. Dev. 33, 257–274. doi: 10.1007/s13593-012-0092-y
Nicholson C. C., Ricketts T. H., Koh I., Smith H. G., Lonsdorf E. V., and Olsson O. (2019). Flowering resources distract pollinators from crops: Model predictions from landscape simulations. J. Appl. Ecol. 56, 618–628. doi: 10.1111/1365-2664.13333
Ogle D. H., Doll J. C., Wheeler A. P., and Dinno A. (2025). FSA: Simple Fisheries Stock Assessment Methods. R package version 0.10.0 (Boca Raton, FL: Chapman & Hall/CRC).
Ollerton J., Winfree R., and Tarrant S. (2011). How many flowering plants are pollinated by animals? Oikos 120, 321–326. doi: 10.1111/j.1600-0706.2010.18644.x
Potts S. G., Biesmeijer J. C., Kremen C., Neumann P., Schweiger O., and Kunin W. E. (2010). Global pollinator declines: Trends, impacts and drivers. Trends Ecol. Evol. 25, 345–353. doi: 10.1016/j.tree.2010.01.007
R Core Team (2024). R: A language and environment for statistical computing (R Foundation for Statistical Computing). Available online at: https://www.R-project.org/.
Sánchez-Bayo F. and Wyckhuys K. A. G. (2019). Worldwide decline of the entomofauna: A review of its drivers. Biol. Conserv. 232, 8–27. doi: 10.1016/j.biocon.2019.01.020
Savicky P. (2022). pspearman: Spearman’s Rank Correlation Test. R package version 0.3-1. Available online at: https://CRAN.R-project.org/package=pspearman (Accessed October 10, 2024).
Sentil A., Lhomme P., Michez D., Reverté S., Rasmont P., and Christmann S. (2022a). Farming with Alternative Pollinators” approach increases pollinator abundance and diversity in faba bean fields. J. Insect Conserv. 26, 401–414. doi: 10.1007/s10841-021-00351-6
Sentil A., Lhomme P., Reverté S., El Abdouni I., Hamroud L., Ihsane O., et al. (2024). The pollinator conservation approach “Farming with Alternative Pollinators”: Success and drivers. Agriculture Ecosyst. Environ. 369, 109029. doi: 10.1016/j.agee.2024.109029
Sentil A., Reverté S., Lhomme P., Bencharki Y., Rasmont P., Christmann S., et al. (2022b). Wild vegetation and ‘farming with alternative pollinators’ approach support pollinator diversity in farmland. J. Appl. Entomology 146, 1155–1168. doi: 10.1111/jen.13060
Tolera K. and Ballantyne G. (2021). Insect pollination and sustainable agriculture in Sub-Saharan Africa. J. Pollinat. Ecol. 27.
Uyttenbroeck R., Hatt S., Paul A., Boeraeve F., Piqueray J., Francis F., et al. (2016). Pros and cons of flowers strips for farmers. A review. BASE. 20 (s1), 225–235. doi: 10.25518/1780-4507.12961
Wickham H. (2016). ggplot2: elegant graphics for data analysis (New York: Springer-Verlag). Available online at: https://ggplot2.tidyverse.org (Accessed October 10, 2024).
Zamorano J., Bartomeus I., Grez A. A., and Garibaldi L. A. (2020). Field margin floral enhancements increase pollinator diversity at the field edge but show no consistent spillover into the crop field: a meta-analysis. Insect Conserv. Diversity 13, 519–531. doi: 10.1111/icad.12454
Keywords: farming with alternative pollinators, agroecology, taxonomic diversity, pollinators, ecosystem services, conservation agriculture
Citation: Allebone-Webb S, Gossrau F, Orland C, Bara GT, Fioekou C, Matsika A, Riber K and Mahaman Dioula B (2025) Farming with alternative pollinators for increased biodiversity and smallholder incomes in Zimbabwe. Front. Agron. 7:1646610. doi: 10.3389/fagro.2025.1646610
Received: 13 June 2025; Accepted: 28 August 2025;
Published: 18 September 2025.
Edited by:
Matthias Samuel Geck, World Agroforestry Centre, KenyaReviewed by:
Kris Braman, University of Georgia, United StatesNgawo Namukonde, The Copperbelt University, Zambia
Copyright © 2025 Allebone-Webb, Gossrau, Orland, Bara, Fioekou, Matsika, Riber and Mahaman Dioula. This is an open-access article distributed under the terms of the Creative Commons Attribution License (CC BY). The use, distribution or reproduction in other forums is permitted, provided the original author(s) and the copyright owner(s) are credited and that the original publication in this journal is cited, in accordance with accepted academic practice. No use, distribution or reproduction is permitted which does not comply with these terms.
*Correspondence: Chloé Orland, Y29ybGFuZEBhY3Rpb25jb250cmVsYWZhaW0ub3Jn