 Jiaxin Xie1,2†
 Mengjie Liu1†Zhengwu Xiao2Xing Li2Fangbo Cao2
 Jiana Chen2
 Min Huang2
 Izhar Ali3
 Anas Iqbal4
 Abdul Wahab5Shuchun Guo1*
- 1Inner Mongolia Academy of Agricultural and Animal Husbandry Sciences, Hohhot, China
- 2Rice and Product Ecophysiology, Key Laboratory of Ministry of Education for Crop Physiology and Molecular Biology, Hunan Agricultural University, Changsha, China
- 3College of Agriculture, Guangxi University, Nanning, China
- 4State Key Laboratory for Conservation and Utilization of Subtropical Argo-bioresources, College of Agriculture, South China Agricultural University, Guangzhou, China
- 5Shanghai Center for Plant Stress Biology, CAS Center for Excellence in Molecular Plant Sciences, Chinese Academy of Sciences, Shanghai, China
Introduction: There is a knowledge gap regarding the effects of sowing date and nitrogen (N) management on the grain quality, as well as the relationship between grain quality and leaf carbon (C) and N status in high-quality hybrid rice.
Methods: This study aimed to compare the grain quality of high-quality hybrid rice and evaluate the relationships between grain quality and leaf C and N content, as well as the C/N ratio, across different sowing dates and N management strategies in 2022 and 2023. Two sowing dates were employed for each year, and for each sowing date and year, rice cultivars were subjected to two N rates and three N split-application ratios.
Results and discussion: Results showed that delaying the sowing date increased head rice rate, amylose content, setback viscosity and leaf N content at the maturity stage while decreasing protein content, peak and breakdown viscosity, and leaf C/N ratio. Increasing N rate and delaying N application boosted head rice rate, amylose and protein content, setback viscosity, and leaf N content at both the heading and maturity stages but reduced peak and breakdown viscosity, and leaf C/N ratio. When leaf N content was below 2.92% and 1.44% at the heading and maturity stages, and the leaf C/N ratio was above 14.9 and 29.5, respectively, it enhanced the eating quality but did not improve milling and nutritional quality. These findings suggest that delaying the sowing date can improve milling quality but deteriorate the eating and nutritional quality of high-quality hybrid rice. Increasing N rate and delaying N application are beneficial to milling and nutritional quality but are unfavorable for improving eating quality. The leaf N content and C/N ratio at the heading and maturity stages are effective indicators for diagnosing grain quality.
1 Introduction
Rice (Oryza sativa L.) farming has always focused on promoting grain yield. Over the past forty years, the successful utilization of rice heterosis has resulted in a cumulative increase of approximately 800 billion kilograms in rice production in China, considerably improving national food security (Yuan, 2016). Nevertheless, hybrid rice with inferior grain quality has struggled to meet the rising demands of consumers and the market for high-quality rice, given the ongoing improvements in economic and living standards (Huang et al., 2022b). In response, high-quality hybrid rice cultivars meeting the third-grade or higher standards of the GB/T 17891–2017 of Chinese National Industry Standard (State Administration for Market Regulation and Standardization Administration of China, 2017) have been developed in recent years to achieve both high yield and superior quality.
Grain quality of rice primarily refers to milling recovery, physical appearance, cooking and eating quality, and nutritional value. The traits assessed include brown, milled, and head rice rate, chalky rice rate, chalkiness degree, as well as amylose and protein content (Gu et al., 2015). Superior genes are essential for high-quality rice but agronomic practices hold an equally important role in determining grain quality (Liu et al., 2015). As a critical period for the quality formation of grain, the grain-filling stage exhibits the most pronounced responsiveness to climate change, typically temperature (Tang et al., 2019). Unsuitable temperatures during the grain-filling stage can adversely affect spikelet fertility and assimilate filling, ultimately reducing the grain quality (Siddika et al., 2019). Adjusting the sowing date is a common strategy to optimize climate conditions and enhance grain quality in rice cultivation (Deng et al., 2022). Most studies have shown that delaying the sowing date can decrease the temperature during the grain-filling stage, which is conducive to the formation of quality (Deng et al., 2015; Ding et al., 2020). However, findings from previous studies are inconsistent. Huang et al. (2022c) reported that despite delaying the sowing date led to lower grain-filling temperature, increased the amylose content and setback viscosity in milled rice flour, as well as enhanced the hardness and chewiness in cooked rice. These changes did not result in an improvement in eating quality.
It is generally accepted that nitrogen (N) management is an effective agronomic practice for improving rice yield and grain quality. Research has indicated that increasing the N application rate from 0 to 220 kg ha–1 contributes to improved rice milling, appearance, and nutritional quality (Tumanian et al., 2020). However, excessive N rate not only limits the enhancement of rice quality but also causes environmental issues such as soil acidification and surface water eutrophication (Huang et al., 2018). In addition, N split-application ratios across different growth stages significantly effects grain quality, with the most pronounced effects observed during the panicle initiation stage (Xiong et al., 2024). Proper N split-application ratios can also improve the physiological metabolism of rice plants under stress conditions. Tang et al. (2019) reported that increasing the N application rate during the reproductive growth stage could mitigate the adverse effects of climate warming on rice quality. Despite extensive research have been conducted by previous scholars, there is a knowledge gap regarding how the grain quality of high-quality hybrid rice responds to sowing date and N management.
The main components of rice endosperm are starch and protein, which are the main products of carbon (C) and N metabolism, respectively (Cao et al., 2022). Therefore, the formation of grain quality is the comprehensive result of the C and N metabolism of rice plants. The leaf is the primary organ for rice photosynthesis, responsible for providing filling substances to developing grains. Leaf N is closely related to photosynthesis duration, leaf area index, and nutrient uptake, while leaf C serves as the C source and energy provider for photosynthesis (Ye et al., 2014). The leaf C/N ratio can be used to estimate the rate of C assimilation and plant nutrient use efficiency to a certain extent (Zhang Y. et al., 2021). Consequently, one hypothesis is that a balance exists between the formation of quality and the leaf C and N content, and C/N ratio in high-quality hybrid rice. However, there is insufficient evidence directly supporting this viewpoint at present.
Based on the above considerations, a field experiment including two sowing dates, two N rates, and three N split-application ratios was performed in Hunan Province, China in 2022 and 2023. This study aimed to (1) explore the effects of sowing date and N management on grain quality of high-quality hybrid rice, and (2) evaluate the relationship between grain quality and the leaf C and N content, and C/N ratio in high-quality hybrid rice.
2 Materials and methods
2.1 Experimental details
Field experiments were performed at the research farm of Rice and Product Ecophysiology located in Liuyang (28°09’N, 113°37’E, 43 m above sea level), Hunan Province, China in 2022 and 2023. The soil of the experimental field was clay with pH of 5.93, organic matter content of 35.7 g kg–1, available N concentration of 168 mg kg–1, available phosphorus concentration of 22.6 mg kg–1, and available potassium concentration of 140 mg kg–1. Two high-quality hybrid rice cultivars, Zhuliangyou 570 (ZLY570) and Huazheyou 261 (HZY261), were used in the experiment. ZLY570 was provided by Yuan Longping High-Tech Agriculture Co., Ltd., and HZY261 was provided by Hunan Jinjian Seed Technology Co., Ltd. Grain quality of both cultivars meets the first-grade quality standards of the GB/T 17891–2017 of Chinese National Industry Standard (State Administration for Market Regulation and Standardization Administration of China, 2017) and were released in 2021 and 2020, respectively (China Rice Data Center, https://www.ricedata.cn/variety/varis/626384.htm and https://www.ricedata.cn/variety/varis/622640.htm).
Based on local phenological conditions, farmers typically complete sowing single-cropping rice between mid-April and late May to ensure the rice completes its growth cycle under suitable climate conditions. Accordingly, the sowing dates were set as May 9th (S1) and May 29th (S2) for each cultivar in both years. On average across cultivars and years, the daily mean air temperatures during the grain-filling stage were 28.3 °C for S1 and 24.8 °C for S2 (Figure 1A). The average durations of the grain-filling stage were 40 days for S1 and 46 d for S2 (Figure 1B).
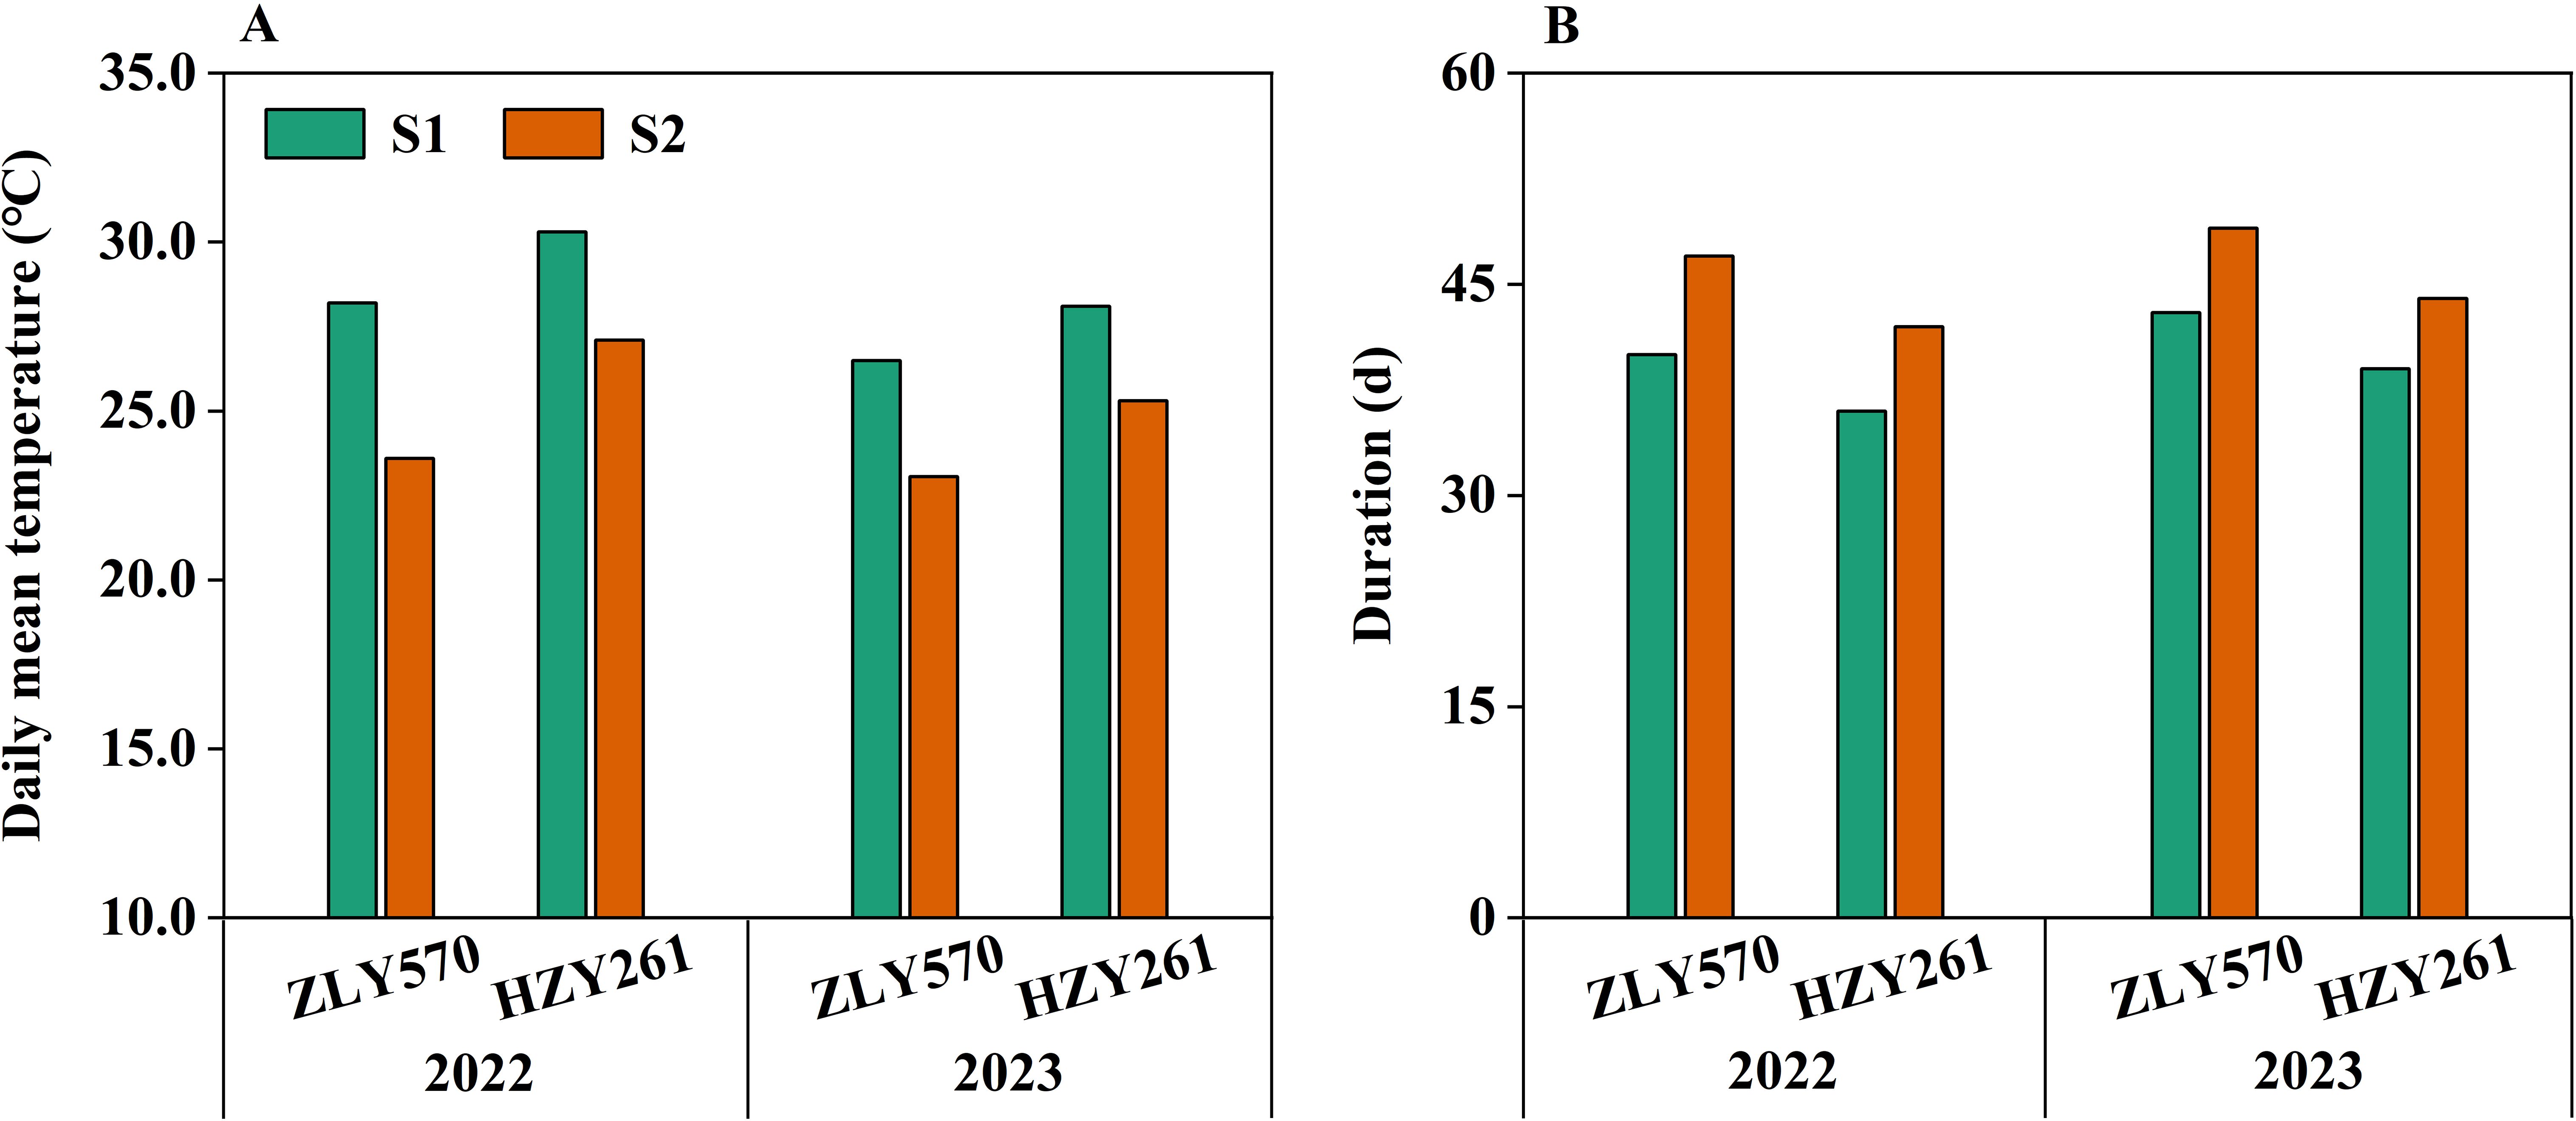
Figure 1. Daily mean temperature (A) and duration (B) of the grain-filling stage for Zhuliangyou 570 (ZLY570) and Huazheyou 261 (HZY261) grown under two sowing dates in 2022 and 2023. S1 and S2 denote the sowing dates of May 9th and 29th, respectively.
Under different sowing dates and years, each cultivar was subjected to six N treatments derived from combinations of two N rates and three split-application ratios. In accordance with prevailing agricultural practices and expert consensus, two N rates were adopted: a moderate level of 165 kg N ha–1 (T1) and a high level of 225 kg N ha–1 (T2). These rates were designed to meet rice N requirements while preventing potential negative impacts on both crop performance and the environment from excessive N application. The three N split-application ratios were 5:2:3 (N1), 4:2:4 (N2), and 3:2:5 (N3) among the basal (1 day before transplanting), early tillering (7 days after transplanting), and panicle initiation stages. The six N treatments were allocated in a completely randomized block design, with three biological replications per treatment and each plot covering an area of 32 m2.
Pre-germinated seeds were sown in a seedbed, and twenty-five-day-old seedlings were manually transplanted at a spacing of 20 cm rows and 20 cm hills with two seedlings per hill. The rates of P2O5 and K2O were 75 kg ha–1 and 150 kg ha–1, respectively. All phosphorus fertilizer and half of the potassium fertilizer were applied at the basal stage, and the other half of the potassium fertilizer was applied at the panicle initiation stage. The experimental field was kept inundated with 5–10 cm depth from transplanting until 7 d before maturity. Chemicals were employed for disease, weed, and pest control.
2.2 Sampling and measurements
For each cultivar and each year, a 1 kg of rice sample was randomly sampled at the maturity stage, and dried and stored well-ventilated indoors after removing unfilled grains. Three months later, 100 g of rice grains were dehulled using the rice milling machine (JGMJ8098, Shanghai Jiading Cereals and Oils Instrument Co., Ltd., Shanghai, China) to obtain the brown rice. Subsequently, the brown rice samples were polished to remove the aleurone layer, resulting in the milled rice. The weights of the brown and milled rice samples were measured to determine the brown and milled rice rate. The head rice rate, chalky grain rate, and chalkiness degree were assessed following the NY/T2334–2013 of Chinese National Agricultural Industry Standard (Ministry of Agriculture of the PRC, 2013). A 30 g mixed milled rice sample was placed on a scanner (SC-E, Wseen Detection Co., Ltd., Hangzhou, China) to measure the head rice rate. 200-head rice grains were scanned to determine the chalky rice rate and chalkiness degree. The identical experimental procedure was repeated three times.
A 30 g milled rice sample was fully grinded and passed through 100-mesh sieve to obtain the milled rice flour, which was stored in a zip-lock bag for determining amylose and protein content, and rice flour pasting properties. Amylose content was measured using a spectrophotometric method mentioned in the NYT2639–2014 of Chinese National Agricultural Industry Standard (Ministry of Agriculture of the PRC, 2014). Protein content was calculated by the N content of the milled rice flour with a conversion factor of 5.95 (López et al., 2010). The N content was examined by Nessler’s Reagent Colorimetric Method as described by Hu et al. (2020). The rice flour pasting properties were measured with a Rapid Viscosity-Analyzer (RVA-Supper 4, Newport Scientific, Sydney, Australi a), following the method of Hu et al. (2022) with minor modifications. A 3 g sample of accurately weighed milled rice flour was dispersed in a specialized aluminum container. Subsequently, a 12 min process was initiated: initially, the temperature inside the aluminum container was heated to 50 °C and maintained for 1 min, then further increased to 95 °C and held for 2.5 min, followed by cooling to 50 °C and remaining for 1.4 min. The rice flour pasting properties included peak, trough, final, breakdown, setback, and consistency viscosity, pasting temperature, and peak time. All viscosity values were recorded in cP.
Five hills of rice plants were consecutively sampled from each plot at the heading and maturity stages. All leaves were picked and dried to a constant weight at 70 °C, and then ground into powder for further analysis. The C and N content was determined using an elemental analyzer (UNICUBE, Elementar Co., Ltd., Langenselbold, Germany). The C/N ratio represents the ratio of C content to N content.
2.3 Statistical analysis
Data analysis was performed separately for each cultivar and each year using Statistix 8.0 (Analytical Software Inc., Tallahassee, FL, USA). Analysis of variance (ANOVA) was employed to examine the main and interaction effects of sowing date, N rate, and N split-application ratio on all measured parameters. Linear regression analysis was utilized to analyze the correlation between grain quality and the leaf C and N content, and C/N ratio. Significant differences and correlations were set at 0.05 and 0.01 probability levels. Treatment means were compared with the least significant difference test. The performance is consistent across years and cultivars, thus multiple comparison results are presented using the average values of both years and cultivars in the results section.
To evaluate the relationship between grain quality and the leaf C and N content, and C/N ratio, the data were standardized referring to the methods of Deng et al. (2022) and Xiong et al. (2024). The standardized data were defined as “relative data” and calculated as follows: Relative data = (Observed data of a cultivar during a sowing date under a specific N rate and N split-application ratio in one year/(Mean data of this cultivar across different sowing dates and N management in two years.
3 Results
3.1 Effects of sowing date and N management on leaf C and N content, and C/N ratio
In both 2022 and 2023, the leaf N content and C/N ratio at the heading stage were markedly influenced by N rates and N split-application ratios in two cultivars (Table 1). The leaf N content and C/N ratio at the maturity stage significantly varied under different sowing dates, N rates, and N split-application ratios. Whereas the leaf C content at the heading and maturity stages for two cultivars showed inconsistent significance across different sowing dates and N management. The interaction between sowing dates and N management had no consistent effect on leaf C and N content, and C/N ratio. Therefore, the following analysis for leaf C and N status focused on the N content and C/N.
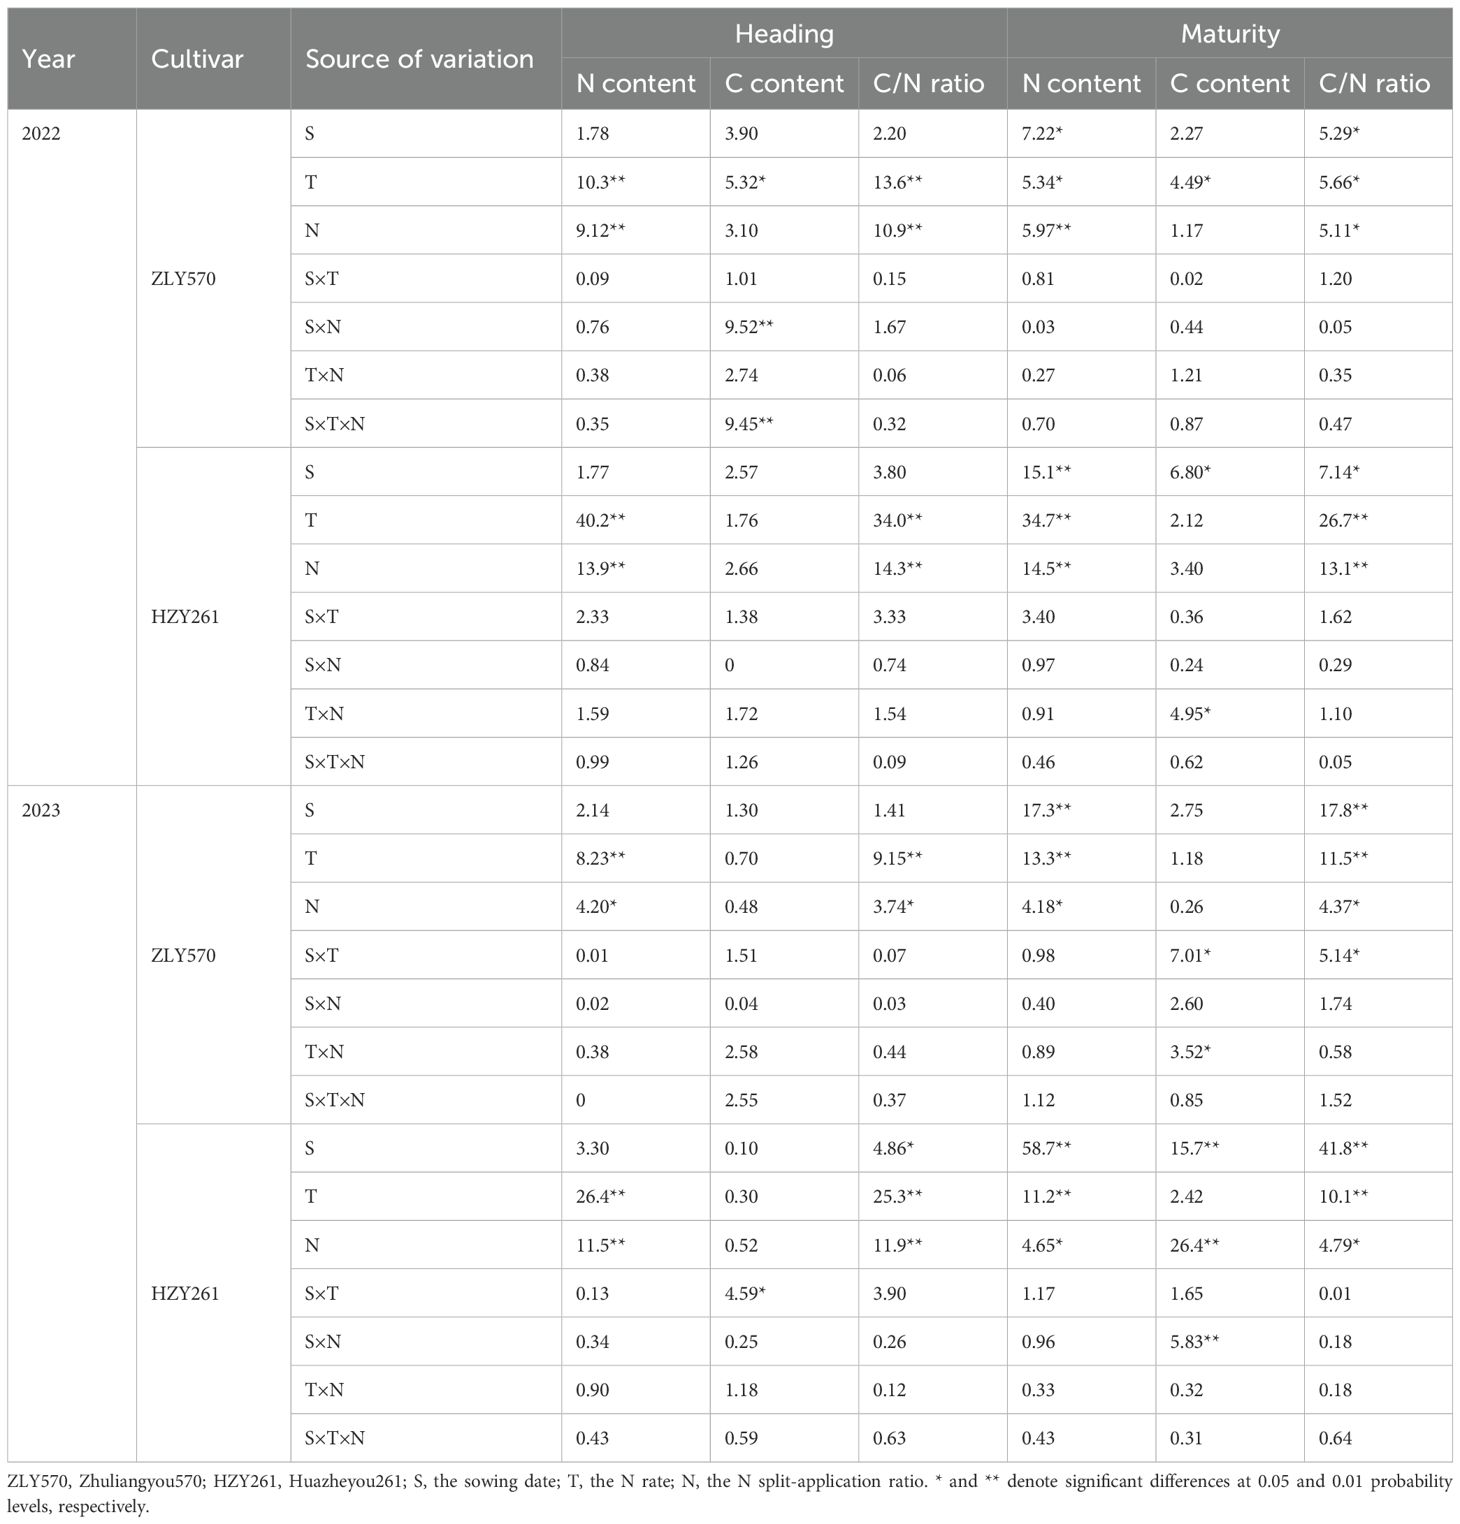
Table 1. ANOVA (F value) results of leaf C and N content, and C/N ratio effected by different sowing dates, N rates, and N split-application ratios.
Averaged rice cultivars and years, S2 increased the leaf N content at the maturity stage by 18.2% and decreased the leaf C/N ratio by 14.4% compared to S1, respectively (Figures 2A, B). Relative to T1, T2 showed higher average leaf N content at the heading and maturity stages by 7.90% and 13.7%, and lower average leaf C/N ratio by 7.50% and 12.5%, respectively (Figures 2C, D). Relative to N1, N2 and N3 increased the average leaf N content at the heading and maturity stages by of 3.75%–9.85% and 7.67%–16.9%, whereas decreased the average leaf C/N ratio by 3.77%–9.18% and 6.81%–15.5%, respectively (Figures 2E, F).
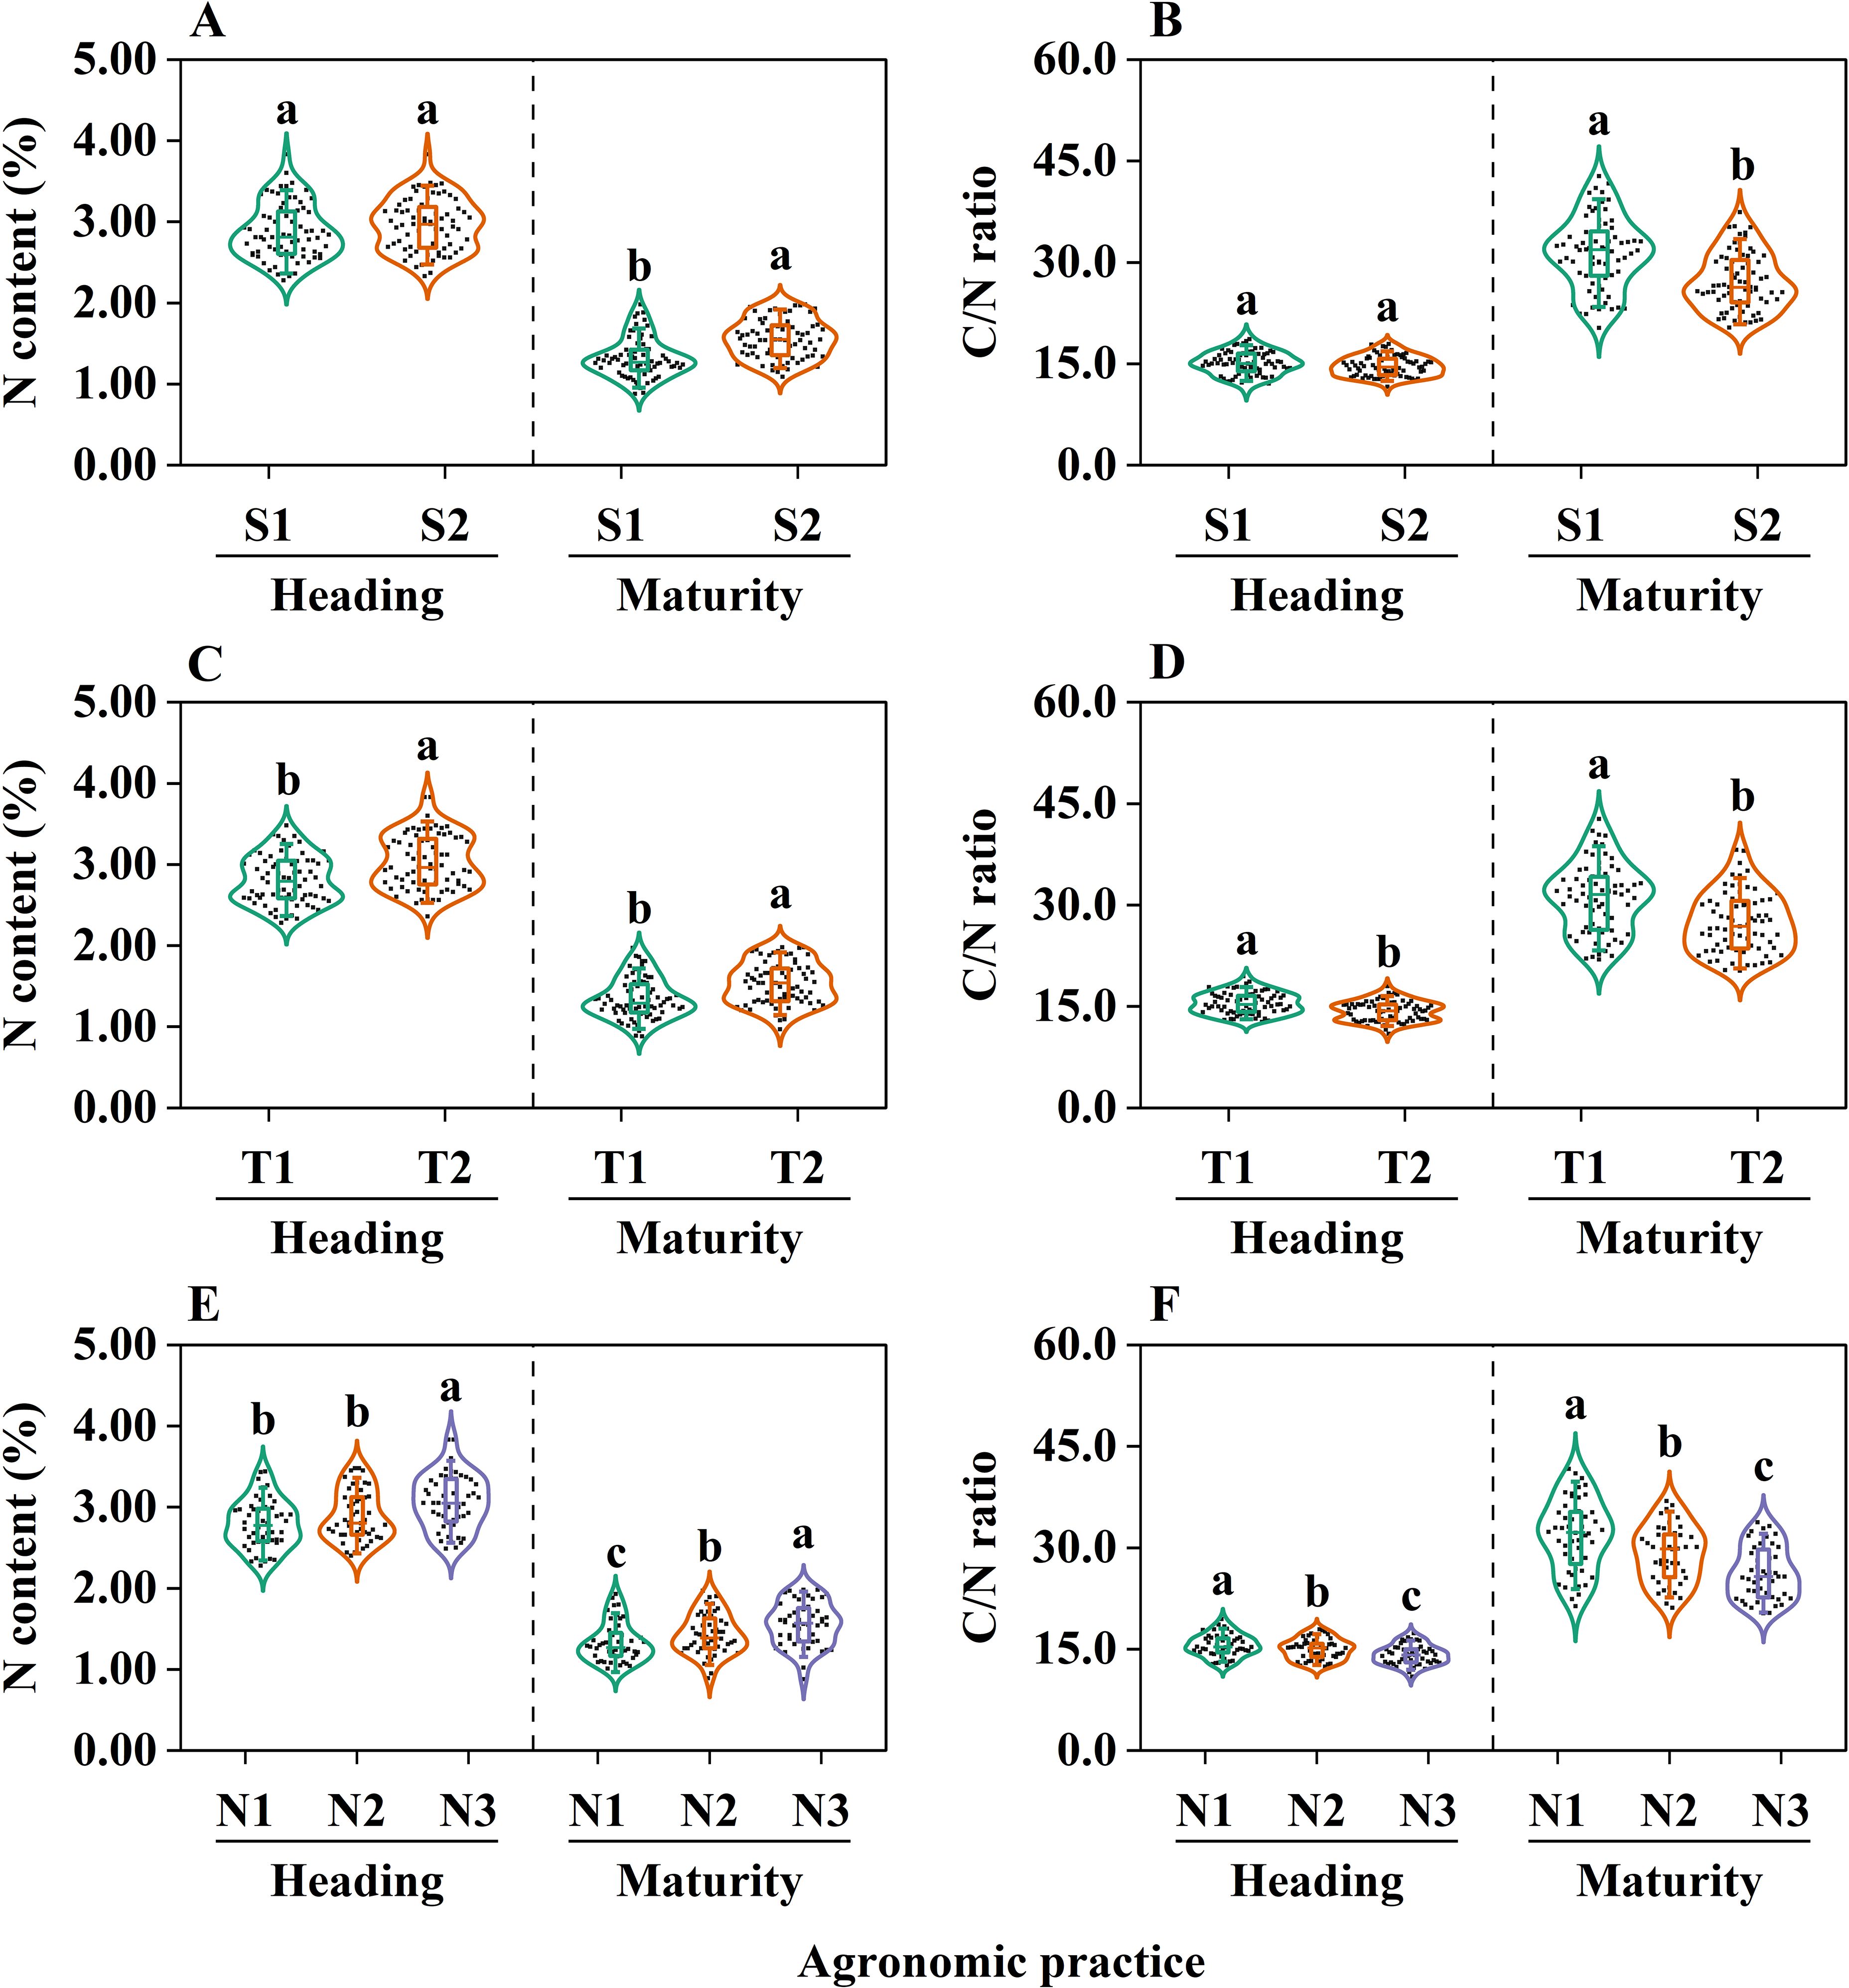
Figure 2. The effects of different sowing dates, N rates, and N split-application ratios on the leaf N content (A, C, E) and C/N ratio (B, D, F) for tested cultivars. The different lowercase letters within the same figure indicate significant differences at the 0.05 level. S1 and S2 denote the sowing dates of May 9th and 29th, respectively. T1 and T2 denote the N rate of 165 and 225 kg N ha-1, respectively. N1, N2, and N3 denote N split-application ratios among the basal (1 day before transplanting), early tillering (7 days after transplanting), and panicle initiation stages of 5:2:3, 4:2:4, and 3:2:5, respectively. Values of sowing date were averaged across two N rates × three N split-application ratios × three biological replications × two cultivars × two years (n = 72). Values of N rate were averaged across two sowing dates × three N split-application ratios × three biological replications × two cultivars × two years (n = 72). Values of N split-application ratio were averaged across two sowing dates × two N rates × three biological replications × two cultivars × two years (n = 48).
3.2 Effects of sowing date and N management on grain quality
In both 2022 and 2023, significant variations were observed in head rice rate, amylose and protein content, the peak, breakdown, and setback viscosity under different sowing dates, N rates, and N split-application ratios in two cultivars (Tables 2, 3). In contrast, no consistent significant differences were observed in brown and milled rice rate, chalky grain rate, chalkiness degree, trough, final, consistency and viscosity, pasting temperature, peak time across different sowing dates and N management. Additionally, no consistent interactions were found for all grain quality across different sowing dates and N management. Therefore, the following analysis for grain quality focused on the head rice rate, amylose and protein content, peak, breakdown, and setback viscosity.
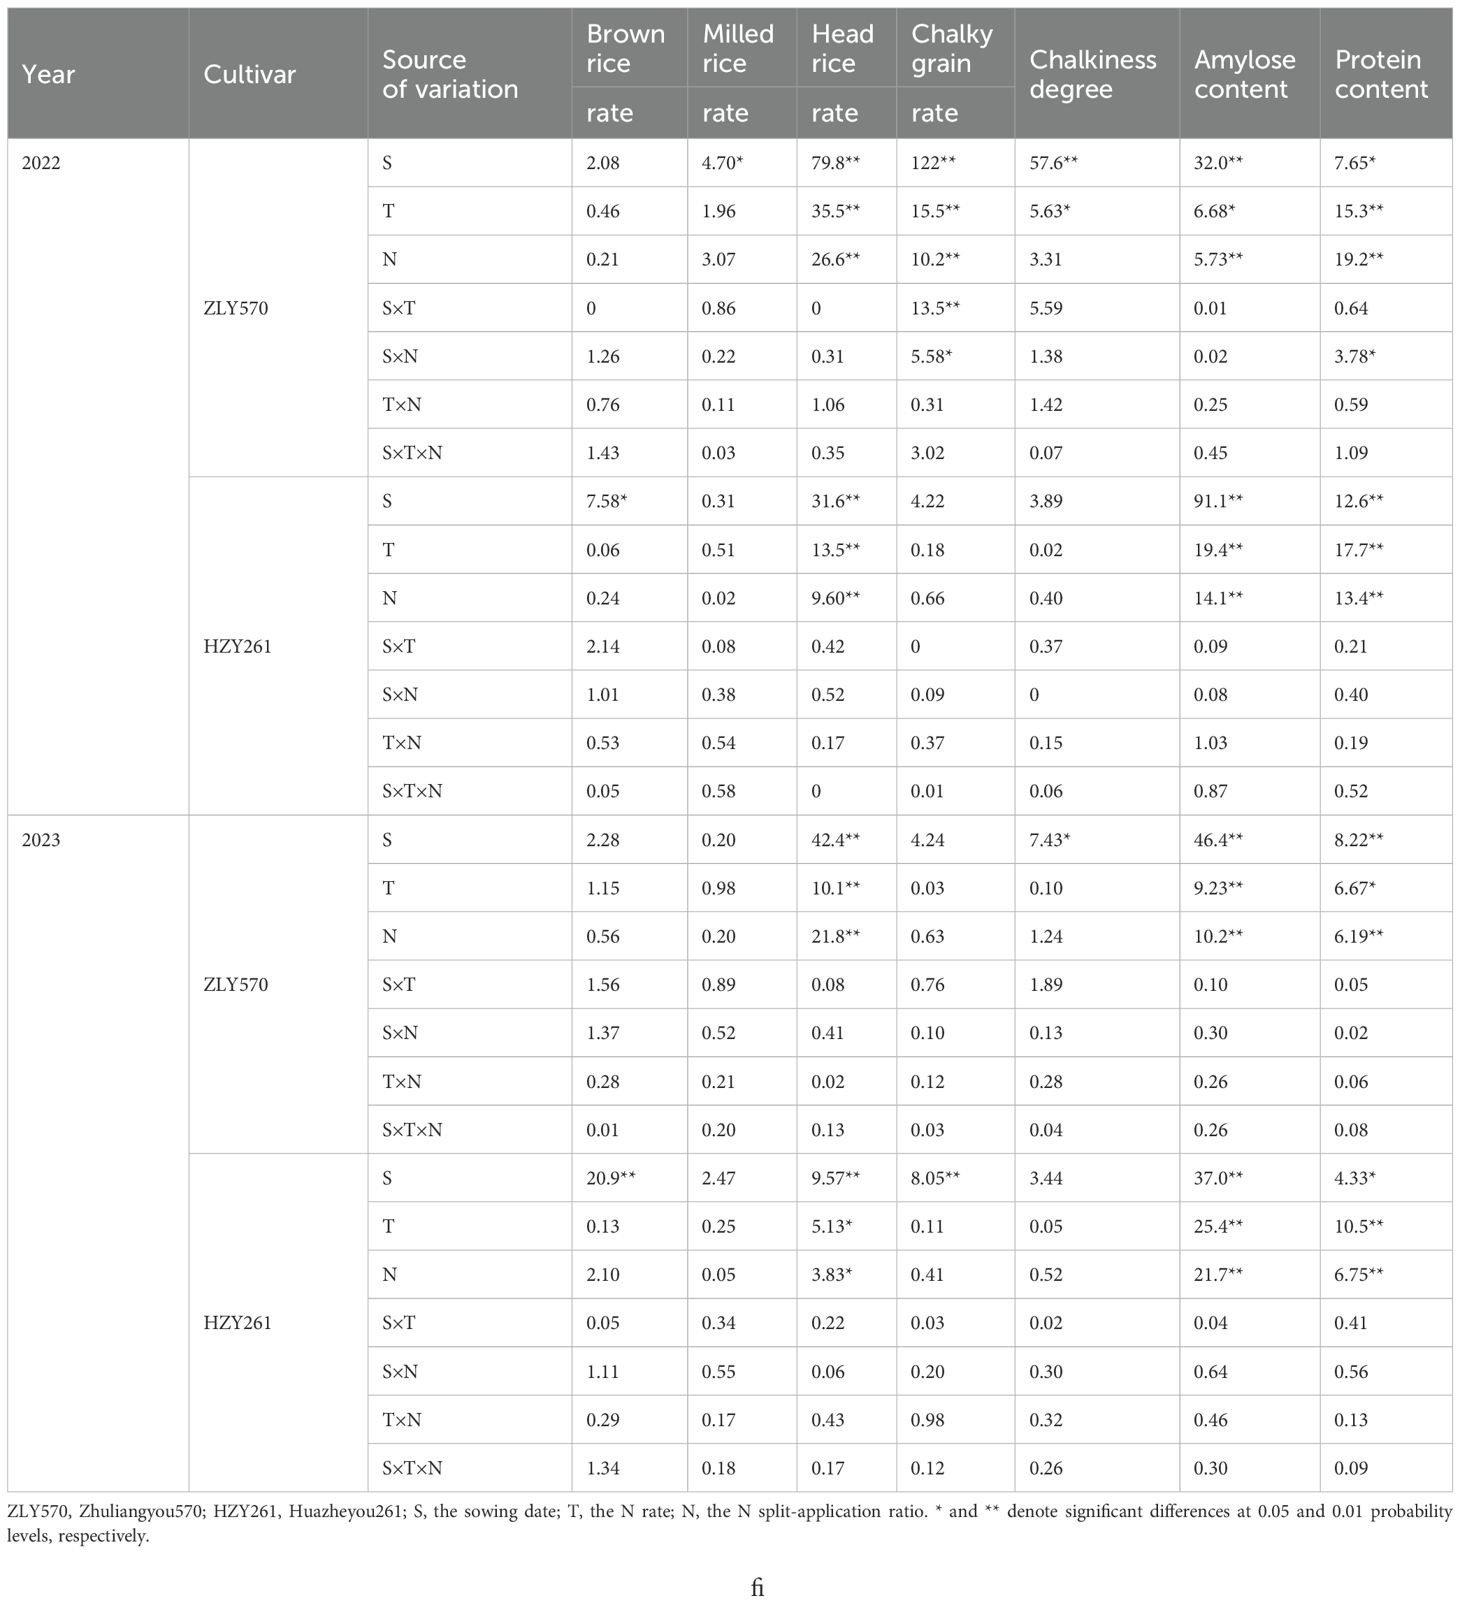
Table 2. ANOVA (F value) results of grain quality effected by different sowing dates, N rates, and N split-application ratios.
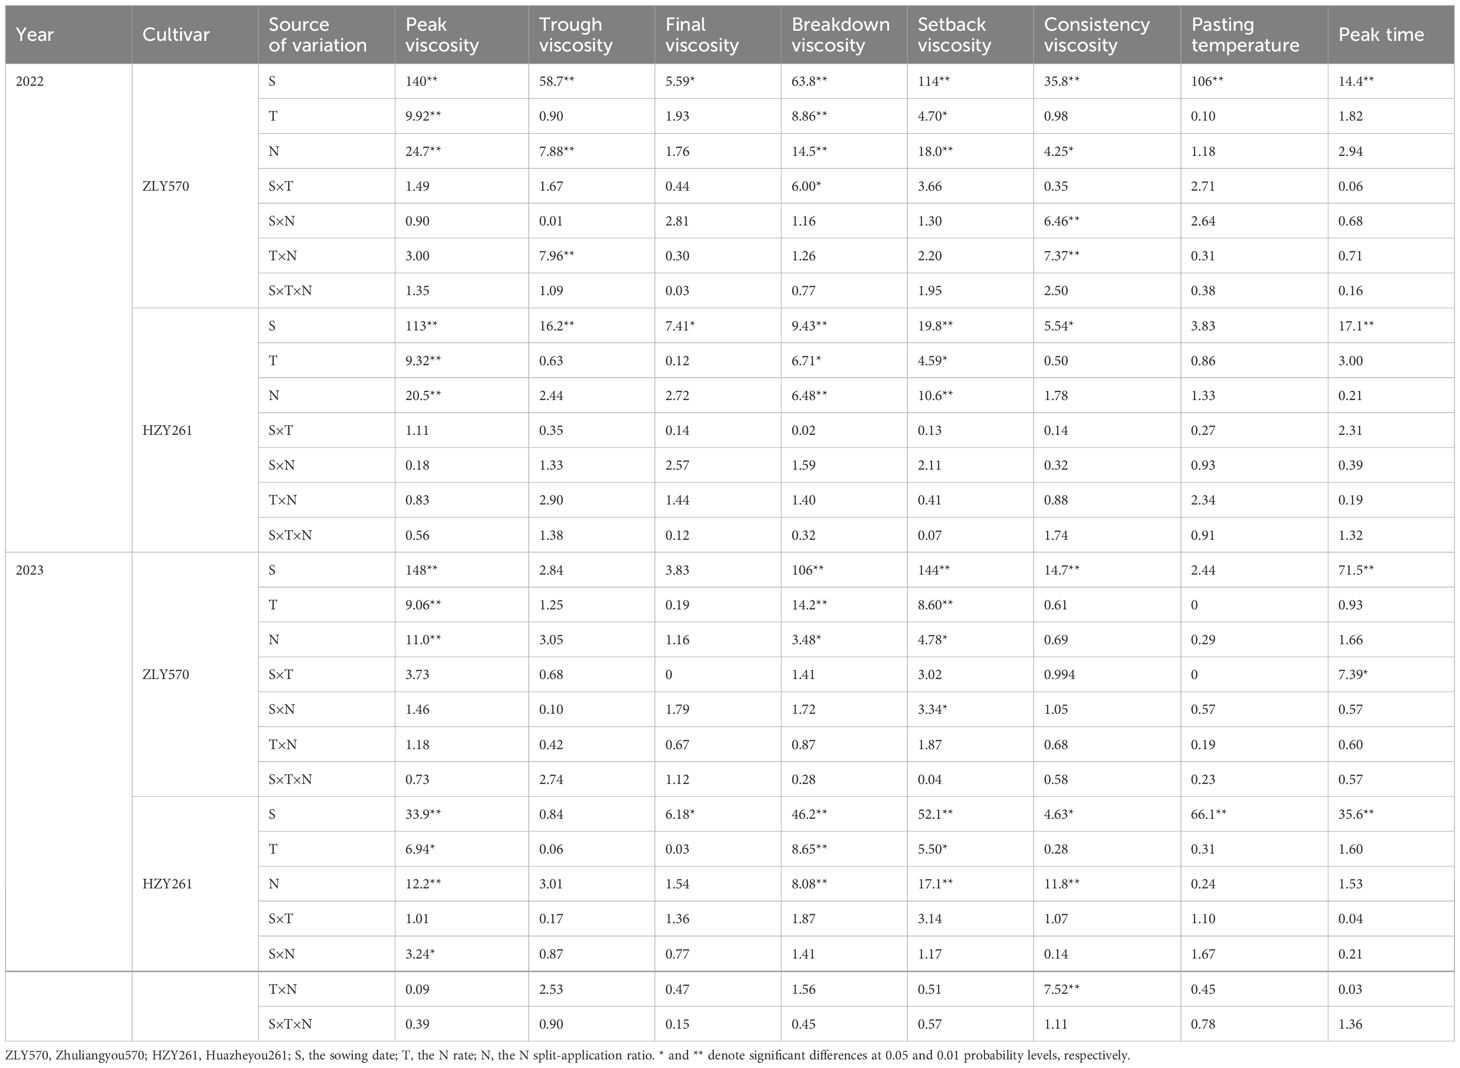
Table 3. ANOVA (F value) results of rice flour pasting properties effected by different sowing dates, N rates, and N split-application ratios.
On average across rice cultivars and years, S2 showed higher head rice rate, amylose content, and setback viscosity than S1 by 11.1%, 15.4%, and 36.7%, and lower protein content, peak and breakdown viscosity by 5.57%, 8.26% and 11.9%, respectively (Figures 3, 4). Compared to T1, T2 exhibited higher head rice rate, amylose and protein content, and setback viscosity by an average of 6.81%, 8.04%, 7.21% and 9.99%, and lower peak and breakdown viscosity by an average of 2.00% and 4.68%, respectively. Relative to N1, N2 and N3 boosted head rice rate, amylose and protein content, and setback viscosity by an average of 6.59%–11.8%, 7.85%–13.4%, 6.45%–12.0%, 7.56%–28.4%, and reduced the peak and breakdown viscosity by an average of 2.40%–5.94%, 0.79%–7.78%, respectively.
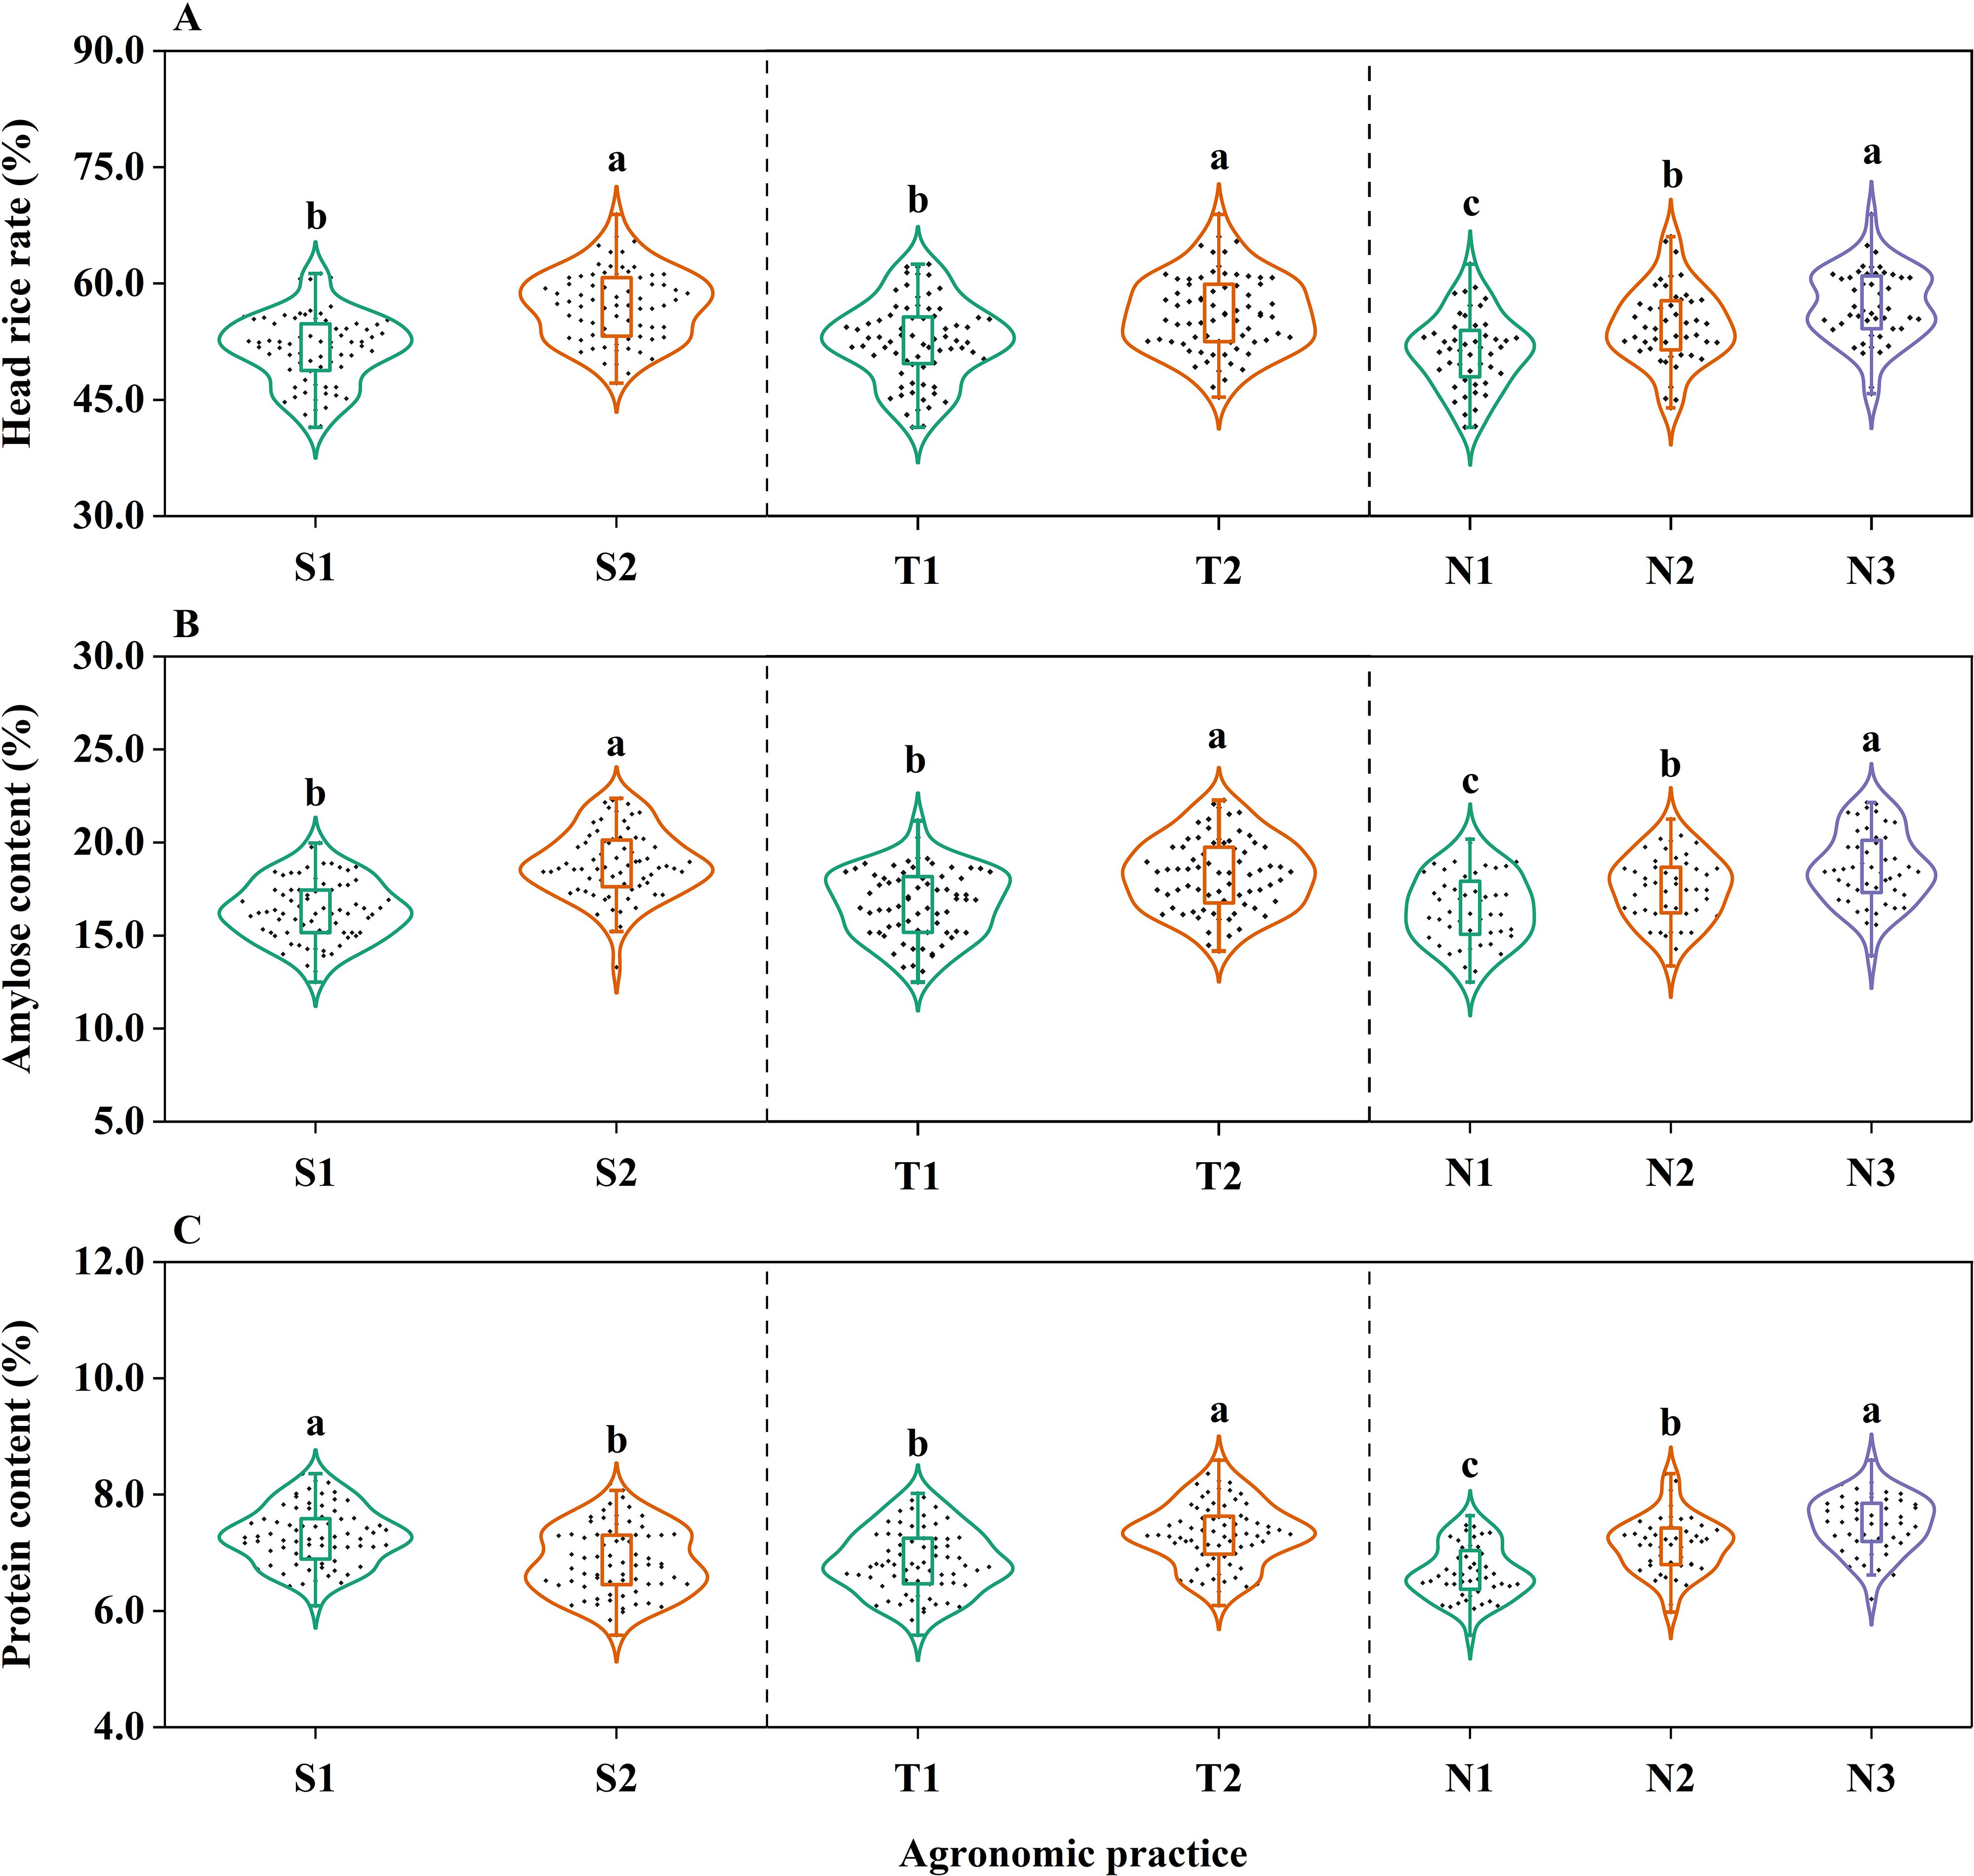
Figure 3. The effects of different sowing dates, N rates, and N split-application ratios on the head rice rate (A), amylose (B) and protein content (C) for tested cultivars. The different lowercase letters within the same figure indicate significant differences at the 0.05 level. S1 and S2 denote the sowing dates of May 9th and 29th, respectively. T1 and T2 denote the N rate of 165 and 225 kg N ha-1, respectively. N1, N2, and N3 denote N split-application ratios among the basal (1 day before transplanting), early tillering (7 days after transplanting), and panicle initiation stages of 5:2:3, 4:2:4, and 3:2:5, respectively. Values of sowing date were averaged across two N rates × three N split-application ratios × three biological replications × two cultivars × two years (n = 72). Values of N rate were averaged across two sowing dates × three N split-application ratios × three biological replications × two cultivars × two years (n = 72). Values of N split-application ratio were averaged across two sowing dates × two N rates × three biological replications × two cultivars × two years (n = 48).
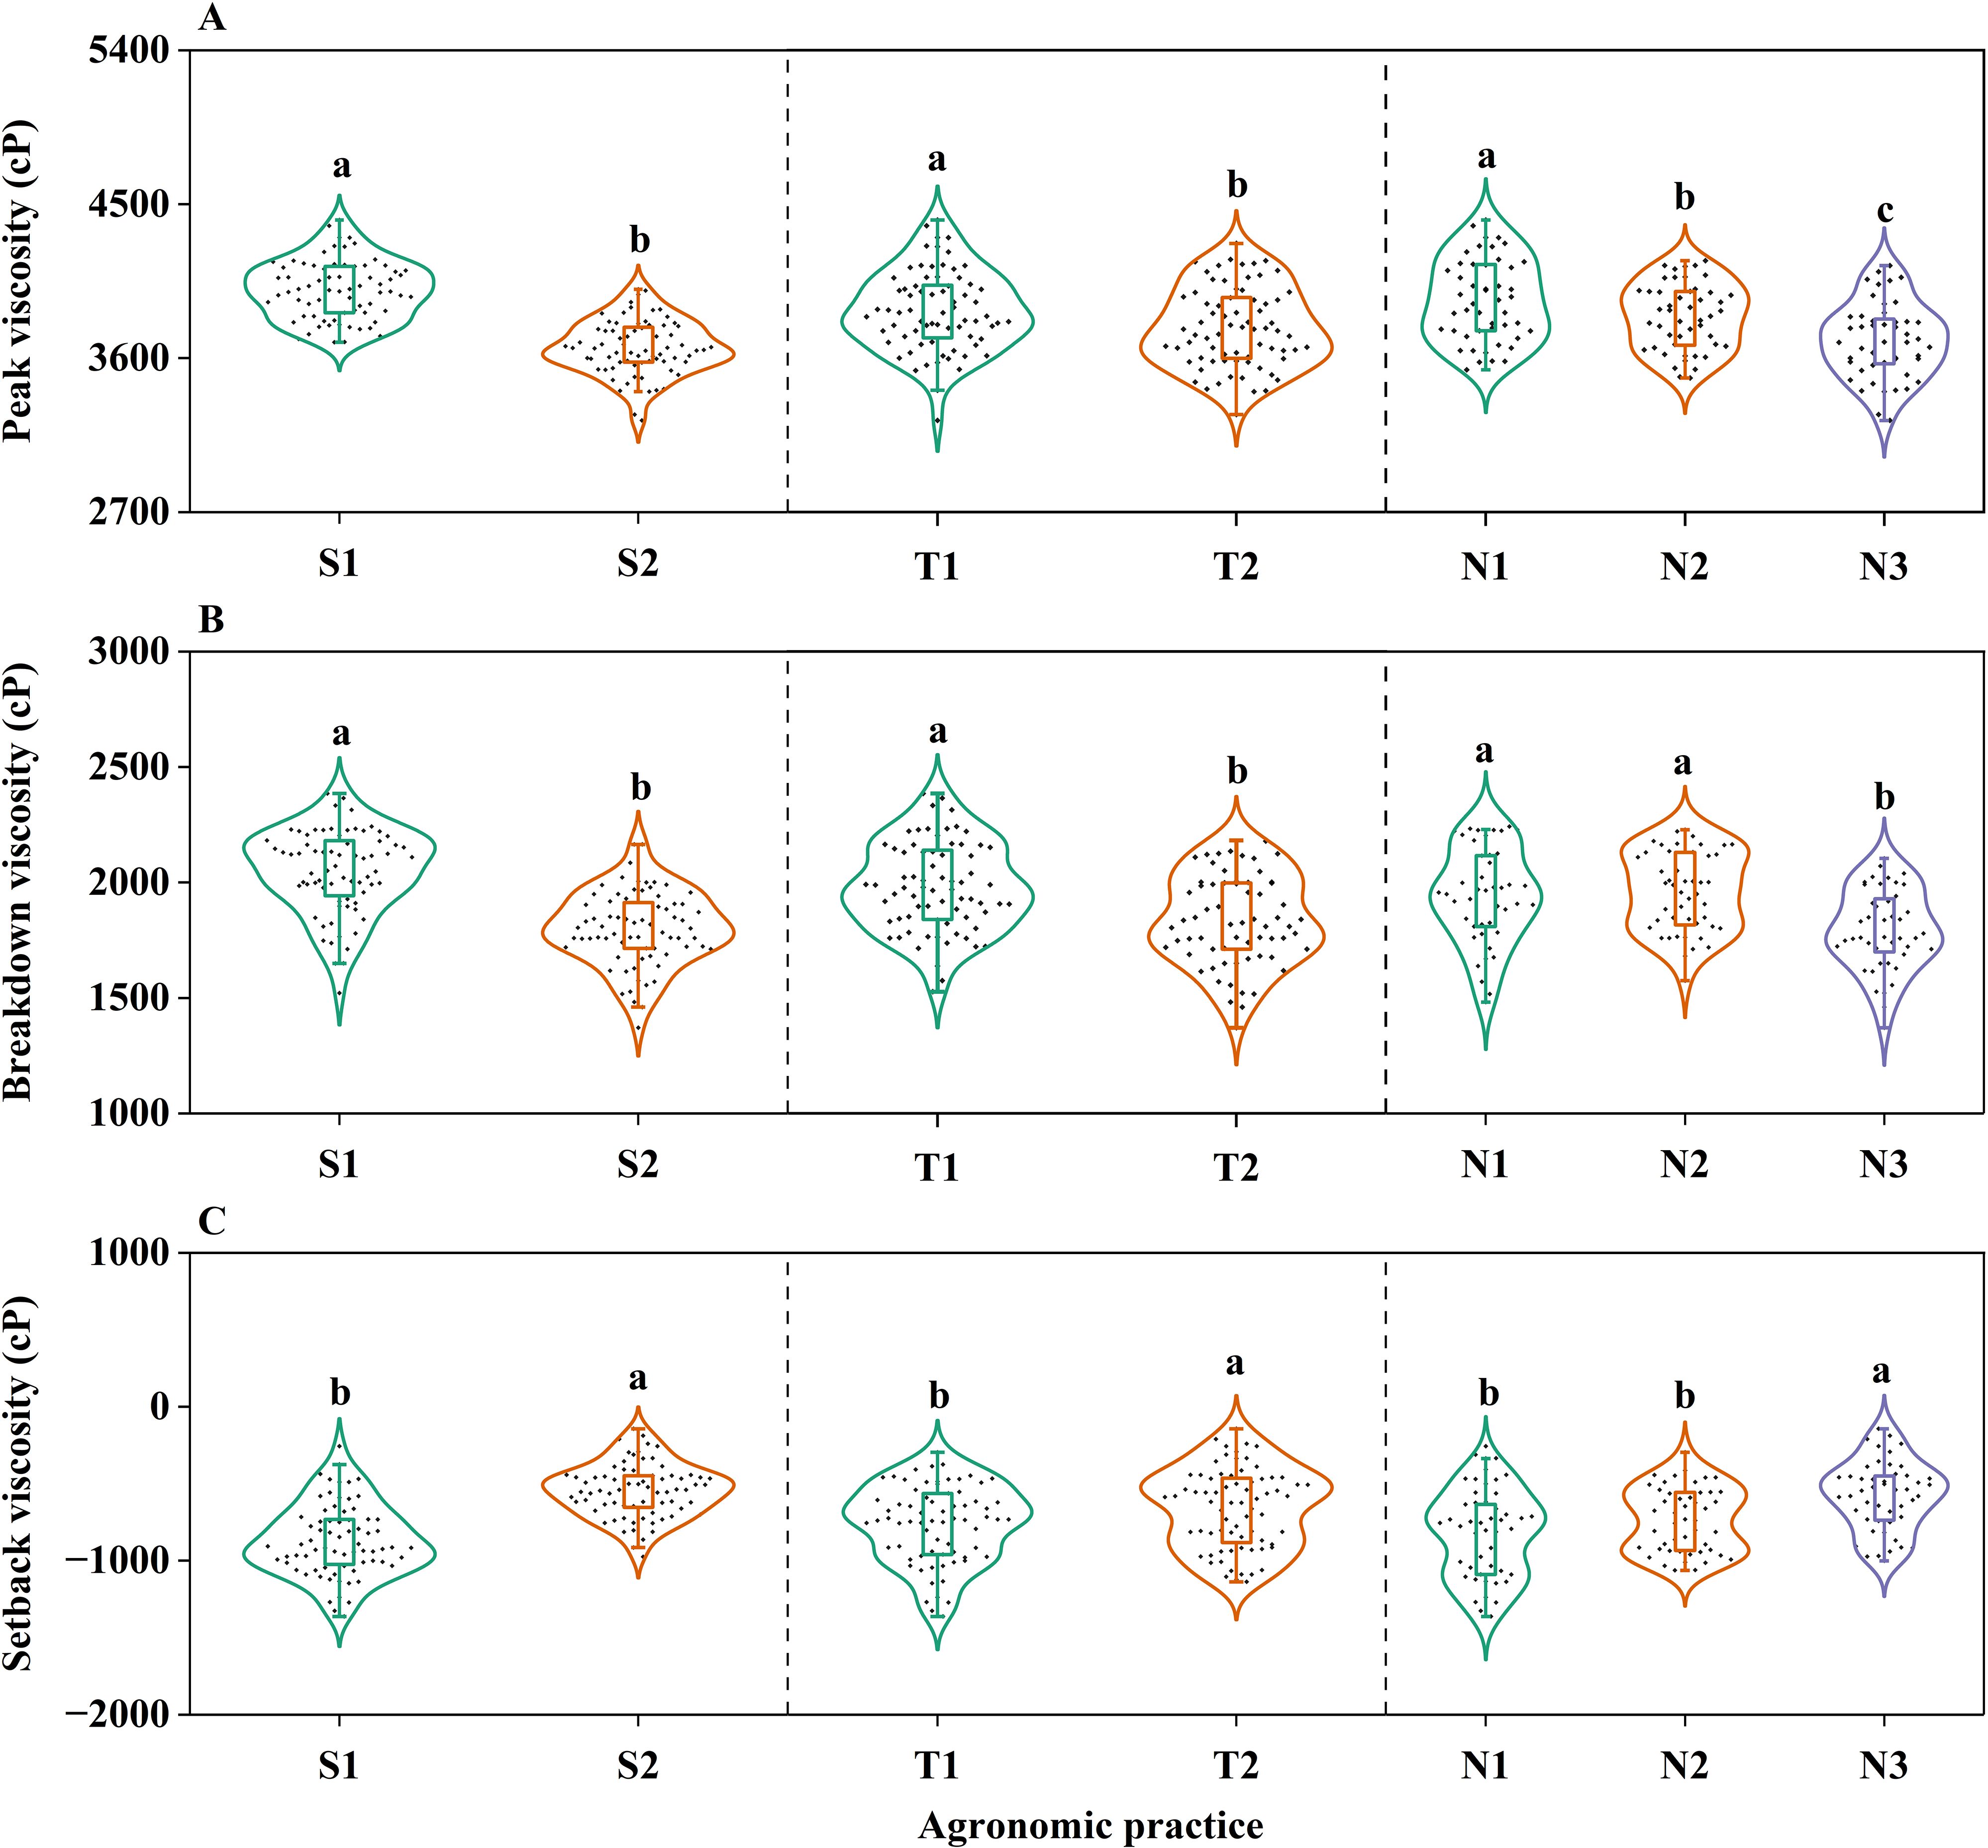
Figure 4. The effects of different sowing dates, N rates, and N split-application ratios on the peak viscosity (A), breakdown viscosity (B), and setback viscosity (C) for tested cultivars. The different lowercase letters within the same figure indicate significant differences at the 0.05 level. S1 and S2 denote the sowing dates of May 9th and 29th, respectively. T1 and T2 denote the N rate of 165 and 225 kg N ha-1, respectively. N1, N2, and N3 denote N split-application ratios among the basal (1 day before transplanting), early tillering (7 days after transplanting), and panicle initiation stages of 5:2:3, 4:2:4, and 3:2:5, respectively. Values of sowing date were averaged across two N rates × three N split-application ratios × three biological replications × two cultivars × two years (n = 72). Values of N rate were averaged across two sowing dates × three N split-application ratios × three biological replications × two cultivars × two years (n = 72). Values of N split-application ratio were averaged across two sowing dates × two N rates × three biological replications × two cultivars × two years (n = 48).
3.3 The relationship between grain quality and the leaf C and N content, and C/N ratio
Significant positive correlations were discovered between head rice rate, amylose and protein content with leaf N content at the heading and maturity stages, with opposite trends were observed for the leaf C/N ratio (Figures 5A, B, E, F). However, no significant correlations were indicated between head rice rate, amylose and protein content with leaf C content, except for a negative correlation between protein content and leaf C content the at the maturity stage (Figure 5D). Peak and breakdown viscosity significantly decreased with raising leaf N content at the maturity stage, but increased in setback viscosity (Figure 6B). Conversely, peak and breakdown viscosity markedly enhanced with increasing leaf C/N ratio at the maturity stage, while reducing in setback viscosity (Figure 6F). There were no significant correlations between peak, breakdown, and setback viscosity and leaf C content at both the heading and maturity stages (Figures 6C, D).
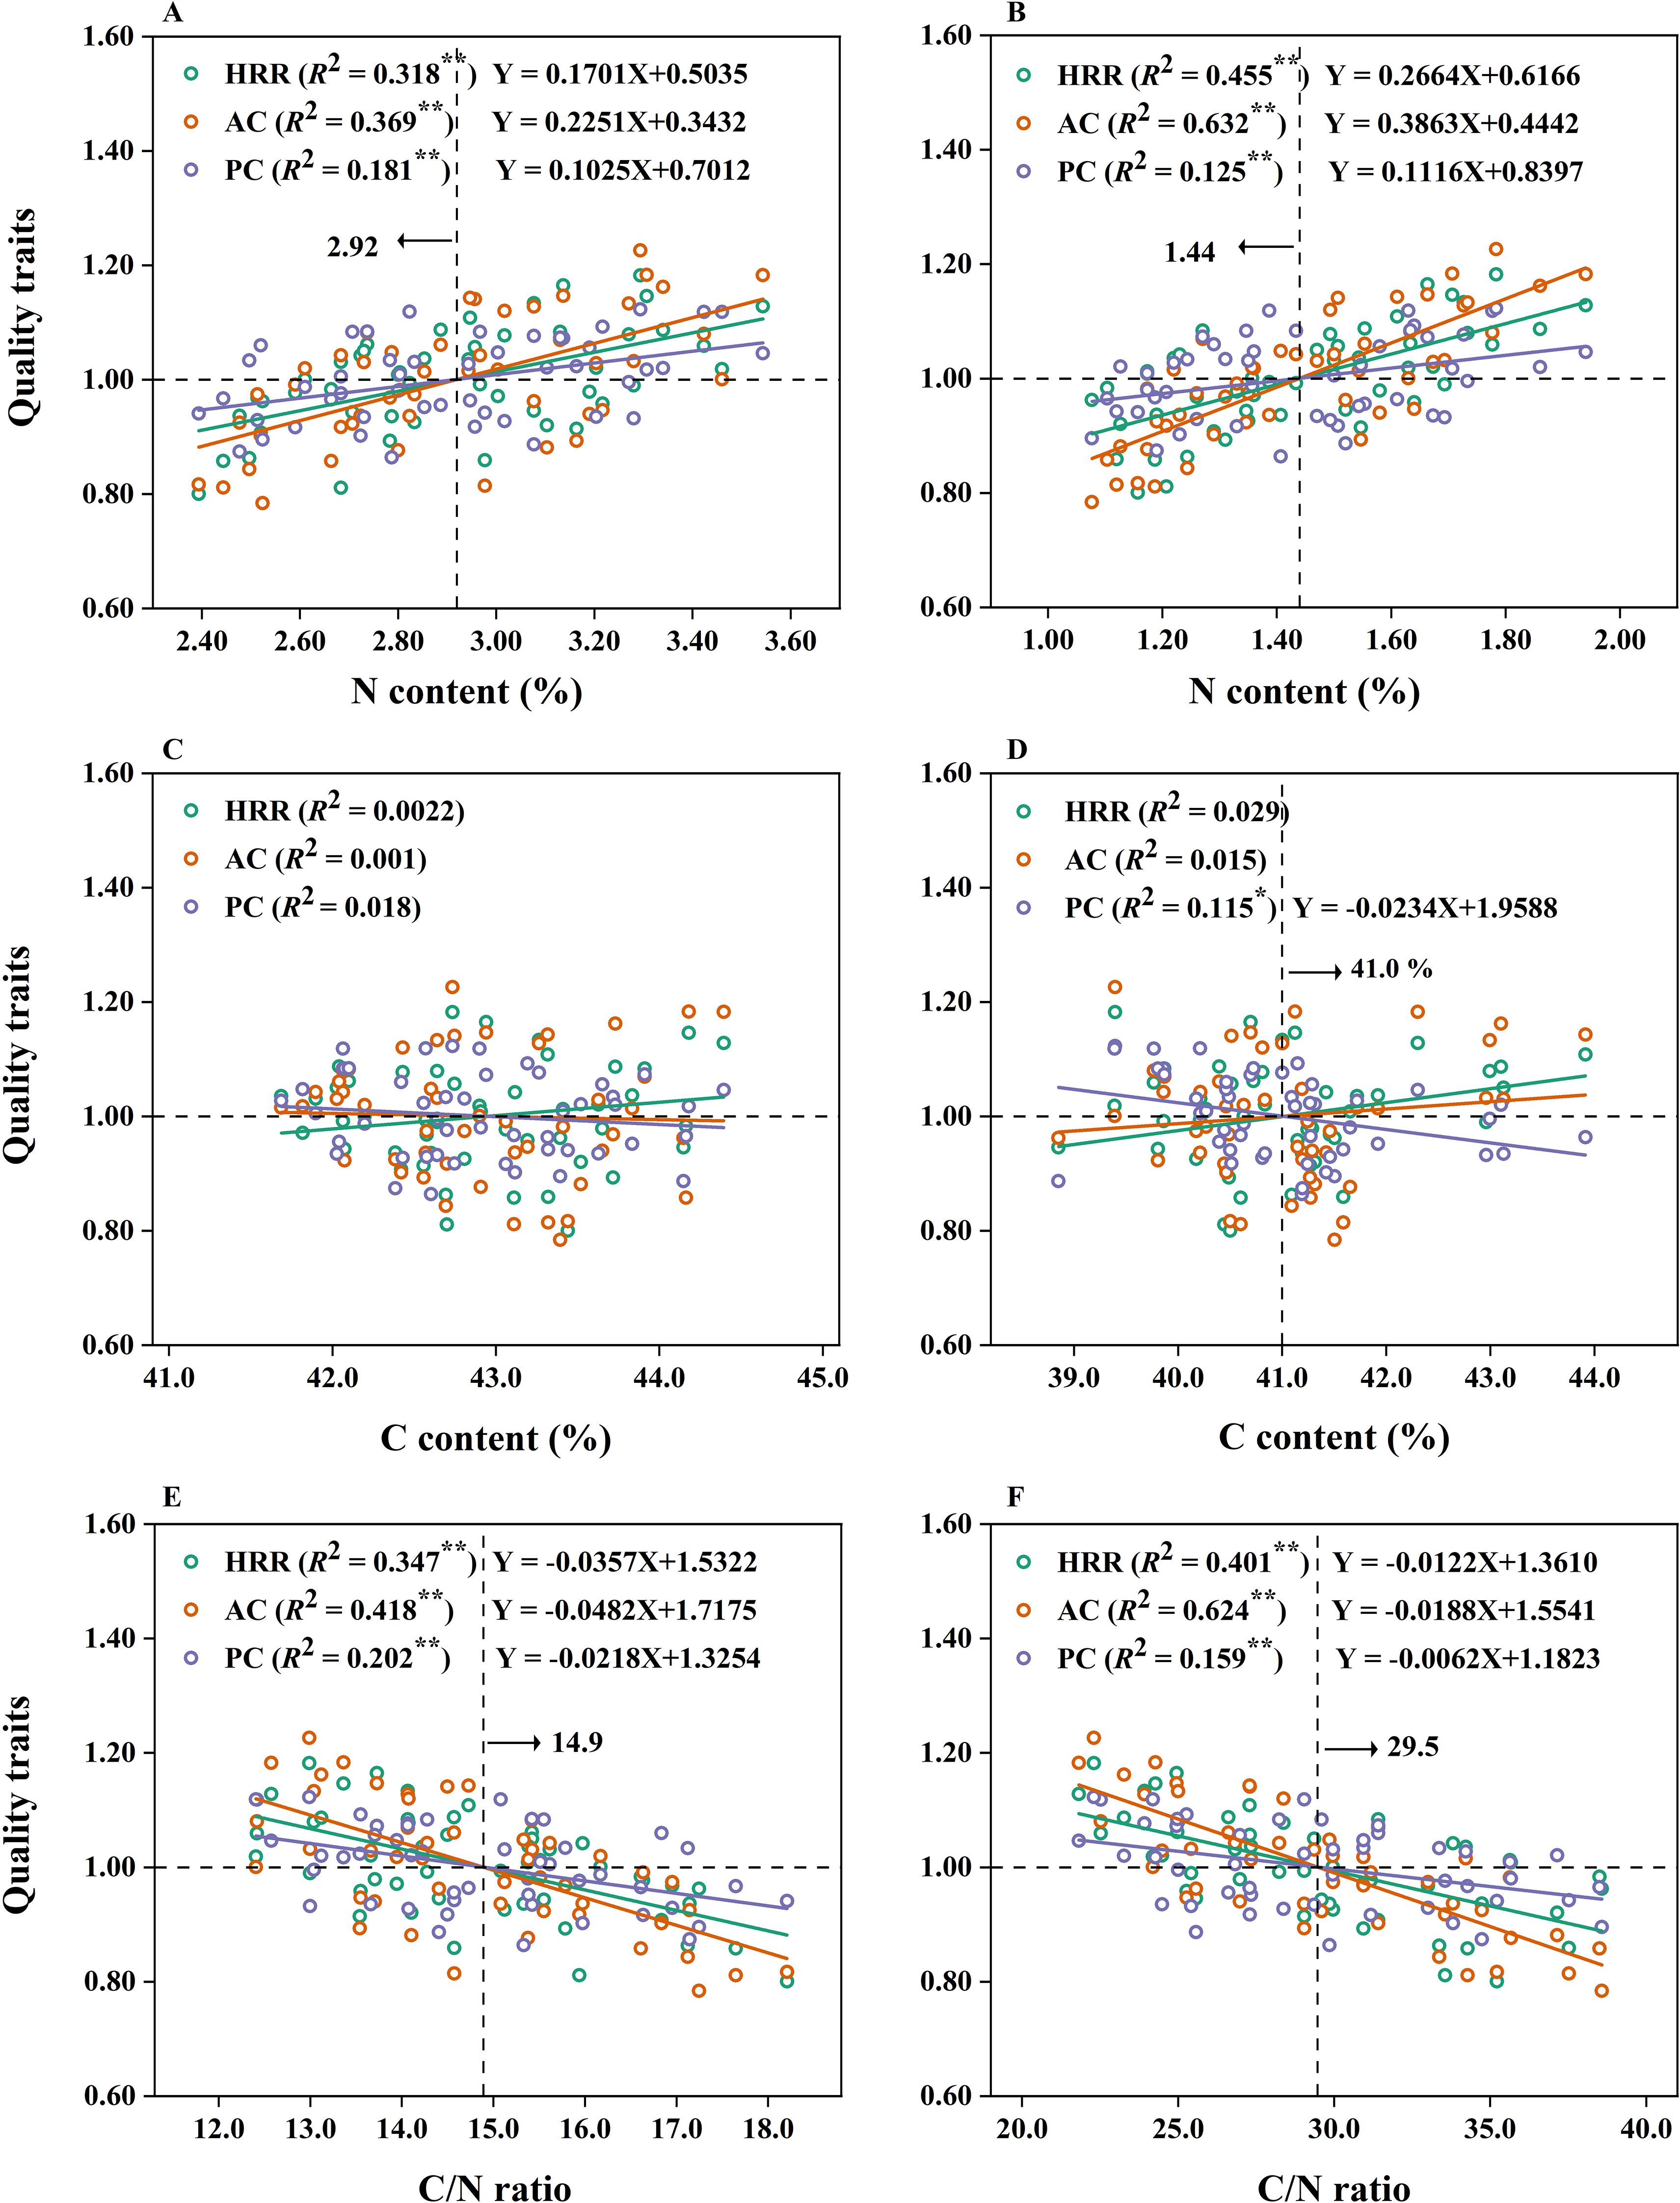
Figure 5. The relationship between quality traits and leaf C and N content, and C/N ratio at the heading and (A, C, E) maturity (B, D, F) stages. * and ** denote significant correlation at 0.05 and 0.01 levels, respectively. The dotted lines denote the N or C content, or C/N ratio for the quality trait at 1.00. HRR, head rice rate; AC, amylose content; PC, protein content. n= 48 (2 cultivars, 2 sowing dates, 2 N rates, 3 N split-application ratios, and 2 years).
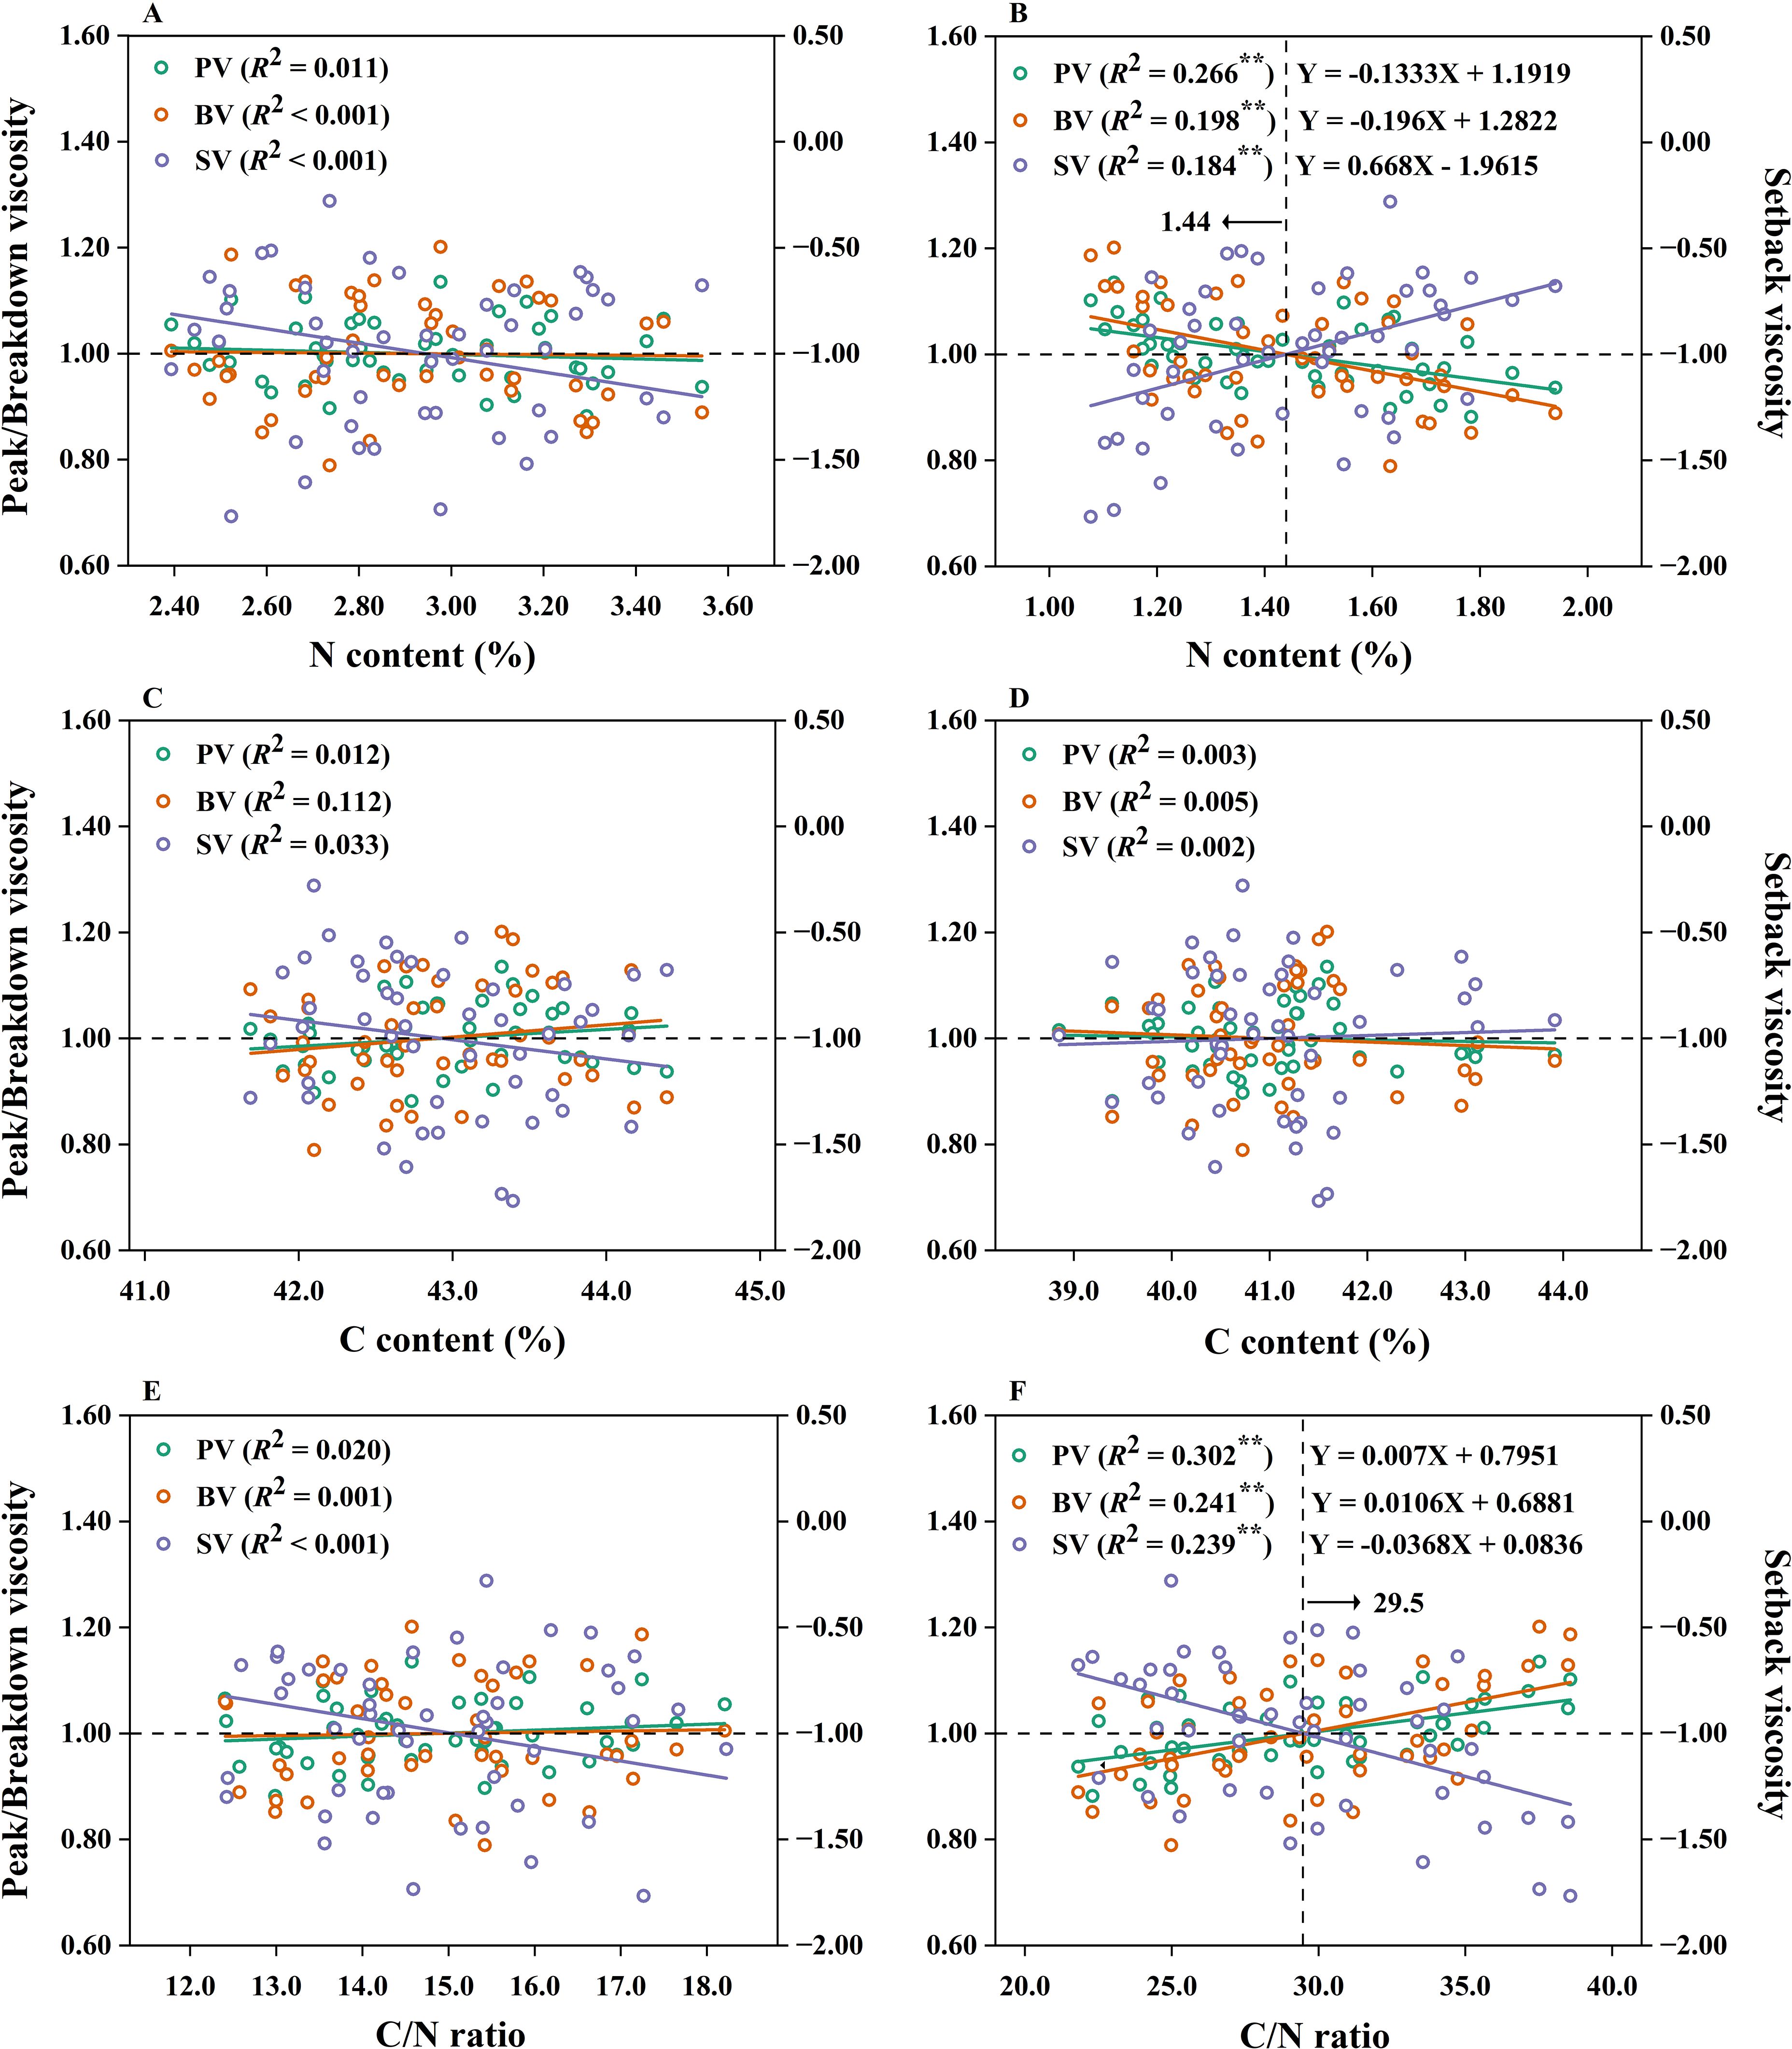
Figure 6. The relationship between rice flour pasting properties and leaf C and N content, and C/N ratio at the heading and (A, C, E) maturity (B, D, F) stages. * and ** denote significant correlation at 0.05 and 0.01 levels, respectively. The dotted lines denote the N or C content, or C/N ratio for the rice flour pasting property at 1.00. PV, peak viscosity; BV, breakdown viscosity; SV, setback viscosity. n= 48 (2 cultivars, 2 sowing dates, 2 N rates, 3 N split-application ratios, and 2 years).
When leaf N content was below 2.92% and 1.44% at the heading and maturity stages, and the leaf C/N ratio was above 14.9 and 29.5, respectively, higher peak and breakdown viscosity were observed, along with lower head rice rate, amylose and protein content, and setback viscosity were indicated (Figures 5, 6).
4 Discussion
4.1 Effects of sowing date on grain quality
Shifting the sowing date can alter the growth process and temperature conditions for rice (Huang et al., 2022c). The temperature during the grain-filling stage is the most critical climatic factor in determining the formation of grain quality (Huang et al., 2013). In this study, delaying the sowing date decreased the daily mean temperature by an average of 3.5 °C and prolonged the duration by an average of 6 d during the grain-filling stage (Figure 1). In line with previous studies, a lower daily mean temperature of the grain-filling stage significantly increased the head rice rate while decreasing protein content (Deng et al., 2022; Tu et al., 2022). The finding indicated that delaying the sowing date can enhance milling quality but is not beneficial to improving nutritional quality. This can be explained by the fact that lower grain-filling temperature extends the grain-filling duration by slowing down the rate of grain-filling, which results in better grain plumpness and reduced fragility during processing (Xiong et al., 2024). Meanwhile, lower grain-filling temperature weakens the activity of protein synthesis enzymes and impedes the transfer of N from vegetative organs to grains, thereby reducing protein accumulation (Liu et al., 2013; Deng et al., 2022). The effect of grain-filling temperature on amylose content depends on the original amylose level of the cultivars. Lower temperatures during ripening tend to decrease amylose content in high-amylose cultivars, whereas low-amylose cultivars exhibit the opposite trend (Yin et al., 2020). In this study, both cultivars are high-quality rice cultivars with low amylose content. Therefore, delaying the sowing date significantly increased amylose content. In addition, our research showed that delaying the sowing date notably raised setback viscosity in milled rice flour but reduced the peak and breakdown viscosity. A widely held view is that rice with superior eating quality is characterized by higher peak and breakdown viscosity, as well as lower amylose content and setback viscosity (Wang et al., 2021; Huang et al., 2022c). These results indicated that despite achieving lower grain-filling temperature and longer grain-filling duration by delaying the sowing date, it did not improve the eating quality of high-quality hybrid rice.
4.2 Effects of N management on grain quality
N management is widely recognized as a crucial agronomic practice in rice production. Increasing the N rate at the late stage can encourage the protein accumulation in grains and fill the gaps in storage vacuoles of protein, resulting in a more closely arrangement of amyloplasts and protein bodies, and consequently improve milling and nutritional quality (Xiong et al., 2008; Hu et al., 2021; Wang et al., 2021). Indeed, this study also confirmed that raising the N rate and delaying N application (i.e., altering the N split-application ratios from N1 to N3) significantly increased the head rice rate and protein content. Most previous studies have stated that a high N rate and increasing N application rate at panicle initiation could reduce amylose content, but increase protein content and setback viscosity, as well as decrease peak and breakdown viscosity, thus deteriorating the eating quality (Gu et al., 2015; Zhang J. et al., 2021). However, in this study, increasing N rate and delaying N application not only led to higher protein content and worsened rice flour pasting properties, including low peak and breakdown viscosity and high setback viscosity, but also notably increased amylose content. Starch and protein are the two primary components of rice endosperm, accounting for approximately 80.0%–85.0% and 5.00%–10.0%, respectively (Shi et al., 2022; Fukai and Mitchell, 2024). A significant increase in protein content with increasing N rate and delaying N application might result in a relative decrease in starch content (Ning et al., 2021). Therefore, the increase in amylose content could be attributed to the reduction of amylopectin in both cultivars. There have been reports that support this viewpoint. For instance, Thu et al. (2014) and Wang et al. (2018) proposed that both increasing total N rate and higher dose of N application at late stage reduced the amylopectin content of rice. Similarly, Fei et al. (2023) suggested that increasing the N rate significantly reduces the activity of key enzymes involved in amylopectin synthesis, such as soluble starch synthase, and starch branching enzyme. Consequently, further research on starch components and the multiscale structure of high-quality hybrid rice is recommended.
As a by-product, we also observed that the chalky grain rate and chalkiness degree did not uniformly significant response to different sowing dates and N management. Previous studies have revealed that chalkiness was the most sensitive trait to changes in climate and nutrient conditions (Yang and Wang, 2019; Zhang J. et al., 2021). The discrepancies between this study and previous studies are possibly because both high-quality hybrid rice are slender-grain cultivars with a length-to-width ratio greater than 3. It has been reported that the slender-grain rice can reduce the occurrence of chalkiness due to short-distance transportation of assimilates from the back to the belly in grains (Huang et al., 2022a). Therefore, the chalky grain rate and chalkiness degree of two cultivars under different sowing dates and N management were both at relatively low levels, resulting in inconsistent differences. Previous studies have not focused on high-quality hybrid rice, which also highlights the targeted significance of this research.
4.3 The relationship between grain quality and leaf C and N status
In the present study, delaying the sowing date led to an increase in leaf N content and a decrease in leaf C/N ratio at the maturity stage, without significant changes observed at the heading stage. However, increasing the N rate and delaying N application significantly boosted the leaf N content at both the heading and maturity stages, while reducing the leaf C/N ratio. This could be attributed to the lower the grain-filling temperature of S2, which decreased the leaf N absorption rate, but the extended grain-filling duration compensated for the shortfall (Liu et al., 2019). High leaf N level and low C/N ratio indicate vigorous N metabolism and a relatively lower output of photosynthetic C assimilate (Hirasawa et al., 2010; Zhang Y. et al., 2021). This may be the reason for the protein content was positively correlated with the leaf N content and negatively correlated with the leaf C/N ratio at the heading stage. Simultaneously, similar correlations between protein content and leaf N content, C/N ratio at the heading stage were also found in head rice rate and amylose content. This partly explains that increasing N rate and delaying N application improved head rice rate and amylose content. The elevated leaf N content and reduced leaf C/N ratio at the maturity stage imply a slower senescence progression in rice plants (Ye et al., 2014). Hence, significant correlations between grain quality and leaf N content, C/N ratio at the maturity stage indicate that accelerating leaf senescence in high-quality hybrid rice could increase peak and breakdown viscosity while decreasing head rice rate, amylose and protein content, and setback viscosity. In this study, no remarkable correlations were exhibited between grain quality and leaf C content. The lack of correlations might stem from the limited impact of sowing date and N management on leaf C content. This discovery aligns with studies by Agren (2008) and Yang et al. (2011), which reported that leaf C content is generally unaffected by N application owing to the stable structural foundation of C in plants. In addition, our study further displayed that when leaf N content was below 2.92% and 1.44% at the heading and maturity stages, and the leaf C/N ratio was above 14.9 and 29.5, respectively, it enhanced eating quality of high-quality hybrid rice. The enhancement was attributed to a reduction in amylose and protein content, setback viscosity, and an increase in peak and breakdown viscosity. However, it did not improve of milling and nutritional quality due to low head rice rate and protein content. The aforementioned evidence emphasizes the significance of a lance of leaf C and N for coordinating grain metabolism to improve rice quality. Furthermore, it demonstrated that leaf N content and C/N ratio at the heading and maturity stages are effective indicators for diagnosing the grain quality of high-quality hybrid rice.
5 Conclusion
Delaying the sowing date can improve milling quality but deteriorate the eating and nutritional quality of high-quality hybrid rice. Increasing the N rate and delaying the N application are beneficial to milling and nutritional quality but are unfavorable for improving eating quality. The leaf N content and C/N ratio at the heading and maturity stages are effective indicators for diagnosing grain quality. When leaf N content was below 2.92% and 1.44% at the heading and maturity stages, and the leaf C/N ratio was above 14.9 and 29.5, respectively, it enhanced the eating quality but did not improve of milling and nutritional quality.
Data availability statement
The original contributions presented in the study are included in the article/supplementary material. Further inquiries can be directed to the corresponding author.
Author contributions
JX: Investigation, Writing – original draft. ML: Investigation, Writing – original draft. ZX: Investigation, Writing – review & editing. XL: Investigation, Writing – review & editing. FC: Writing – review & editing. JC: Writing – review & editing. MH: Funding acquisition, Supervision, Writing – review & editing. IA: Writing – review & editing. AI: Writing – review & editing. AW: Writing – review & editing. SG: Conceptualization, Funding acquisition, Supervision, Writing – review & editing.
Funding
The author(s) declare that financial support was received for the research and/or publication of this article. This work was supported by the China Agriculture Research System of MOF and MARA (CARS-14) and the Earmarked Fund for China Agriculture System (CARS-01-33).
Conflict of interest
The authors declare that the research was conducted in the absence of any commercial or financial relationships that could be construed as a potential conflict of interest.
Generative AI statement
The author(s) declare that no Generative AI was used in the creation of this manuscript.
Publisher’s note
All claims expressed in this article are solely those of the authors and do not necessarily represent those of their affiliated organizations, or those of the publisher, the editors and the reviewers. Any product that may be evaluated in this article, or claim that may be made by its manufacturer, is not guaranteed or endorsed by the publisher.
Abbreviations
C, carbon; HZY261, Huazheyou 261; N, nitrogen; ZLY570, Zhuliangyou 570.
References
Agren G. I. (2008). Stoichiometry and nutrition of plant growth in natural communities. Annu. Rve. Ecol. Evol. S. 39, 153–170. doi: 10.1146/annurev.ecolsys.39.110707.173515
Cao R., Zhao S., Jiao G., Duan Y., Ma L., Dong N., et al. (2022). OPAQUE3, encoding a transmembrane bZIP transcription factor, regulates endosperm storage protein and starch biosynthesis in rice. Plant Commun. 3, 100463. doi: 10.1016/j.xplc.2022.100463
Deng N., Ling X., Sun Y., Zhang C., Fahad S., Peng S., et al. (2015). Influence of temperature and solar radiation on grain yield and quality in irrigated rice system. Eur. J. Agron. 64, 37–46. doi: 10.1016/j.eja.2014.12.008
Deng F., Zhang C., He L., Liao S., Li Q., Li B., et al. (2022). Delayed sowing date improves the quality of mechanically transplanted rice by optimizing temperature conditions during growth season. Field Crop Res. 281, 108493. doi: 10.1016/j.fcr.2022.108493
Ding Y., Wang W., Zhuang Q., and Luo Y. (2020). Adaptation of paddy rice in China to climate change: The effects of shifting sowing date on yield and irrigation water requirement. Agric. Water Manage. 228, 105890. doi: 10.1016/j.agwat.2019.105890
Fei L., Yang S., Ma A., Lunzhu C., Wang M., Wang G., et al. (2023). Grain chalkiness is reduced by coordinating the biosynthesis of protein and starch in fragrant rice (Oryza sativa L.) grain under nitrogen fertilization. Field Crop Res. 302, 109098. doi: 10.1016/j.fcr.2023.109098
Fukai S. and Mitchell J. (2024). Grain yield and protein concentration relationships in rice. Crop Environ. 3, 12–24. doi: 10.1016/j.crope.2023.11.002
Gu J., Chen J., Chen L., Wang Z., Zhang H., and Yang J. (2015). Grain quality changes and responses to nitrogen fertilizer of japonica rice cultivars released in the Yangtze River Basin from the 1950s to 2000s. Crop J. 3, 285–297. doi: 10.1016/j.cj.2015.03.007
Hirasawa T., Ozawa S., Taylaran R., and Ookawa T. (2010). Varietal differences in photosynthetic rates in rice plants, with special reference to the nitrogen content of leaves. Plant Prod. Sci. 13, 53–57. doi: 10.1626/pps.13.53
Hu L., Cao J., Liu Y., Xiao Z., Zhang M., Chen J., et al. (2022). Multidimensional relationships of starch digestibility with physicochemical, pasting and textural properties of 30 rice varieties. Agronomy-Basel 12, 720. doi: 10.3390/agronomy12030720
Hu C. Y., Gu Q. Y., Guo H., Yao Y. L., Yao C. X., Wang J. P., et al. (2020). Possible influences on ammonia nitrogen determination by Nessler’s reagent spectrophotometry. J. Nat. Sci. Res. 11, 11–15. doi: 10.7176/JNSR/11-24-02
Hu Q., Liu Q., Jiang W., Qiu S., Wei H., Zhang H., et al. (2021). Effects of mid-stage nitrogen application timing on the morphological structure and physicochemical properties of japonica rice starch. J. Sci. Food Agric. 101, 2463–2471. doi: 10.1002/jsfa.10872
Huang M., Cao J., Chen J., Cao F., and Zhou C. (2022a). Slimming the grain through breeding is a practical way to reduce the chalky grain rate of middle-season hybrid rice. Agronomy-Basel 12, 1886. doi: 10.3390/agronomy12081886
Huang M., Cao J., Zhang R., Chen J., Cao F., Fang S., et al. (2022b). Late-stage vigor contributes to high grain yield in high-quality hybrid rice. Crop Environment. 1, 115–118. doi: 10.1016/j.crope.2022.05.003
Huang M., Cao J., Zhang R., Chen J., Cao F., Liu L., et al. (2022c). Delayed sowing does not improve palatability-related traits in high-quality rice. Food Chem. Adv. 1, 100096. doi: 10.1016/j.focha.2022.100096
Huang M., Jiang L., Zou Y., and Zhang W. (2013). On-farm assessment of effect of low temperature at seedling stage on early-season rice quality. Field Crop Res. 141, 63–68. doi: 10.1016/j.fcr.2012.10.019
Huang M., Zhou X., and Zou Y. (2018). Improving nitrogen management for zero-tillage rice in China. Crop J. 6, 406–412. doi: 10.1016/j.cj.2018.03.002
Liu Z., Tao L., Liu T., Zhang X., Wei W., Song J., et al. (2019). Nitrogen application after low-temperature exposure alleviates tiller decrease in rice. Environ. Exp. Bot. 158, 205–214. doi: 10.1016/j.envexpbot.2018.11.001
Liu Q., Wu X., Ma J., Li T., Zhou X., and Guo T. (2013). Effects of high air temperature on rice grain quality and yield under field condition. Agron. J. 105, 446–454. doi: 10.2134/agronj2012.0164
Liu Q., Wu X., Ma J., and Xin C. (2015). Effects of cultivars, transplanting patterns, environment, and their interactions on grain quality of japonica rice. Cereal Chem. 92, 284–292. doi: 10.1094/cchem-09-14-0194-r
López C. V. G., García M. D. C., Fernández F. G. A., Bustos C. S., Chisti Y., and Sevilla J. M. F. (2010). Protein measurements of microalgal and cyanobacterial biomass. Bioresour. Technol. 101, 7587–7591. doi: 10.1016/j.biortech.2010.04.077
Ministry of Agriculture of the PRC (2013). Determination of head rice yield, grain shape, chalky rice percentage, chalkiness degree and translucency-An image analysis method: NY/T 2334-2013 (Beijing: China Agriculture Press).
Ministry of Agriculture of the PRC (2014). Determination of amylose content in rice-Spectrophotometry method: NY/T 2639-2014 (Beijing: China Agriculture Press).
Ning H., Sun J., Liu H., Gao Y., Shen X., Wang G., et al. (2021). The effects of nitrogen application rate on the grain physicochemical properties of japonica rice under controlled and flooding irrigation. J. Sci. Food Agric. 101, 2428–2438. doi: 10.1002/jsfa.10867
Shi S., Wang E., Li C., Cai M., Cheng B., Cao C., et al. (2022). Use of protein content, amylose content, and RVA parameters to evaluate the taste quality of rice. Front. Nutr. 8. doi: 10.3389/fnut.2021.758547
Siddika M. A., Zhang J., Chen J., Qian H., Jiang Y., Raheem A. K., et al. (2019). Responses of indica rice yield and quality to extreme high and low temperatures during the reproductive period. Eur. J. Agron. 106, 30–38. doi: 10.1016/j.eja.2019.03.004
State Administration for Market Regulation and Standardization Administration of China (2017). High-quality paddy: GB/T 17891-2017 (Beijing: Standards Press of China).
Tang S., Zhang H., Liu W., Dou Z., Zhou Q., Chen W., et al. (2019). Nitrogen fertilizer at heading stage effectively compensates for the deterioration of rice quality by affecting the starch-related properties under elevated temperatures. Food Chem. 277, 455–462. doi: 10.1016/j.foodchem.2018.10.137
Thu T. T. P., Yamakawa T., and Moe K. (2014). Effect of nitrogen application timing on growth, grain yield and eating quality of the KD18 and TH3–3 rice varieties. J. Faculty Agriculture Kyushu Univ. 59, 55–64. doi: 10.5109/1434380
Tu D., Wu W., Xi M., Zhou Y., Xu Y., Chen J., et al. (2022). Effect of temperature and radiation on indica rice yield and quality in middle rice cropping system. Plants 11, 2697. doi: 10.3390/plants11202697
Tumanian N., Kumejko T., Chizhikova S., Papulova E., and Garkusha S. (2020). Impact of nitrogen fertilizers on protein and amylose content in grain of rice varieties grown in different agrolandscapes of Krasnodar region. E3S Web Conf. 175, 7009. doi: 10.1051/e3sconf/202017507009
Wang J., Lu Y. P., Wang J., Xu R. X., Li J., Hu W., et al. (2018). Effects of elevated nitrogen application on nitrogen partitioning, plant growth, grain quality and key genes involved in glutamate biosynthesis among three rice genotypes. Chil. J. Agric. Res. 78, 152–164. doi: 10.4067/S0718-58392018000200152
Wang X., Wang K., Yin T., Zhao Y., Liu W., Shen Y., et al. (2021). Nitrogen fertilizer regulated grain storage protein synthesis and reduced chalkiness of rice under actual field warming. Front. Plant Sci. 12. doi: 10.3389/fpls.2021.715436
Xiong R., Tan X., Wang H., Pan X., Zeng Y., and Zeng Y. (2024). Optimized nitrogen fertilizer application strategy improves grain yield and quality of high-quality late indica rice under field ambient warming. Eur. J. Agron. 154, 127091. doi: 10.1016/j.eja.2024.127091
Xiong F., Wang Z., Gu Y.-J., Chen G., and Zhou P. (2008). Effects of nitrogen application time on caryopsis development and grain quality of rice variety Yangdao 6. Rice Sci. 15, 57–62. doi: 10.1016/S1672-6308(08)60020-7
Yang Y., Luo Y., Lu M., Schädel C., and Han W. (2011). Terrestrial C: N stoichiometry in response to elevated CO2 and N addition: a synthesis of two meta-analyses. Plant Soil. 343, 393–400. doi: 10.1007/s11104-011-0736-8
Yang L. and Wang Y. (2019). “Impact of climate change on rice grain qualit,” in Rice, 4th ed.Ed. Bao J. (New Orleans, LA: Elsevier Inc.), 427–441. doi: 10.1016/B978-0-12-811508-4.00013-7
Ye Y., Liang X., Chen Y., Li L., Ji Y., and Zhu C. (2014). Carbon, Nitrogen and phosphorus accumulation and partitioning, and C: N: P stoichiometry in late-season rice under different water and nitrogen managements. PloS One 9, e101776. doi: 10.1371/journal.pone.0101776
Yin X., Zhang H., Chen J., Zhang R., Liu L., Huang M., et al. (2020). Performance of soft rice (Oryza sativa L.) grown in early season in China. Phyton-Int. J. Exp. Bot. 89, 97–102. doi: 10.32604/phyton.2020.08093
Yuan L. (2016). Research and development of hybrid rice in China. Sci. Technol. Rev. 34, 64–65. doi: 10.3981/j.issn.1000-7857.2016.20.010
Zhang Y., Cui D., Yang Y., Liu H., Yang H., and Zhao Y. (2021). Ecological stoichiometric characteristics and influencing factors of carbon, nitrogen, and phosphorus in the leaves of Sophora alopecuroides L. in the Yili River Valley, Xinjiang. PeerJ 9, e11701. doi: 10.7717/peerj.11701
Keywords: grain quality, hybrid rice, leaf carbon and nitrogen, nitrogen management, sowing date
Citation: Xie J, Liu M, Xiao Z, Li X, Cao F, Chen J, Huang M, Ali I, Iqbal A, Wahab A and Guo S (2025) Relationships between grain quality and leaf carbon and nitrogen status in high-quality hybrid rice across different sowing dates and nitrogen management. Front. Agron. 7:1664142. doi: 10.3389/fagro.2025.1664142
Received: 11 July 2025; Accepted: 22 July 2025;
Published: 07 August 2025.
Edited by:
Ping Liao, Yangzhou University, ChinaReviewed by:
Taotao Yang, Guangdong Academy of Agricultural Sciences (GDAAS), ChinaChen Cheng, Gannan Normal University, China
Copyright © 2025 Xie, Liu, Xiao, Li, Cao, Chen, Huang, Ali, Iqbal, Wahab and Guo. This is an open-access article distributed under the terms of the Creative Commons Attribution License (CC BY). The use, distribution or reproduction in other forums is permitted, provided the original author(s) and the copyright owner(s) are credited and that the original publication in this journal is cited, in accordance with accepted academic practice. No use, distribution or reproduction is permitted which does not comply with these terms.
*Correspondence: Shuchun Guo, MjAwMTE0MDUwQDE2My5jb20=
†These authors have contributed equally to this work