 Manuel Quintanilla-Albornoz
 Xavier Miarnau
 Magi Pamies-Sans1
 Joaquim Bellvert
- 1IRTA, Efficient Use of Water in Agriculture, Fruitcentre, Lleida, Catalonia, Spain
- 2Department of Viticulture and Enology, University of California-Davis, Davis, CA, United States
- 3IRTA, Fruit Production, Fruitcentre, Lleida, Catalonia, Spain
Accurate almond yield prediction is essential for supporting decision-making across multiple scales, from individual growers to international markets. This is crucial in the Mediterranean region, where diminishing water resources pose significant challenges to the almond industry. In this study, remote sensing-based evapotranspiration estimates were evaluated for predicting almond yield at the orchard scale using machine learning (ML) algorithms. The almond prediction models were calibrated and validated using data provided by commercial growers, along with meteorological reanalysis and remote sensing products. The remote sensing products included: i) spectral indices, ii) vegetation biophysical traits retrieved from Sentinel-2, and iii) actual evapotranspiration (ETa) estimated using the Priestley-Taylor two-source energy balance (TSEB-PT) model driven by Copernicus-based data. Almond yield data were collected from commercial orchards located in Spain’s Ebro and Guadalquivir basins from 2017 to 2022. Data collected from growers enables the establishment of almond water production functions at the orchard scale, yielding results comparable to those reported in experimental study sites. Almond yield prediction models calibrated with remote sensing data demonstrated predictive accuracy comparable to that of models relying on ground-truth variables provided by farmers, such as irrigation, orchard age, tree density, and cultivar. Among them, the PMCRS model—which integrates the fraction of absorbed photosynthetically active radiation (fAPAR), the normalized difference moisture index (NDMI), canopy chlorophyll content (Cab), ETa, and meteorological data—achieved a RMSE of 399.1 kg ha-¹ in July. These findings highlight the potential of remote sensing-based models for accurately estimating almond yield. Furthermore, the PMCRS model proved scalable and effective when applied across four almond-producing regions in the Ebro basin. Future improvements may be realized through enhanced ETa retrieval using upcoming thermal satellite missions, integration of irrigation estimates, and the adoption of advanced machine learning and deep learning algorithms.
1 Introduction
The global almond industry has experienced significant growth over the past decade, with production increasing by 44% between the 2012 and 2023 seasons (USDA, 2024). The economic contribution of almond production has also grown exponentially, reaching a worldwide Gross Production Value (GPV) of approximately 12 billion USD in 2022 (FAOSTATS, 2024). In this context, almond production has attracted considerable attention within Spain’s almond industry, with the area dedicated to almond cultivation expanding from 534,100 hectares in 2013 to 887,214 hectares in 2023, marking a 66.1% increase over the past decade (MAPA, 2023). The increasing interest in almond production in Spain is also evident in the shift toward more intensive irrigated plantations. For instance, the percentage of irrigated almond orchards has grown from 4.7% in 2005 to 26% in 2023 (MAPA, 2023).
Accurate almond yield prediction is crucial for supporting decision-making across multiple scales in the thriving almond industry, from individual growers to international markets. Reliable prediction offers several advantages, including stabilizing market prices by aligning supply with demand expectations, enhancing operational planning for processors, distributors, and retailers, and assisting governments in formulating policies and providing support. Additionally, growers and stakeholders can benefit from almond yield predictions to mitigate risks associated with environmental disturbances and identify key forcing traits in almond yields. Furthermore, almond yield prediction is becoming increasingly relevant due to the diminishing water resources causes by drought and climate change in the Mediterranean region (Gaona et al., 2022; Tramblay et al., 2020). The growing frequency of extreme heat waves and more severe droughts could heighten the vulnerability of almond production, especially within new intensive orchards (Moldero et al., 2021; Quintanilla-Albornoz et al., 2024).
Accurately predicting yields in woody crops like almonds is challenging due to the complex interactions of processes that can fluctuate significantly from one year to the next. Factors such as canopy vigor, crop load, orchard age, irrigation, evapotranspiration, response to short-term environmental stress, climate, and bearing, among others, play a crucial role in almond yields estimation. In addition, soil type variability within orchards further contributes to differences in yield responses. Two methodologies have been widely used for crop yield estimation: “biophysical simulation models” and “statistical approaches” (Hodges et al., 1987; Dzotsi et al., 2013; Kang and Özdoğan, 2019; Ma et al., 2021; Tang et al., 2023). Biophysical models are designed to determine the biophysical drivers of physiological characteristics and assess various climate scenarios to estimate yield (Archontoulis et al., 2020; Zhang et al., 2019). Despite their effectiveness, biophysical models face challenges in large-scale yield modeling due to the extensive biotic and abiotic data required for calibration, along with the complexity of biological processes in woody crops, which limits their applicability across different sites (Keating et al., 2003; Sakamoto et al., 2013; Zhang et al., 2019). On the other hand, statistical models estimate yield establishing empirical relationships between yield driving factors with historical yield data, offering the advantage of not relying on complex biophysical simulations or crop-specific parameters (Zhang et al., 2019).
Additionally, remote sensing technologies enable radiometric characterization of orchards across various spatial and temporal resolutions in near real-time, allowing these observations to build statistical models for spatially detailed crop yield predictions. In this context, various statistical models have been used to predict yield in both annual crops (Bolton and Friedl, 2013; Miao et al., 2024) and woody crops (Guimarães et al., 2024; Suarez et al., 2023; Torgbor et al., 2023; Zhang et al., 2019) primarily relying on estimations of biophysical traits derived from satellite-based vegetation indices. For example, Zhang et al (2019) developed a machine learning model to predict almond yield by incorporating spectral vegetation indices from Landsat-8 satellite imagery, achieving a root mean square error (RMSE) of 352 kg ha-1 in yield prediction. However, it is well-known that certain vegetation indices present challenges due to saturation issues in moderate to dense canopy structures (Delalieux et al., 2008; Haboudane et al., 2004; Pasqualotto et al., 2019) and are ineffective in detecting crop water stress during peak vegetative stages (Chandrasekar et al., 2024). Among different biophysical traits, canopy light interception has been demonstrated to be directly related to maximum potential yield of almonds (Lampinen et al., 2012; Zarate-Valdez et al., 2015). This is because yield is closely tied to the amount of water used, or plants evapotranspiration (Steduto et al., 2012), which is correlated with canopy light interception (Casadesús et al., 2011; Marsal et al., 2014; Espadafor et al., 2015). On a regional scale, Jin et al. (2020) identified canopy light interception as a key parameter for predicting potential almond yield using a collection of 10-year data from 33 locations across California. In this regard, the biophysical processor available in the Sentinel Application Platform (SNAP) enables the estimation of biophysical traits such as the fraction of Absorbed Photosynthetically Active Radiation (fAPAR) – as a proxy of canopy light interception-, using Sentinel-2 reflective bands (Weiss and Baret, 2016). This is obtained by training a neuronal network algorithm with PROSAIL radiative transfer models (RTM) and applying it to all Sentinel-2 bands.
Beyond canopy light interception, continuous monitoring of actual evapotranspiration (ETa) and its water status can help determine the productive response more accurately. Some authors have developed the water production functions for almond trees by relating yield either with ETa or water applied (as a proxy for the actual water used) (Goldhamer and Fereres, 2017; Moldero et al., 2021; Mirás-Avalos et al., 2023). In this regard, the irrigation water management, the seasonal water rights allocations and the type of deficit irrigation strategies adopted at farm level could significantly impact the final yield. Numerous studies have demonstrated the impact of varying levels of water stress during specific periods of the growing season on yield (Egea et al., 2010; Girona et al., 2005; López-López et al., 2018; Moldero et al., 2021; Sperling et al., 2023). In the most extreme cases, severe water deficits over consecutive growing seasons have shown carry-over effects, resulting in yields lower than those predicted by almond production functions (Moldero et al., 2022). Therefore, continuously monitoring ETa —which offers valuable insights into the orchard’s water status—is crucial for developing a predictive model for almond trees in the context of water scarcity.
Surface energy balance (SEB) models have been developed to retrieve ETa using satellite-based remote sensing images. Among the varying SEB models, the two-source energy balance (TSEB) model separately estimates canopy transpiration (Tp) and soil evaporation (Es). By treating soil and vegetation components separately, these models offer a more physically based representation of water and energy fluxes, making them particularly suitable for landscapes with partial canopy cover, such as row crops (Anderson et al., 2005; Burchard-Levine et al., 2021, 2020; Kustas et al., 2019; Quintanilla-Albornoz et al., 2025; Li et al., 2019b). In this regard, the combined use of Sentinel-2 and Sentinel-3 satellite observations, along with weather data from the Copernicus Climate Data Store (CDS) as input for the Priestley-Taylor TSEB (TSEB-PT) model, has proven to be an effective approach for estimating daily ETa at a 20-meter spatial resolution in agricultural landscapes (Guzinski et al., 2020, 2021; Bellvert et al., 2020; Jofre-Čekalović et al., 2022; Sanchez et al., 2024; Bellvert et al., 2024). Validations for agricultural fields showed a bias of approximately 0.3 mm d-1 and a root mean square error (RMSE) lower than 1 mm d-¹ (Guzinski et al., 2020). A recent study conducted over an almond orchard confirmed the feasibility of this approach under different irrigation regimes, reporting root mean square deviation (RMSD) values ranging from 0.6 to 2.5 mm d-¹ (Jofre-Čekalović et al., 2022).
Numerous studies have explored the use of remote sensing ETa-based estimations for crop yield predictions (Guan et al., 2017; Meitner et al., 2023; Wang et al., 2023; Miao et al., 2024). Guan et al. (2017) found that thermal-based ETa estimations provide unique insights into environmental stresses which enhance the overall predictive accuracy of USDA county-level crop yield predictions. However, most existing research has focused on extensive cropping systems, with only a limited number of studies addressing woody crops. Of those, the findings predominantly highlight similar spatial patterns between ETa and yield (Knipper et al., 2019). Specifically, in the case of almonds, to our knowledge, no studies have evaluated the potential of using remote sensing ETa-based models to predict almond yield. The aim of this study is to develop a machine learning-based almond yield prediction model at the orchard scale in two of Spain’s main almond-producing regions, using actual evapotranspiration estimates derived from the TSEB model in combination with Sentinel-2 and Sentinel-3 imagery. Additionally, prediction models solely based on basic spectral vegetation indices and biophysical traits were also developed for comparison.
2 Materials and methods
2.1 Study area
The study was conducted in two of the most almond-producing regions of Spain, which are the Ebro basin area in Catalonia-Aragón and Guadalquivir basin in Andalusia (Figures 1a-c). Data from four additional orchards located in Albacete (Castilla la Mancha) and Badajoz (Extremadura) were also used (Figures 1d, e). In total, a 4-year dataset of field measurements and yield records from 2017 to 2022 was compiled from 64 commercial orchards, resulting in a total of 203 data points. The orchards are located in the Mediterranean climate region of Spain, characterized by hot, dry summers and mild, wet winters. Annual precipitation in the orchards from 2017 to 2022 averages 505.01 mm, 431.27 mm, 374.81 mm, and 467.36 mm in the Ebro basin area, Guadalquivir basin, Albacete and Badajoz, respectively. During the same period, the average annual reference evapotranspiration (ETo) was 928.83 mm, 1027.71 mm, 960.59 mm and 896.68 mm for the Ebro basin area, Guadalquivir basin, Albacete and Badajoz, respectively.
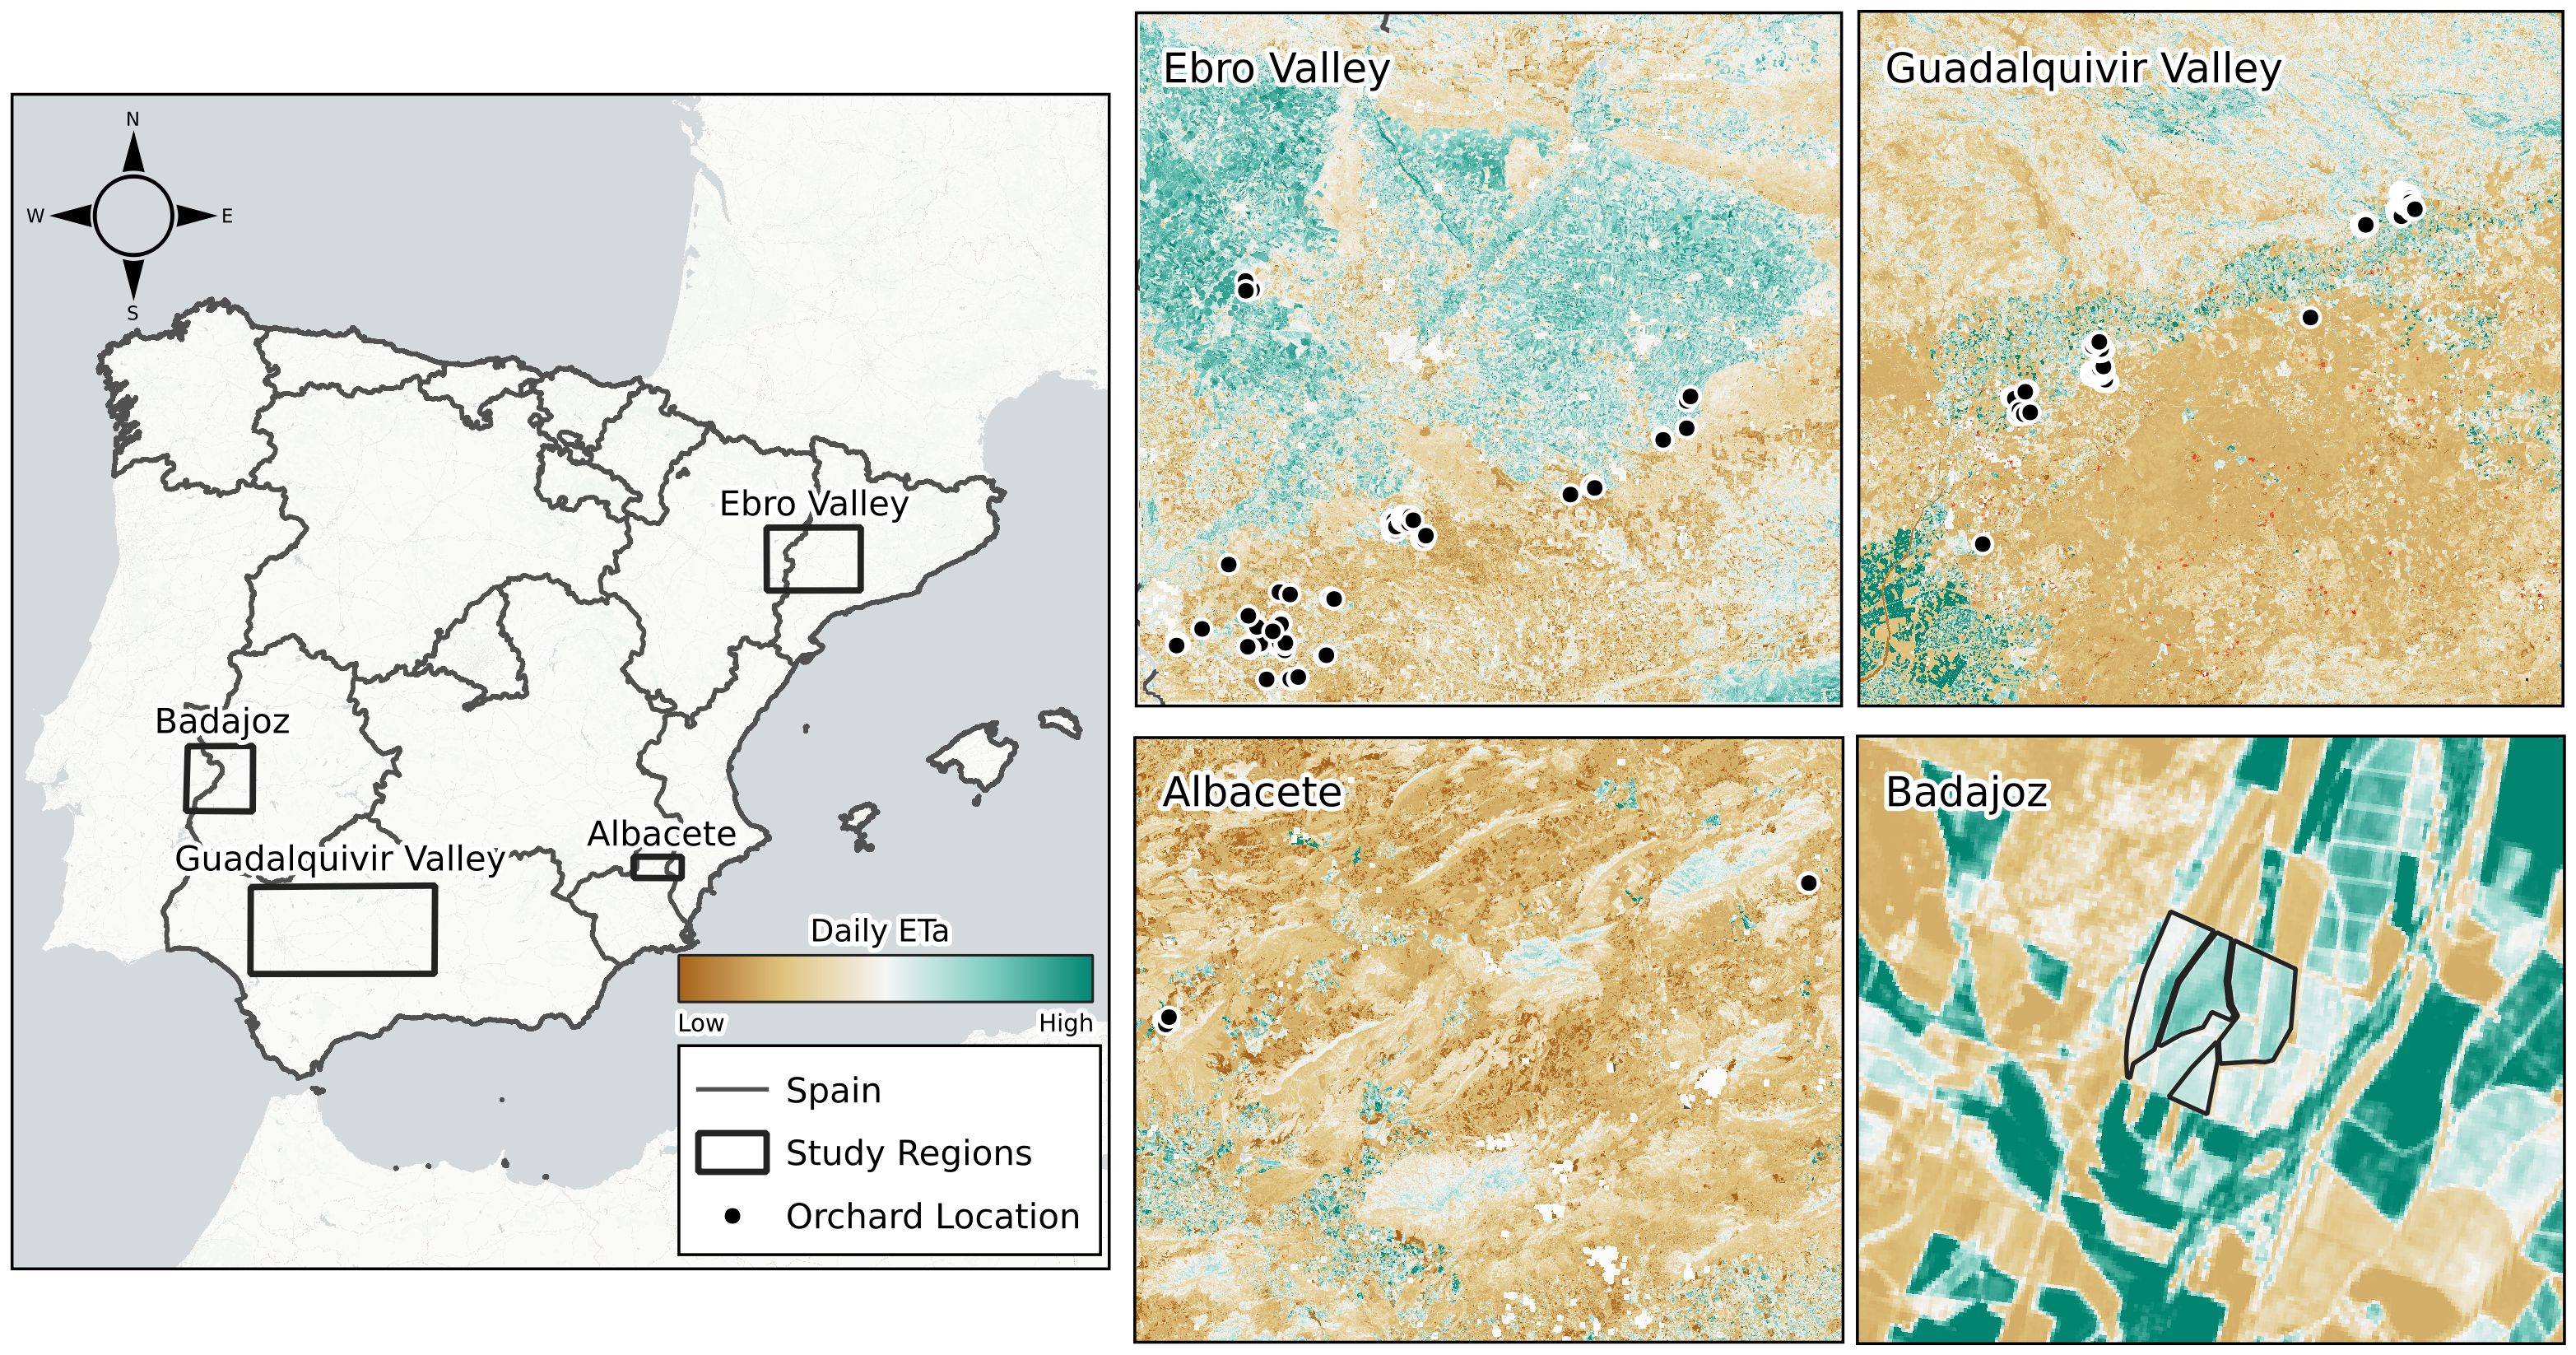
Figure 1. Location of almond orchards in the different study areas where yield data was collected (a). Figure (b-e) represent actual evapotranspiration (ETa) maps estimated using the Two-Source Energy Balance model and Priestley-Taylor approach (TSEB-PT) for a single day in August 2021.
The collected data in each orchard included information on kernel yield, as well as ancillary features such as orchard cultivar, orchard age, tree density, and the amount of irrigation applied during each season (Figure 2). The orchards represented fourteen different cultivars, with the majority corresponding to cv. Vairo, which accounted for 26% of the total records (Figure 2a). The average age of the orchards was 7 years old (Figure 2b). Of these, 61% were less than 6 years old, and 10% were more than 20 years old. The data collected had 17 different levels of tree densities (Figure 2c), ranging from traditional production systems (tree density below 300 tree ha-1) to high-density production systems (tree density above 1000 tree ha-1). The traditional system was the most representative, accounting for 56.6% of the total data. Among these traditional systems, 29 records correspond to orchards under rainfed conditions. The almond orchards had significant variation in irrigation practices, ranging from rainfed systems to fully irrigated orchards with an irrigation to 1000 mm during the season (Figure 2d). Specifically, 9.03% of the orchards were rainfed or under supplemental irrigation systems with less than 230 mm of irrigation, and 69.5% were fully irrigated with more than 230 mm during the season.
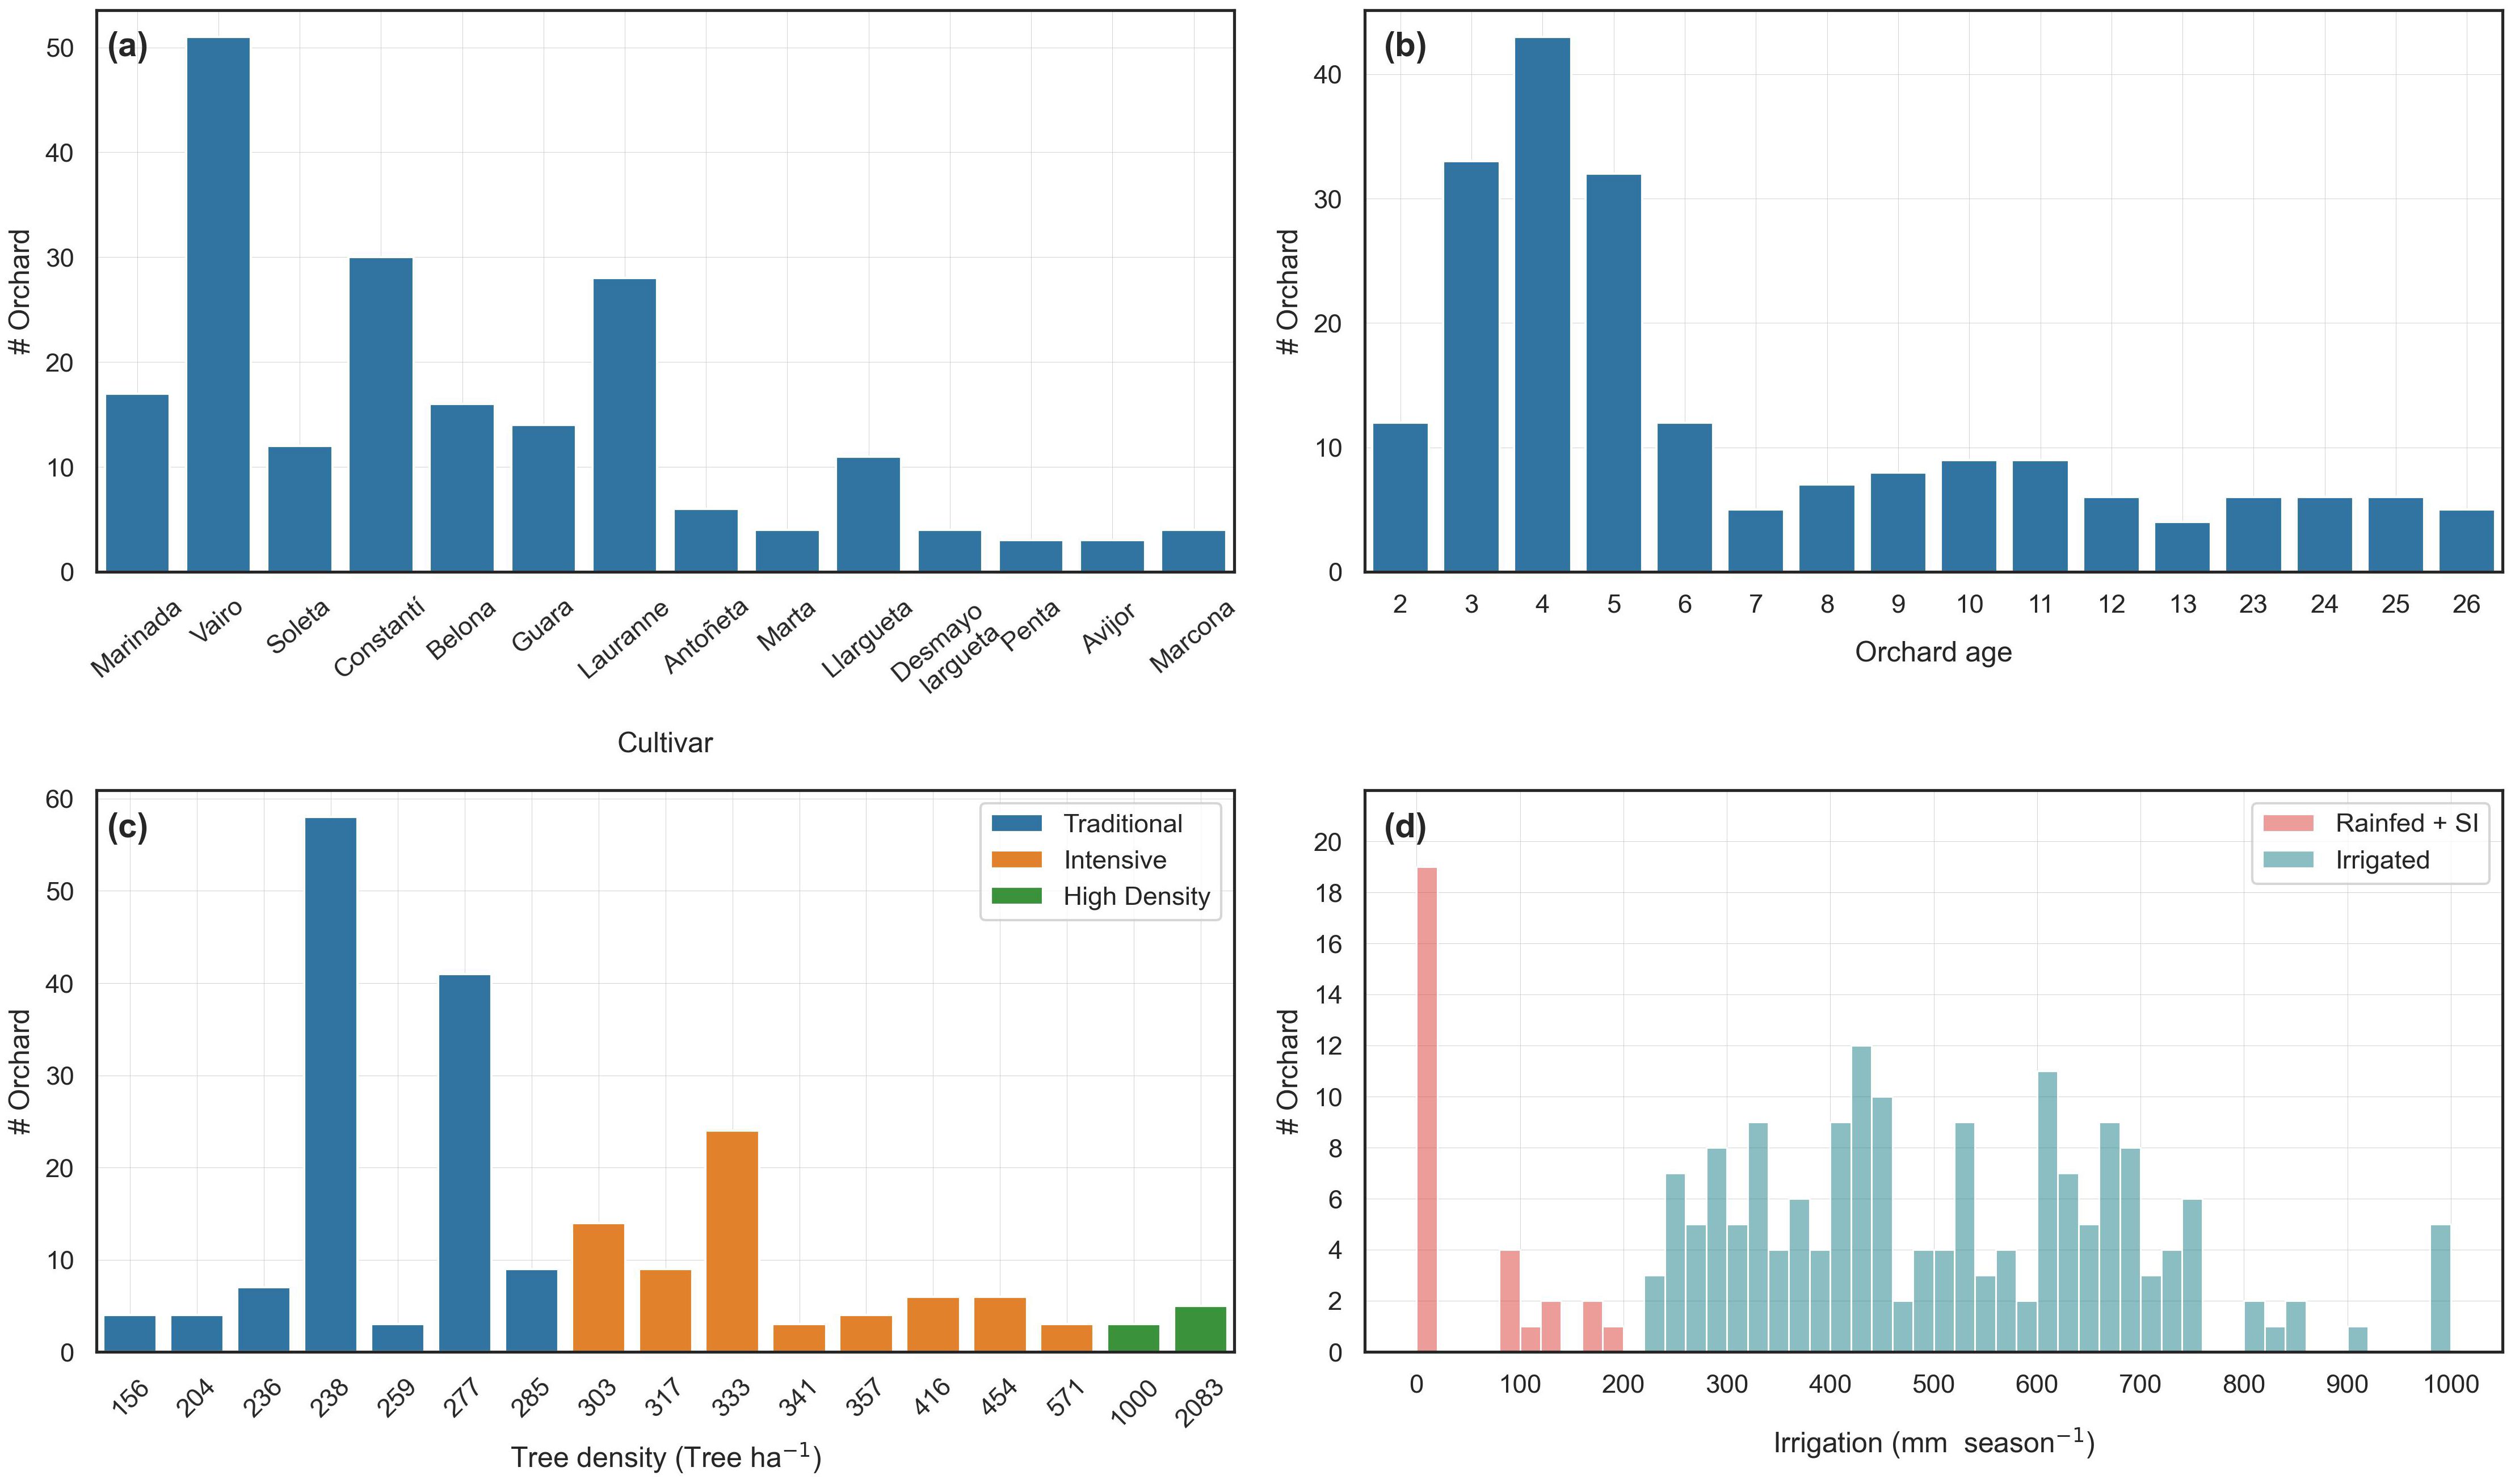
Figure 2. Description of distribution of (a) cultivar, (b) orchard age, (c) tree density, and (d) irrigation water applied in almond orchards where yield data were collected. In (c), the production systems are categorized by the following tree densities: orchards with fewer than 300 trees ha-1 are classified as traditional, those with densities up to 1000 trees ha-1 as intensive, and those with 1000 or more trees ha-1 as high-density systems. In (d), orchards are classified as irrigated or rainfed, with and without supplemental irrigation (SI).
2.2 Meteorological data
Meteorological data was obtained from open-access available online climate reanalysis products. The ERA5-Land reanalysis dataset provides surface weather parameters at hourly timescale, with 0.1° x 0.1° spatial resolution, from January 1950 to the present for the whole Earth. The retrieved meteorological parameters included: incoming shortwave solar radiation (Rs), air temperature (Ta), dewpoint temperature (Td), wind speed at 10 m above the surface (u10), and air pressure. Based on these data, several indices were calculated, including chilling hour accumulation (CH), growing degree hours of the current (GDH), degree hours above 36°C of the current (DH36), Freezing Degree Hours (FDH), vapor pressure deficit (VPD), and ETo.
CH was estimated using a dynamic model that accounts for warm temperature interruptions, providing more accurate chill accumulation estimates in warm climates (Díez-Palet et al., 2019; Freitas et al., 2023; Luedeling and Brown, 2011). GDH was calculated to measure heat forcing during the growing season, assuming heat accumulates when hourly Ta ranges between a base Ta of 4-°C and a maximum critical Ta of 36-°C (Gu, 2016; Santos et al., 2017). DH36 was used to detect possible detrimental effects on almond yields due to increased Ta extremes. FDH was calculated by accumulating degree hours below 0 °C from February to August, the period when almond trees are typically in flowering and production stages. VPD was estimated using the Td and Ta values, both measured at 2 meters above the surface. Finally, ETo was calculated using the FAO-56 model (Allen et al., 1998), based on daily mean values of Ta, Td, wind speed, surface pressure, and Rs.
Precipitation (P) data was obtained from the global Multi-Source Weighted-Ensemble Precipitation (MSWEP) product. This product combines gauge, satellite, and reanalysis data, resulting in one of the best-performing reanalysis P products available (Beck et al., 2019). MSWEP offers a P product at a spatial resolution of 0.1° x 0.1° and daily time scale from 1979 to the present (available online: https://www.gloh2o.org/mswep/). Effective precipitation (Peff) was estimated as half of the precipitation for a single event-day with more than 10 mm of precipitation, and otherwise was considered to be zero (Olivo et al., 2009). Table 1 shows a summary of the weather variables used in this study.
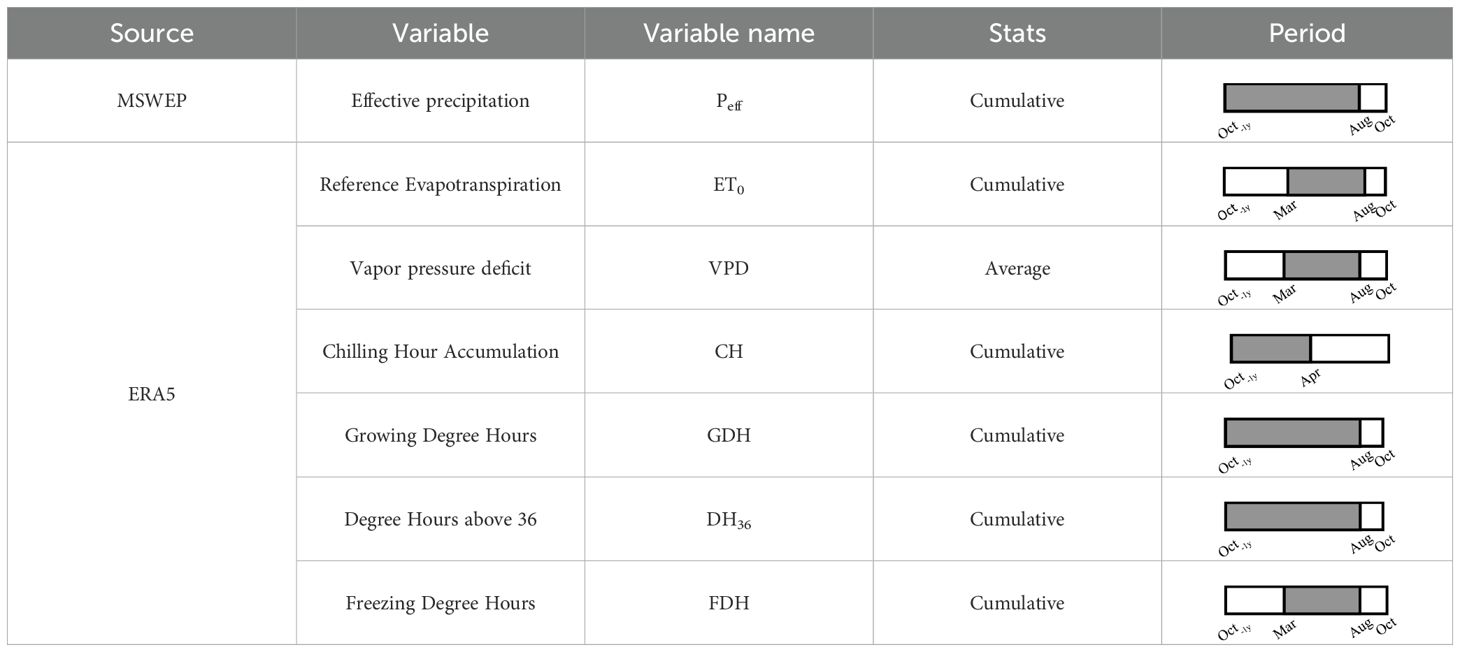
Table 1. Summary of the meteorological input variables included in each machine model tested in this study to predict almond kernel yield.
2.3 Copernicus Sentinel data
The top-of-canopy (TOC) reflectance Sentinel-2 (S2) MSI Level-2A product was used to characterize the orchards radiometrically and estimate the biophysical traits. The S2A and S2B satellites acquire multispectral shortwave observations across wavelengths from 443.9 nm to 2185.7 nm in 13 spectral bands, with a revisit time at the equator of 5 days. Sentinel-2 provides a spatial resolution of 10 m in visible and near infrared spectrum, and 20 m in red-edge and short-wave infrared bands. Sentinel-2 imagery was directly downloaded from CREODIAS (https://creodias.eu/). The Sentinel-2 Cloud Probability product available on Google Earth Engine platform was used to remove cloudy scenes. Scenes were considered cloudy when the images contained more than 20% poor-quality surface reflectance pixels in each orchard.
Subsequently, the following widely used spectral indices were calculated: Normalized Difference Vegetation Index (NDVI), Soil-Adjusted Vegetation Index (SAVI), Enhanced Vegetation Index (EVI), Sentinel-2 LAI Index (SeLI), Normalized Difference Moisture Index (NDMI), and Normalized Difference Water Index (NDWI). Additionally, the Enhanced Bloom Index (EBI) was calculated to quantify the spectral response during the flowering stage of the almond orchards (Chen et al., 2019). Further details on the calculation of spectral indices are given in Table 2.
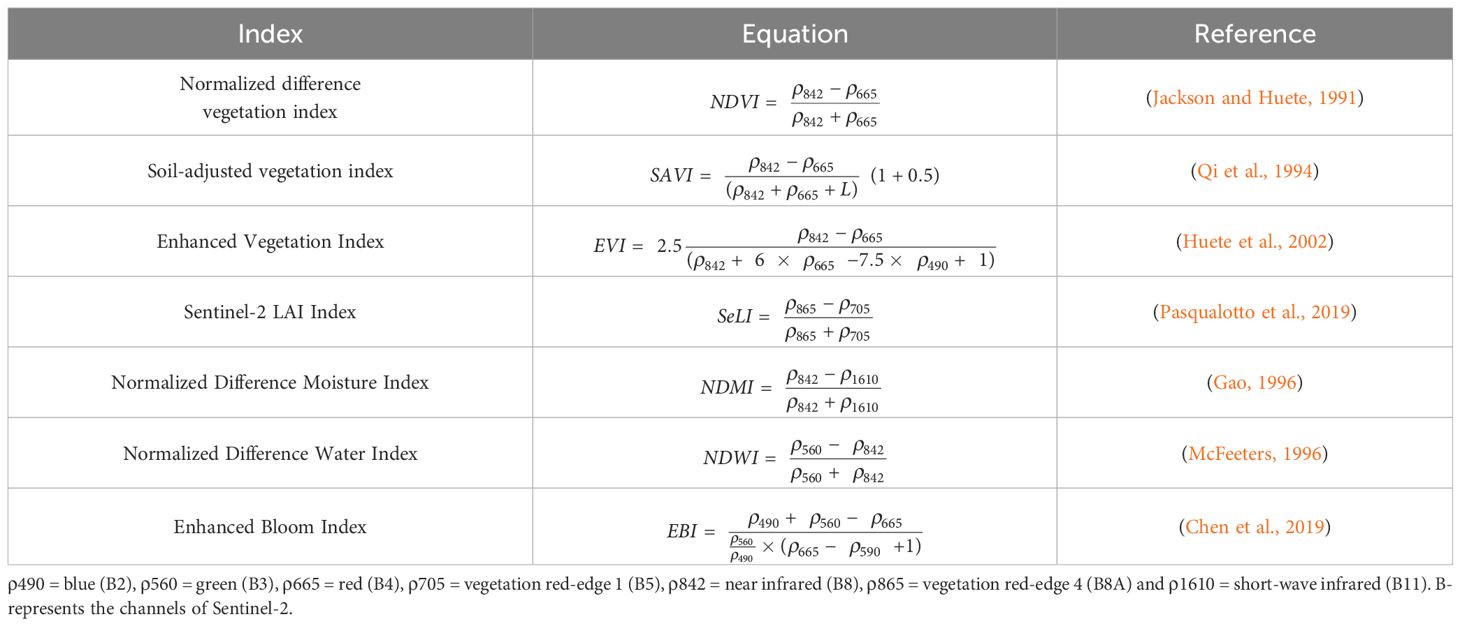
Table 2. Vegetation indices used in almond yield prediction and their respective equations.
The biophysical traits were estimated using the Biophysical Processor available in the SNAP v8.0 software (https://step.esa.int/main/). The processor uses the PROSPECT and SAIL radiative transfer models to simulate Fractional Vegetation Cover (FVC), fraction of Absorbed Photosynthetically Active Radiation (fAPAR), Leaf Area Index (LAI), Canopy Chlorophyll Content (Cab), and Canopy Water Content (CWC) from Sentinel-2 and Landsat-8 associated TOC reflectance. The cloud-masked Sentinel-2 bands were employed to estimate biophysical traits at 20-m spatial resolution on clear sky conditions.
Thermal observations acquired by SLSTR sensors on Sentinel-3 were used as thermal inputs for the ETa model. Sentinel-3 consists of two satellites, Sentinel-3A and Sentinel-3B, which capture thermal-infrared observations at a spatial resolution of 1-km. The two Sentinel-3 satellites have a daily revisit frequency at the equator. A sharpening process was applied to downscale Sentinel-3 LST images to the spatial resolution of the biophysical trait images. This was done using the Data Mining Sharpener (DMS) approach (Gao et al., 2012; Guzinski and Nieto, 2019; Jofre-Čekalović et al., 2022), which uses a decision tree algorithm to model the relationship between high-resolution shortwave bands and lower-resolution LST data. The method first aggregates the high-resolution bands to match the LST resolution, then trains a model to predict fine-scale LST. The final disaggregated LST product is generated using this model and the original high-resolution inputs. The DMS approach is freely available online as an open-source Python application (https://github.com/radosuav/pyDMS, last access: 14 November 2024)
ETa was estimated using the two-source energy balance model with the Priestley–Taylor approach (TSEB-PT), based on Copernicus-derived inputs (Guzinski et al., 2020). Potential evapotranspiration (ETp) was calculated using the two-source Shuttleworth–Wallace model, which follows a similar series resistance scheme as TSEB-PT. A detailed description of the ETa and ETp estimations using the TSEB-PT framework is provided in the Supplementary File 1, Appendix 1.
2.4 Machine learning algorithms
Four ensemble machine learning algorithms were evaluated to predict almond yield: Random Forest (RF), Stochastic Gradient Boosting (SGB), eXtreme Gradient Boosting (XGBoost), and Light Gradient Boosting Machine (LightGBM). The RF algorithm is a bagging-based ensemble method that builds multiple independent decision trees using random subsets of the data and features. Their predictions are then averaged to obtain the final output (Ruppert, 2004). In contrast, SGB, XGBoost, and LightGBM are boosting algorithms. These algorithms build decision trees sequentially, where each new tree aims to correct the errors made by the previous ensemble. The final prediction is a weighted combination of all trees. SGB uses a traditional gradient boosting framework with shallow decision trees to gradually improve model performance. XGBoost extends this approach by incorporating second-order gradient optimization, regularization, and parallel processing, resulting in improved accuracy and speed. LightGBM further enhances gradient boosting by using histogram-based decision trees learning and a leaf-wise tree growth strategy, which tends to produce deeper trees with better loss reduction, especially on large datasets.
Hyperparameter tuning of the machine learning algorithm was performed using a grid search strategy implemented through GridSearchCV, which exhaustively evaluates all specified combinations of hyperparameters for a given estimator. A Group K-fold cross-validation approach was used to train and evaluate the models (Zhang et al., 2019; Lyons et al., 2018; Allgaier et al., 2024). This method ensures that all samples from the data groups (in this case, orchard) are assigned to the same fold, preventing data leakage and reducing the risk of overfitting due to group-related similarities. The dataset was divided into five folds, using orchard as a grouping variable. In addition, a leave-one-feature-out (LOFO) analysis was conducted to evaluate the relative importance of each region and year in the machine learning model. In this approach, the model was repeatedly trained and tested while excluding one feature at a time—specifically, the dataset corresponding to a given region or year. The effect of this exclusion was quantified by measuring the change in model performance, expressed as the percentage change in RMSE compared with the baseline model trained on the full dataset. Larger increases in RMSE indicated a higher importance of the omitted feature. All algorithms were implemented using the Python package scikit-learn (https://scikit-learn.org/stable/).
2.5 Almond yield prediction models
Five kernel yield prediction models were developed to predict kernel yield: (1) contextual prediction model (PMCON), (2) vegetation indices prediction model (PMVI), (3) biophysical traits prediction model (PMBT), (4) ET-based prediction model (PMET), and (5) a combined remote sensing prediction model (PMCRS). PMCON used grower-provided data, including orchard age, tree density, cultivar, and irrigation. The remaining models relied on distinct remote sensing datasets: PMVI used spectral indices (Table 2), PMBT incorporated biophysical traits, and PMET was trained with estimates of ETa and ETp. PMCRS combined all these remote sensing inputs. All models also included meteorological variables listed in Table 1. Figure 3 presents a diagram outlining the methodology used to develop almond yield prediction models.
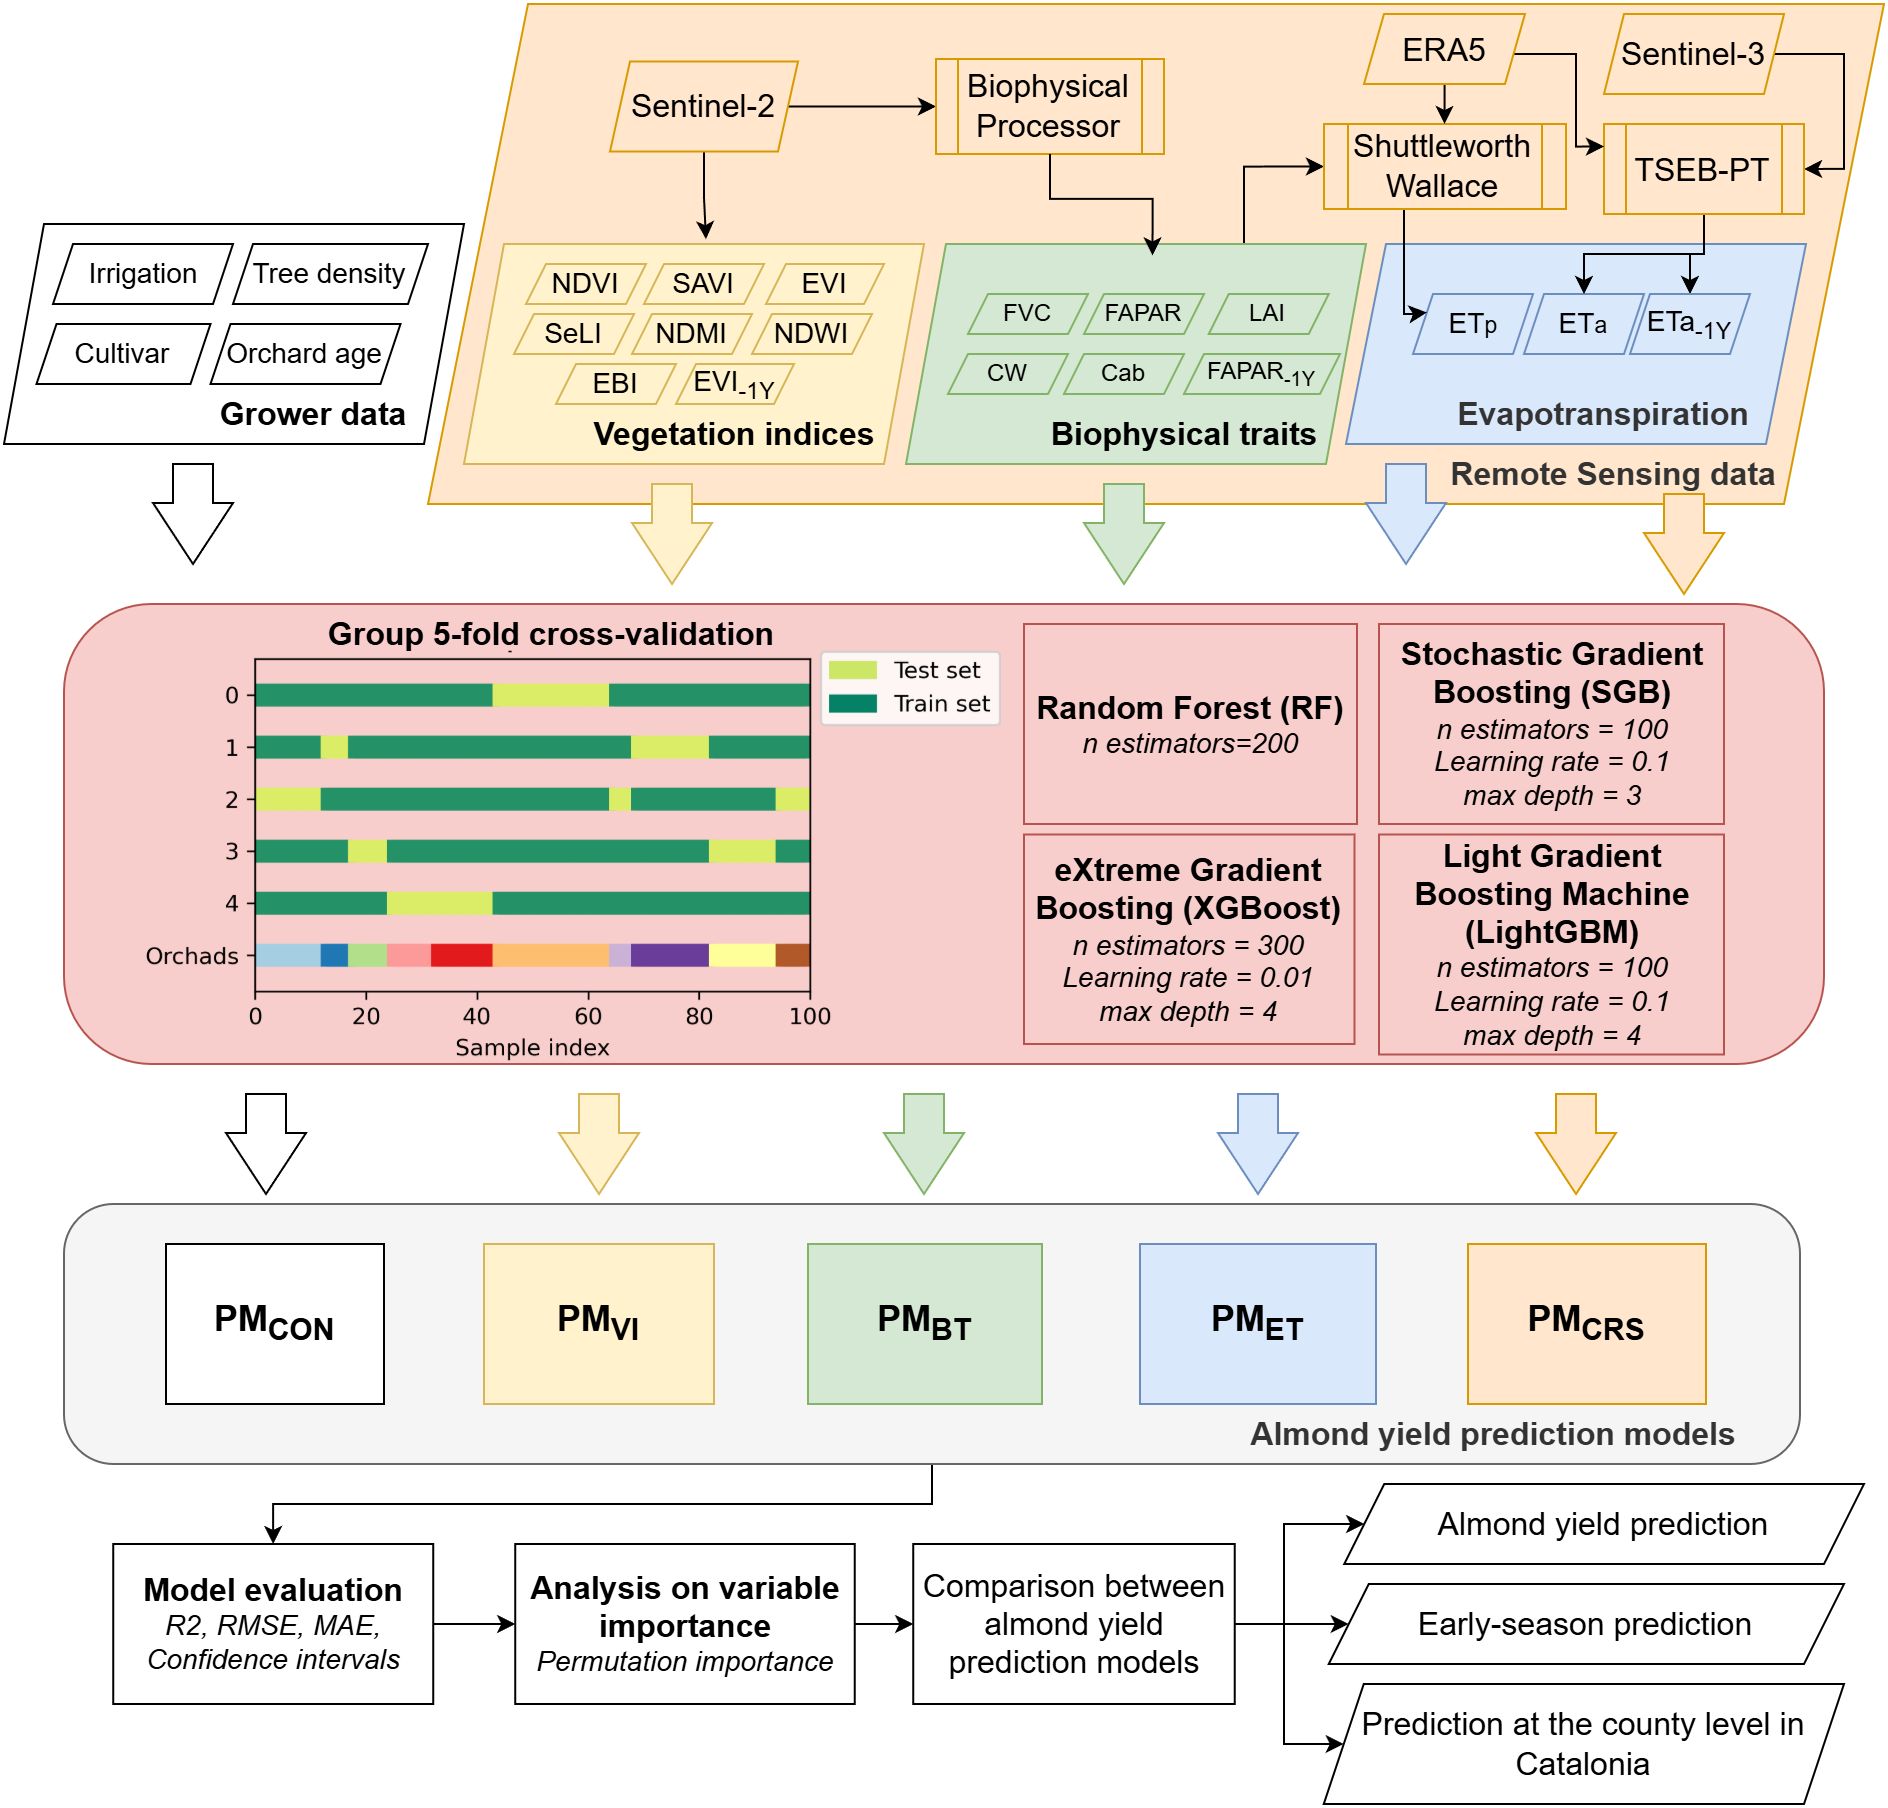
Figure 3. Flowchart of the methodology used to develop almond yield prediction models based on contextual data (PMCON), vegetation indices (PMVI), biophysical traits (PMBT), evapotranspiration estimates (PMET), and combined remote sensing products (PMCRS), using different machine learning algorithms.
The prediction models were first evaluated using seasonal statistics, followed by an assessment of remote sensing models for end-of-year yield prediction based on monthly statistics. Remote sensing inputs were collected from the productive season, defined as March to August. Monthly and seasonal averages of vegetation indices and biophysical traits were used to train the models, with monthly statistics representing averages from March up to each respective month. The EBI index was averaged over February and March to reflect the flowering period.
For the PMET and PMCRS models, ETa and ETp were included as monthly and seasonal cumulative values, calculated from March to each analysis month. Given the importance of previous canopy and biomass conditions for yield prediction (Zhang et al., 2019), three variables from the previous season were included: average EVI (EVI-1Y), average fAPAR (fAPAR-1Y), and cumulative ETa (ETa-1Y). These variables were selected based on their relevance in a permutation-based variable importance analysis, although the selection process is not detailed in the results.
A final assessment was conducted to evaluate how adding contextual information could improve the accuracy of remote sensing-based models. The impact of including contextual information in satellite models was assessed by calculating the change in root mean square error (ΔRMSE). Higher values of ΔRMSE indicate greater importance of the input variable for yield prediction (Jin et al., 2020). The model performance was evaluated using the following metrics: correlation coefficient (R2, Equation 1), root mean square error (RMSE, Equation 2), Mean Absolute Error (MAE, Equation 3), and bias (Equation 4).
2.6 Scalability of yield predictions and comparison with administrative datasets
The Department of Agriculture, Livestock, Fisheries and Food of the Government of Catalonia (DARP) reports annual statistics on almond kernel yield at the county level, distinguishing between rainfed and irrigated orchards. These values are based on information provided by stakeholders, who supply representative estimates of yield for each area. However, these figures do not reflect actual measured yields and instead rely on stakeholders’ impressions. Consequently, there is increasing interest from administrative agencies in comparing these estimates with the results generated by the model developed in our study. Therefore, the PMCRS model was used for this case study. The model was applied to all orchards within the following counties located in the region of the Ebro basin, for the years 2018 to 2023: Garrigues, Noguera, Segrià and Urgell (Supplementary File 1, Appendix 2). In each county, all almond orchards were selected using the open-access tool DUN-SIGPAC (available online: https://agricultura.gencat.cat/ca/ambits/desenvolupament-rural/sigpac/mapa-cultius/, last access: 14 November 2024). DUN-SIGPAC provides information on crop types for parcels in Spain, as reported by farmers under the European crop subsidy program, following the Single Agrarian Declaration (Declaració Única Agrària, DUN). This data is updated annually through the Spanish Agricultural Land Geographic Information System (SIGPAC), a public administrative database. DUN-SIGPAC also provides information on whether an orchard is irrigated or rainfed. This study aims to serve as an example of the model’s potential scalability for predicting almond yield at a regional level.
3 Results
3.1 Water production functions
Kernel yield showed a significant correlation with orchard age (p < 0.0001), tree density (p = 0.0057), effective precipitation plus irrigation (Peff + irrigation, p < 0.0001), and the interaction between orchard age and tree density (p = 0.0003). Overall, almond yield was strongly correlated with irrigation + Peff (R² = 0.56) (Figure 4a). Due to the high variability in the kernel yield versus irrigation+ Peff relationship, a boundary line was established to represent the potential yield achievable with varying water inputs, defined by the following equation: yield = -0.0031 x (irrigation + Peff)² + 6.486 x (irrigation + Peff) – 609.67. This boundary indicated a maximum potential kernel yield of 2776 kg ha-¹ at 1000 mm of water received throughout the growing season. Additionally, it was noted that receiving more than 1000 mm of water did not further increase kernel yield. Figures 4b, c respectively illustrate the yield response to seasonal mean fAPAR, and cumulative ETa, estimated from remote sensing. Boundary lines are also shown. The fAPAR and ETa demonstrated a comparable correlation with almond kernel yield to that of irrigation + Peff, with R2 of 0.59 and 0.52, respectively. These water production functions also account for the differing responses to Irrigation + Peff, fAPAR, and ETa in orchards under rainfed and SI conditions, which resulted in lower yields, as shown by the rainfed fit. Additionally, there is a positive trend in increasing kernel yield as almond trees age.
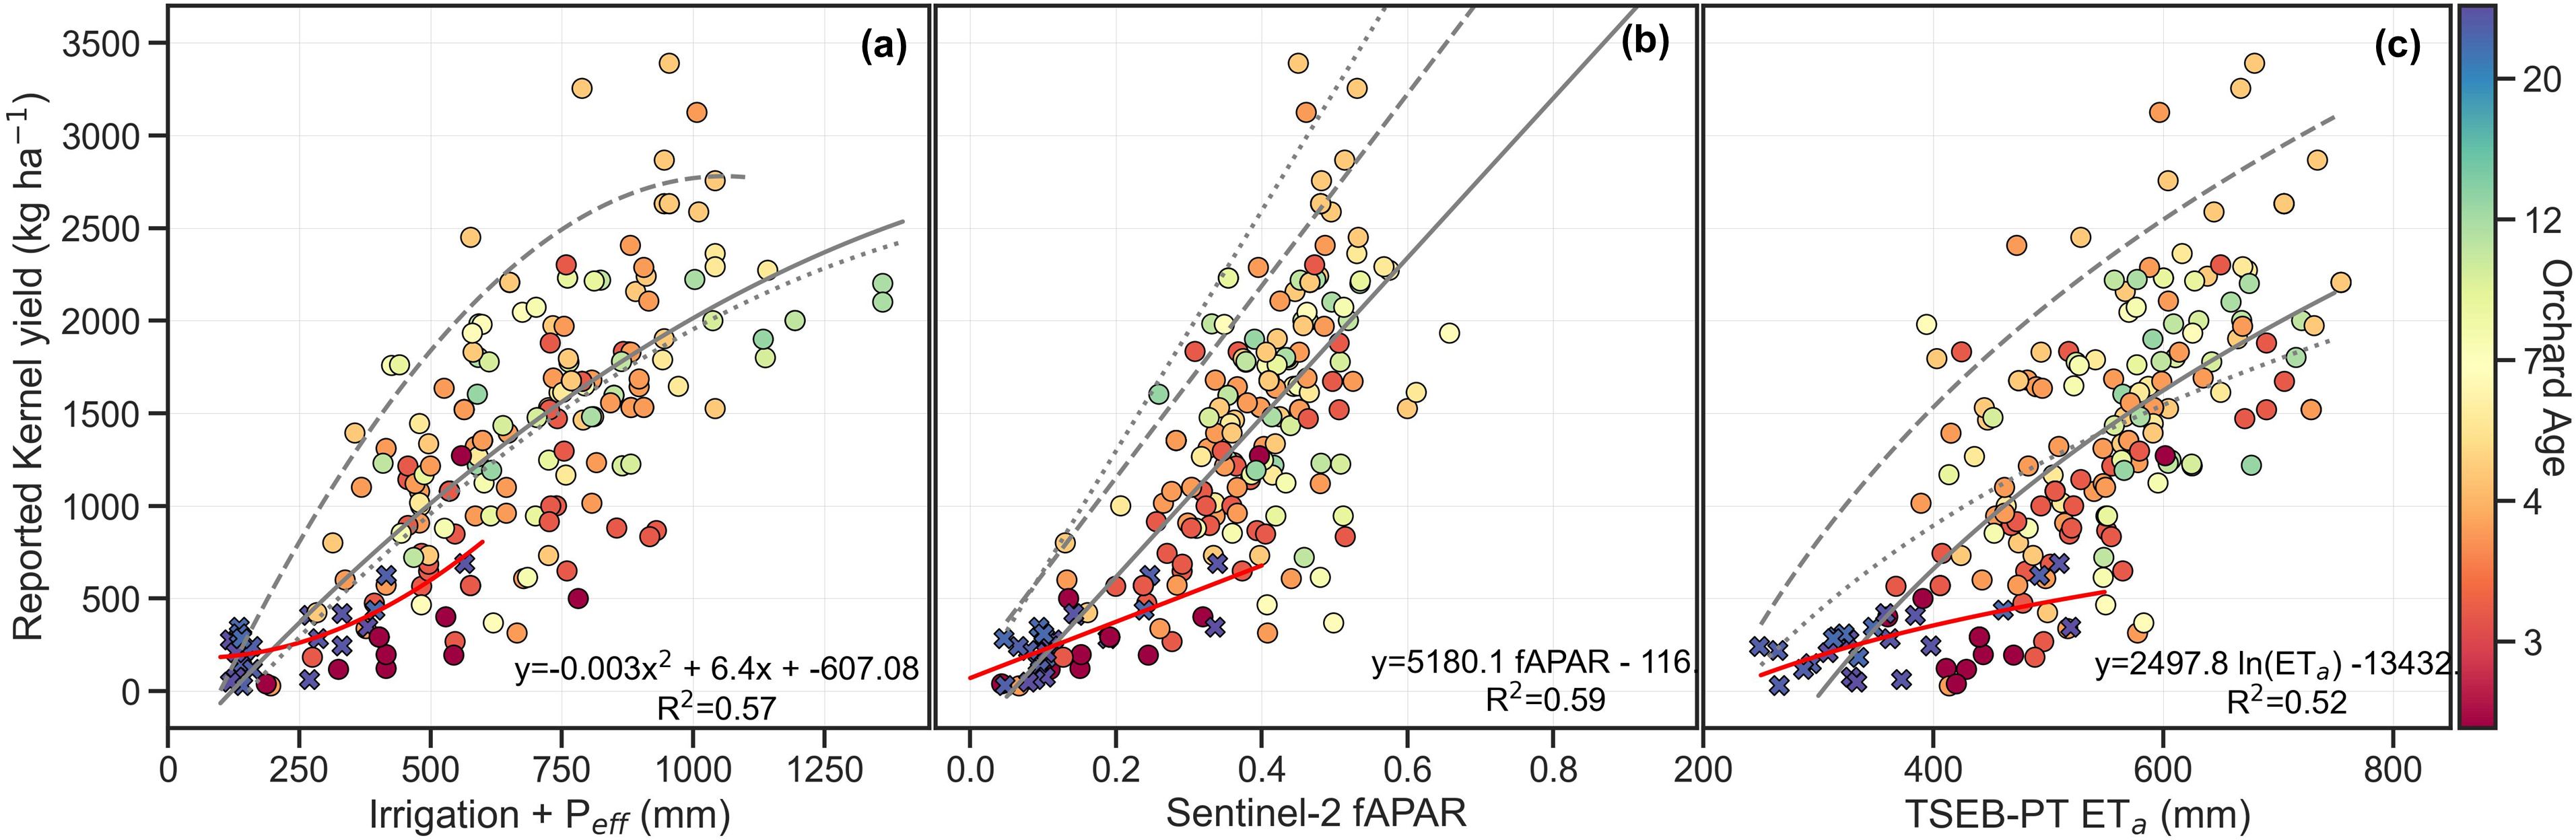
Figure 4. Relationship between reported almond yield and (a) seasonal amount of irrigation + effective precipitation (PPeff), (b) mean fraction of absorbed photosynthetically active radiation (fAPAR) retrieved from Sentinel-2, and (c) actual crop evapotranspiration (ETa) estimated with TSEB-PT. Figures were color-coded based on orchard age. The dotted line represents the function fitted by previous studies conducted in almond orchards. In contrast, the solid and dashed lines correspond to the best-fit and boundary fit functions, respectively, using the almond yield data collected in the current study. Additionally, the red solid line represents the relationship fitted with data from rainfed and supplemental irrigated orchards. The equation added in each Figure corresponds to the boundary fit function (dashed lines).
3.2 Performance of the almond yield prediction model
Table 3 presents the performance of the almond yield prediction models. The LightGBM algorithm outperformed the other machine learning algorithms for remote sensing-based models, while no substantial differences were observed between boosting methods in the PMCON model. Overall, PMVI, PMBT, and PMCRS models outperformed the PMCON model, while the PMET model yielded comparable results. Among them, PMBT and PMCRS achieved the best results, with average RMSE values of 419.7 kg ha-1 (R2 of 0.63) and 422.2 kg ha-1 (R2 of 0.64), respectively. When using LightGBM, the accuracy of PMBT and PMCRS improved further, reaching RMSE of 410 kg ha-1 (R2 of 0.65) and 411 kg ha-1 (R2 of 0.66), respectively. Notably, the PMCON models had the narrowest confidence intervals, ranging from 72 to 121 kg ha-1. Given its superior performance, all subsequent analyses focus exclusively on models trained with LightGBM algorithm.
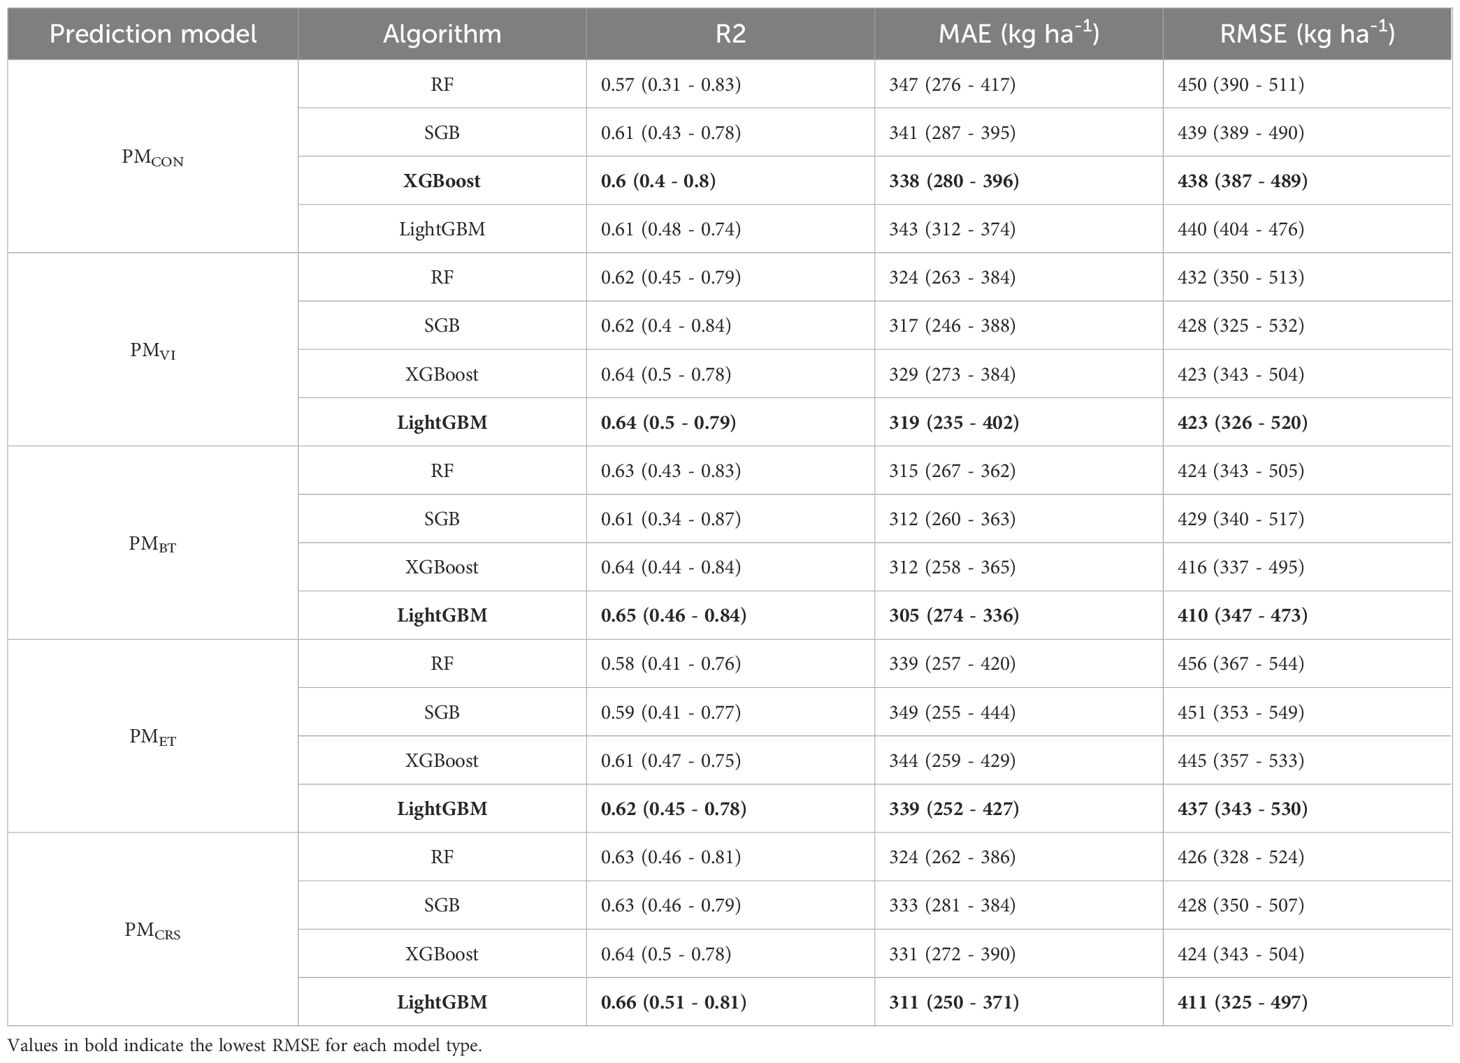
Table 3. Performance of random forest (RF) and stochastic gradient boosting (SGB), eXtreme gradient boosting (XGBoost) and light gradient boosting machine (LightGBM) machine learning algorithms for predicting almond kernel yield, using contextual data (PMCON), and the following remote sensing data: vegetation indices (PMVIS), biophysical traits (PMBT), ET-based models (PMET), and combined remote sensing models (PMCRS).
Figure 5 illustrates the permutation feature importance for each prediction model using LightGBM algorithm. In PMCON, irrigation and orchard age were the most important features, with permutation importances of 266.5 kg ha-1 and 70.5 kg ha-1, respectively (Figure 5a). In contrast, CDH and FDH had negligible influence. For the remote sensing-based models, previous season inputs — EVI-1Y, fAPAR-1Y, and ETa –1Y— were among the most influential features (Figures 5b-e), highlighting the relevance of historical data in improving yield predictions. Peff showed high importance in the almond yield prediction models, except for PMCON and PMET models, where it had only moderate importance. ETo, and VPD also demonstrated moderate relevance across the models, while meteorological variables based on Ta consistently showed low importance.
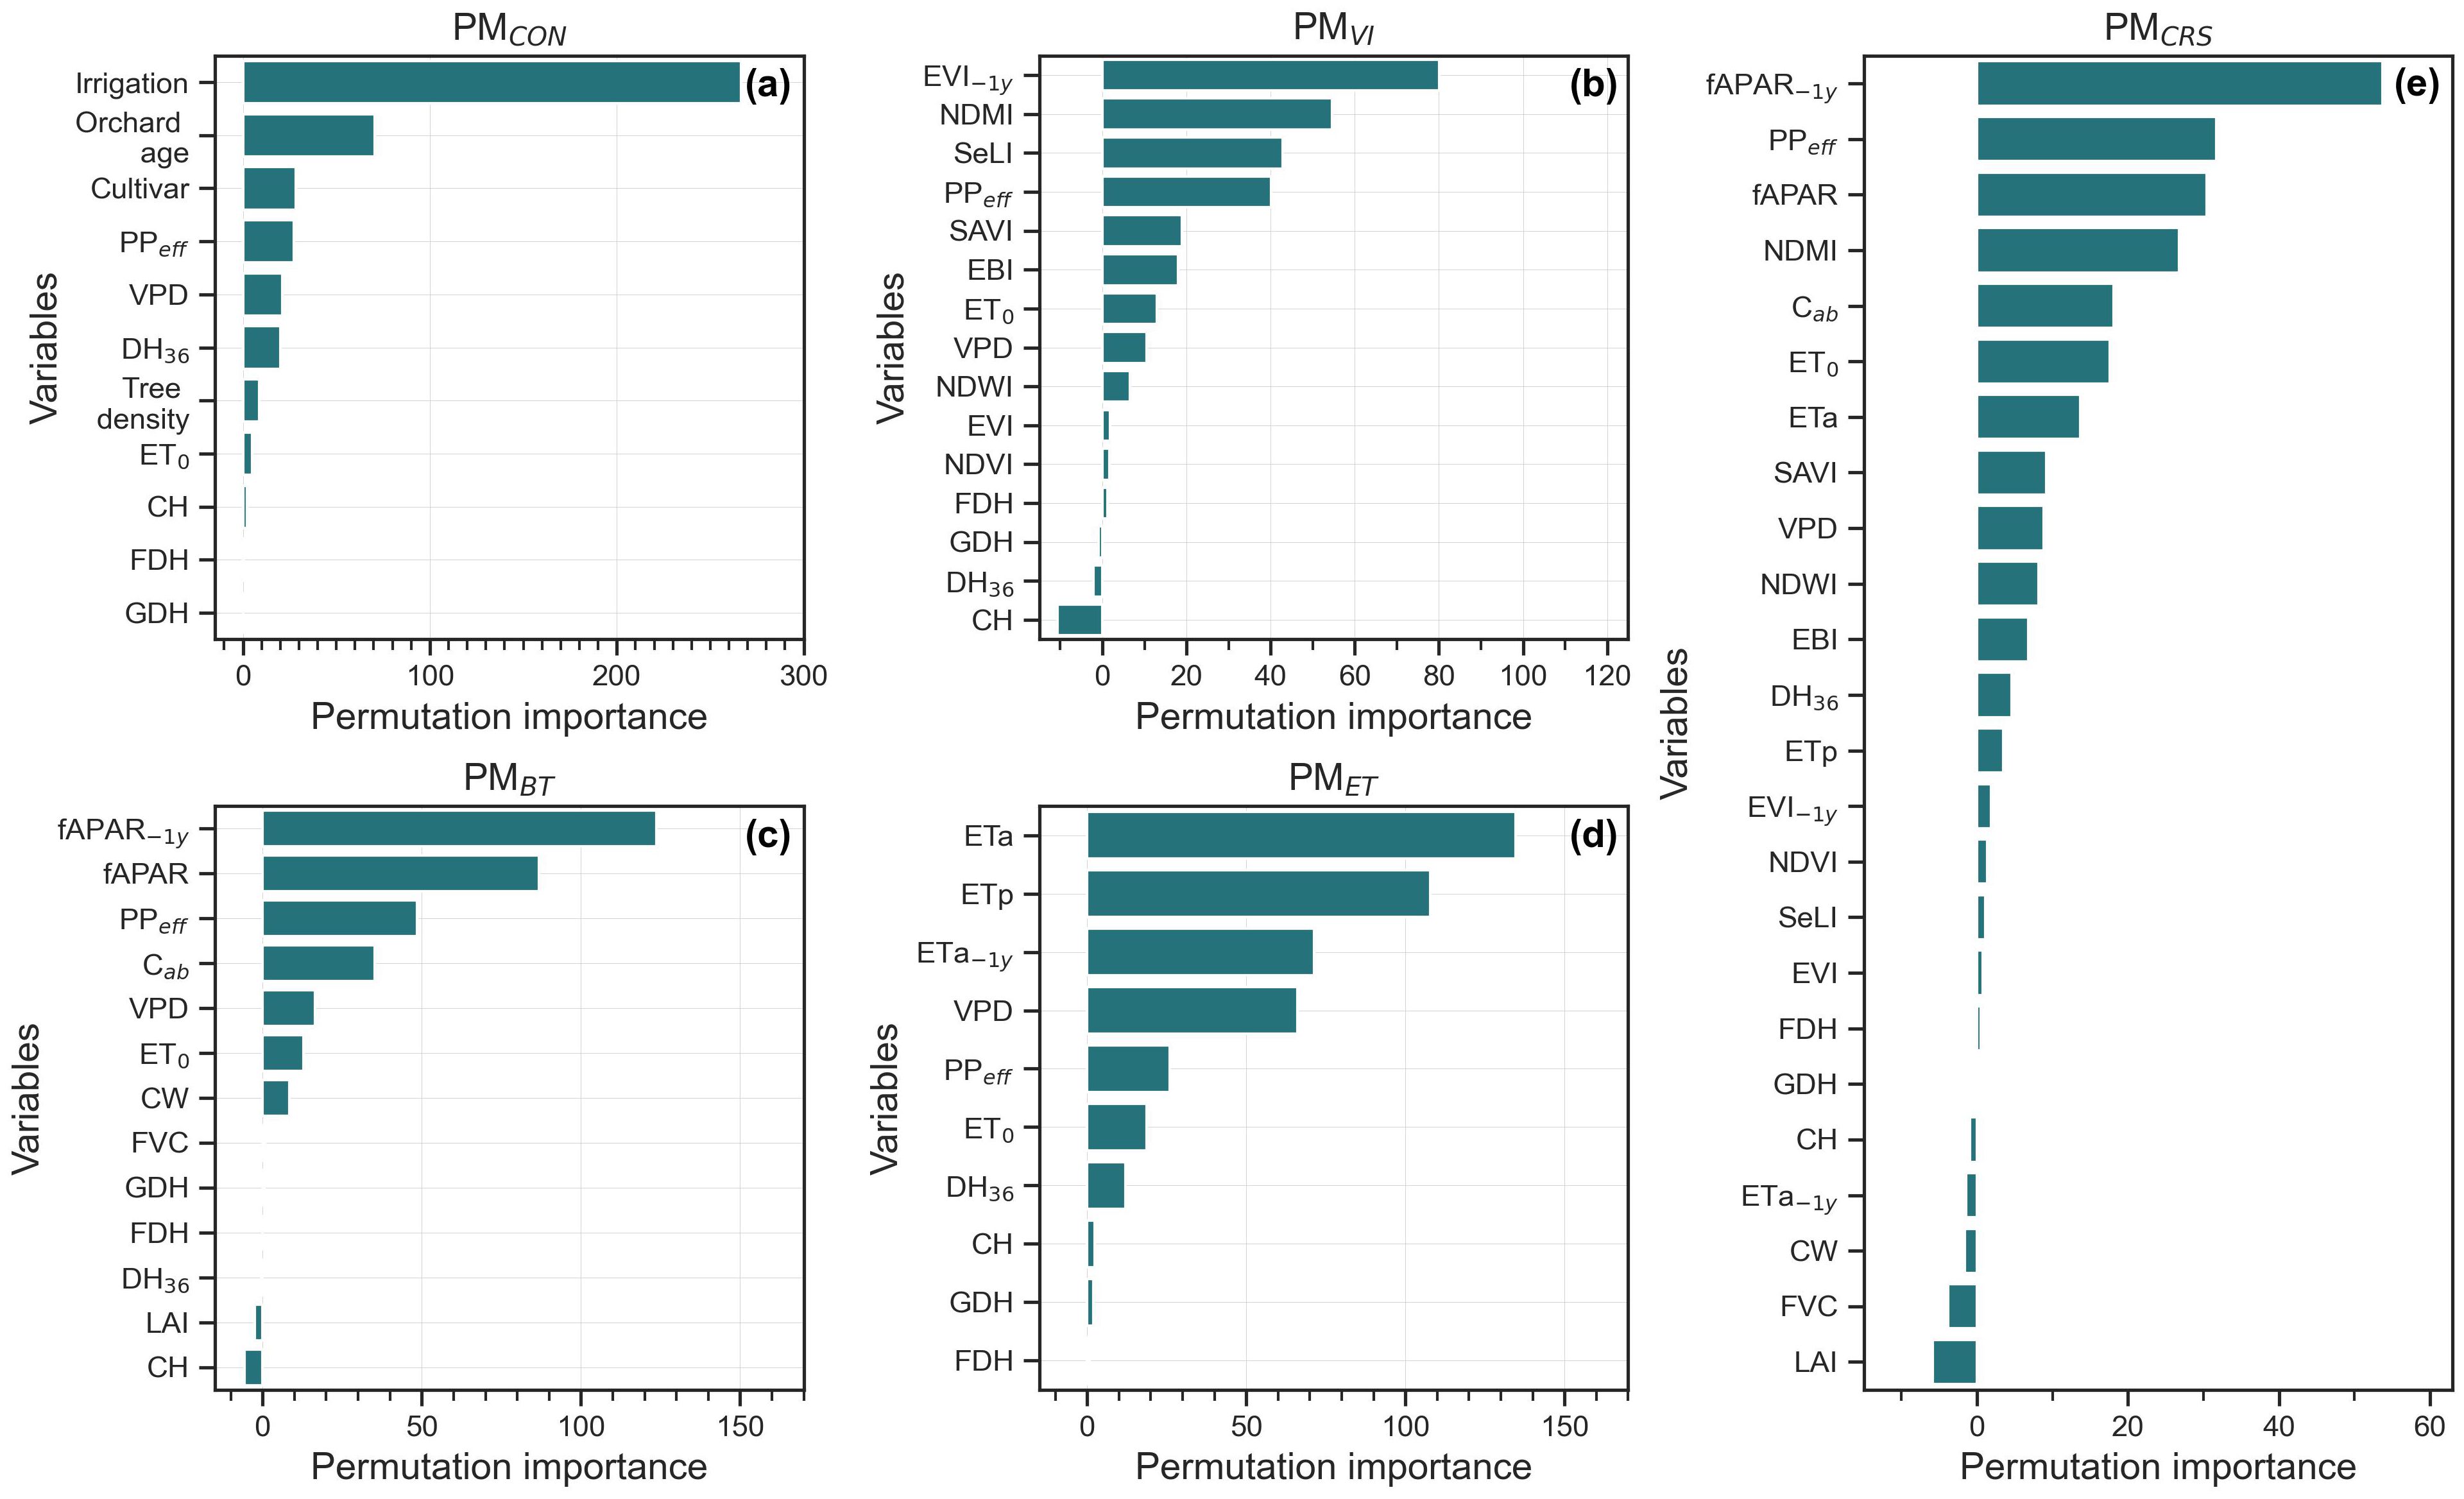
Figure 5. Permutation feature importance of prediction models trained using the LightGBM algorithm, based on (a) contextual data (PMCON), and the following remote sensing data: (b) vegetation indices (PMVI), (c) biophysical traits (PMBT) and (d) ET-based (PMET), and (e) combined remote sensing models (PMCRS).
In the PMVI model, NDMI, SELI, SAVI, and EBI were among the most relevant indices. In the PMBT model, fAPAR was the second most important feature, followed by Cab and CW, which also had positive but lower importance. Notably, FVC showed no importance, while LAI had negative permutation importance in PMBT. The PMET models showed a strong dependence on ETa and ETp, with a permutation importance of 134.6 kg ha-1 and 107.7 kg ha-1, respectively. The PMCRS model showed a similar importance ranking to PMBT but additionally highlighted NDMI and ETa as features with moderate importance.
Finally, the PMCRS was refined and trained using a reduced set of variables — fAPAR-1y, PPeff, fAPAR, NDMI, Cab, ET0, ETa, SAVI, VPD, NDWI, EBI, and ETp — by removing redundant and low-importance features identified through permutation importance. The refinement maintained similar performance, achieving a RMSE of 407 kg ha-1 (Figure 6e). However, model accuracy depended on the irrigation strategy, with an RMSE of 433.80 kg ha-¹ for irrigated orchards and 168.39 kg ha-¹ for rainfed orchards, and corresponding biases of –12.56 kg ha-¹ and 82.62 kg ha-¹, respectively. In the leave-one-year-out analysis, RMSE increased in 44.77 kg ha-1 (excluding 2019) and 49.13 kg ha-1 (excluding 2020), with an average variation of 11% relative to the full model (Figure 7a). In leave-one-region-out, RMSE varied only by approximately ±2% across regions (Figure 7b). The learning curve of the best-performing model converged at approximately 407 kg ha-¹ for the testing set and 176 kg ha-¹ for the training set, stabilizing after about 130 training samples (Figure 7c).
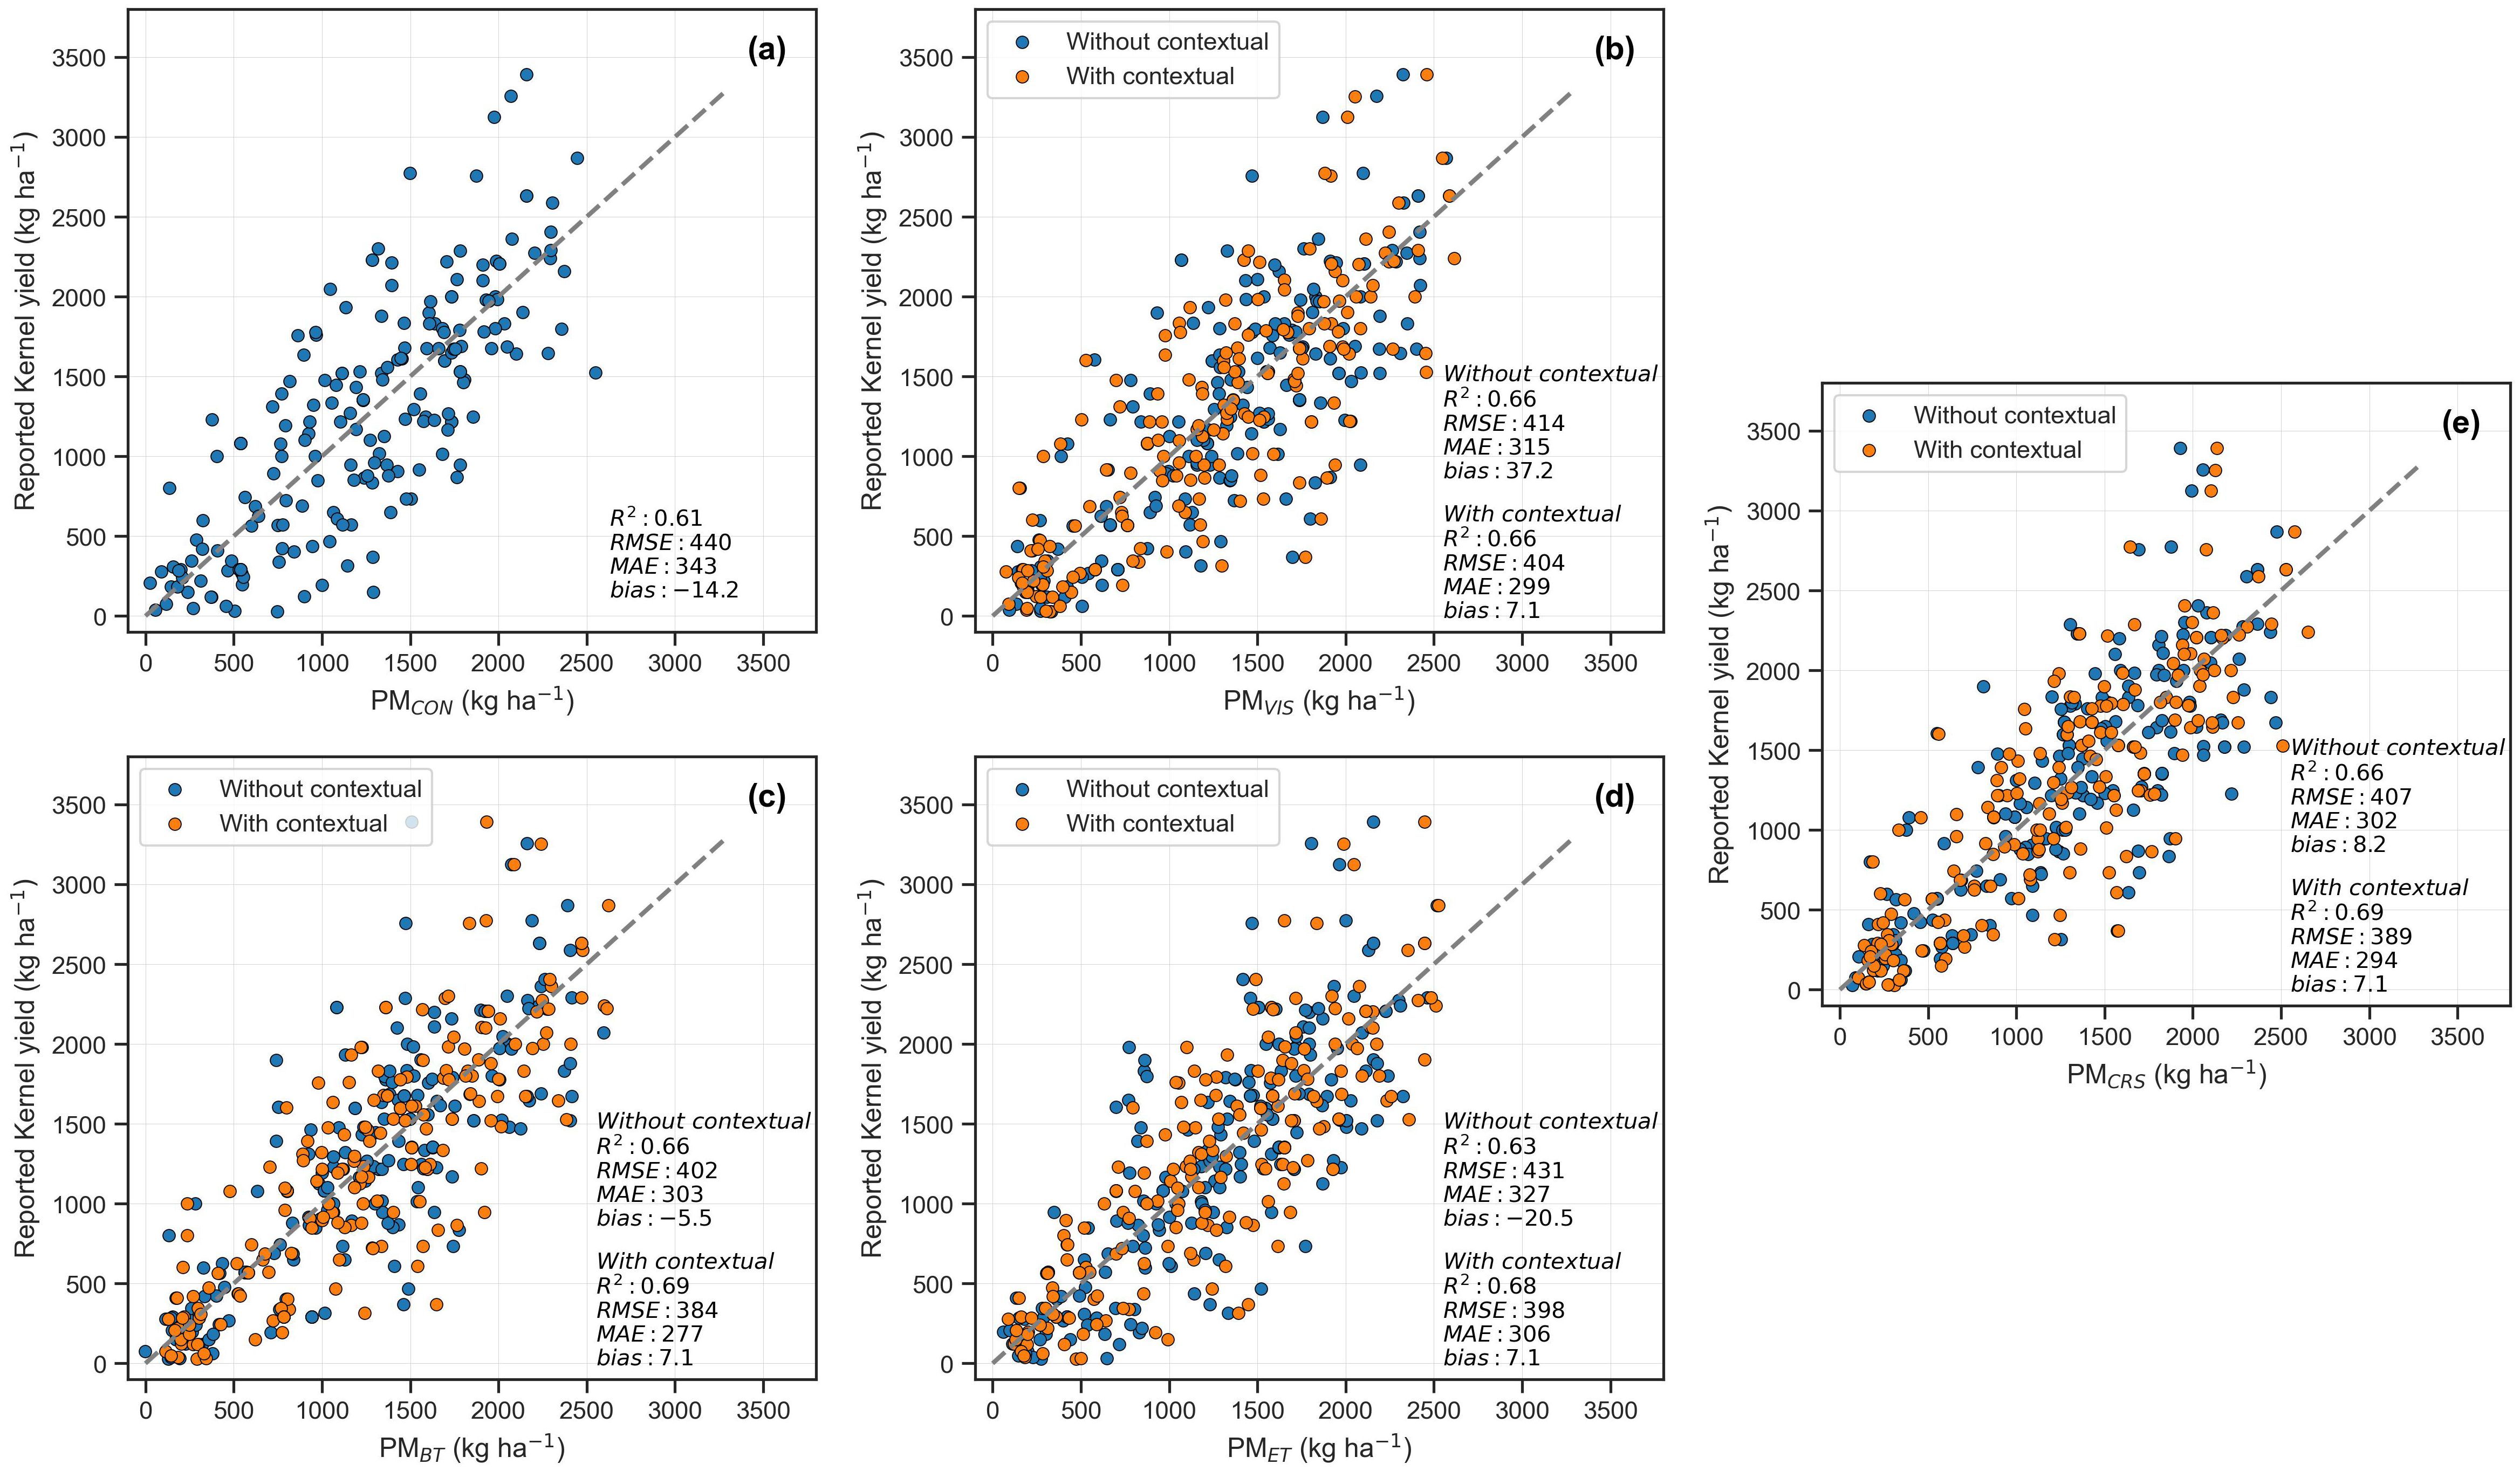
Figure 6. Comparison of reported almond kernel yield vs. predictions obtained with the LightGBM using (a) contextual inputs (PMCON), and the following remote sensing models: (b) vegetation indices (PMVI), (c) biophysical traits (PMBT), (d) ET-based (PMET), and (e) combined remote sensing (PMCRS) models. The orange scatters illustrate the improvement in predictions when irrigation and orchard age are added as contextual data inputs to the models.
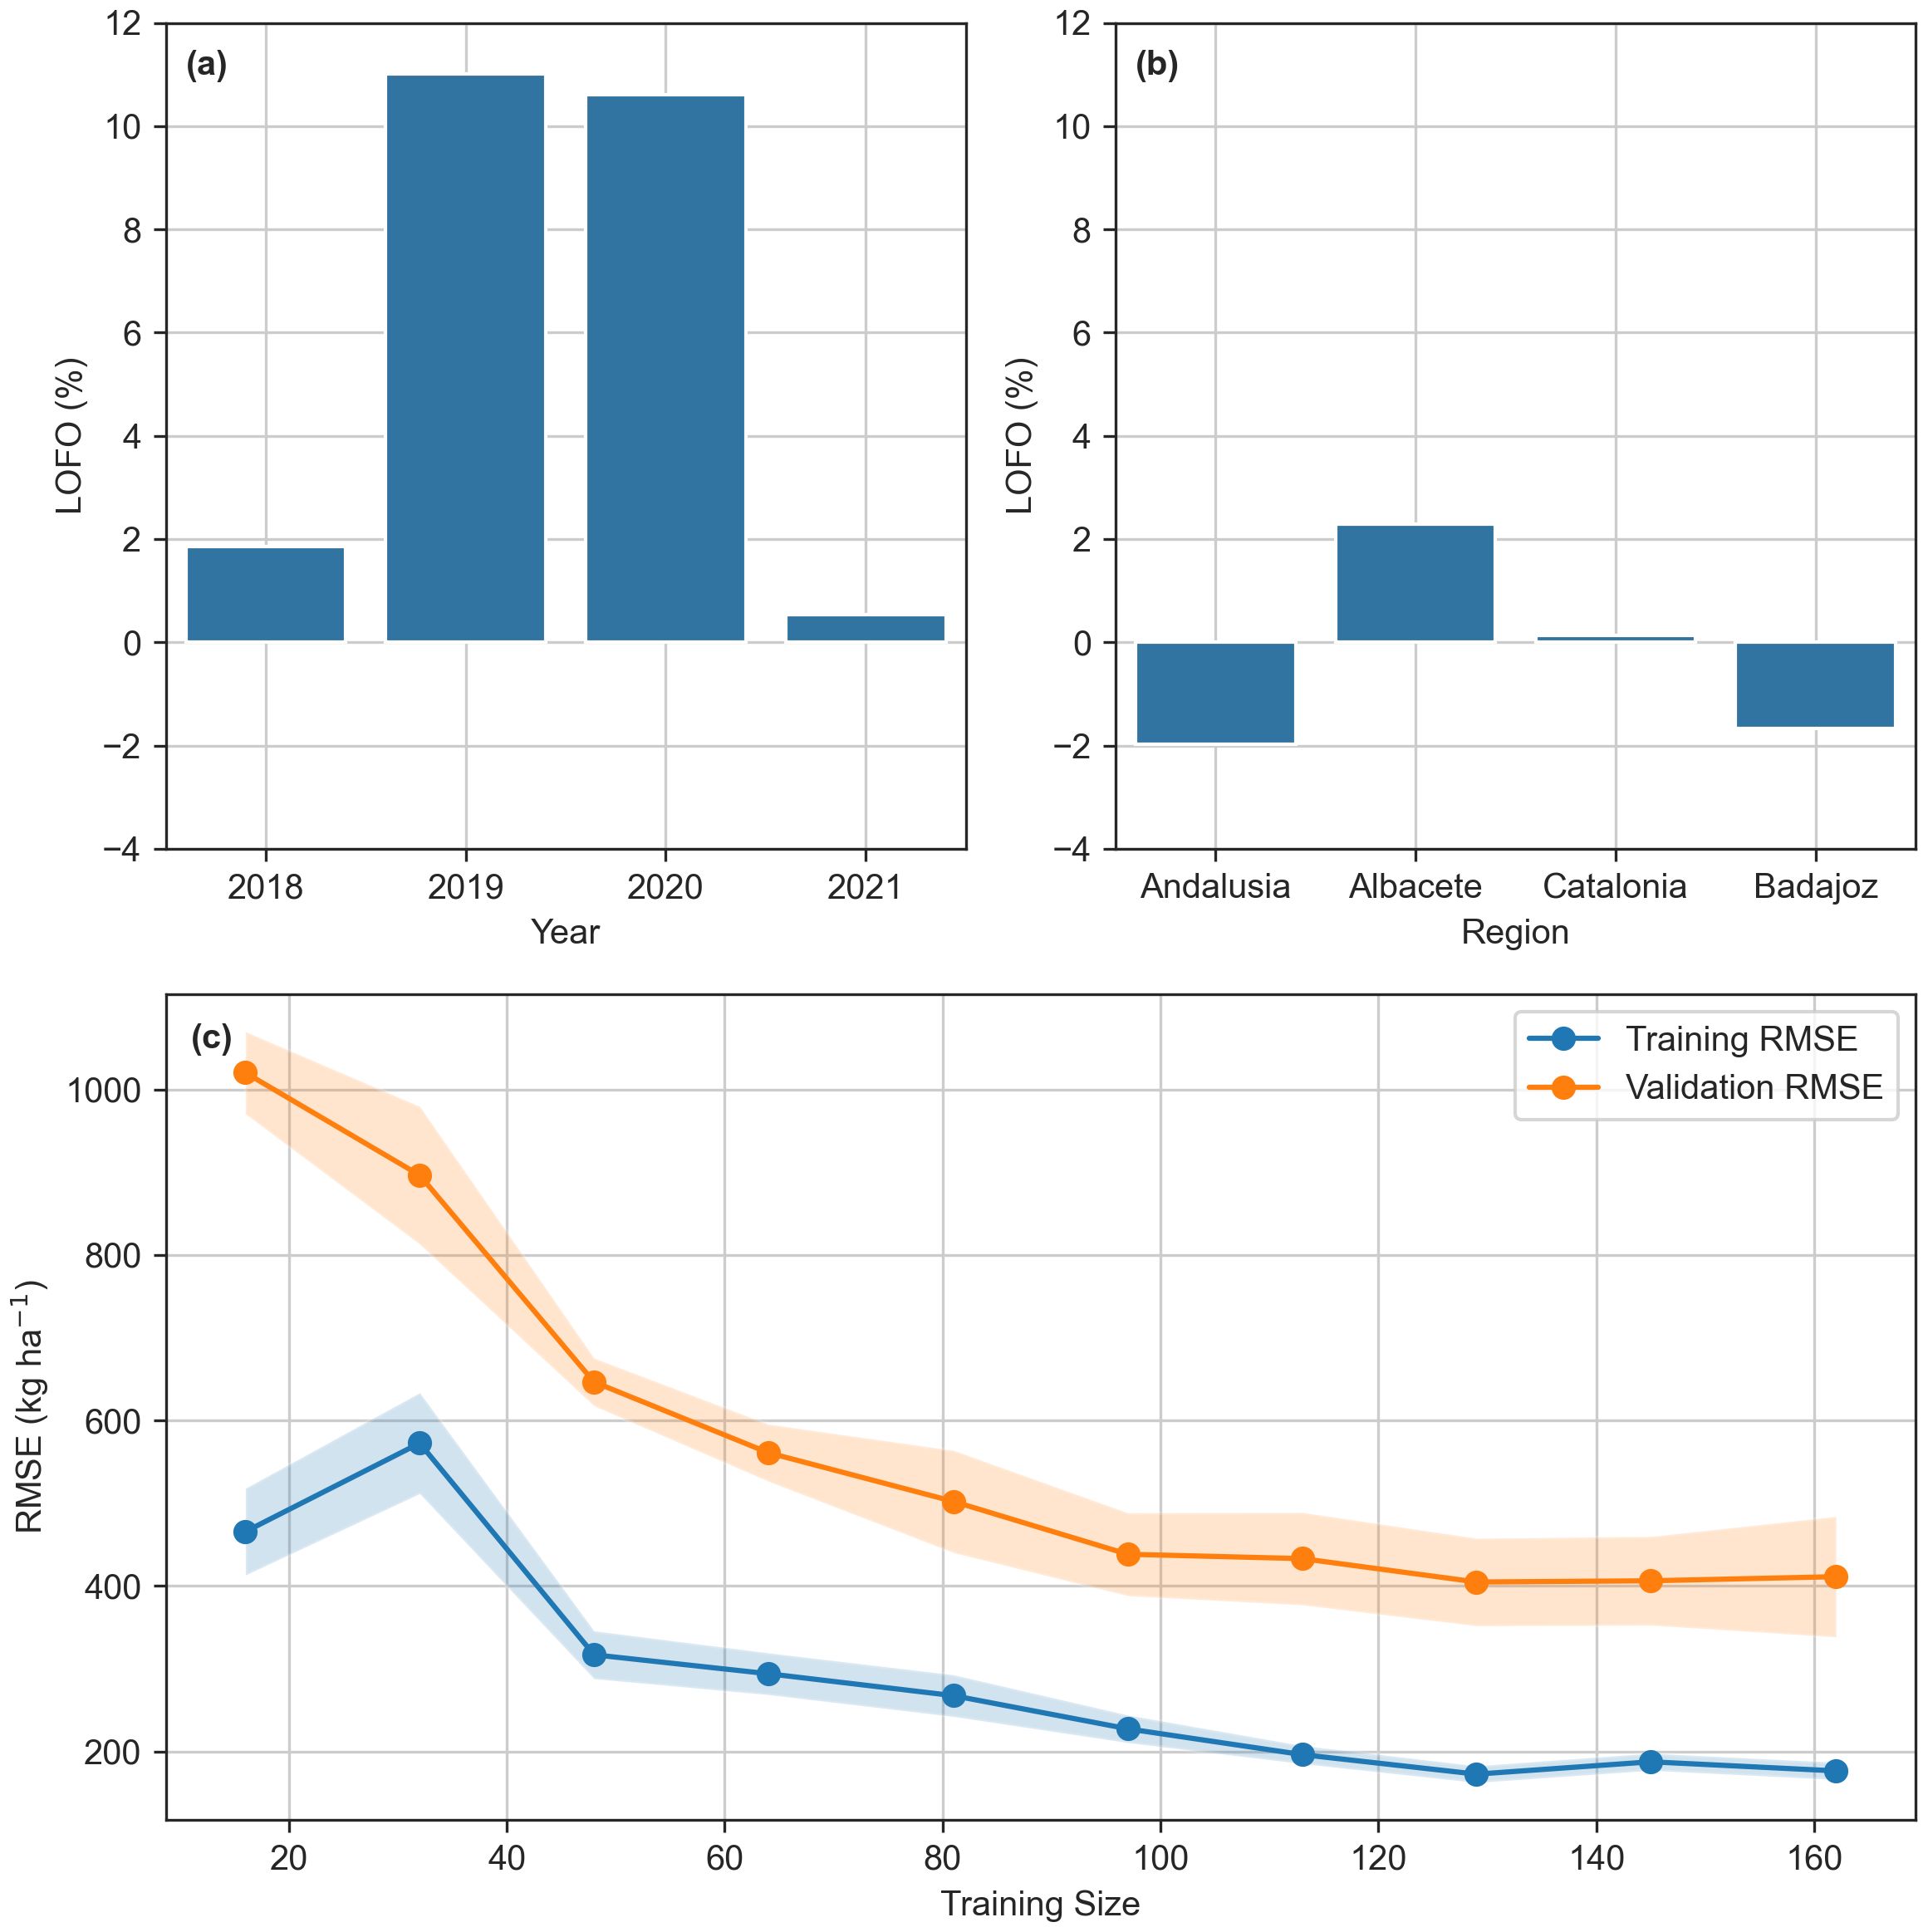
Figure 7. Leave-one-feature-out (LOFO) analysis by year (a) and by region (b). Panel (c) shows the learning curve of the PMCRS model for training and validation sets.
3.3 Enhancement of satellite-based models through inclusion of contextual information
Table 4 shows the effect of adding contextual information to remote sensing-based models. Including irrigation data significantly improved model performance, reducing RMSE by 2.85% for PMVI, 6.05% for PMBT, 6.11% for PMET, and 6.32% for PMCRS. In contrast, tree density and cultivar had little to no impact on model accuracy. Greater improvements were achieved by combining irrigation data with orchard age, resulting in RMSE reductions of 4.93, 8.51, 8.36, and 10.25% for PMVI, PMBT, PMET, and PMCRS, respectively. Adding cultivar data to this combination led to marginal further improvements in PMVI, PMBT, and PMET. Incorporating irrigation and orchard age, the prediction models achieved RMSE values of 404 kg ha-¹ for PMVI, 384 kg ha-¹ for PMBT, 398 kg ha-¹ for PMET, and 389 kg ha-¹ for PMCRS (Figure 6).
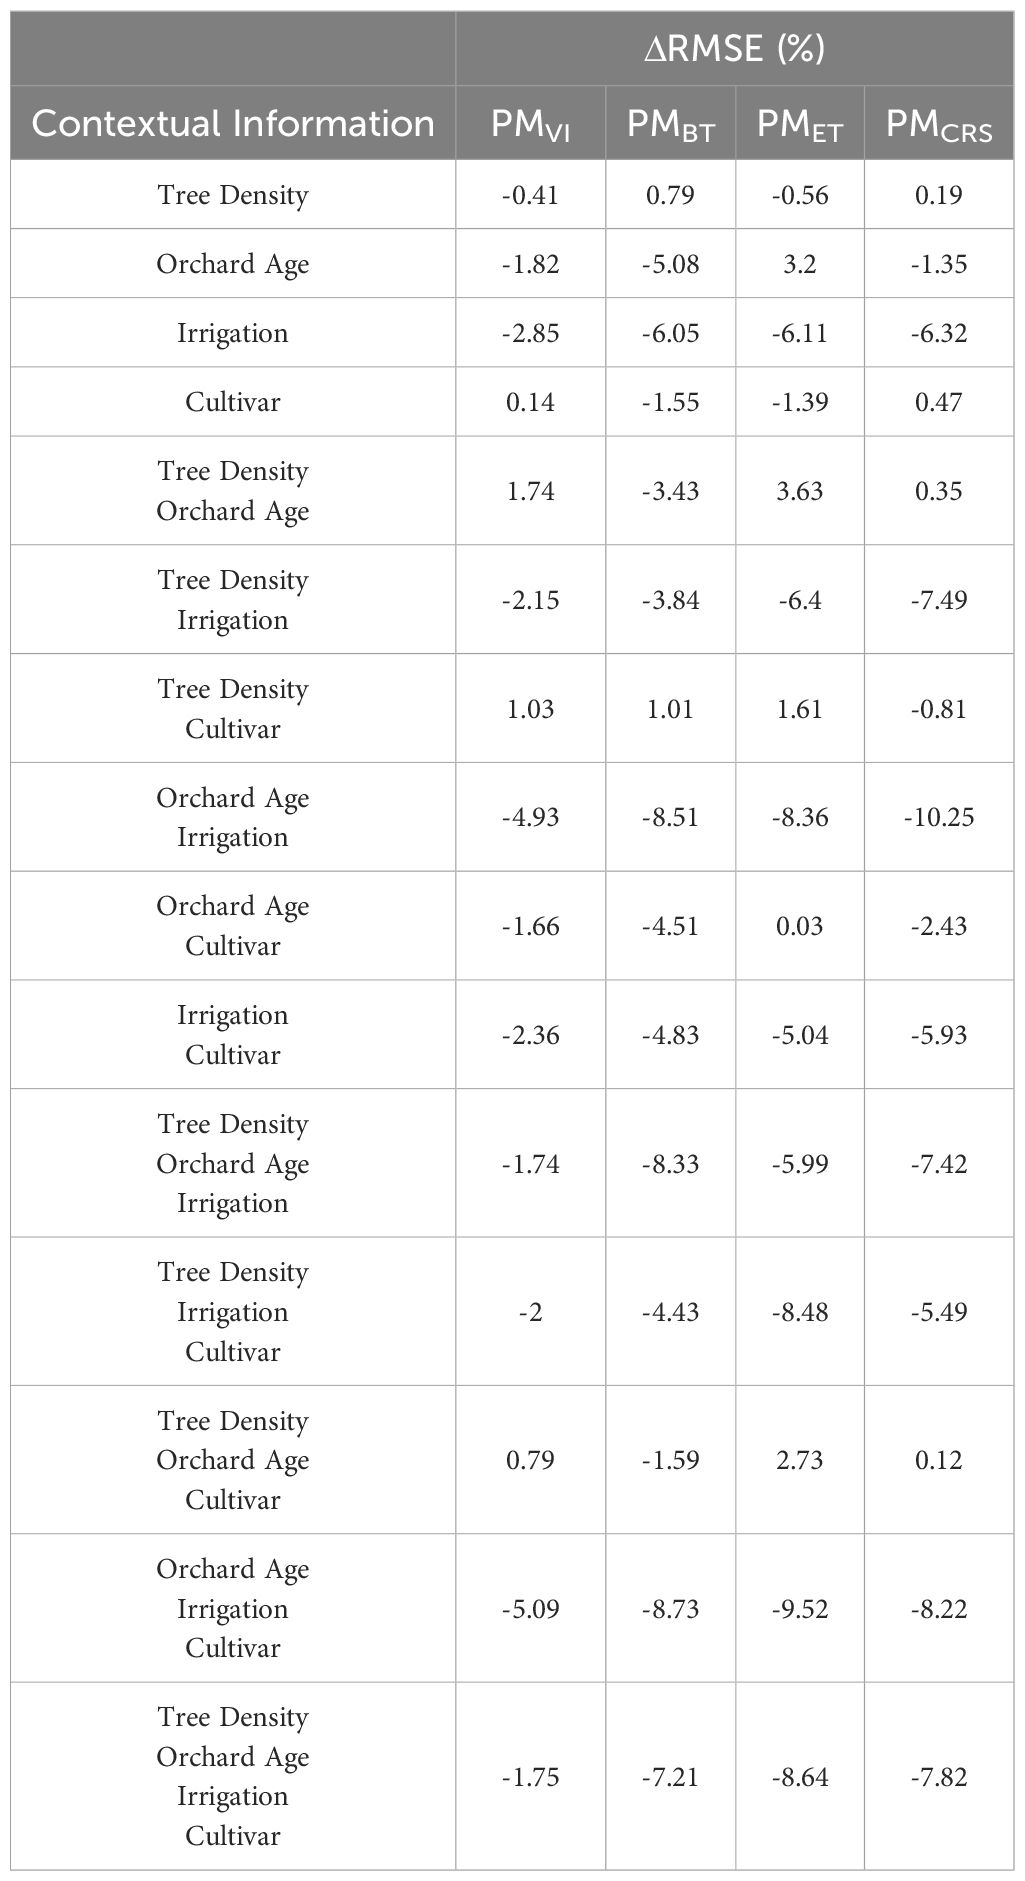
Table 4. Percentage change in root mean square error (ΔRMSE) after incorporating orchard contextual data—including tree density, orchard age, irrigation, and cultivar—into remote sensing-based yield prediction models.
3.4 Evaluation of satellite-based models’ performance on a monthly time scale
Figure 8 shows the end-of-season almond yield predictions using satellite-derived monthly statistics throughout the productive season. The PMBT model slightly outperformed the others, achieving a mean RMSE of 422.1 kg ha-¹, compared to 451.0 kg ha-¹ for PMVI, 435.1 kg ha-¹ for PMET, and 427.4 kg ha-¹ for PMCRS (Figure 8a). Both PMVI and PMBT models exhibited a steady decrease in prediction error over the season, reaching their minimum RMSE values at the end of the growing season. In contrast, PMET and PMCRS models showed decreasing errors until July, when they reached their lowest RMSE values of 405.4 kg ha-¹ and 399.1 kg ha-¹, respectively. However, PMET experienced a notable increase in error during August, with a RMSE rise of 21.4 kg ha-¹, while PMCRS saw a smaller increase of 7.0 kg ha-¹. The incorporation of contextual data—irrigation and orchard age—led to further reductions in RMSE, averaging 5.15% for PMVI, 5.69% for PMBT, 8.07% for PMET, and 4.47% for PMCRS over the course of the production season (Figure 8b).
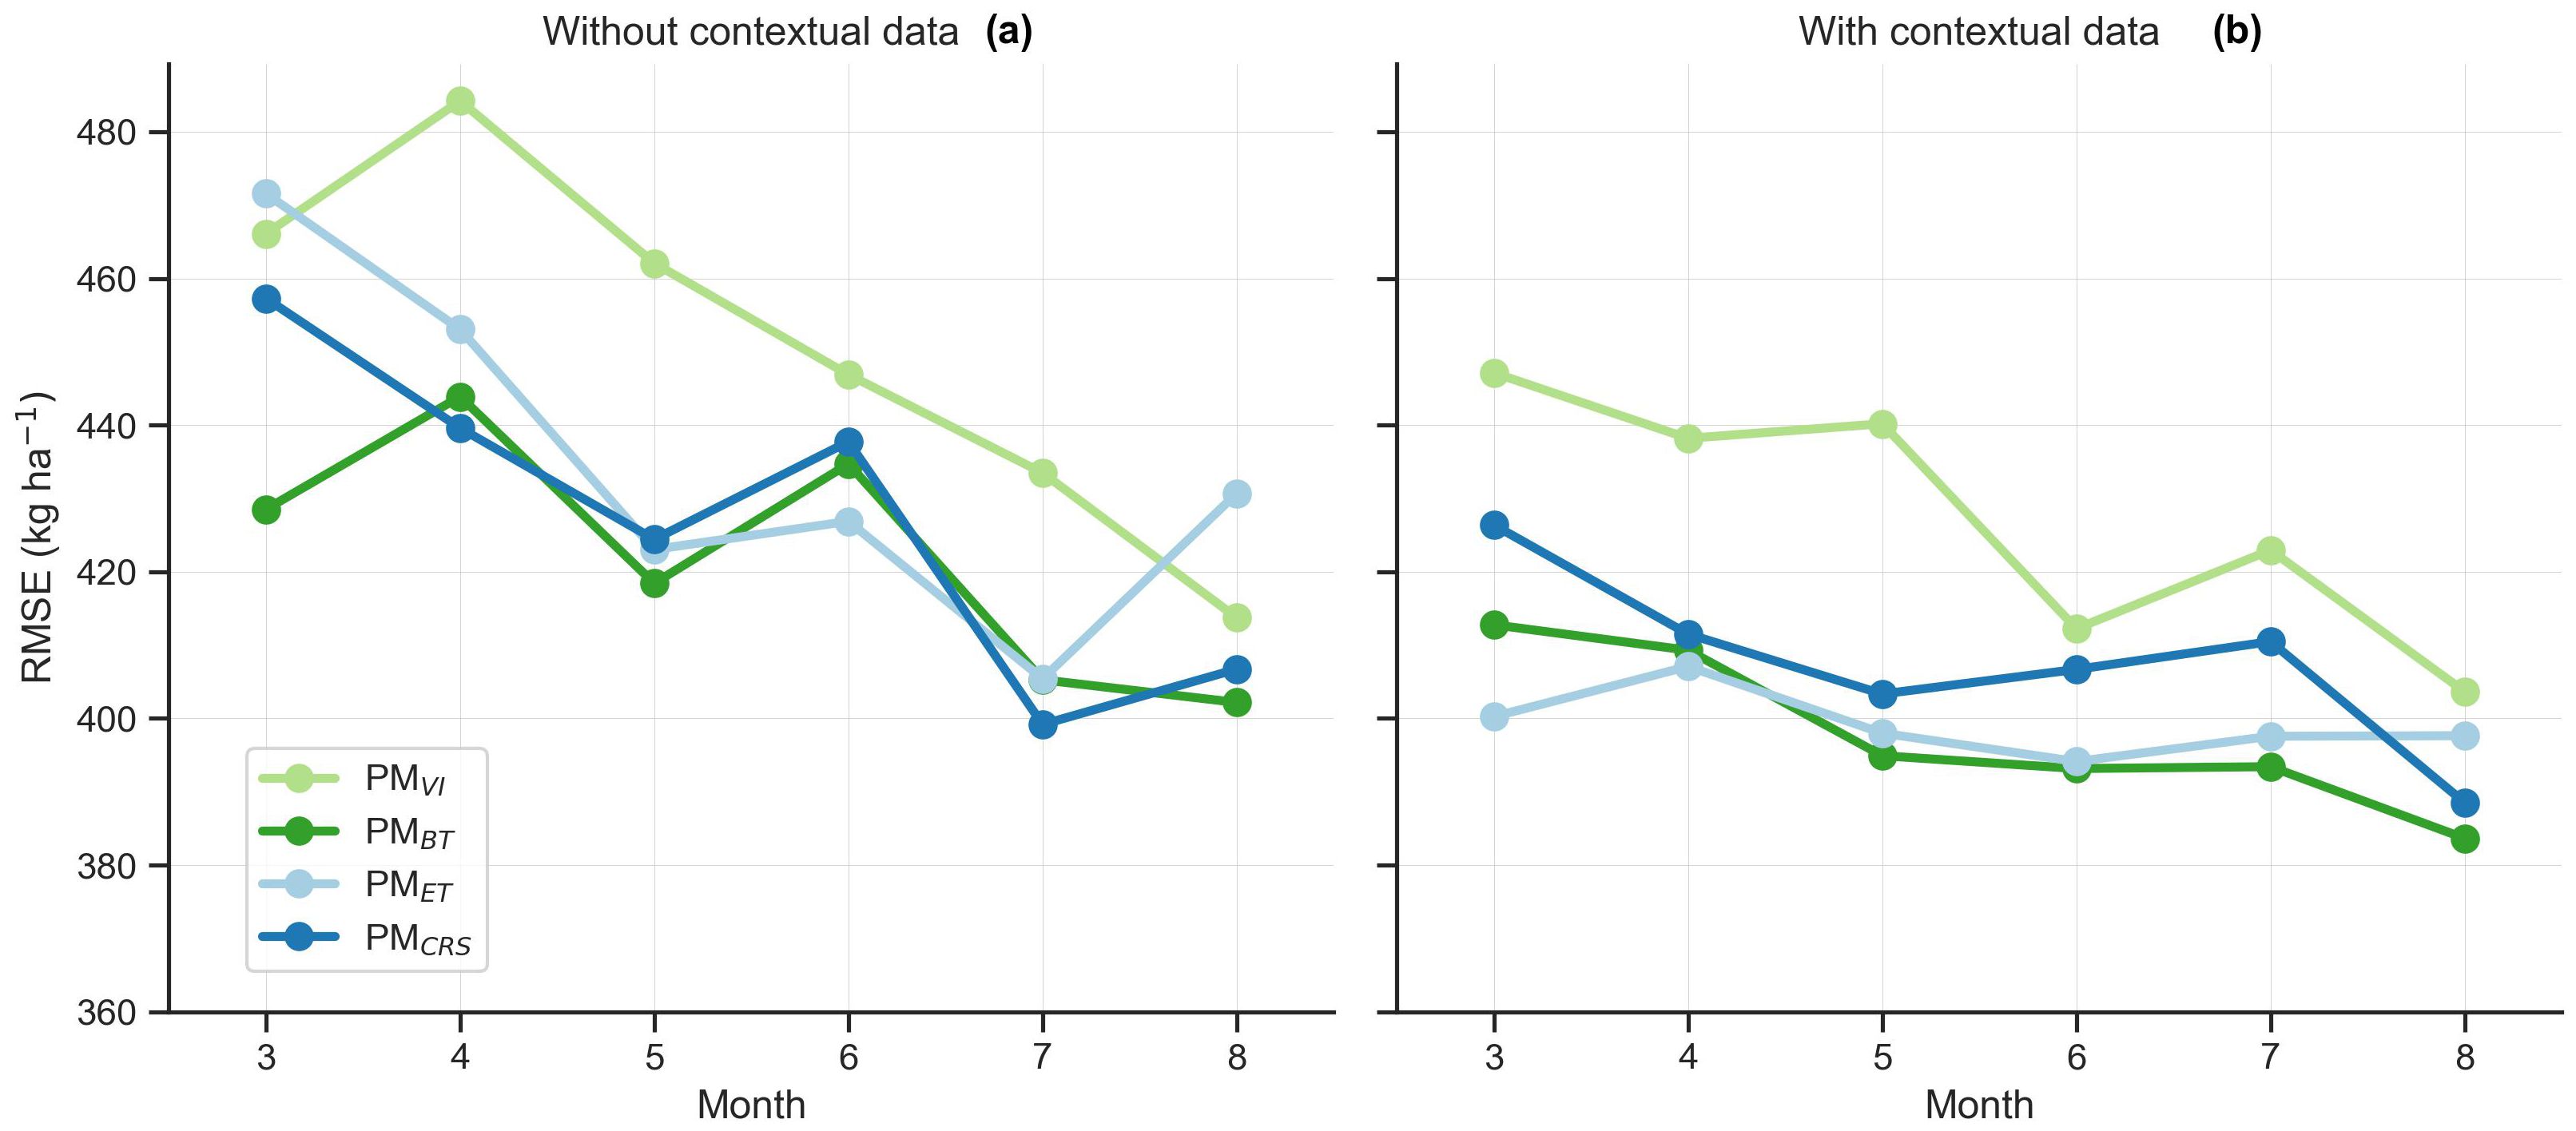
Figure 8. Evolution of root means square error (RMSE) throughout the almond season for kernel yield prediction using the following remote sensing models: vegetation indices (PMVI), biophysical traits (PMBT), ET-based (PMET), and combined remote sensing (PMCRS) models. Figure (a) shows models trained solely on remote sensing data, while (b) includes contextual data (irrigation and orchard age) in addition to remote sensing data.
3.5 Comparison of yield predictions and datasets reported by DARP
Table 5 presents the estimated average of cumulative Peff, Sentinel-2 fAPAR, the cumulative TSEB-PT ETa, along with yield predictions from the PMCRS model and yield data reported by DARP for the four counties assessed. The PMCRS models were trained using data up to July to avoid potential increases in error associated where including August statistics. PMCRS overestimated almond yield compared to reported DARP yield data (Figure 9). Overall, the PMCRS model predicted an average kernel yield of 746.3 kg ha-¹ for irrigated orchards and 446.9 kg ha-¹ for rainfed orchards. In contrast, DARP reported average almond yields of 364.9 kg ha-¹ for irrigated orchards and 136.0 kg ha-¹ for rainfed orchards. This discrepancy reflects differences of 381.3 kg ha-¹ and 310.9 kg ha-¹ for irrigated and rainfed orchards, respectively, indicating that the PMCRS model predictions were 2.05 to 3.28 times higher than the yields reported by DARP. Figure 9 shows a comparison of the yield data time series from PMCRS and DARP for the years 2018 to 2023, distinguishing between rainfed and irrigated orchards within each county. According to DARP, a significant reduction in almond yield was observed in 2022, attributed to a severe frost that impacted the entire region. However, the PMCRS model did not capture this severe reduction resulting from the frost event.
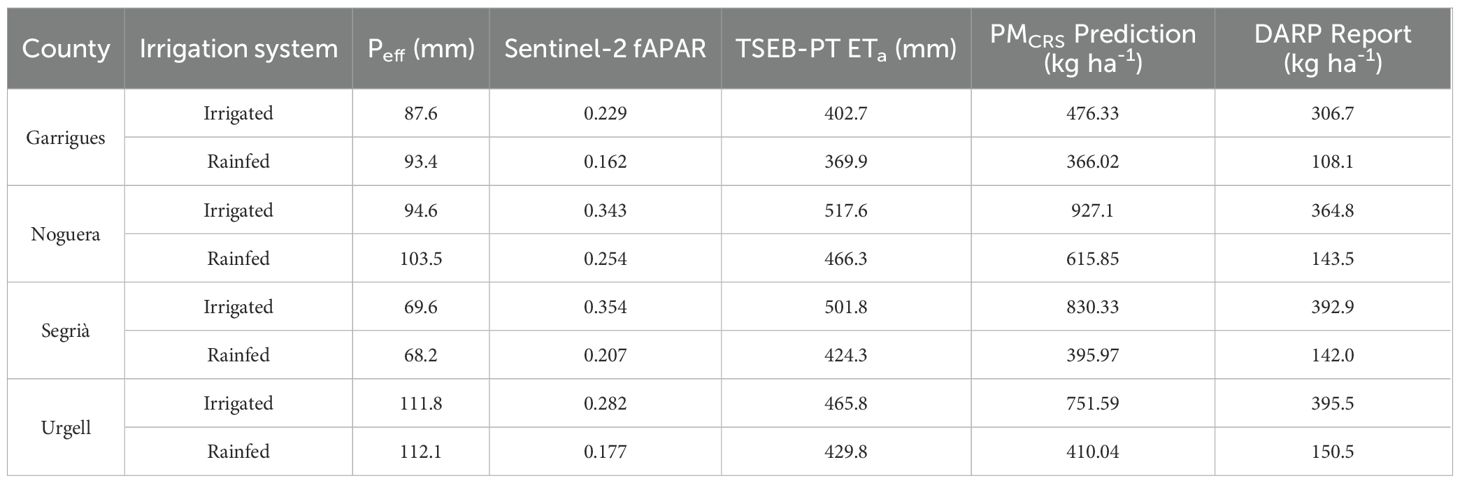
Table 5. The averages of seasonal effective precipitation (Peff), fraction of absorbed photosynthetically active radiation (fAPAR), cumulative TSEB-PT actual crop evapotranspiration (ETa), and almond yield estimated with the PMCRS model, along with the yield reported by DARP from 2018 to 2023 in the following four counties within the Ebro basin: Garrigues, Noguera, Segrià and Urgell.
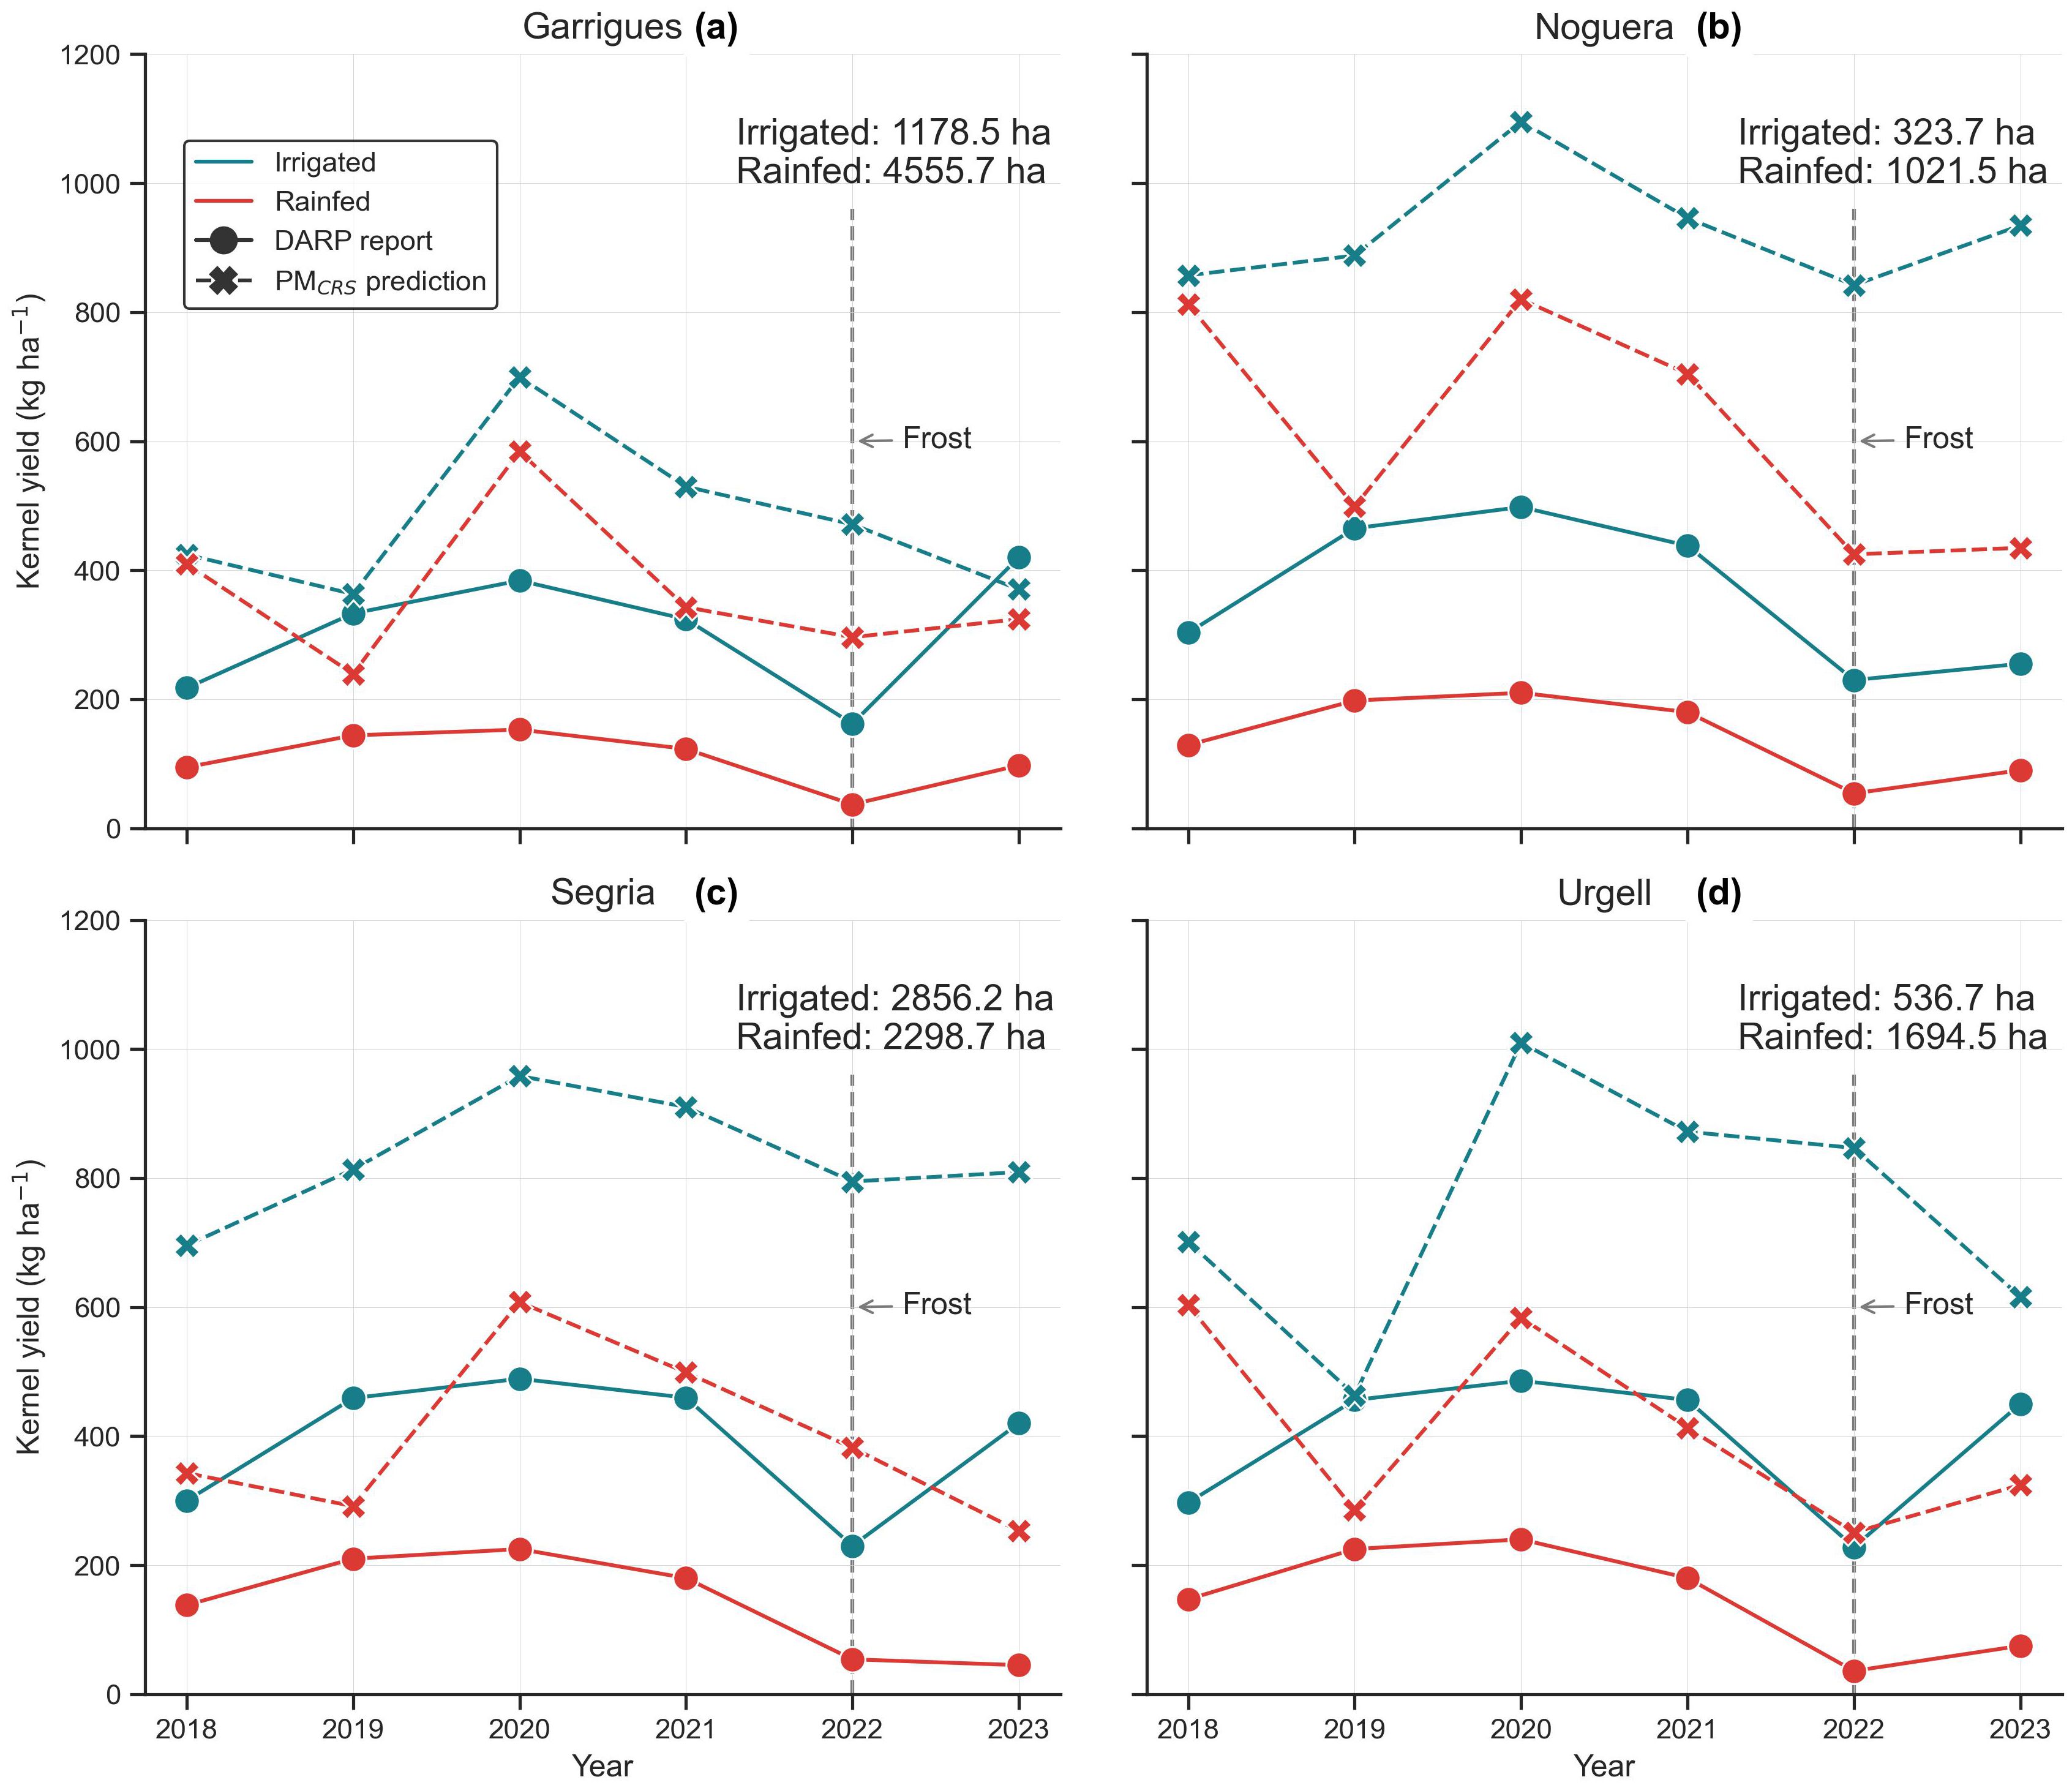
Figure 9. Time series comparing the average annual almond yield estimated by the Catalan administration (DARP) with the predictions of the PMCRS model developed in this study for four Catalan counties: (a) Garrigues, (b) Noguera, (c) Segrià, and (d) Urgell. Each figures distinguish between irrigated and rainfed orchards and indicates the total cultivated area for each irrigation type.
4 Discussion
Defining actual crop water production functions at the orchard level is essential for assessing the impacts of water scarcity and climate change on agricultural productivity. In the case of almond orchards, most studies have been conducted in experimental plots—typically small—where water production functions were commonly derived from tree-level measurements using soil water balance methods or sap-flow sensors (Girona et al., 2005; Egea et al., 2010; Goldhamer and Fereres, 2017; López-López et al., 2018; Moldero et al., 2021). These earlier studies focused exclusively on traditional orchards, mainly characterized by planting distances greater than 7 × 6 m. This work represents a novel contribution by presenting, for the first time, almond water production functions at the orchard scale using actual data from commercial orchards and satellite-derived estimates of fAPAR and ETa. Our dataset encompasses diverse orchard characteristics, with contrasts in tree density, age, irrigation practices, and cultivar, across two principal almond-growing regions in Spain. Despite the heterogeneous orchard conditions and the innovative use of remote sensing-based fAPAR and ETa estimates, our results yielded water production functions that closely aligned with those reported in experimental studies (Figure 3; Miras-Avalos et al., 2023; Jin et al., 2020; Moldero et al., 2021). This broader approach provides more comprehensive insights for improving water productivity and highlights the utility of remote sensing-based estimates of fAPAR and ETa for monitoring orchard performance under diverse management conditions in Spain.
Regarding almond yield predictions, the advanced boosting models—XGBoost and LightGBM—outperformed SGB and RF models, with LightGBM achieving the best results (Table 3). Both XGBoost and LightGBM benefit from sequential learning and gradient-based optimization, enabling them to capture complex interactions among predictors. Similar findings were reported by Zhang et al. (2019), Li et al. (2023), and Guimarães et al. (2024), who also obtained better performance using boosting algorithms such as SGB and XGBoost. In this study, the superior performance of LightGBM can be attributed in part to its leaf-wise tree growth strategy, which improves upon the level-wise approach used by SGB and XGBoost by more effectively reducing the loss function—particularly beneficial in complex datasets. In addition, LightGBM use of histogram-based algorithms accelerates training and lowers memory usage, allowing it to efficiently handle large datasets and high-dimensional feature spaces (Kumar et al., 2024).
However, Zhang et al. (2019) and Guimarães et al. (2024) achieved even lower RMSE values—352 kg ha-¹ and 214 kg ha-¹, respectively—when estimating almond yield using open-access remote sensing imagery. The better performance in those studies may be attributed to the use of larger training datasets and/or lower variability in climate and orchard management practices. In contrast, the relatively smaller training dataset used in our study may have limited further improvements in prediction accuracy. As larger and more diverse datasets become available, more advanced algorithms—such as deep learning models for sequential data (e.g., recurrent neural networks, CNN–Transformer architectures), Long Short-Term Memory (LSTM), Bayesian Neural Networks (BNN), and convolutional neural networks (CNN)—could offer additional gains in almond yield prediction (Rußwurm and Körner, 2020; Tang et al., 2023; Thorp and Drajat, 2021; Xu et al., 2020; Ma et al., 2021). Whereas expanding the dataset would likely reduce overall RMSE, adopting more advanced modeling approaches could address the discrepancy observed between training and validation learning curves.
Remote sensing–based models achieved predictive accuracy similar to that of models relying solely on contextual data. This is particularly relevant for developing yield estimation methodologies at the regional scale, as the required information is open-access and thus relatively easy to operationalize and scale to other regions. In contrast, collecting contextual data at large scales is often challenging, making remote sensing a practical solution for broad-scale yield prediction. Nevertheless, combining remote sensing with selected contextual variables—primarily irrigation amounts and orchard age—can further enhance model accuracy by up to 9% (Table 4) and improve early-season predictions (Figure 8). In this context, incorporating irrigation data, either measured by digital water meters or estimated through water balance approaches, can substantially improve yield prediction models. For instance, previous studies have demonstrated promising results in estimating irrigation at the district scale using the FAO-56 method combined with Sentinel-1 synthetic aperture radar imagery, enabling effective tracking of irrigation across diverse regimes and large areas (Olivera-Guerra et al., 2023; Laluet et al., 2024). Similarly, models that incorporate ETa estimates from thermal imagery into the water balance equation have shown strong potential for quantifying irrigation needs (Brombacher et al., 2022; Knipper et al., 2024). Additionally, orchard age served as a useful proxy for tree maturity, which is directly linked to maximum yield potential (Kendall et al., 2015). This variable was particularly relevant given the wide age range of almond orchards included in this study (Figure 2b).
Our results indicate that the most important remote sensing variables for predicting almond yield were fAPAR, NDMI, Cab, and ETa. The use of fAPAR and Cab from Sentinel-2 and the biophysical processor proved particularly valuable for almond yield prediction, outperforming simpler vegetation indices. Vegetation indices often saturate under moderate to dense canopies—especially in crops with clustered structures—limiting their effectiveness in monitoring vegetation status and, consequently, in estimating yield (Haboudane et al., 2004; Delalieux et al., 2008; Gabaldón-Leal et al., 2024). In this context, the biophysical processor offers a robust alternative for assessing canopy conditions, particularly through the estimation of fAPAR and Cab—variables that showed strong influence on almond yield prediction models. This is supported by previous studies highlighting the close relationship between intercepted or absorbed photosynthetically active radiation and maximum almond yield (Casadesús et al., 2011; Zarate-Valdez et al., 2015; Lampinen et al., 2012; Jin et al., 2020). Additionally, Bellvert et al. (2023) demonstrated the strong performance of biophysical processors for monitoring fAPAR in woody crops such as vineyards. To our knowledge, this study is the first to demonstrate the utility of Sentinel-2-derived fAPAR from the biophysical processor for estimating yield in almond orchards.
The Cab also emerged as an important indicator of almond yield. Given its role as a key determinant of photosynthetic capacity, Cab is particularly relevant for assessing primary production and yield potential (Green et al., 2003; Li et al., 2018). Since Cab is calculated as the product of leaf-level chlorophyll content and LAI, it likely provides a more integrative representation of vegetation status than LAI alone (Weiss et al., 2000). This may explain the consistently lower importance of LAI observed across prediction models. Consequently, both fAPAR and Cab appear to be more comprehensive indicators of vegetation status in almond orchards, while LAI and FVC may have introduced redundant information and noise, limiting their utility in yield prediction.
On the other hand, the models particularly benefited from the use of the SWIR band to detect vegetation water content through indices such as NDMI and CW. Indices derived from the combination of NIR and SWIR bands have proven effective for assessing crop water stress levels (Gao, 1996; Ghazaryan et al., 2020; Berca and Horoiaș, 2019; 2022). However, these spectral indices are complementary to thermal-derived data, which provide additional insights into heat emission and surface energy fluxes. Overall, integrating multiple remote sensing sources may offer a more robust approach for monitoring vegetation status and improving yield predictions (Guan et al., 2017; Ghazaryan et al., 2020).
However, the spatial resolution of Sentinel-2 images presents specific challenges. The 10-to-60-meter resolution of Sentinel-2 captures a composite of radiometric data that includes both the canopy and the inter-row areas, preventing accurate characterization of the almond canopy biophysical traits alone. The presence of cover crops in the inter-row often introduces noise in the accurate estimation of biophysical traits. For example, in the water production functions obtained in this study, we can find orchards with low yields but high fAPAR and ETa values (Figure 4). This could be explained by the fact that they are young plantations with cover crops in the inter-row. In that sense, exploring alternative satellite imagery at higher resolutions or the adoption of data fusion approaches could be an option (W. Li et al., 2019a; Sadeh et al., 2021).
It appears that incorporating ETa from remote sensing had little impact on improving almond yield predictions. In fact, it may have introduced additional error when monthly ETa from August was included in the models. This could be attributed to the likelihood that almond yield was largely determined by ETa accumulated before July, while ETa in August had little influence on final yield and may have added noise to the predictions in our study sites. Furthermore, the similar performance of the PMBT, PMET, and PMCRS models may be explained by the fact that orchards were irrigated throughout the season, without significant water stress that could have affected the final yield. As a result, almond orchards tended to reach their potential yield, which is more closely associated with biophysical traits. Thermal-based ETa estimates provide valuable insights into plant water stress (Guan et al., 2017; Quintanilla-Albornoz et al., 2024; Quintanilla-Albornoz et al., 2025; Sánchez-Virosta et al., 2025) and may be particularly useful for yield prediction under conditions of severe water shortage. Another possible explanation for the lack of significant improvement in almond yield prediction models when using ETa estimates may lie in the limitations of disaggregating land surface temperature (LST) by sharpening Sentinel-2 and Sentinel-3 images. Studies have indicated that this approach has certain limitations in capturing the full range of temperatures and detecting short-term water stress events, particularly when there is stomatal closure without a significant reduction in biomass (Bellvert et al., 2020; Guzinski et al., 2023, 2021). However, the upcoming launch of new thermal missions, such as TRISHNA (Lagouarde et al., 2018) and SBG (Stavros et al., 2023), alongside advancements in Landsat missions (Wu et al., 2019), is expected to address these challenges. These missions will provide enhanced access to thermal imagery with spatial resolutions of approximately 60 m, 60–90 m, and 100 m, respectively. Therefore, improved models using new thermal missions should be tested to enhance ETa estimation from remote sensing in woody crops. This will be particularly relevant under increasingly frequent drought conditions, where water stress is expected to significantly affect yield in woody crops.
This study also revealed that almond yield predictions are subject to high levels of uncertainty. The variability in production systems — such as cultivar, training systems, rootstock— combined with differences in grower practices such as soil characteristics, canopy management, nutrient applications, and irrigation systems, introduces further complexity into the almond yield prediction models (Reig et al., 2022; Montoya et al., 2022; Quintanilla-Albornoz et al., 2024). This is particularly evident in Figure 4, which illustrates the high variability in almond yield response to the water available (irrigation + Peff). Discrepancies between yield and forcing variables such as irrigation, fAPAR, and ETa are also frequently observed due to the interannual fluctuations in almond production, even in mature orchards (Quintanilla-Albornoz et al., 2024; Zhang et al., 2019). To address this complexity, some studies have suggested incorporating yield data records from previous years, which could help mitigate the variability due to orchard-specific characteristics (Tang et al., 2023; Zhang et al., 2019).
The PMCRS model was employed to estimate almond yield of some counties within the Ebro basin, demonstrating its scalability for yield prediction at both orchard and regional scale. The PMCRS model significantly overestimated yields compared to DARP reports, possibly due to DARP underestimations or differences in orchard management between datasets. Concerns have been raised regarding DARP’s yield estimates, as its methodology is ambiguous and relies on numerous assumptions. Evidence of this may be seen in the extremely low yields reported by DARP in comparison to the fAPAR and ETa estimates for the almond orchards in the sector (Table 5 and Figure 4). The PMCRS model may also overestimate yields due to the use of training data sets from growers with superior management, more modern almond production models, and the underrepresentation of rainfed orchards. Moving forward, it’s essential to validate the model using actual yield data from other growers in the region, and to continuously incorporate yield data into the training and testing sets.
4.1 Limitations and future works
This study presents a promising approach for estimating almond yield from the orchard to the regional scale using remote sensing data. However, some limitations should be acknowledged, which also suggest avenues for future work:
● Geographical and orchard generalization: Our models were trained and validated mainly in two Spanish regions. Future work should increase the representation of orchards, cultivars, and age ranges, and recalibrate the models when extending to other regions both within and outside Spain. Transferability to areas beyond Spain may require recalibration to account for different climates and cultivars.
● Extreme weather events or disease outbreaks: The current models do not explicitly account for unpredictable yield-affecting events such as frost, hail, or pest/disease outbreaks. For instance, the severe frost in 2022 caused yield reductions that the model could not capture. It is therefore important to analyze how regional-scale models (such as remote sensing approaches) might incorporate these events. Incorporating short-window weather risk features aligned with phenology, or integrating complementary data sources, could help address these limitations.
● Remote sensing and ET-based models: The upcoming launch of new thermal missions and the development of improved modeling frameworks offer opportunities to refine ET estimations.
● Dataset availability and representativeness: A key limitation is the restricted access to grower-reported yield data, which constrains sample size and diversity. Expanding collaborative datasets would not only enhance representativeness but also improve the robustness of the models.
5 Conclusion
This study aimed to develop yield prediction models and, for the first time, establish water production functions for almond trees at the orchard level in Spain, using actual commercial orchards data combined with remote sensing-derived products. The water production functions derived from commercial orchards closely aligned with those reported in previous experimental studies, offering a complementary and broader perspective for enhancing water productivity and yield prediction in almond orchards.
Remote sensing-based prediction models demonstrated strong potential, outperforming those based solely on contextual data provided by growers. Notably, the PMCRS model—which integrates variables such as fAPAR, NDMI, Cab, ETa, and meteorological data—achieved an RMSE of 399.1 kg ha-¹ in July. Among these variables, fAPAR and Cab derived from Sentinel-2 and the biophysical processor proved particularly robust for assessing vegetative status and showed a strong influence on almond yield prediction. NDMI also exhibited high importance, likely due to its effectiveness in monitoring vegetation’s water content. Although ETa showed moderate importance, thermal-based estimates offer valuable insights into plant water stress and may be especially useful under conditions of severe water scarcity—an increasingly relevant factor given the rising frequency of droughts in woody crops. The integration of multiple remote sensing sources appears to be a promising strategy for enhancing yield prediction accuracy. Further improvements could be achieved by incorporating irrigation estimates, refining ETa retrievals through upcoming thermal missions, and applying more advanced machine learning and deep learning algorithms.
The modeling framework developed in this study was also applied to estimate almond yields at the county scale in the Ebro basin (Catalonia, Spain). The results suggest a potential overestimation by the Catalan Administration, possible due to lack of consistency in its yield estimation method. This example underscores the potential of remote sensing-based models, demonstrating their scalability and utility for yield prediction at both the orchard and regional levels.
Data availability statement
The raw data supporting the conclusions of this article will be made available by the authors, without undue reservation.
Author contributions
MQ-A: Data curation, Validation, Formal Analysis, Visualization, Methodology, Software, Writing – review & editing, Investigation, Resources, Conceptualization, Supervision, Writing – original draft, Project administration. XM: Project administration, Funding acquisition, Resources, Writing – review & editing. MP-S: Software, Writing – review & editing, Resources. JB: Funding acquisition, Writing – review & editing, Formal Analysis, Supervision, Investigation, Project administration, Conceptualization.
Funding
The author(s) declare financial support was received for the research and/or publication of this article. This research was funded by the DIGISPAC project (TED2021-131237B-C21), from by the Ministry of Science, Innovation and Universities of the Spanish government and by the internal IRTA’s scholarship. The IRTA team is also supported by the CERCA Program, Government of Catalonia. The authors would also like to thank the Horizon 2020 Research and Innovation Program (H2020) of the European Commission, in the context of the Marie Sklodowska-Curie Research and Innovation Staff Exchange (RISE) action and ACCWA project: grant agreement No.: 823965.
Conflict of interest
The authors declare that the research was conducted in the absence of any commercial or financial relationships that could be construed as a potential conflict of interest.
Generative AI statement
The author(s) declare that Generative AI was used in the creation of this manuscript. During the preparation of this work the author(s) used ChatGPT-3.5 in order to enhance readability and language of this work. After using this tool/service, the author(s) reviewed and edited the content as needed and take(s) full responsibility for the content of the published article.
Any alternative text (alt text) provided alongside figures in this article has been generated by Frontiers with the support of artificial intelligence and reasonable efforts have been made to ensure accuracy, including review by the authors wherever possible. If you identify any issues, please contact us.
Publisher’s note
All claims expressed in this article are solely those of the authors and do not necessarily represent those of their affiliated organizations, or those of the publisher, the editors and the reviewers. Any product that may be evaluated in this article, or claim that may be made by its manufacturer, is not guaranteed or endorsed by the publisher.
Supplementary material
The Supplementary Material for this article can be found online at: https://www.frontiersin.org/articles/10.3389/fagro.2025.1667674/full#supplementary-material
References
Allen R. G., Pereira Luis S., Dirk R., and Smith M. (1998). FAO irrigation and drainage paper crop by. Irrig. Drain. 300, 300.
Allgaier J. and Pryss R. (2024). Cross-validation visualized: A narrative guide to advanced methods. Mach. Learn. Knowl. Extr. 6, 1378–1388. doi: 10.3390/make6020065
Anderson M. C., Norman J. M., Kustas W. P., Li F., Prueger J. H., and Mecikalski J. R. (2005). Effects of vegetation clumping on two-source model estimates of surface energy fluxes from an agricultural landscape during SMACEX. J. Hydrometeorol. 6, 892–909. doi: 10.1175/JHM465.1
Archontoulis S. V., Castellano M. J., Licht M. A., Nichols V., Baum M., Huber I., et al. (2020). Predicting crop yields and soil-plant nitrogen dynamics in the US Corn Belt. Crop Sci. 60, 721–738. doi: 10.1002/csc2.20039
Beck H. E., Pan M., Roy T., Weedon G. P., Pappenberger F., Van Dijk A. I. J. M., et al. (2019). Daily evaluation of 26 precipitation datasets using Stage-IV gauge-radar data for the CONUS. Hydrol. Earth Syst. Sci. 23, 207–224. doi: 10.5194/hess-23-207-2019
Bellvert J., Jofre-Ĉekalović C., Pelechá A., Mata M., and Nieto H. (2020). Feasibility of using the two-source energy balance model (TSEB) with Sentinel-2 and Sentinel-3 images to analyze the spatio-temporal variability of vine water status in a vineyard. Remote Sens 12, 2299. doi: 10.3390/rs12142299
Bellvert J., Pamies-Sans M., Quintana-Seguí P., and Casadesús J. (2024). Analysis and forecast of crop water demand in irrigation districts across the eastern part of the Ebro river basin (Catalonia, Spain): estimation of evapotranspiration through copernicus-based inputs. Irrig. Sci. 43, 637–654. doi: 10.1007/s00271-024-00971-1
Bellvert J., Pelechá A., Pamies-Sans M., Virgili J., Torres M., and Casadesús J. (2023). Assimilation of sentinel-2 biophysical variables into a digital twin for the automated irrigation scheduling of a vineyard. Water (Switzerland) 15, 2506. doi: 10.3390/w15142506
Berca M. and Horoiaș R. (2022). NDMI use in recognition of water stress issues related to winter wheat yields in southern Romania. Scientific Papers Series Management. Economic Eng. Agric. Rural Dev. 22, 105–111.
Bolton D. K. and Friedl M. A. (2013). Forecasting crop yield using remotely sensed vegetation indices and crop phenology metrics. Agric. For. Meteorol. 173, 74–84. doi: 10.1016/j.agrformet.2013.01.007
Brombacher J., Silva I. R., de O., Degen J., and Pelgrum H. (2022). A novel evapotranspiration based irrigation quantification method using the hydrological similar pixels algorithm. Agric. Water Manage. 267, 107602. doi: 10.1016/j.agwat.2022.107602
Burchard-Levine V., Nieto H., Riaño D., Migliavacca M., El-Madany T. S., Guzinski R., et al. (2021). The effect of pixel heterogeneity for remote sensing based retrievals of evapotranspiration in a semi-arid tree-grass ecosystem. Remote Sens. Environ. 260, 112440. doi: 10.1016/j.rse.2021.112440
Burchard-Levine V., Nieto H., Riaño D., Migliavacca M., El-Madany T. S., Perez-Priego O., et al. (2020). Seasonal adaptation of the thermal-based two-source energy balance model for estimating evapotranspiration in a semiarid tree-grass ecosystem. Remote Sens 12, 904. doi: 10.3390/rs12060904
Casadesús J., Mata M., Marsal J., and Girona J. (2011). Automated irrigation of apple trees based on measurements of light interception by the canopy. Biosyst. Eng. 108, 220–226. doi: 10.1016/j.biosystemseng.2010.12.004
Chandrasekar K., Srikanth P., Chakraborty A., Choudhary K., and Ramana K. V. (2024). Response of crop water indices to soil wetness and vegetation water content. Adv. Sp. Res. 73, 1316–1330. doi: 10.1016/j.asr.2022.11.019
Chen B., Jin Y., and Brown P. (2019). An enhanced bloom index for quantifying floral phenology using multi-scale remote sensing observations. ISPRS J. Photogramm. Remote Sens. 156, 108–120. doi: 10.1016/j.isprsjprs.2019.08.006
Delalieux S., Somers B., Hereijgers S., Verstraeten W. W., Keulemans W., and Coppin P. (2008). A near-infrared narrow-waveband ratio to determine Leaf Area Index in orchards. Remote Sens. Environ. 112, 3762–3772. doi: 10.1016/j.rse.2008.05.003
Díez-Palet I., Funes I., Savé R., Biel C., Herralde F., Miarnau X., et al. (2019). Blooming under Mediterranean climate: Estimating cultivar-specific chill and heat requirements of almond and apple trees using a statistical approach. Agronomy 9, 1–21. doi: 10.3390/agronomy9110760
Dzotsi K. A., Basso B., and Jones J. W. (2013). Development, uncertainty and sensitivity analysis of the simple SALUS crop model in DSSAT. Ecol. Modell. 260, 62–76. doi: 10.1016/j.ecolmodel.2013.03.017
Egea G., Nortes P. A., González-Real M. M., Baille A., and Domingo R. (2010). Agronomic response and water productivity of almond trees under contrasted deficit irrigation regimes. Agric. Water Manage. 97, 171–181. doi: 10.1016/j.agwat.2009.09.006
Espadafor M., Orgaz F., Testi L., Lorite I. J., and Villalobos F. J. (2015). Transpiration of young almond trees in relation to intercepted radiation. Irrig. Sci. 33, 265–275. doi: 10.1007/s00271-015-0464-6
Food and Agriculture Organization of the United Nations (2024). FAOSTATS. Available online at: https://www.fao.org/faostat/en/data (Accessed 12 Novimiebre 2024).
Freitas T. R., Santos J. A., Silva A. P., Fonseca A., and Fraga H. (2023). Evaluation of historical and future thermal conditions for almond trees in north-eastern Portugal. Clim. Change. 176, 89. doi: 10.1007/s10584-023-03569-2
Gabaldón-Leal C., Sánchez-Virosta Á., Doña C., González-Piqueras J., Sánchez J. M., and López-Urrea R. (2024). Ground measurements and remote sensing modeling of gross primary productivity and water use efficiency in almond agroecosystems. Agriculture 14, 1589. doi: 10.3390/agriculture14091589
Gao B.-C. (1996). NDWI—a normalized difference water index for remote sensing of vegetation liquid water from space. Remote Sens. Environ. 58, 257–266. doi: 10.1016/S0034-4257(96)00067−3
Gao F., Kustas W. P., and Anderson M. C. (2012). A data mining approach for sharpening thermal satellite imagery over land. Remote Sens. 4, 3287–3319. doi: 10.3390/rs4113287
Gaona J., Quintana-Seguí P., Escorihuela M. J., Boone A., and Llasat M. C. (2022). Interactions between precipitation, evapotranspiration and soil-moisture-based indices to characterize drought with high-resolution remote sensing and land-surface model data. Nat. Hazards Earth Syst. Sci. 22, 3461–3485. doi: 10.5194/nhess-22-3461-2022
Ghazaryan G., Dubovyk O., Graw V., Kussul N., and Schellberg J. (2020). Local−scale agricultural drought monitoring with satellite−based multi−sensor time−series. GIScience Remote Sens. 57, 704–718. doi: 10.1080/15481603.2020.1778332
Girona J., Mata M., and Marsal J. (2005). Regulated deficit irrigation during the kernel-filling period and optimal irrigation rates in almond. Agric. Water Manage. 75, 152–167. doi: 10.1016/j.agwat.2004.12.008
Goldhamer D. A. and Fereres E. (2017). Establishing an almond water production function for California using long-term yield response to variable irrigation. Irrig. Sci. 35, 169–179. doi: 10.1007/s00271-016-0528-2
Green D. S., Erickson J. E., and Kruger E. L. (2003). Foliar morphology and canopy nitrogen as predictors of light-use efficiency in terrestrial vegetation. Agric. For. Meteorol. 115, 163–171. doi: 10.1016/S0168-1923(02)00210-1
Gu S. (2016). Growing degree hours - a simple, accurate, and precise protocol to approximate growing heat summation for grapevines. Int. J. Biometeorol. 60, 1123–1134. doi: 10.1007/s00484-015-1105-8
Guan K., Wu J., Kimball J. S., Anderson M. C., Frolking S., Li B., et al. (2017). The shared and unique values of optical, fluorescence, thermal and microwave satellite data for estimating large-scale crop yields. Remote Sens. Environ. 199, 333–349. doi: 10.1016/j.rse.2017.06.043
Guimarães N., Fraga H., Sousa J. J., Pádua L., Bento A., and Couto P. (2024). Comparative evaluation of remote sensing platforms for almond yield prediction. AgriEngineering 6, 240–258. doi: 10.3390/agriengineering6010015
Guzinski R. and Nieto H. (2019). Evaluating the feasibility of using Sentinel-2 and Sentinel-3 satellites for high-resolution evapotranspiration estimations. Remote Sens. Environ. 221, 157–172. doi: 10.1016/j.rse.2018.11.019
Guzinski R., Nieto H., Ramo Sánchez R., Sánchez J. M., Jomaa I., Zitouna-Chebbi R., et al. (2023). Improving field-scale crop actual evapotranspiration monitoring with Sentinel-3, Sentinel-2, and Landsat data fusion. Int. J. Appl. Earth Obs. Geoinf. 125, 103587. doi: 10.1016/j.jag.2023.103587
Guzinski R., Nieto H., Sanchez J. M., Lopez-Urrea R., Boujnah D. M., and Boulet G. (2021). Utility of copernicus-based inputs for actual evapotranspiration modeling in support of sustainable water use in agriculture. IEEE J. Sel. Top. Appl. Earth Obs. Remote Sens. 14, 11466–11484. doi: 10.1109/JSTARS.2021.3122573
Guzinski R., Nieto H., Sandholt I., and Karamitilios G. (2020). Modelling high-resolution actual evapotranspiration through Sentinel-2 and Sentinel-3 data fusion. Remote Sens 12, 11466–11484. doi: 10.3390/RS12091433
Haboudane D., Miller J. R., Pattey E., Zarco-Tejada P. J., and Strachan I. B. (2004). Hyperspectral vegetation indices and novel algorithms for predicting green LAI of crop canopies: Modeling and validation in the context of precision agriculture. Remote Sens. Environ. 90, 337–352. doi: 10.1016/j.rse.2003.12.013
Hodges T., Botner D., Sakamoto C., and Hays Haug J. (1987). Using the CERES-Maize model to estimate production for the U.S. Cornbelt. Agr For. Meteorol. 40, 293–303. doi: 10.1016/0168-1923(87)90043-8
Huete A., Didan K., Miura T., Rodriguez E. P., Gao X., and Ferreira L. G. (2002). Overview of the radiometric and biophysical performance of the MODIS vegetation indices. Remote Sens. Environ. 83, 195–213. doi: 10.1016/S0034-4257(02)00096-2
Jackson R. D., Hatfield J. L., Reginato R. J., Idso S. B., and Pinter P. J. (1983). Estimation of daily evapotranspiration from one time-of-day measurements. Agric. Water Manage. 7, 351–362. doi: 10.1016/0378-3774(83)90095-1
Jackson R. D. and Huete A. R. (1991). Interpreting vegetation indices. Prev. Vet. Med. 11, 185–200. doi: 10.1016/S0167-5877(05)80004-2
Jin Y., Chen B., Lampinen B. D., and Brown P. H. (2020). Advancing agricultural production with machine learning analytics: yield determinants for california’s almond orchards. Front. Plant Sci. 11. doi: 10.3389/fpls.2020.00290
Jofre-Čekalović C., Nieto H., Girona J., Pamies-Sans M., and Bellvert J. (2022). Accounting for almond crop water use under different irrigation regimes with a two-source energy balance model and Copernicus-based inputs. Remote Sens. 14, 2106. 10.3390/rs14092106
Kang Y. and Özdoğan M. (2019). Field-level crop yield mapping with Landsat using a hierarchical data assimilation approach. Remote Sens. Environ. 228, 144–163. doi: 10.1016/j.rse.2019.04.005
Keating B. A., Carberry P. S., Hammer G. L., Probert M. E., Robertson M. J., Holzworth D., et al. (2003). An overview of APSIM, a model designed for farming systems simulation. Eur. J. Agron. 18, 267–288. doi: 10.1016/S1161-0301(02)00108-9
Kendall A., Marvinney E., Brodt S., and Zhu W. (2015). Life cycle–based assessment of energy use and greenhouse gas emissions in almond production, Part I: Analytical framework and baseline results. J. Ind. Ecol. 19, 1008–1018. doi: 10.1111/jiec.12332
Knipper K., Anderson M., Bambach N., Melton F., Ellis Z., Yang Y., et al. (2024). A comparative analysis of OpenET for evaluating evapotranspiration in California almond orchards. Agric. For. Meteorol. 355, 110146. doi: 10.1016/j.agrformet.2024.110146
Knipper K. R., Kustas W. P., Anderson M. C., Alfieri J. G., Prueger J. H., Hain C. R., et al. (2019). Evapotranspiration estimates derived using thermal-based satellite remote sensing and data fusion for irrigation management in California vineyards. Irrig. Sci. 37, 431–449. doi: 10.1007/s00271-018-0591-y
Kumar S., Sohail M. A., Jadhav S., and Gupta R. K. (2024). Light gradient boosting machine for optimizing crop maintenance and yield prediction in agriculture. ICTACT J. Soft Computing 15, 3551–3555. doi: 10.21917/ijsc.2024.0495
Kustas W. P., Alfieri J. G., Nieto H., Wilson T. G., Gao F., and Anderson M. C. (2019). Utility of the two-source energy balance (TSEB) model in vine and interrow flux partitioning over the growing season. Irrig. Sci. 37, 375–388. doi: 10.1007/s00271-018-0586-8
Kustas W. P., Nieto H., Garcia-Tejera O., Bambach N., McElrone A. J., Gao F., et al. (2022). Impact of advection on two-source energy balance (TSEB) canopy transpiration parameterization for vineyards in the California Central Valley. Irrig. Sci. 40, 575–591. doi: 10.1007/s00271-022-00778-y
Kustas W. P. and Norman J. M. (1999). Evaluation of soil and vegetation heat flux predictions using a simple two-source model with radiometric temperatures for partial canopy cover. Agric. For. Meteorol. 94, 13–29. doi: 10.1016/S0168-1923(99)00005-2
Lagouarde J. P., Bhattacharya B. K., Crébassol P., Gamet P., Babu S. S., Boulet G., et al. (2018). The Indian-French Trishna mission: Earth observation in the thermal infrared with high spatio-temporal resolution. Int. Geosci. Remote Sens. Symp. Valencia, Spain, 4078–4081. doi: 10.1109/IGARSS.2018.8518720
Laluet P., Olivera-Guerra L. E., Altés V., Paolini G., Ouaadi N., Rivalland V., et al. (2024). Retrieving the irrigation actually applied at district scale: Assimilating high-resolution Sentinel-1-derived soil moisture data into a FAO-56-based model. Agric. Water Manag 293, 108704. doi: 10.1016/j.agwat.2024.108704
Lampinen B. D., Udompetaikul V., Browne G. T., Metcalf S. G., Stewart W. L., Contador L., et al. (2012). A mobile platform for measuring canopy photosynthetically active radiation interception in orchard systems. Horttechnology 22, 237–244. doi: 10.21273/horttech.22.2.237
Li Z., Jin X., Yang G., Drummond J., Yang H., Clark B., et al. (2018). Remote sensing of leaf and canopy nitrogen status in winter wheat (Triticum aestivum L.) based on N-PROSAIL model. Remote Sens. 10, 1463. doi: 10.3390/rs10091463
Li W., Jiang J., Guo T., Zhou M., Tang Y., Wang Y., et al. (2019a). Generating rededge images at 3M spatial resolution by fusing sentinel-2 and planet satellite products. Remote Sens. 11, 1–18. doi: 10.3390/rs11121422
Li Y., Kustas W. P., Huang C., Nieto H., Haghighi E., Anderson M. C., et al. (2019b). Evaluating soil resistance formulations in thermal-based two-source energy balance (TSEB) model: implications for heterogeneous semiarid and arid regions. Water Resour. Res. 55, 1059–1078. doi: 10.1029/2018WR022981
Li Y., Zeng H., Zhang M., Wu B., Zhao Y., Yao X., et al. (2023). A county-level soybean yield prediction framework coupled with XGBoost and multidimensional feature engineering. Int. J. Appl. Earth Obs. Geoinf. 118, 103269. doi: 10.1016/j.jag.2023.103269
López-López M., Espadador M., Testi L., Lorite I. J., Orgaz F., and Fereres E. (2018). Water use of irrigated almond trees when subjected to water deficits. Agric. Water Manage. 195, 84–93. doi: 10.1016/j.agwat.2017.10.001
Luedeling E. and Brown P. H. (2011). A global analysis of the comparability of winter chill models for fruit and nut trees. Int. J. Biometeorol. 55, 411–421. doi: 10.1007/s00484-010-0352-y
Lyons M. B., Keith D. A., Phinn S. R., Mason T. J., and Elith J. (2018). A comparison of resampling methods for remote sensing classification and accuracy assessment. Remote Sens. Environ. 208, 145–153. doi: 10.1016/j.rse.2018.02.026
Ma Y., Zhang Z., Kang Y., and Özdoğan M. (2021). Corn yield prediction and uncertainty analysis based on remotely sensed variables using a Bayesian neural network approach. Remote Sens. Environ. 259. doi: 10.1016/j.rse.2021.112408
MAPA (2023). Encuesta sobre Superficies y Rendimientos Cultivos (ESYRCE) (Encuesta de marco de áreas de España). Available online at: https://www.mapa.gob.es/es/estadistica/temas/estadisticas-agrarias/agricultura/esyrce/default.aspx (Accessed November 11, 2024).
Marsal J., Johnson S., Casadesus J., Lopez G., Girona J., and Stöckle C. (2014). Fraction of canopy intercepted radiation relates differently with crop coefficient depending on the season and the fruit tree species. Agric. For. Meteorol. 184, 1–11. doi: 10.1016/j.agrformet.2013.08.008
McFeeters S. K. (1996). The use of the normalized difference water index (NDWI) in the delineation of open water features. Int. J. Remote Sens. 17, 1425–1432. doi: 10.1080/01431169608948714
Meitner J., Balek J., Bláhová M., Semerádová D., Hlavinka P., Lukas V., et al. (2023). Estimating drought-induced crop yield losses at the cadastral area level in the Czech Republic. Agronomy 13, 1–21. doi: 10.3390/agronomy13071669
Miao L., Zou Y., Cui X., Kattel G. R., Shang Y., and Zhu J. (2024). Predicting China’s maize yield using multi-source datasets and machine learning algorithms. Remote Sens 16, 2417. doi: 10.3390/rs16132417
Mirás-Avalos J. M., Gonzalez-Dugo V., García-Tejero I. F., López-Urrea R., Intrigliolo D. S., and Egea G. (2023). Quantitative analysis of almond yield response to irrigation regimes in Mediterranean Spain. Agric. Water Manag 279, 108208. doi: 10.1016/j.agwat.2023.108208
Moldero D., López-Bernal Á., Testi L., Lorite I. J., Fereres E., and Orgaz F. (2021). Long-term almond yield response to deficit irrigation. Irrig. Sci. 39, 409–420. doi: 10.1007/s00271-021-00720-8
Moldero D., López-Bernal Á., Testi L., Lorite I. J., Fereres E., and Orgaz F. (2022). Almond responses to a single season of severe irrigation water restrictions. Irrig. Sci. 40, 1–11. doi: 10.1007/s00271-021-00750-2
Montoya F., Sánchez J. M., González-Piqueras J., and López-Urrea R. (2022). Is the subsurface drip the most sustainable irrigation system for almond orchards in water-Scarce areas? Agronomy 12, 1778. doi: 10.3390/agronomy12081778
Nieto Héctor, Guzinski R., Jonas P. G., Mike C., and gabrielmini (2023). hectornieto/pyTSEB: v2.2 (v.2.2). Zenodo [code]. doi: 10.5281/zenodo.8134956
Norman J. M., Kustas W. P., and Humes K. S. (1995). Source approach for estimating soil and vegetation energy fluxes in observations of directional radiometric surface temperature. Agric. For. Meteorol. 77, 263–293. doi: 10.1016/0168-1923(95)02265-Y
Olivera-Guerra L. E., Laluet P., Altés V., Ollivier C., Pageot Y., Paolini G., et al. (2023). Modeling actual water use under different irrigation regimes at district scale: Application to the FAO-56 dual crop coefficient method. Agric. Water Manage. 278, 108119. doi: 10.1016/j.agwat.2022.108119
Olivo N., Girona J., and Marsal J. (2009). Seasonal sensitivity of stem water potential to vapour pressure deficit in grapevine. Irrig. Sci. 27, 175–182. doi: 10.1007/s00271-008-0134-z
Pasqualotto N., Delegido J., Van Wittenberghe S., Rinaldi M., and Moreno J. (2019). Multi-crop green LAI estimation with a new simple sentinel-2 LAI index (SeLI). Sensors (Switzerland) 19, 904. doi: 10.3390/s19040904
Qi J., Chehbouni A., Huete A. R., Kerr Y. H., and Sorooshian S. (1994). A modified soil adjusted vegetation index. Remote Sens. Environ. 48, 119–126. doi: 10.1016/0034-4257(94)90134-1
Quintanilla-Albornoz M., Bellvert J., Pelechá A., and Miarnau X. (2024). Agronomic response, transpiration and water productivity of four almond production systems under different irrigation regimes. Sci. Hortic. (Amsterdam) 334, 113335. doi: 10.1016/j.scienta.2024.113335
Quintanilla-Albornoz M., Miarnau X., Pelechá A., Casadesús J., García-Tejera O., and Bellvert J. (2025). Evaluation of transpiration in different almond production systems with two-source energy balance models from UAV thermal and multispectral imagery. Irrig. Sci. 43, 29–49. doi: 10.1007/s00271-023-00888-1
Reig G., Iglesias I., Zazurca L., Torguet L., Martinez G., and Miarnau X. (2022). Physiological and Agronomical Responses of ‘Vairo’ Almond and ‘Big Top’ Nectarine Cultivars Grafted onto Different Prunus Rootstocks and Grown under Semiarid Mediterranean Conditions. Agronomy 12, 821. doi: 10.3390/agronomy12040821
Rußwurm M. and Körner M. (2020). Self-attention for raw optical Satellite Time Series Classification. ISPRS J. Photogramm. Remote Sens. 169, 421–435. doi: 10.1016/j.isprsjprs.2020.06.006
Ruppert D. (2004). The elements of statistical learning: data mining, inference, and prediction. J. Am. Stat. Assoc. 99, 567–567. doi: 10.1198/jasa.2004.s339
Sadeh Y., Zhu X., Dunkerley D., Walker J. P., Zhang Y., Rozenstein O., et al. (2021). Fusion of Sentinel-2 and PlanetScope time-series data into daily 3 m surface reflectance and wheat LAI monitoring. Int. J. Appl. Earth Obs. Geoinf. 96, 102260. doi: 10.1016/j.jag.2020.102260
Sakamoto T., Gitelson A. A., and Arkebauer T. J. (2013). MODIS-based corn grain yield estimation model incorporating crop phenology information. Remote Sens. Environ. 131, 215–231. doi: 10.1016/j.rse.2012.12.017
Sanchez J. M., Galve J. M., Nieto H., and Guzinski R. (2024). Assessment of high-resolution LST derived from the synergy of sentinel-2 and sentinel-3 in agricultural areas. IEEE J. Sel. Top. Appl. Earth Obs. Remote Sens. 17, 916–928. doi: 10.1109/JSTARS.2023.3335896
Sánchez-Virosta A., Sánchez J. M., Montoya F., Gómez-Candón D., González-Piqueras J., Molina-Medina A. J., et al. (2025). Assessment of different remote sensing techniques to estimate the CWSI of almond trees using canopy temperature. Int. J. Appl. Earth Observation Geoinformation 142, 104737. doi: 10.1016/j.jag.2025.104737
Santos J. A., Costa R., and Fraga H. (2017). Climate change impacts on thermal growing conditions of main fruit species in Portugal. Clim. Change 140, 273–286. doi: 10.1007/s10584-016-1835-6
Shuttleworth W. J. and Wallace J. S. (1985). Evaporation from sparse crops-an energy combination theory. Q. J. R. Meteorol. Soc 111, 839–855. doi: 10.1002/qj.49711146510
Sperling O., Gardi I., Ben-Gal A., and Kamai T. (2023). Deficit irrigation limits almond trees’ photosynthetic productivity and compromises yields. Agric. Water Manage. 289, 108562. doi: 10.1016/j.agwat.2023.108562
Stavros E. N., Chrone J., Cawse-Nicholson K., Freeman A., Glenn N. F., Guild L., et al. (2023). Designing an observing system to study the surface biology and geology (SBG) of the earth in the 2020s. J. Geophys. Res. Biogeosciences 128, 1–18. doi: 10.1029/2021JG006471
Steduto P., Hsiao T.C., Fereres E., and Raes D. (2012). Crop yield response to water (FAO Irrigation and drainage paper 66). Rome: FAO. Available online at: https://www.fao.org/4/i2800e/i2800e00.htm.
Suarez L. A., Robson A., and Brinkhoff J. (2023). Early-Season forecasting of citrus block-yield using time series remote sensing and machine learning: A case study in Australian orchards. Int. J. Appl. Earth Obs. Geoinf. 122, 103434. doi: 10.1016/j.jag.2023.103434
Tang M., Sadowski D. L., Peng C., Vougioukas S. G., Klever B., Khalsa S. D. S., et al. (2023). Tree-level almond yield estimation from high resolution aerial imagery with convolutional neural network. Front. Plant Sci. 14. doi: 10.3389/fpls.2023.1070699
Thorp K. R. and Drajat D. (2021). Deep machine learning with Sentinel satellite data to map paddy rice production stages across West Java, Indonesia. Remote Sens. Environ. 265, 112679. doi: 10.1016/j.rse.2021.112679
Torgbor B. A., Rahman M. M., Brinkhoff J., Sinha P., and Robson A. (2023). Integrating remote sensing and weather variables for mango yield prediction using a machine learning approach. Remote Sens 15, 3075. doi: 10.3390/rs15123075
Tramblay Y., Koutroulis A., Samaniego L., Vicente-Serrano S. M., Volaire F., Boone A., et al. (2020). Challenges for drought assessment in the Mediterranean region under future climate scenarios. Earth-Science Rev. 210, 103348. doi: 10.1016/j.earscirev.2020.103348
USDA Foreign Agricultural Service (n.d.). Production–Almond. USDA Foreign Agricultural Service. Available online at: https://www.fas.usda.gov/data/production/commodity/0577400 (Accessed September 12, 2024).
Wang X., Lei H., Li J., Huo Z., Zhang Y., and Qu Y. (2023). Estimating evapotranspiration and yield of wheat and maize croplands through a remote sensing-based model. Agric. Water Manage. 282, 108294. doi: 10.1016/j.agwat.2023.108294
Weiss M. and Baret F. (2016). S2ToolBox level 2 products: LAI, FAPAR, FCOVER – version 1.1. Sentin. Toolbox Level2 Prod., 53.
Weiss M., Baret F., Myneni R. B., Pragnère A., and Knyazikhin Y. (2000). Investigation of a model inversion technique to estimate canopy biophysical variables from spectral and directional reflectance data. Agronomie 20, 3–22. doi: 10.1051/agro:2000105
Wu Z., Snyder G., Vadnais C., Arora R., Babcock M., Stensaas G., et al. (2019). User needs for future Landsat missions. Remote Sens. Environ. 231, 111214. doi: 10.1016/j.rse.2019.111214
Xu J., Zhu Y., Zhong R., Lin Z., Jiang H., Huang J., et al. (2020). DeepCropMapping: A multi-temporal deep learning approach with improved spatial generalizability for dynamic corn and soybean mapping. Remote Sens. Environ. 247, 111946. doi: 10.1016/j.rse.2020.111946
Zarate-Valdez J. L., Muhammad S., Saa S., Lampinen B. D., and Brown P. H. (2015). Light interception, leaf nitrogen and yield prediction in almonds: A case study. Eur. J. Agron. 66, 1–7. doi: 10.1016/j.eja.2015.02.004
Keywords: almond yield, remote sensing, evapotranspiration, TSEB, machine learning
Citation: Quintanilla-Albornoz M, Miarnau X, Pamies-Sans M and Bellvert J (2025) Almond yield prediction at orchard scale using satellite-derived biophysical traits and crop evapotranspiration combined with machine learning. Front. Agron. 7:1667674. doi: 10.3389/fagro.2025.1667674
Received: 16 July 2025; Accepted: 27 October 2025;
Published: 20 November 2025.
Edited by:
Pratap Bhattacharyya, ICAR-NRRI, IndiaReviewed by:
Krishan K. Verma, Guangxi Academy of Agricultural Sciences, ChinaÁlvaro Sánchez Virosta, University of Castilla-La Mancha, Spain
Copyright © 2025 Quintanilla-Albornoz, Miarnau, Pamies-Sans and Bellvert. This is an open-access article distributed under the terms of the Creative Commons Attribution License (CC BY). The use, distribution or reproduction in other forums is permitted, provided the original author(s) and the copyright owner(s) are credited and that the original publication in this journal is cited, in accordance with accepted academic practice. No use, distribution or reproduction is permitted which does not comply with these terms.
*Correspondence: Manuel Quintanilla-Albornoz, bWFudWVsLnF1aW50YW5pbGxhQGlydGEuY2F0
†Present address: Manuel Quintanilla-Albornoz, Parc Agrobiotech Lleida, Parc de Gardeny, Edifici Fruitcentre, Lleida, Catalonia, Spain