 Liming Chen
 Jiahong Ao
- Jingdezhen University, Jingdezhen, China
Introduction: Biochar regulates rice growth and development as well as improves soil quality, and shows application potential for early rice seedling cultivation in double-cropping rice systems in South China.
Methods: This study applied biochar at rates of 0%, 10%, 20%, 30%, 40%, and 50% of total nursery soil volume to systematically evaluate its impacts on early rice seedling agronomic traits, root architecture, nutrient uptake, and soil physicochemical properties.
Results and Discussion: The results demonstrate that that the biochar application rate had a significant dose-dependent effect on rice seedling growth indicators. The 30% treatment showed the best overall performance, with seedling leaf length (increased by 42.1% compared to the 0% treatment), plant height, dry matter accumulation, SPAD value, and leaf area (increased by 54.6%) all being significantly higher than those in other treatments. Concurrently, this treatment achieved the highest values for root length (increased by 18.6%), root volume, and number of root tips, along with a significant 58.8% increase in potassium content within the root zone. The 20% and 30% treatments significantly promoted stem base width (increased by 12.7%–18.0%) and the strong seedling index (increased by 84.6%). Conversely, the 40% and 50% treatments had inhibitory effects, resulting in significant reductions in seedling leaf length, stem base width (decreased by 24.9%), dry weight, and leaf area. Root fresh weight also decreased by 11.9%–17.1%. Biochar application significantly enhanced substrate water-holding capacity, reduced bulk density, and increased total porosity (by 23.0%) and organic matter content. Notably, the 40% and 50% treatments caused a dramatic increase in available potassium levels within the substrate (increasing by 29.7 times), accompanied by abnormally significant elevations in pH and EC. Correlation analysis further revealed that the strong seedling index was highly significantly positively correlated with leaf area and seedling sturdiness, while being highly significantly negatively correlated with the root-shoot ratio. In conclusion, a 30% biochar application rate was identified as the optimal dosage, synergistically enhancing early rice seedling morphological development, root system growth, and the soil microenvironment.
1 Introduction
Rice (Oryza sativa L.) serves as the staple food crop for over half of the global population, with seedling vigor constituting a critical foundation for population establishment post-transplanting and ultimate yield (Feng et al., 2024; He et al., 2023). However, the seedling nursery for early-season rice in southern China frequently encounters multiple stresses, including low temperature, insufficient sunlight, soil acidification, and nutrient imbalance. Concurrently, conventional nursery substrates commonly suffer from structural degradation and exhibit weak water- and nutrient-retention capacities, severely constraining the cultivation of high-quality seedlings (Huang et al., 2016). Biochar demonstrates significant potential for enhancing soil physicochemical properties and promoting crop growth owing to its well-developed pore structure, alkaline nature, and pronounced capacity for nutrient adsorption and slow release (Alkharabsheh et al., 2021; Khan et al., 2024). Particularly during the seedling nursery stage, biochar is recognized for optimizing the rhizosphere microenvironment through improvements in water retention, aeration, nutrient availability, and pH—thereby promoting seedling morphological development and physiological metabolism (Sui et al., 2024; Sun et al., 2024). This offers a novel approach for addressing the aforementioned nursery constraints.
Research on biochar application in crop production has been extensively conducted in recent years (Blanco-Canqui, 2017). Substantial evidence indicates that biochar effectively improves soil physical structure by enhancing water-holding capacity and reducing bulk density (Razzaghi et al., 2020; Acharya et al., 2024). Furthermore, its surface functional groups enhance nutrient adsorption and retention capabilities, reducing the leaching of nutrients such as nitrogen and phosphorus (Haider et al., 2016). At the crop physiological level, biochar amendment has been shown to significantly promote root development in tomato and increase chlorophyll content in maize leaves by modulating soil pH (Guo et al., 2021; Wan et al., 2023; Cong et al., 2023). Nevertheless, existing research predominantly focuses on the performance of field crops during their growth stages, with systematic investigations specifically targeting the critical early phase of rice seedling nursery being notably deficient (Gu et al., 2022; Ali et al., 2025; Khan et al., 2024). There is a pronounced scarcity of systematic, quantitative research examining the effects of biochar application rates on seedling growth and development, dynamic nutrient uptake, and their interaction mechanisms with the rhizosphere soil environment. Notably, excessive biochar may inhibit seed germination or seedling growth through physical obstruction, excessive adsorption, or alterations in the rhizosphere microenvironment, and these effects exhibit significant crop species- and system-specificity (Ali et al., 2021). This underscores the critical importance and urgency of precisely quantifying the dose-response relationship of biochar, identifying its optimal application threshold for promoting seedling growth, and elucidating the underlying mechanisms within the specific context of the early-season rice nursery system.
Therefore, to overcome the constraints in early-season rice seedling nursery in southern China, optimize the nursery technology system, and deepen the understanding of biochar’s role in early crop development, this study focuses on the early-season rice nursery system. Employing treatments with varying biochar application gradients, this study systematically investigates the comprehensive effects of biochar amendment rates on seedling growth and development, as well as the physicochemical properties of the nursery substrate. The specific research objectives are: (1) To quantify the dose-response relationship of biochar application rates on key morphological and physiological traits of early-season rice seedlings; (2) To elucidate the coupling mechanisms between biochar-mediated improvements in the physical structure of the nursery substrate and enhanced nutrient availability, and their synergistic regulatory effects on seedling growth; (3) To quantify the interactive feedback relationships between seedling nutrient uptake and critical soil environmental factors.
2 Materials and methods
2.1 Nursery soil preparation
The nursery substrate soil was collected from the plow layer of a conventional paddy field in Jingdezhen City, Jiangxi Province, China. After natural air-drying, the soil was ground and passed through a 2-mm mesh sieve. Baseline soil nutrient contents were as follows: pH 6.75, organic matter 18.75 g·kg-1, total nitrogen 2.17 g·kg-1, total phosphorus 0.889 g·kg-1, total potassium 13.94 g·kg-1, available phosphorus 35.82 mg·kg-1, available potassium 200 mg·kg-1, and alkali-hydrolyzable nitrogen 17.93 mg·kg-1.
2.2 Biochar production and characterization
Rice straw-derived biochar was produced via anaerobic pyrolysis in a muffle furnace. The pyrolysis program was set to heat at 20 °C min-1 to 500 °C, followed by a 2-h holding period at the target temperature. The resulting biochar was ground and sieved through a 0.25-mm mesh. Its fundamental properties were: pH 8.85, total nitrogen 4.14 g·kg-1, total phosphorus 3.12 g·kg-1, total potassium 295.57 g·kg-1, available phosphorus 350.66 mg·kg-1, and available potassium 500.00 mg·kg-1.
2.3 Experimental design
Six biochar application rates (based on biochar v/soil v) were established: 0%, 10%, 20%, 30%, 40%, and 50%. Each treatment was replicated three times using eighteen rigid plastic nursery trays (24.5 × 17.0 × 7.5 cm). Biochar and nursery soil were thoroughly homogenized at predetermined volumetric ratios to prepare composite substrates. Deionized water was added to adjust the moisture content to 70% field capacity, followed by 24-h equilibration period.
The conditioned substrates were uniformly packed into nursery trays (GZX-III, Shanghai CIMO Medical Instrument Manufacturing Co., Ltd.). Uniformly germinated seeds of early-season rice (Oryza sativa L. cv. Xiangzaoxian 45) at the radicle emergence stage were hand-sown at a rate of 15 g per tray. Trays were transferred to an intelligent growth chamber programmed to simulate local early-rice nursery conditions (March-April): average daily temperature 23.5–25.0 °C, relative humidity 70–80%, with dynamically regulated photosynthetic photon flux density (800–1200 μmol m-2 s-1) and photoperiod (12-h light/12-h dark) to maintain natural seedling biorhythms. Substrate moisture was maintained at 70% field capacity by replenishing deionized water every three days based on gravimetric measurements. Representative photographs of the nursery trays and seedlings from different treatments are provided in Supplementary Figures S1, S2.
2.4 Measurements
2.4.1 Seedling growth parameters
Thirty days after the seedling emergence stage, one hundred representative seedlings per tray were randomly selected for parameter measurements. Leaf area of rice seedlings was measured using a handheld laser leaf area meter (CI-203; CID Bio-Science, Inc., Camas, WA, USA). The SPAD value was measured at the midpoint of the youngest fully expanded leaf using a SPAD-502 chlorophyll meter (Konica Minolta, Japan). Morphological parameters, including plant height, maximum leaf length, stem base width, and maximum leaf width, were measured using a ruler. Subsequently, one hundred randomly selected seedlings per tray were carefully washed to remove soil, after which roots were separated from shoots. The fresh weights of the roots and shoots from these one hundred seedlings were recorded separately, enabling calculation of the root-to-shoot ratio based on fresh weight. Seedling sturdiness was defined as the ratio of shoot dry weight to seedling height. The strong seedling index was calculated as the ratio of stem base width to seedling sturdiness.
Intact root samples from these seedlings were washed with deionized water, scanned using a root scanner (Epson Expression 1680 Scanner, Seiko Epson Corp, Tokyo, Japan), and analyzed with the accompanying software (Regent Instruments Inc., Quebec, Canada) to determine morphological parameters for hundred seedlings. Finally, plant samples were dried, ground, and analyzed for carbon (C), nitrogen (N), phosphorus (P), and potassium (K) concentrations.
2.4.2 Physicochemical properties of composite substrates
Substrate physical properties were assessed using intact core samples collected with the core method to determine bulk density, total porosity, capillary porosity, and non-capillary porosity. Gravimetric water content was determined by oven-drying at 105 °C for 24 hours. For chemical analyses, substrates were extracted at a 2.5:1 water-to-solid ratio; the supernatant pH and electrical conductivity (EC) were measured using a precision pH meter and EC meter, respectively. Organic matter content was determined by the potassium dichromate volumetric method. Total nitrogen (TN) was analyzed by the Kjeldahl method, total phosphorus (TP) by the molybdenum-antimony ascorbic acid colorimetric method, and total potassium (TK) by flame photometry. Available phosphorus (AP) was extracted with sodium bicarbonate and quantified by the molybdenum-antimony ascorbic acid colorimetric method; available potassium (AK) was extracted with ammonium acetate and measured by flame photometry; alkali-hydrolyzable nitrogen (AN) was determined by the alkali diffusion method.
2.5 Statistical analysis
One-way analysis of variance (ANOVA) was performed to determine the significant effects of different biochar amendment treatments on seedling growth parameters and substrate physicochemical properties. All statistical analyses were conducted using SPSS 27.0 software (SPSS Inc. Chicago, USA).
3 Results
3.1 Rice seedling growth
The application rate of biochar exhibits a significant dose-effect relationship on rice seedling quality (Table 1). Seedlings treated with 30% biochar demonstrated a significantly greater leaf length compared to all other treatments, representing a 42.1% increase over the 0% application rate. No significant differences in leaf length were observed among the 0%, 10%, and 20% treatments, while the 40% and 50% treatments yielded the significantly lowest values. Leaf width was significantly greater within the 10%, 20%, and 30% application range than in the 0% treatment. However, leaf widths for the 40% and 50% treatments did not differ significantly from the 0% treatment. Stem base width was significantly greater under the 10%, 20%, and 30% application rates compared to the 0% treatment, showing increases of 12.7%, 13.2%, and 18.0%, respectively. Conversely, the 40% and 50% treatments resulted in a significant reduction in stem base width, with the 50% treatment exhibiting the lowest value—a significant 24.9% decrease relative to the 0% treatment. Seedling height reached its maximum at the 30% application rate, significantly exceeding that of the 0% and 40% treatments. While no significant difference in height existed between the 20% and 30% treatments, the 20% treatment was significantly taller than the 40% treatment. Dry weight per 100 plants exhibited an initial increase followed by a decrease with increasing biochar application. It peaked significantly at the 30% rate compared to the 0% and 50% rates. Dry weights for the 10% and 20% treatments were significantly higher than the 0% treatment, while no significant difference was found between the 40% and 10% treatments. The root-shoot ratio demonstrated a continuous decreasing trend with increasing application rate. The 0% treatment resulted in a significantly higher ratio than the 30% treatment, and all biochar treatments yielded ratios significantly lower than the 0% treatment. SPAD values reached their maximum at the 30% application rate, significantly exceeding those of the 0%, 40%, and 50% treatment. No significant difference was observed between the 20% and 30% treatment, although the 20% treatment was significantly higher than the 0% treatment. SPAD values for the 40% treatment did not differ significantly from the 0% treatment, while the 50% treatment caused a significant reduction.
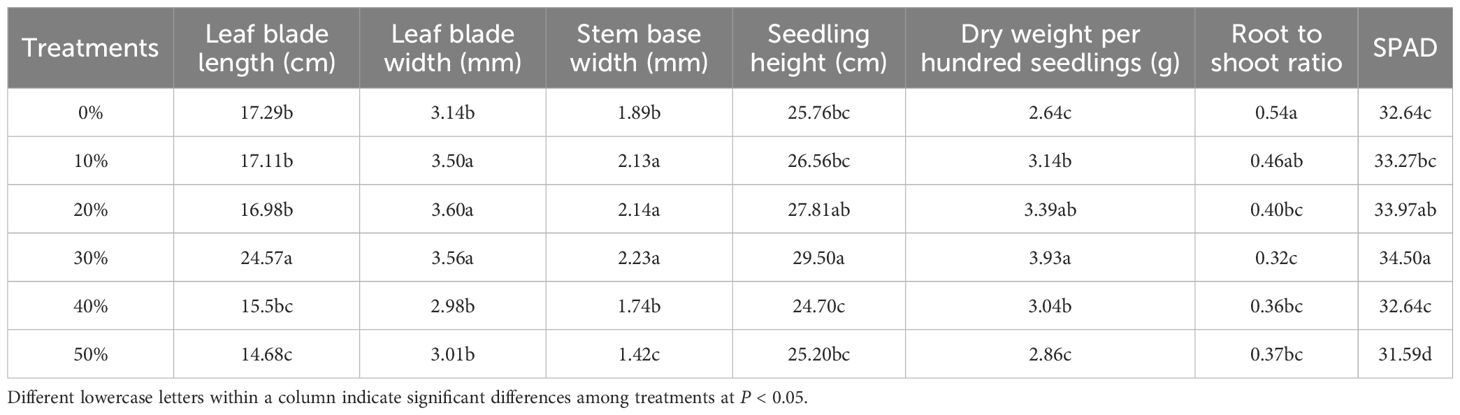
Table 1. Effects of biochar application rates on rice seedling quality.
3.2 Root morphological characteristics
Biochar application rate significantly influenced rice seedling root development (Table 2). Root length peaked in the 30% treatment group, demonstrating a significant increase of 18.6% compared to the 0% treatment, and was significantly greater than all other treatments. Conversely, the 10% and 50% treatments significantly inhibited root elongation, resulting in significantly shorter roots than the 0% treatment. The 0%, 30%, and 40% treatments maintained significantly higher root surface area and projected area than the 10%, 20%, and 50% treatments, which exhibited significant reductions. No significant differences in average root diameter were detected among the treatments, except that the 40% treatment was significantly smaller than the 10% treatment. The 30% treatment yielded the optimal values for root volume and number of root tips. While these parameters showed no significant difference from the 0% treatment, they were significantly higher than those observed in the 20%, 40%, and 50% treatments. Notably, despite having relatively high root length, the 20% treatment exhibited significantly lower root volume and number of root tips. Fresh root weight reached its maximum in the 20% and 30% treatments, showing a marginal increase compared to the 0% treatment. In contrast, the 40% and 50% treatments resulted in significant reductions of 17.1% and 11.9%, respectively.
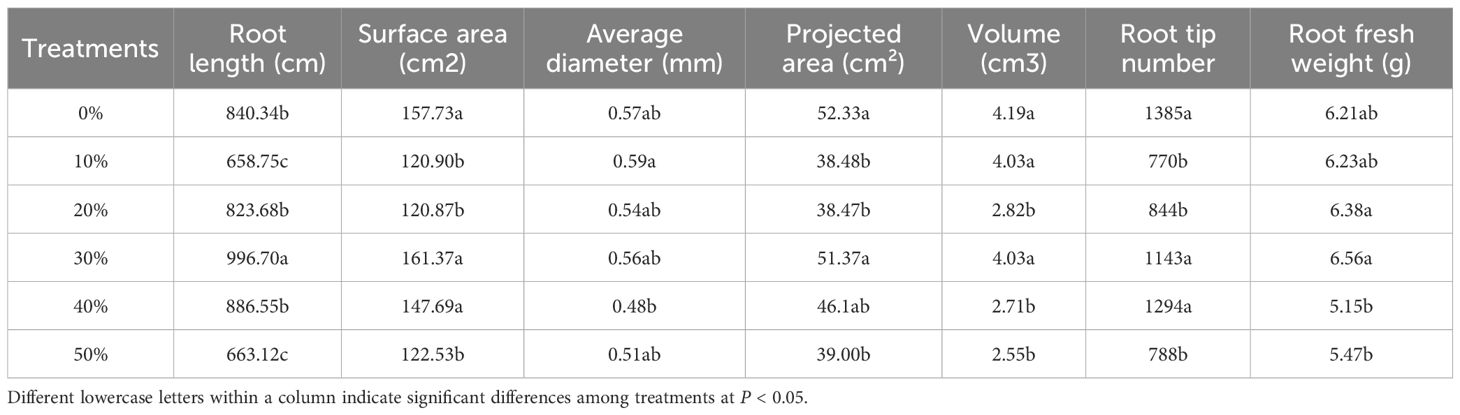
Table 2. Effects of biochar application rates on root growth per hundred rice seedlings.
3.3 Nutrient content
In above-ground, N content demonstrated a significant declining trend with increasing biochar application (Table 3). The 0% treatment exhibited the highest N content, while the 40% and 50% treatments showed the lowest levels, representing a significant reduction of 22% compared to the 0% treatment. P content showed no significant differences among most treatments. However, the 50% treatment resulted in significantly lower P content than both the 0% and 20% treatments. K content was significantly elevated in the 10% and 50% treatments, showing increases of 8.9% and 9.7%, respectively, relative to the 0% treatment. Carbon content was highest in the 0% treatment. The 20% treatment yielded significantly lower C content than the 0% treatment, while the remaining treatments showed no significant differences. In roots, N content was maintained at relatively high levels across all treatments, except for the 40% application rate, which resulted in a significant decrease. P content peaked significantly in the 50% treatment compared to all other treatments. No significant differences in P content were observed among the other application rates. K content exhibited an initial increase followed by a decrease with increasing biochar application. The 30% treatment yielded significantly higher K content than all other treatments, representing a significant 58.8% increase relative the 0% treatment. Carbon content was significantly highest in the 40% treatment, showing a significant increase of 24.6% compared to the 0% treatment. Conversely, the 10% and 20% treatments resulted in significantly lower C content than the 0% treatment.

Table 3. Effects of biochar application rates on nutrient content in rice seedlings.
3.4 Physical properties of seedling soil
Biochar application significantly influenced the physical properties of rice seedling growth media (Table 4). Substrate moisture content increased progressively with increasing biochar application. The 50% treatment reached the highest moisture content, representing a significant 54.0% increase compared to the 0% treatment. Moisture levels in the 40% and 50% treatments were significantly higher than those in the 10%, 20%, and 30% treatments. Bulk density was significantly reduced in all biochar-amended treatments. The highest bulk density was observed in the 0% treatment, while the lowest occurred in the 50% treatment, reflecting a significant 31.7% reduction. Total porosity exhibited a continuous increasing trend with higher biochar application. The 50% treatment yielded the significantly highest total porosity, showing a significant 23.0% increase over the 0% treatment. Furthermore, the 40% and 50% treatments demonstrated significantly greater total porosity than all other treatments. Capillary porosity was significantly highest in the 40% treatment, exceeding that of the 0% treatment. However, the 50% treatment showed significantly lower capillary porosity than the 40% treatment. Non-capillary porosity exhibited a substantial increase in the 50% treatment, which represented a significant 99.9% increase relative to the 0% treatment. Furthermore, all treatments with ≥20% biochar application resulted in significantly higher non-capillary porosity than the 0% treatment.
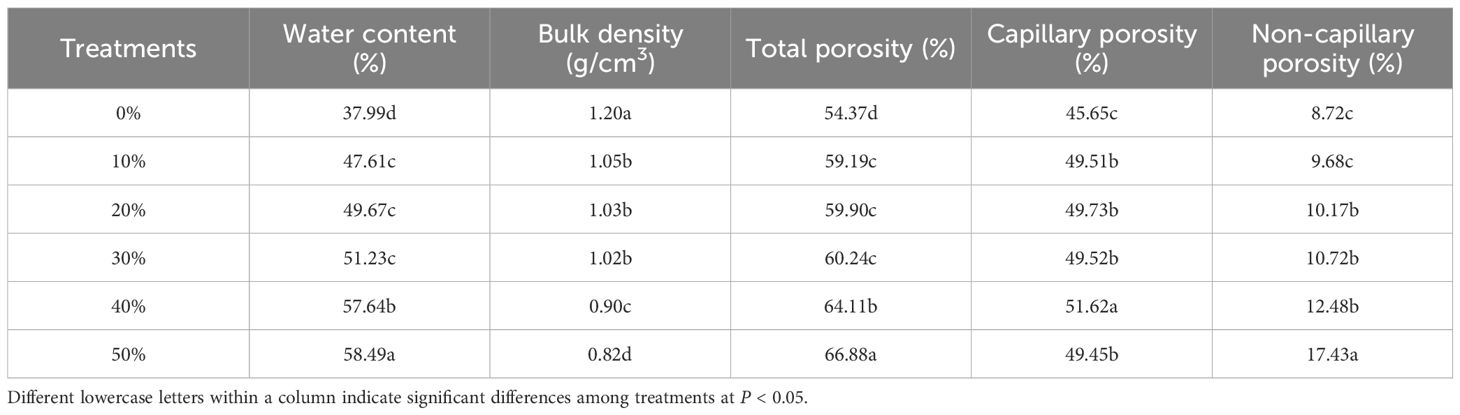
Table 4. Effect of biochar application rates on physical properties of seedling soil.
3.5 Physiochemical properties of seedling soil
Biochar application significantly altered the soil chemical properties of the soil (Table 5). Soil organic matter content exhibited a significant increasing trend with higher biochar application rates. The 0% treatment yielded the lowest soil organic matter content, while the 50% treatment resulted in the significantly highest level, representing a substantial increase of 530.4% compared to the 0% treatment. Total N content was significantly highest in the 40% and 50% treatments. However, no significant differences were observed among the 10%, 20%, 30%, and 0% treatments. The C/N Ratio increased significantly with increasing biochar application. The C/N ratio in the 50% treatment was 375.3% higher than that of the 0% treatment. Total P content showed no significant differences among the treatments. Available P content increased significantly with higher biochar application rates. The 50% treatment resulted in a significant 95.1% increase compared to the 0% treatment. Total K content was significantly elevated in all biochar treatments. The highest total K content occurred in the 50% treatment, reflecting a significant increase of 32.9%. Available K content responded highly significantly to biochar application. The 50% treatment yielded available K levels that were 29.7 times higher than those of the 0% treatment. Alkali-hydrolyzable N content was significantly higher in the 10% treatment than in all other treatments, showing a 92.6% increase over the 0% treatment. Soil pH was significantly elevated only in the 40% and 50% treatments. The 40% treatment exhibited a significantly higher EC value than all other treatments. The lowest EC occurred in the 0% treatment. The EC value in the 50% treatment was significantly lower than that in the 40% treatment.
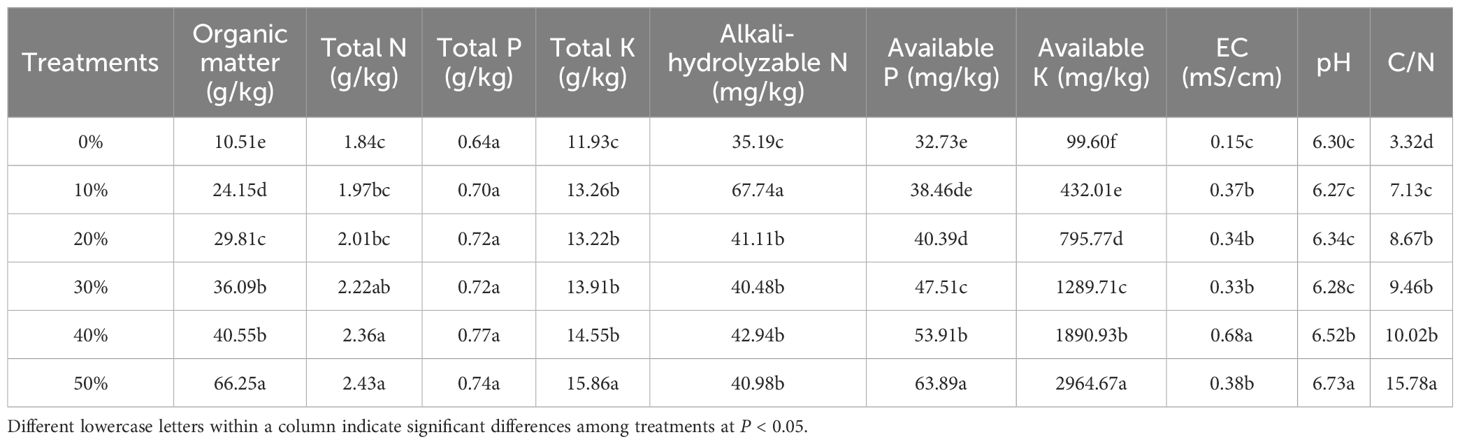
Table 5. Effect of biochar application rates on physiochemical properties of the seedling soil.
3.6 Leaf area, seedling sturdiness, and strong seedling index
The 30% treatment resulted in significantly greater leaf area compared to all other treatments, representing a significant 54.6% increase over the 0% treatment (Figure 1A). No significant differences in leaf area were observed among the 0%, 10%, and 20% treatments. Conversely, leaf area was significantly reduced in the 40% and 50% treatments, showing decreases of 52.3% and 54.9%, respectively, relative to the 30% treatment. Furthermore, leaf area in the 40% and 50% treatments was significantly lower than in the 0% treatment. Seedling sturdiness was significantly lowest in the 0% treatment (Figure 1B). The highest sturdiness was observed in the 30% treatment, reflecting a significant 58.8% increase compared to the 0% treatment. While no significant differences in sturdiness were found among the 10%, 20%, 40%, and 50% treatments, all these biochar-amended treatments yielded significantly higher sturdiness than the 0% treatment. The strong seedling index was significantly highest in the 30% treatment compared to all other application rates, demonstrating a significant 84.6% increase relative to the 0% treatment (Figure 1C). The lowest strong seedling indices were observed in the 0% and 50% treatments. No significant differences were detected in the strong seedling index among the 10%, 20%, and 40% treatments. However, the index for the 40% treatment was significantly lower than that of the 30% treatment, representing a 33.3% decrease.
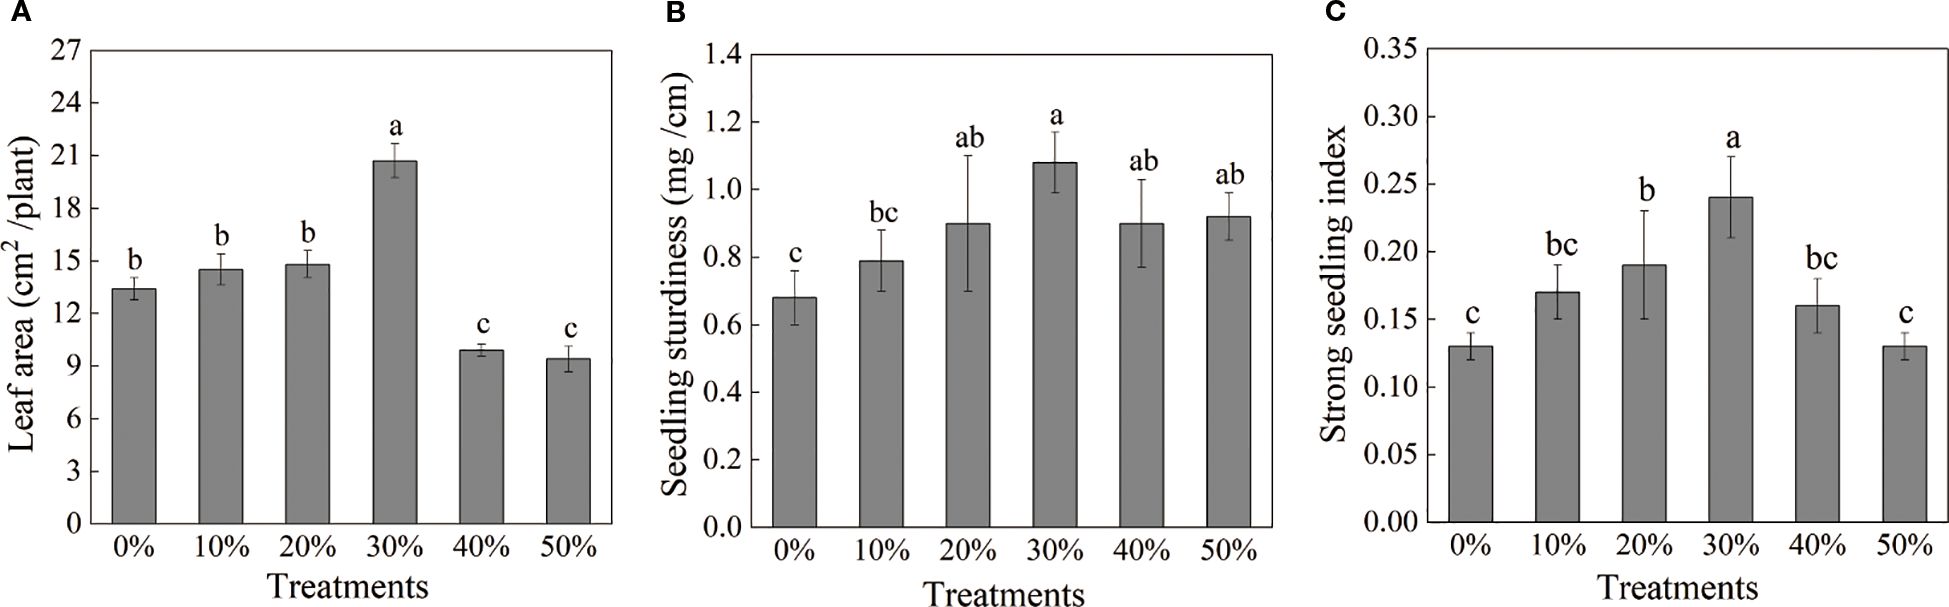
Figure 1. Effects of biochar application rates on leaf area (A), seedling sturdiness (B), and strong seedling index (C) in rice seedlings. Different lowercase letters denote significant differences at P < 0.05.
Root-shoot ratio exhibited a significant negative correlation with total N, total P, total K, and EC (Table 6). Furthermore, it showed a highly significant negative correlation with soil organic matter, available P, available K, and the C/N ratio. Leaf area demonstrated a significant negative correlation with available K and a highly significant negative correlation with soil pH. Seedling sturdiness showed a significant positive correlation with total P and available P, while exhibiting a highly significant negative correlation with the root to shoot ratio. The strong seedling index displayed a highly significant negative correlation with the root to shoot ratio. Conversely, it exhibited highly significant positive correlations with leaf area and seedling sturdiness.
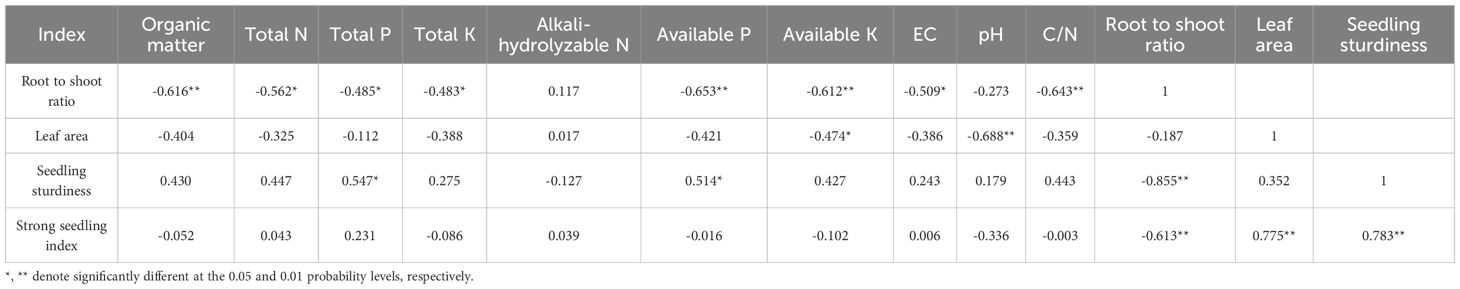
Table 6. Correlation coefficients between root to shoot ratio, leaf area, seeding study, strong seeding index and chemical properties of seedling soil.
4 Discussion
4.1 Effects of biochar on rice seedling morphogenesis and physiological activity
This study revealed significant dose-dependent effects of biochar on the morphological and physiological parameters of rice seedlings, with a distinct optimal range for growth promotion. The 30% biochar treatment yielded the highest values for several key morphological parameters, including maximum leaf length, leaf width, stem base diameter, plant height, and dry weight per hundred seedlings. This clearly demonstrates that the moderate incorporation of 30% (v/v) biochar significantly enhances the expansion of photosynthetic organs (leaves), stem robustness, and overall biomass accumulation. The underlying mechanism likely involves biochar-mediated optimization of the rhizosphere environment, potentially providing more favorable root growth space through its porous structure (Ibrahim et al., 2020; Suliman et al., 2017). Additionally, recent global studies indicate that biochar provides microhabitats for beneficial microorganisms, enhancing microbial-mediated nutrient cycling and potentially contributing to long-term soil health (Zhao et al., 2024). However, increasing the application rate to 40% and 50% resulted in significant reductions in leaf length, stem base diameter, plant height, and dry weight, falling below the levels observed in the 0% treatment. This indicates the induction of physicochemical stress by high biochar doses (Feng et al., 2021). The growth inhibition at high doses may be attributed to multiple factors, including ion imbalance (particularly Na+ accumulation and K+/Ca2+ disruption), microbial dysbiosis, and osmotic stress, which collectively impair seedling development (Zhou et al., 2024).
Leaf SPAD values (indicating relative chlorophyll content) peaked under the 30% treatment, showing significantly higher values compared to both the 0% treatment and the high-dose treatments (40% and 50% treatment), but no significant difference compared to the 20% treatment. This suggests that a 20-30% biochar application rate optimally enhances leaf chlorophyll content and photosynthetic capacity, consistent with the superior plant morphogenesis observed within this dosage range (Jiang et al., 2022). The reduced SPAD values under high biochar doses imply potential inhibition of chlorophyll synthesis, possibly due to decreased nutrient availability or ion stress (Zhang et al., 2023). The root-to-shoot ratio exhibited a consistent decreasing trend with increasing biochar dosage, with all biochar treatments significantly lower than the 0% treatment. This reflects a general pattern where the increase in shoot biomass outweighed the increase in root biomass following biochar addition. Notably, even though root development was promoted under the optimal 30% dose, the vigorous shoot growth resulted in a significantly reduced root-to-shoot ratio. While this resource allocation pattern towards the shoots typically favors the development of strong stems and leaves during the seedling stage—promoting robust seedling growth—an excessive reduction in the root-to-shoot ratio may compromise stress tolerance after transplanting (Zhang et al., 2019). Previous greenhouse trial results also indicated that 25% biochar application significantly promoted shoot growth in cabbage seedlings and markedly reduced the root-to-shoot ratio. While this enhancement benefits the cultivation of strong seedlings, it may compromise transplant survival rates under drought stress conditions (Yildirim et al., 2021). Therefore, this warrants further investigation to achieve a balance. Crucially, the comprehensive seedling quality indicator, the strong seedling index, reached its maximum value under the 30% treatment, significantly exceeding all other treatments and showing an 84.6% increase compared to the 0% treatment. Seedling stem hardness was also highest under the 30% treatment. These two integrated metrics strongly corroborate the significant advantage of 30% biochar application in cultivating high-quality rice seedlings. Although the current study focused on the seedling stage, numerous studies have established strong correlations between robust seedling traits and ultimate grain yield, suggesting that our optimized nursery practice could translate to improved field performance and economic returns for farmers (Liu et al., 2013; Brinton and Uauy, 2019).
4.2 Biochar regulates root development and nutrient uptake by improving the rhizosphere environment
The dose-dependent effects of biochar on rice seedling growth are closely linked to its significant alteration of the physicochemical properties of the seedling substrate, which in turn influences root development and nutrient uptake efficiency, and rhizosphere microbial ecology (Dong et al., 2015; Pratiwi and Shinogi, 2016). Roots are the key organs for sensing and responding to changes in the rhizosphere environment (Hossain et al., 2020). In this study, the 30% biochar treatment also yielded optimal or near-optimal results for several root parameters, including maximum root length, highest root volume, root tip number, and fresh weight (comparable to the 20% treatment). This indicates that moderate biochar application (30% treatment) is most conducive to promoting coordinated increases in root length, branching (root tip number), and biomass, forming an efficient root architecture for absorption (Wan et al., 2023). The improved root development at optimal biochar doses is likely mediated by both physical (e.g., porosity) and biological mechanisms, where biochar fosters a beneficial microbiome that enhances root growth and function through the production of phytohormones and suppression of pathogens (Zhang et al., 2023; Ibrahim et al., 2020). Notably, while the 20% treatment resulted in high root length, its root volume and root tip number were significantly lower than those in both the 30% treatment and the 0% treatment, suggesting a potentially sparser and finer root system with limited absorption efficiency. High-dose biochar treatments (40% and 50% treatment) significantly inhibited root length, root surface area, projected area, and root volume, severely impeding root development. This suppression may be primarily attributed to excessive levels of available K, sodium, and other ions disrupting ionic balance along with concomitant sharp elevations in pH (Olmo et al., 2016). The altered ion balance (e.g., elevated K+/Ca2+ or K+/Mg2+ ratios) and high pH under excessive biochar application can negatively affect membrane integrity, nutrient uptake selectivity, and microbial symbiosis, ultimately impairing root system development and function (Xia et al., 2024; Wu et al., 2023).
Biochar significantly improved the physical structure of the seedling substrate. All biochar treatments significantly reduced bulk density while increasing total porosity and non-capillary porosity. Specifically, substrate water content increased significantly and continuously with increasing biochar dosage, with the 50% treatment being 54.0% higher than the 0% treatment. Capillary porosity peaked under the 40% treatment. These changes substantially enhanced the substrate’s water-holding capacity and aeration, creating a more favorable physical environment for root growth and microbial activity (Adekiya et al., 2019; Njoku et al., 2015). However, the dramatic surge in non-capillary porosity under high biochar doses, particularly the 99.9% increase in the 50% treatment compared to the 0% treatment, may lead to rapid water drainage or poor root-substrate contact (Singh et al., 2022). This could be one reason for the inhibition of root growth and function observed at high doses.
Biochar addition significantly increased soil organic matter, available P, available K, total K content, and the C/N ratio, with particularly large increments observed at high doses. These changes create a complex interplay between chemical fertility and microbial processes, ultimately determining nutrient bioavailability. However, the impact of these chemical alterations on nutrient uptake is complex. Shoot N content exhibited a significant decreasing trend with increasing biochar dosage, with the 40% and 50% treatments were significantly lower than the 0% treatment by about 22%. Root N content was also significantly reduced in the 40% treatment. Although substrate total N was highest in the 40% and 50% treatments, the high C/N ratio likely enhanced microbial N immobilization, reducing N availability to plants (Jaffar et al., 2025; Kalu et al., 2021). This transient N immobilization, while potentially limiting short-term N availability, can contribute to long-term N retention and soil organic matter build-up, reducing leaching losses and benefiting soil health over time (Elrys et al., 2022; Jaffar et al., 2025). Only the 40% and 50% treatments significantly increased pH, which could also affect ammonium volatilization or nitrification processes (Obia et al., 2015), and significantly alter the composition and function of microbial communities involved in N cycling (Liu et al., 2018). Substrate available P increased significantly with biochar dosage, being 95.1% higher in the 50% treatment than in the 0% treatment. However, shoot P content was significantly lower only in the 50% treatment compared to the 0% and 20% treatments, while root P content was highest in the 50% treatment. This indicates complex adsorption/desorption dynamics of P by biochar, especially at high doses, where it may influence bioavailability by providing adsorption sites (Xu et al., 2014). Furthermore, biochar can modulate the activity of phosphate-solubilizing microorganisms, adding another layer of regulation to P bioavailability, which may not always synchronize with plant demand, particularly at high application rates. Substrate total K and available K content increased sharply with biochar dosage; available K in the 50% treatment was 29.7 times higher than that in the 0% treatment. Correspondingly, root K content peaked under the 30% treatment (58.8% higher than that in the 0% treatment), while shoot K content was significantly higher than that in the 0% treatment in the 10% and 50% treatments. Although high-dose biochar supplied considerable K, the increased shoot K content under the 50% treatment, along with its non-maximal root K content and observed growth suppression, indicates that K uptake and utilization were likely compromised by salinity stress, as evidenced by high EC values (Mandal et al., 2018). Additionally, antagonistic interactions with cations such as Ca2+ and Mg2+, which play vital roles in cellular homeostasis and stress tolerance but were not quantified here, might have contributed to these effects (Xing et al., 2024). High-dose biochar applications (40-50%) induced significant increases in substrate pH and EC. The 40% treatment exhibited the highest EC value, closely followed by the 50% treatment, which remained significantly higher than both low-dose treatments and the 0% treatment. This salinization-alkalinization trend represents a primary contributing factor to the inhibition of seedling growth (morphological, physiological, and root-related) and nutrient uptake (particularly N) observed under high biochar doses (Xing et al., 2024; Liu et al., 2018). The high EC likely reflects not only K+ accumulation but also the release of other ions from the biochar, disrupting ionic balance and causing osmotic stress. Future studies explicitly measuring these cations would provide a more complete mechanistic understanding of the salinity stress induced by high biochar doses.
4.3 Interaction of soil-root-shoot parameters under biochar influence and implications for vigorous seedling formation
Correlation analysis (Table 6) further elucidated the intrinsic relationships among parameters, clarifying the physiological, biochemical, and ecological mechanisms by which biochar promotes vigorous seedling development. The root-to-shoot ratio exhibited significant or highly significant negative correlations with soil fertility indices (organic matter, total N, total P, total K, available P, available K, C/N ratio) and EC values. This indicates that in biochar-amended substrates, higher soil fertility, particularly available nutrients, and elevated salinity (indicated by EC) were associated with a reduced root-to-shoot ratio, signifying a resource allocation shift favoring shoot growth (Wan et al., 2023; Mawof et al., 2021; Cao et al., 2021). This shift suggests a reduced nutrient acquisition cost for the plant, potentially mediated by improved nutrient availability and enhanced microbial nutrient cycling services, allowing greater carbon investment in aerial parts (Kocsis et al., 2020; Ghorbani et al., 2022). Critically, the root-to-shoot ratio showed highly significant negative correlations with both the seedling vigor index and stem hardness. This directly explains why, despite a reduced root-to-shoot ratio under biochar application (especially at the 20% and 30% treatments), both the strong seedling index and stem hardness were significantly enhanced. Moderate biochar application optimizes the rhizosphere environment (water, nutrients, aeration, and microbial balance), efficiently driving shoot biomass accumulation and robust stem development while ensuring essential root functionality (Kocsis et al., 2020; Ghorbani et al., 2022; Yang et al., 2022). This optimization represents a key mechanism for cultivating vigorous seedlings. For practical nursery management, the 30% biochar amendment not only ensures high-quality seedlings but also likely initiates beneficial microbial shifts that could contribute to long-term soil health and productivity if the seedling substrate is incorporated back into the field, although this long-term effect requires further validation.
The strong seedling index exhibited highly significant positive correlations with both leaf area and stem hardness. This delineates two core synergistic pathways through which biochar (particularly at the 30% treatment) cultivates strong seedlings: (1) Enhancing photosynthetic capacity by promoting leaf growth, increasing leaf area, and elevating chlorophyll content; and (2) Strengthening mechanical support by promoting stem thickening and hardening, thereby increasing stem hardness. The 30% biochar treatment achieved optimal results simultaneously across both pathways. Leaf area exhibited a highly significant negative correlation with soil pH and a significant negative correlation with available K. This result is consistent with observations under high biochar doses (40% and 50%), where sharp rises in pH and available K were accompanied by marked reductions in leaf area. This correlation suggests that salinization-alkalinization stress triggered by high biochar application inhibits leaf expansion (Xia et al., 2024; Wu et al., 2023), likely via disruption of ion homeostasis, osmotic stress, and compromised photosynthetic function.
Therefore, when applying biochar in early rice seedling cultivation, careful dosage control (approximately 30% is recommended) is essential to fully leverage its positive effects on substrate improvement and vigorous seedling formation while mitigating the adverse effects associated with high doses. This optimal rate promotes a balanced ionic environment and supports a healthy microbial community, crucial for nutrient cycling and plant health. Future research should further investigate how optimal application rates may vary with different biochar sources and properties, as well as among diverse rice varieties, and should include a broader characterization of ionic composition and microbial community dynamics to fully elucidate the underlying mechanisms. Furthermore, extending investigations to the entire crop life cycle, including yield formation under field conditions, would be invaluable to confirm the long-term agronomic and economic benefits of using biochar-amended seedlings.
5 Conclusions
This study demonstrates that biochar application significantly influences rice seedling growth, root development, nutrient content, and substrate properties, with a clear dose-dependent effect. An application rate of 30% was identified as optimal, consistently enhancing seedling quality through maximized leaf area, seedling sturdiness, strong seedling index, root length, and selective nutrient accumulation. In contrast, rates exceeding 40% predominantly induced inhibitory effects, including diminished growth performance, reduced shoot N content, and imbalanced nutrient partitioning. Beyond the direct growth response, biochar amendment substantially altered substrate physicochemical properties, enhancing moisture retention, porosity, and nutrient availability (e.g., organic matter, available P and K). However, excessive application provoked adverse alterations, including elevated pH, excessively high EC, and a significantly widened C/N ratio, which may contribute to the observed growth inhibition at high doses. The strong seedling index correlated positively with leaf area and sturdiness, and negatively with root-shoot ratio, emphasizing the role of balanced resource partitioning and nutrient acquisition in mediating seedling vigor. Therefore, while biochar proves to be a beneficial soil amendment for rice seedling production, its application requires precise dosage control. We recommend a 30% biochar application rate as an effective strategy for enhancing nursery seedling quality and establishing a robust foundation for subsequent field performance.
Data availability statement
The original contributions presented in the study are included in the article/Supplementary Material. Further inquiries can be directed to the corresponding author.
Author contributions
LC: Data curation, Funding acquisition, Project administration, Software, Visualization, Writing – original draft, Writing – review & editing. JA: Data curation, Investigation, Software, Writing – original draft. ZG: Data curation, Investigation, Software, Writing – original draft. ZX: Data curation, Formal Analysis, Investigation, Writing – original draft. HY: Data curation, Investigation, Validation, Writing – original draft. HZ: Investigation, Methodology, Writing – original draft. CY: Investigation, Software, Writing – original draft. LW: Data curation, Investigation, Writing – original draft. SL: Investigation, Methodology, Writing – original draft.
Funding
The author(s) declare financial support was received for the research and/or publication of this article. The study was funded by the Science and Technology Research Project of Jiangxi Provincial Department of Education (Grant No. GJJ2402305), the Jingdezhen University 2024 University-Level Scientific Research Project (Incubation Category) (Grant No. 2024xjkt-01), and the National-Level College Student Innovation and Entrepreneurship Training Program Project for 2025 (Grant No. 202510894003).
Conflict of interest
The authors declare that the research was conducted in the absence of any commercial or financial relationships that could be construed as a potential conflict of interest.
Generative AI statement
The author(s) declare that no Generative AI was used in the creation of this manuscript.
Any alternative text (alt text) provided alongside figures in this article has been generated by Frontiers with the support of artificial intelligence and reasonable efforts have been made to ensure accuracy, including review by the authors wherever possible. If you identify any issues, please contact us.
Publisher’s note
All claims expressed in this article are solely those of the authors and do not necessarily represent those of their affiliated organizations, or those of the publisher, the editors and the reviewers. Any product that may be evaluated in this article, or claim that may be made by its manufacturer, is not guaranteed or endorsed by the publisher.
Supplementary material
The Supplementary Material for this article can be found online at: https://www.frontiersin.org/articles/10.3389/fagro.2025.1679276/full#supplementary-material
References
Acharya B. S., Dodla S., Wang J. J., Pavuluri K., Darapuneni M., Dattamudi S., et al. (2024). Biochar impacts on soil water dynamics: knowns, unknowns, and research directions. Biochar. 6, 34. doi: 10.1007/s42773-024-00234-6
Adekiya A. O., Agbede T. M., Aboyeji C. M., Dunsin O., and Simeon V. T. (2019). Effects of biochar and poultry manure on soil characteristics and the yield of radish. Sci. Hortic. 243, 457–446. doi: 10.1016/j.scienta.2018.12.067
Ali N., Jiang Q. A., Akhtar K., Luo R. H., Jiang M. G., He B., et al. (2025). Biochar and manure co-application improves soil health and rice productivity through microbial modulation. BMC Plant Biol. 25, 914. doi: 10.1186/s12870-025-06834-x
Ali L., Wang. X. K., Naveed. M., Ashraf. S., Nadeem. S. M., Haider. F. U., et al. (2021). Impact of biochar application on germination behavior and early growth of maize seedlings: insights from a growth room experiment. Appl. Sci. 11, 11666. doi: 10.3390/app112411666
Alkharabsheh H. M., Seleiman M. F., Battaglia M. L., Shami A., Jalal R. S., Alhammad B. A., et al. (2021). Biochar and its broad impacts on soil quality and fertility, nutrient leaching and crop productivity: a review. Agronomy. 11, 993. doi: 10.3390/agronomy11050993
Blanco-Canqui H. (2017). Biochar and soil physical properties. Soil Sci. Soc Am. J. 81, 687–711. doi: 10.2136/sssaj2016.10.0313
Brinton J. and Uauy C. (2019). A reductionist approach to dissecting grain weight and yield in wheat. J. Integr. Plant Biol. 61, 337–358. doi: 10.1111/jipb.12741
Cao D. Y., Lan Y., Sun Q., Yang X., Chen W. F., Meng J., et al. (2021). Maize straw and its biochar affect phosphorus distribution in soil aggregates and are beneficial for improving phosphorus availability along the soil profile. Eur. J. Soil Sci. 72, 2165–2179. doi: 10.1111/ejss.13095
Cong M. F., Hu Y., Sun X., Yan H., Yu G. L., Tang G. M., et al. (2023). Long-term effects of biochar application on the growth and physiological characteristics of maize. Front. Plant Sci. 14. doi: 10.3389/fpls.2023.1172425
Dong D., Feng Q. B., McGrouther K., Yang M., Wang H. L., and Wu W. X. (2015). Effects of biochar amendment on rice growth and nitrogen retention in a waterlogged paddy field. J. Soils Sediments. 15, 153–162. doi: 10.1007/s11368-014-1000-0
Elrys A. S., Chen Z. X., Wang J., Uwiragiye Y., Helmy A. M., Desoky E. M., et al. (2022). Global patterns of soil gross immobilization of ammonium and nitrate in terrestrial ecosystems. Glob. Change Biol. 28, 4472–4488. doi: 10.1111/gcb.16202
Feng Y. F., He H. Y., Xue L. H., Liu Y., Sun H. J., Guo Z., et al. (2021). The inhibiting effects of biochar-derived organic materials on rice production. J. Environ. Manage. 293, 112909. doi: 10.1016/j.jenvman.2021.112909
Feng Y., Liu M. Z., Wang K. T., Ling X. X., Hu L. F., Zhang H. C., et al. (2024). Optimal seeding rate enhances seedling quality, mechanical transplanting quality, and yield in hybrid rice. Front. Plant Sci. 15. doi: 10.3389/fpls.2024.1427972
Ghorbani M., Amirahmadi E., Konvalina P., Moudrý J., Bárta J., Kopecký M., et al. (2022). Comparative influence of biochar and zeolite on soil hydrological indices and growth characteristics of corn (Zea mays L.). Water. 14, 3506. doi: 10.3390/w14213506
Gu W. Q., Wang Y. N., Feng Z. B., Wu D., Zhang H. G., Yuan H. C., et al. (2022). Long-term effects of biochar application with reduced chemical fertilizer on paddy soil properties and japonica rice production system. Front. Environ. Sci. 10. doi: 10.3389/fenvs.2022.902752
Guo L. L., Yu H. W., Kharbach M., and Wang J. W. (2021). The response of nutrient uptake, photosynthesis and yield of tomato to biochar addition under reduced nitrogen application. Agronomy. 11, 1598. doi: 10.3390/agronomy11111598
Haider G., Steffens D., Moser G., Müller C., and Kammann C. I. (2016). Biochar reduced nitrate leaching and improved soil moisture content without yield improvements in a four-year field study. Agric. Ecosyst. Environ. 237, 80–94. doi: 10.1016/j.agee.2016.12.019
He W. J., He B., Wu B. Y., Wang Y. H., Yan F. Y., Ding Y. F., et al. (2023). Growth of tandem long-mat rice seedlings using controlled-release fertilizers: mechanical transplantation can be more economical and high yielding. J. Integr. Agric. 22, 3653–3663. doi: 10.1016/j.jia.2023.07.010
Hossain M. Z., Bahar M. M., Sarkar B., Donne S. W., Ok Y. S., Palansooriya K. N., et al. (2020). Biochar and its importance on nutrient dynamics in soil and plant. Biochar. 2, 379–420. doi: 10.1007/s42773-020-00065-z
Huang M., Zhang R. C., Jiang P., Chen Y., and Zhu D. (2016). Temperature-related yield constraints of early-rice in South China: a cross-location analysis. PloS One 11, e0158601. doi: 10.1371/journal.pone.0158601
Ibrahim M. M., Tong C. X., Hu K., Zhou B. Q., Xing S. H., and Mao Y. L. (2020). Biochar-fertilizer interaction modifies N-sorption, enzyme activities and microbial functional abundance regulating nitrogen retention in rhizosphere soil. Sci. Total Environ. 739, 140065. doi: 10.1016/j.scitotenv.2020.140065
Jaffar M. T., Chang W. Q., Ahmed M. A., Shi R. X., Liu Q. Z., Girkin N., et al. (2025). Mechanistic insights into the role of biochar C:N ratios in modulating greenhouse gas emissions and soil organic carbon fractions in contrasting soil types. Soil Sci. Soc Am. J. 89, e70068. doi: 10.1002/saj2.70068
Jiang W. T., Xu L. X., Liu Y. L., Su W. X., Yan J. X., and Xu D. W. (2022). Effect of biochar on the growth, photosynthesis, antioxidant system and cadmium content of Mentha piperita ‘chocolate’ and Mentha spicata in cadmium-contaminated soil. Agronomy. 12, 2737. doi: 10.3390/agronomy12112737
Kalu S., Oyekoya G. N., Ambus P., Tammeorg P., Simojoki A., Pihlatie M., et al. (2021). Effects of two wood-based biochars on the fate of added fertilizer nitrogen—A 15N tracing study. Biol. Fertil. Soils. 57, 457–470. doi: 10.1007/s00374-021-01556-3
Khan Z., Zhang K., Khan M. N., Zhu K., and Hu L. (2024). Effects of biochar persistence on soil physiochemical properties, enzymatic activities, nutrient utilization, and crop yield in a three-year rice-rapeseed crop rotation. Eur. J. Agron. 154, 127096. doi: 10.1016/j.eja.2024.127096
Kocsis T., Kotroczó Z., and Kardos L. (2020). Optimization of increasing biochar doses with soil–plant–microbial functioning and nutrient uptake of maize. Environ. Technol. Innov. 20, 101191. doi: 10.1016/j.eti.2020.101191
Liu X., Zhang A., Ji C., Joseph S., Bian R., Li L., et al. (2013). Biochar’s effect on crop productivity and the dependence on experimental conditions—a meta-analysis of literature data. Plant Soil. 373, 583–594. doi: 10.1007/s11104-013-1806-x
Liu Q., Zhang Y., Liu B., Amonette J. E., Lin Z., Liu G., et al. (2018). How does biochar influence soil N cycle? A meta-analysis. Plant Soil. 426, 211–225. doi: 10.1007/s11104-018-3585-4
Mandal S., Donner E., Vasileiadis S., Skinner W., and Lombi E. (2018). The impact of biochar feedstock, pyrolysis temperature and application rate on the reduction of ammonia volatilisation from biochar-amended soil. Sci. Total Environ. 627, 942–950. doi: 10.1016/j.scitotenv.2018.01.312
Mawof A., Prasher S., Bayen S., and Nzediegwu C. (2021). Effects of biochar and biochar-compost mix as soil amendments on soil quality and yield of potatoes irrigated with wastewater. J. Soil Sci. Plant Nutr. 21, 2600–2612. doi: 10.1007/s42729-021-00453-9
Njoku C., Mbah C., and Nwite J. (2015). Effect of biochar on selected soil physical properties and maize yield in an Ultisol in Abakaliki, southeastern Nigeria. Global Adv. Res. J. Agric. Sci. 4, 864–870.
Obia A., Cornelissen G., Mulder J., and Dörsch P. (2015). Effect of soil pH increase by biochar on NO, N2O and N2 production during denitrification in acid soils. PloS One 10, e0138781. doi: 10.1371/journal.pone.0138781
Olmo M., Villar R., Salazar P., and Alburquerque J. A. (2016). Changes in soil nutrient availability explain biochar’s impact on wheat root development. Plant Soil. 399, 333–343. doi: 10.1007/s11104-015-2700-1
Pratiwi E. P. A. and Shinogi Y. (2016). Rice husk biochar application to paddy soil and its effects on soil physical properties, plant growth, and methane emission. Paddy Water Environ. 14, 521–532. doi: 10.1007/s10333-015-0521-z
Razzaghi F., Obour P. B., and Arthur E. (2020). Does biochar improve soil water retention? A systematic review and meta-analysis. Geoderma. 361, 114055. doi: 10.1016/j.geoderma.2020.114055
Singh H., Northup B. K., Rice C. W., and Prasad P. V. V. (2022). Biochar applications influence soil physical and chemical properties, microbial diversity, and crop productivity: A meta-analysis. Biochar. 4, 8. doi: 10.1007/s42773-022-00138-1
Sui M. R., Yu J. M., Dong Y., Wu J. X., Jiang Y. Y., Wang X., et al. (2024). Sediment-based biochar enhances growth, physiological and phytochemical properties of submerged plant Vallisneria spiralis via improving rhizosphere micro-ecological environment. J. Environ. Manage. 387, 125811. doi: 10.1016/j.jenvman.2025.125811
Suliman W., Harsh J. B., Abu-Lail N. I., Fortuna A.-M., Dallmeyer I., and Garcia-Pérez M. (2017). The role of biochar porosity and surface functionality in augmenting hydrologic properties of a sandy soil. Sci. Total Environ. 574, 139–147. doi: 10.1016/j.scitotenv.2016.09.025
Sun W. L., Li Y. N., Xu Z. H., Bai Y. F., and Bai S. H. (2024). Biochar application for enhancing water and nitrogen use efficiency of understory Acacia species in a suburban native forest subjected to nitrogen deposition in Southeast Queensland. Plant Soil. 504, 607–624. doi: 10.1007/s11104-024-06859-0
Wan H., Liu X., Shi Q., Chen Y. T., Jiang M., Zhang J. R., et al. (2023). Biochar amendment alters root morphology of maize plant: its implications in enhancing nutrient uptake and shoot growth under reduced irrigation regimes. Front. Plant Sci. 14. doi: 10.3389/fpls.2023.1122742
Wu Y. F., Wang X. D., Zhang L., Zheng Y. J., Liu X. L., Zhang Y., et al. (2023). The critical role of biochar to mitigate the adverse impacts of drought and salinity stress in plants. Front. Plant Sci. 14. doi: 10.3389/fpls.2023.1163451
Xia H., Wang J. Y., Riaz M., Babar S., Li Y. X., Wang X. L., et al. (2024). Co-application of biochar and potassium fertilizer improves soil potassium availability and microbial utilization of organic carbon: a four-year study. J. Clean. Prod. 439, 143211. doi: 10.1016/j.jclepro.2024.143211
Xing J., Li X. Y., Li Z. Q., Wang X. T., Hou N., and Li D. P. (2024). Remediation of soda-saline-alkali soil through soil amendments: microbially mediated carbon and nitrogen cycles and remediation mechanisms. Sci. Total Environ. 924, 171641. doi: 10.1016/j.scitotenv.2024.171641
Xu G., Sun J. N., Shao H. B., and Chang S. X. (2014). Biochar had effects on phosphorus sorption and desorption in three soils with differing acidity. Ecol. Eng. 62, 54–60. doi: 10.1016/j.ecoleng.2013.10.022
Yang W., Feng G., Jia Y. L., Yang Y. X., Gao X. Y., Gao L. H., et al. (2022). Impact of single biochar application on maize growth and water-fertilizer productivity under different irrigation regimes. Front. Plant Sci. 13. doi: 10.3389/fpls.2022.1006827
Yildirim E., Ekinci M., and Turan M. (2021). Impact of biochar in mitigating the negative effect of drought stress on cabbage seedlings. J. Soil Sci. Plant Nutr. 21, 2297–2309. doi: 10.1007/s42729-021-00522-z
Zhang J. H., Bai Z. A., Huang J., Hussain S., Zhao F. T., Zhu C. Q., et al. (2019). Biochar alleviated the salt stress of induced saline paddy soil and improved the biochemical characteristics of rice seedlings differing in salt tolerance. Soil Tillage Res. 195, 104372. doi: 10.1016/j.still.2019.104372
Zhang W. Q., Wei J. H., Guo L. L., Fang H., Liu X. J., Liang K. L., et al. (2023). Effects of two biochar types on mitigating drought and salt stress in tomato seedlings. Agronomy. 13, 1039. doi: 10.3390/agronomy13041039
Zhao J. Y., Qiu Y. B., Yi F., Li J. X., Wang X. Y., Fu Q., et al. (2024). Biochar dose-dependent impacts on soil bacterial and fungal diversity across the globe. Sci. Total Environ. 930, 172509. doi: 10.1016/j.scitotenv.2024.172509
Keywords: biochar, early-season rice, seedling growth, nursery substrate properties, nutrient dynamics
Citation: Chen L, Ao J, Gao Z, Xu Z, Yu H, Zhang H, Yu C, Wei L and Li S (2025) Dose-dependent effects of biochar amendment on early rice seedling growth and nursery substrate properties in Southern China. Front. Agron. 7:1679276. doi: 10.3389/fagro.2025.1679276
Received: 04 August 2025; Accepted: 25 August 2025;
Published: 11 September 2025.
Edited by:
Ping Liao, Yangzhou University, ChinaReviewed by:
Ruoyu Xiong, Shanghai Academy of Agricultural Sciences, ChinaJebastin Thomas, Bishop Heber College, India
Copyright © 2025 Chen, Ao, Gao, Xu, Yu, Zhang, Yu, Wei and Li. This is an open-access article distributed under the terms of the Creative Commons Attribution License (CC BY). The use, distribution or reproduction in other forums is permitted, provided the original author(s) and the copyright owner(s) are credited and that the original publication in this journal is cited, in accordance with accepted academic practice. No use, distribution or reproduction is permitted which does not comply with these terms.
*Correspondence: Liming Chen, MjMwNjdAamR6dS5lZHUuY24=