 Junjie Hao1
 Yisha Pan2*
- 1School of Marxism, Chongqing Chemical Industry Vocational College, Chongqing, China
- 2College of Public Policy and Management (College of Emergency Management), China University of Mining and Technology, Xuzhou, China
Introduction: Controlling carbon dioxide emissions and pursuing green development are imperative for global sustainable development. Accurately predicting agricultural carbon emissions is crucial for accelerating emission reduction efforts and guiding green technology innovation. This study focuses on forecasting agricultural carbon emissions in Henan Province to provide data-driven support for green agricultural development.
Methods: This research utilizes six key influencing factors—chemical fertilizer, pesticide, and agricultural film usage, among others—to predict total carbon emissions. Two primary analytical approaches were employed: a neural network model (comparing Multilayer Perceptron (MLP) and Radial Basis Function (RBF) models) and a nonlinear surface fitting method (specifically, Gaussian multi-modal fitting) for regression and prediction.
Results: The analysis yielded three main findings: 1) In carbon emission regression, the MLP model demonstrated superior performance with a smaller absolute residual error and significantly higher accuracy (R2 = 0.998) compared to the RBF model (R2 = 0.933), establishing it as more suitable for this forecasting task. 2) The Gaussian multi-modal fitting method effectively predicted the time-varying values of the influencing factors (all R2 > 0.9), enabling reliable further prediction of carbon emissions. 3) Both methods indicate that agricultural carbon emissions in Henan Province follow a quadratic trend over time. The forecast for 2001-2030 reveals a pattern of rapid growth, followed by stable growth, and finally a phase of fluctuating decline.
Discussion: The high-precision prediction results offer a theoretical reference for advancing green agricultural development in Henan Province. Furthermore, they provide empirical, data-based support for promoting the "green production" concept and disseminating low-carbon policies, thereby enhancing the persuasiveness of ecological education. This contributes to establishing a positive ecological governance cycle of "consciousness - voluntary action - effect translation," ultimately aiding the synergistic enhancement of ecological and social benefits.
1 Introduction
The emission of carbon dioxide and other greenhouse gases causes the acceleration of global warming. It has become an international consensus to develop low-carbon economy and control carbon emissions. China has set a goal of peaking its carbon dioxide emissions by 2030 and striving to achieve a carbon neutral by 2060. The goal of carbon peak must be realized at all levels. The development of agriculture plays a vital role in the national economy, and the reduction of agricultural carbon emissions is increasingly concerned by the world. Measuring and analyzing the trend of agricultural carbon emissions is of great theoretical and practical significance for energy saving, consumption reduction, control of greenhouse gas emissions, implementation of rural revitalization strategy and construction of ecological civilization. Simultaneously, achieving the Dual Carbon Goals within the agricultural sector necessitates deeply concerted efforts spanning from conceptual awareness to practical action across society. As agriculture constitutes a fundamental industry within the national economy, reducing its carbon emissions requires not merely technological innovation and policy regulation, but more crucially, societal mobilization and value-oriented guidance to forge consensus. This empowers agricultural producers to embed “ecological priority and green development” as a core value and actively translate it into practice.
At present, domestic research on carbon emissions should focus on the calculation and prediction model of carbon emissions. Many scholars have built models from multiple levels to predict the peak and time of carbon emissions (Liu et al., 2022; Qiu et al., 2021; Zhang et al., 2021). Qiao (2021) predicted the development trend of carbon emissions from land use in Guiyang from 2020 to 2035, and put forward countermeasures and suggestions for low-carbon development of Guiyang based on the analysis of the results. Tian et al. (2021) used the extended STIRPAT model to simulate six scenarios and predicted the peak and peak time of carbon emissions in the Yangtze River Economic Belt during 2017-2030. Chu et al. (2020) used GDIM to study the driving factors of China’s agricultural carbon emissions from 1985 to 2017, simulated and predicted China’s agricultural carbon emissions from 2018 to 2030. Zhao et al. (2018) used the log-average segmentation index (LMDI) model to explore the relationship between soil and water resources exploitation and agricultural carbon emissions, and put forward policy suggestions for the future low-carbon development of agriculture in China. Using qualitative time series data from 1985 to 2018, Koondhar et al. (2021) analyzed autoregressive distribution lag, vector error correction model, and a new dynamic ARDL model to explore the green growth of food production under the constraints of agricultural carbon emissions and sown area. The European Green Deal to tackle climate change set a target for 2050. Particular attention is being paid to the agricultural sector, where there is a great need to reduce carbon emissions and rebuild the natural carbon cycle (Scuderi et al., 2021). Governance of carbon emissions necessitates technological approaches coupled with a paradigm shift in societal thinking. Agricultural carbon emissions, as one of the important sources of total carbon emissions, play an important role in carbon peak, so agricultural carbon emissions increasingly become a research hotspot. Chinese scholars have conducted measurement and analysis of agricultural carbon emissions and their influencing factors at the municipal, provincial, and national levels (Yang et al., 2022; Zhu et al., 2022);. In terms of agricultural carbon emission reduction, in addition to input factors, aspects such as farm size (Zhang et al., 2022a) and policy support (Chen and Wang, 2022; Zhu and Huo, 2022) have been found to exert significant impacts.
Many scholars have calculated and analyzed China’s agricultural carbon emission characteristics, carbon emission efficiency and carbon source structure (Shang et al., 2022; Yang et al., 2021), laying groundwork for regional low-carbon development strategies. However, further integration of technical conclusions with guidance mechanisms remains essential. For example, Chen et al. (2021) in Jiangsu Province found significant emission reduction potential in traditional agricultural production - findings that not only indicate opportunities for technical improvements but also demonstrate the need to guide farmers through education to adopt low-carbon production models. Wu et al. (2021) used Gini coefficient to analyze the dynamic evolution of agricultural carbon emission intensity in China, and selected parameter comparison method to measure regional differences in agricultural carbon offset potential in China. Zhang et al. (2022b) used the threshold regression model with agricultural carbon emission as the threshold variable to study the nonlinear relationship between the narrow sense of agricultural production efficiency and agricultural carbon emission intensity. Xiong et al. (2020) utilized the STIRPAT model to identify driving factors of agricultural carbon emissions in Jiangsu Province. Their proposed carbon compensation mechanism—targeting structured urbanization advancement, deployment of low-carbon technologies, and establishment of agricultural carbon offset systems.
In the field of forecasting model research, techniques such as neural networks, nonlinear surface fitting, and Gaussian models have been widely utilized (Papamarkou et al., 2022; Cheng and Titterington, 1994). Their integration can effectively enhance prediction accuracy and strengthen public awareness through data visualization (Titterington, 2004; Hall and Tajvidi, 2000; Buhlmann and Hothorn, 2007). However, despite the extensive application of traditional econometric models like STIRPAT, LMDI, and ARDL in factor decomposition and forecasting, they often rely on linear or parametric assumptions, making it difficult to fully capture the complex nonlinear interactions within agricultural emission systems (George et al., 2012; Goddard et al., 2009; Palmer, 2020). Consequently, a significant research gap remains in combining neural networks with nonlinear surface fitting for agricultural carbon emission prediction. Research in this direction is of great importance for innovating pathways toward green agricultural development and controlling carbon emissions.
Henan Province is located in the Middle East of China, the middle and lower reaches of the Yellow River, is the national grain production core area, the province’s arable land area of 8.15 million hm2, per capita arable land 0.075 hm2. In addition, the consumption of chemical fertilizers, pesticides and agricultural film is relatively high in Henan Province. Selecting Henan Province as a case study for agricultural carbon emissions research holds significance beyond its representativeness. As a leading agrarian region, its endeavors in cultivating ecological awareness among farmers and advancing green transformation of agricultural practices carry demonstrative weight for national “Dual Carbon” goal attainment. This research focuses on Henan’s agricultural carbon emissions from 2000 to 2020, employing neural networks and nonlinear surface fitting to construct predictive models (As shown in Figure 1). The study serves dual purposes: providing technical reference for agricultural carbon peaking while exploring how to leverage data for public awareness education. This approach ultimately drives the translation of ecological principles into farming practices, achieving a synthesis of technical rationality and value rationality.
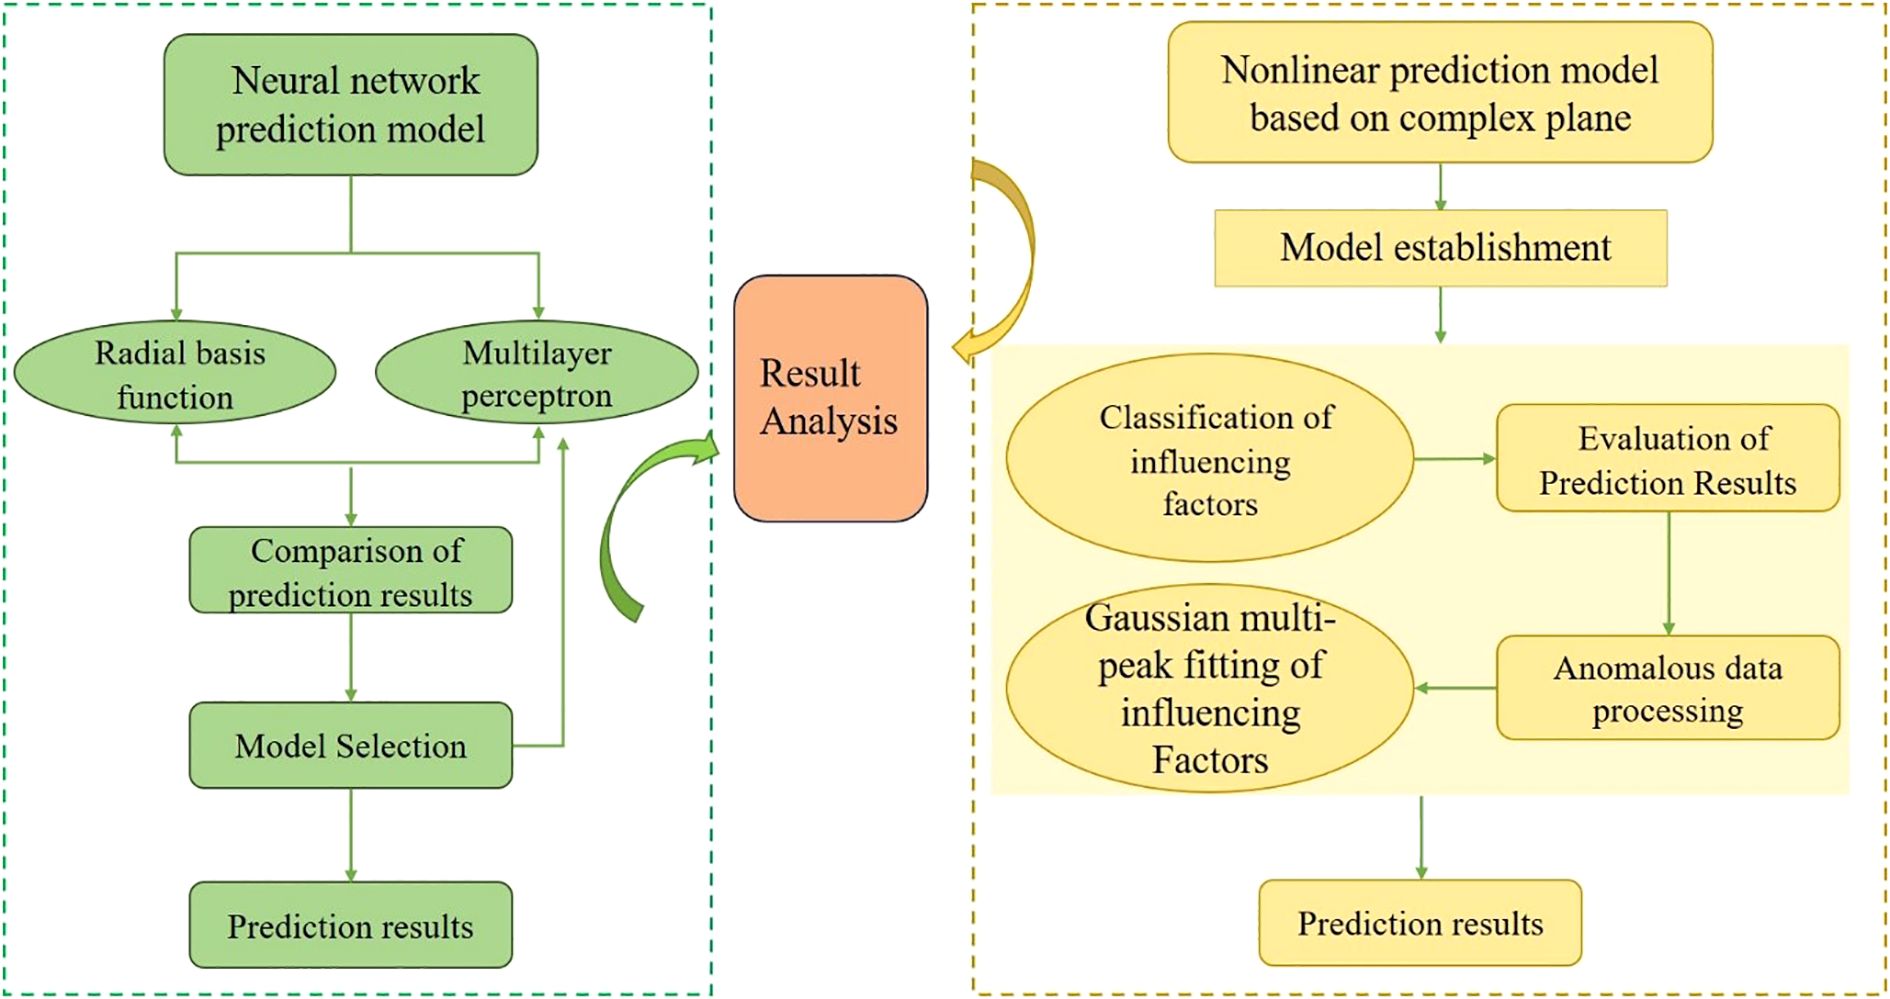
Figure 1. Model flowchart.
2 Establishment of carbon emission prediction model
2.1 Neural network prediction model
2.1.1 Theory
2.1.1.1 Multilayer perceptron
Multilayer perceptron is a feedforward artificial neural network model which maps multiple input data sets to a single output data set. The schematic diagram is shown in Figure 2. (The relevant data in this study are sourced from the Henan Statistical Yearbook (2000-2021) published by the Henan Provincial Bureau of Statistics, which includes statistical data on the usage of agricultural materials such as Chemical fertilizers, Pesticides, Agricultural film, Agricultural diesel, Irrigation and Plouging).
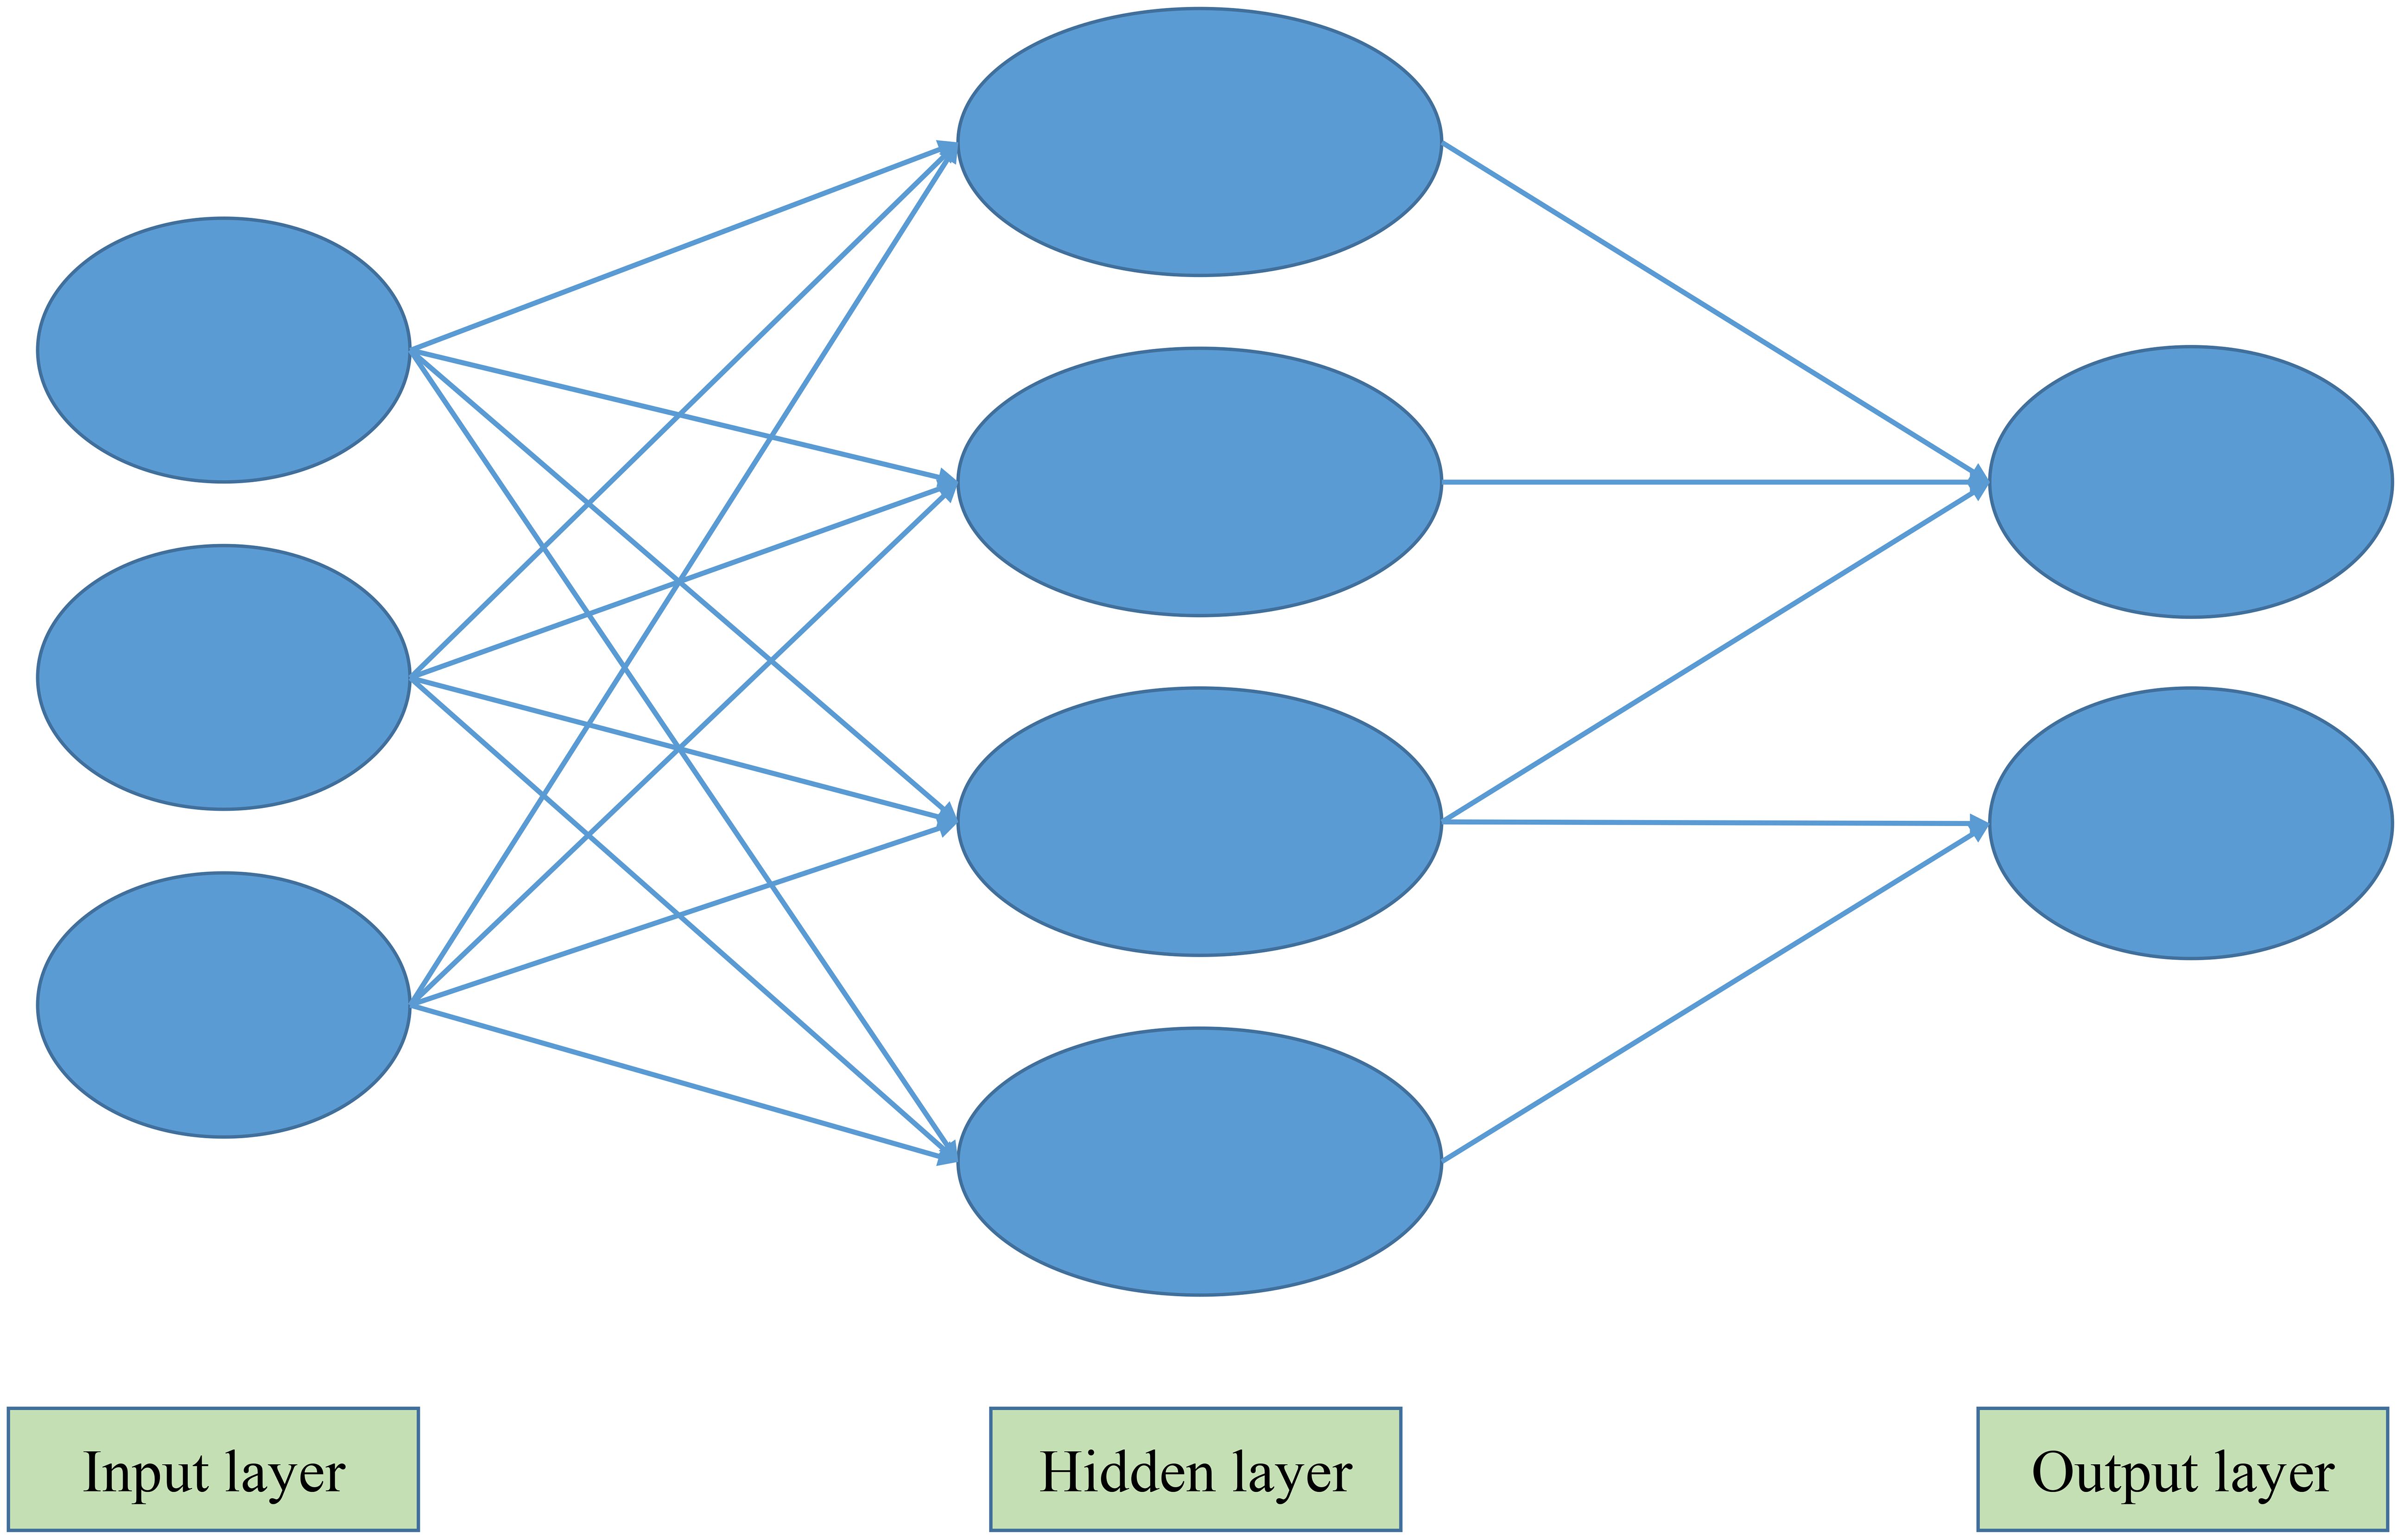
Figure 2. Multilayer perceptron.
In Figure 2, in the prediction model of total carbon emissions, the input layer is the factor affecting the total carbon emissions, and the output layer is the expected total carbon emissions. The hidden layer does not directly receive signals from the outside world (influence factors), nor does it directly send signals to the outside world (total carbon emissions). Its role in the neural network is to calculate, train and verify the influence factors of the input, so as to obtain the prediction results of total carbon emissions.
2.1.1.2 Radial basis function
The radial basis function (RBF) is a real-valued function whose value depends only on the distance from the origin. Any one meet Φ(x)=Φ(||x||) function Φ called radial basis function, the characteristic of standard general using Euclidean distance. In the neural network structure, it can be used as the main function of the full connection layer and ReLU layer.
RBF interpolation can be directly applied to geological exploration, shape design and other fields as interpolation or approximation of scattered data, and also has a good application in the construction of neural network.
Structure of the neural network basic method to assume a certain process belongs to a certain function space function, then connected into a neural grid, minimal potential tends to run for a period of time the network to achieve a dynamic balance, which can find out the function, and select the radial basis function space is a relatively simple easy to use the method of neural network to realize.
2.1.2 Model establishment
According to the specific situation of agricultural carbon emissions in Henan Province and with reference to the relevant statistical data of Statistical Yearbook of Henan Province from 2000 to 2021, six factors that have an impact on the total carbon emissions are comprehensively selected: Chemical fertilizer, Pesticides, Agricultural film, Agricultural diesel, Irrigation and Ploughing. The carbon emission coefficient is calculated by referring to IPCC greenhouse gas emission inventory accounting (Pan et al., 2023). SPSS software was used to analyze the correlation between total carbon emissions and influencing factors. Multi-layer perceptron and radial basis function were used to establish the neural network prediction model of total carbon emissions. The model continuously adjusts its weights through iterative training (with the number of training epochs set to 50), thereby reducing errors and improving prediction accuracy. as shown in Figure 3.
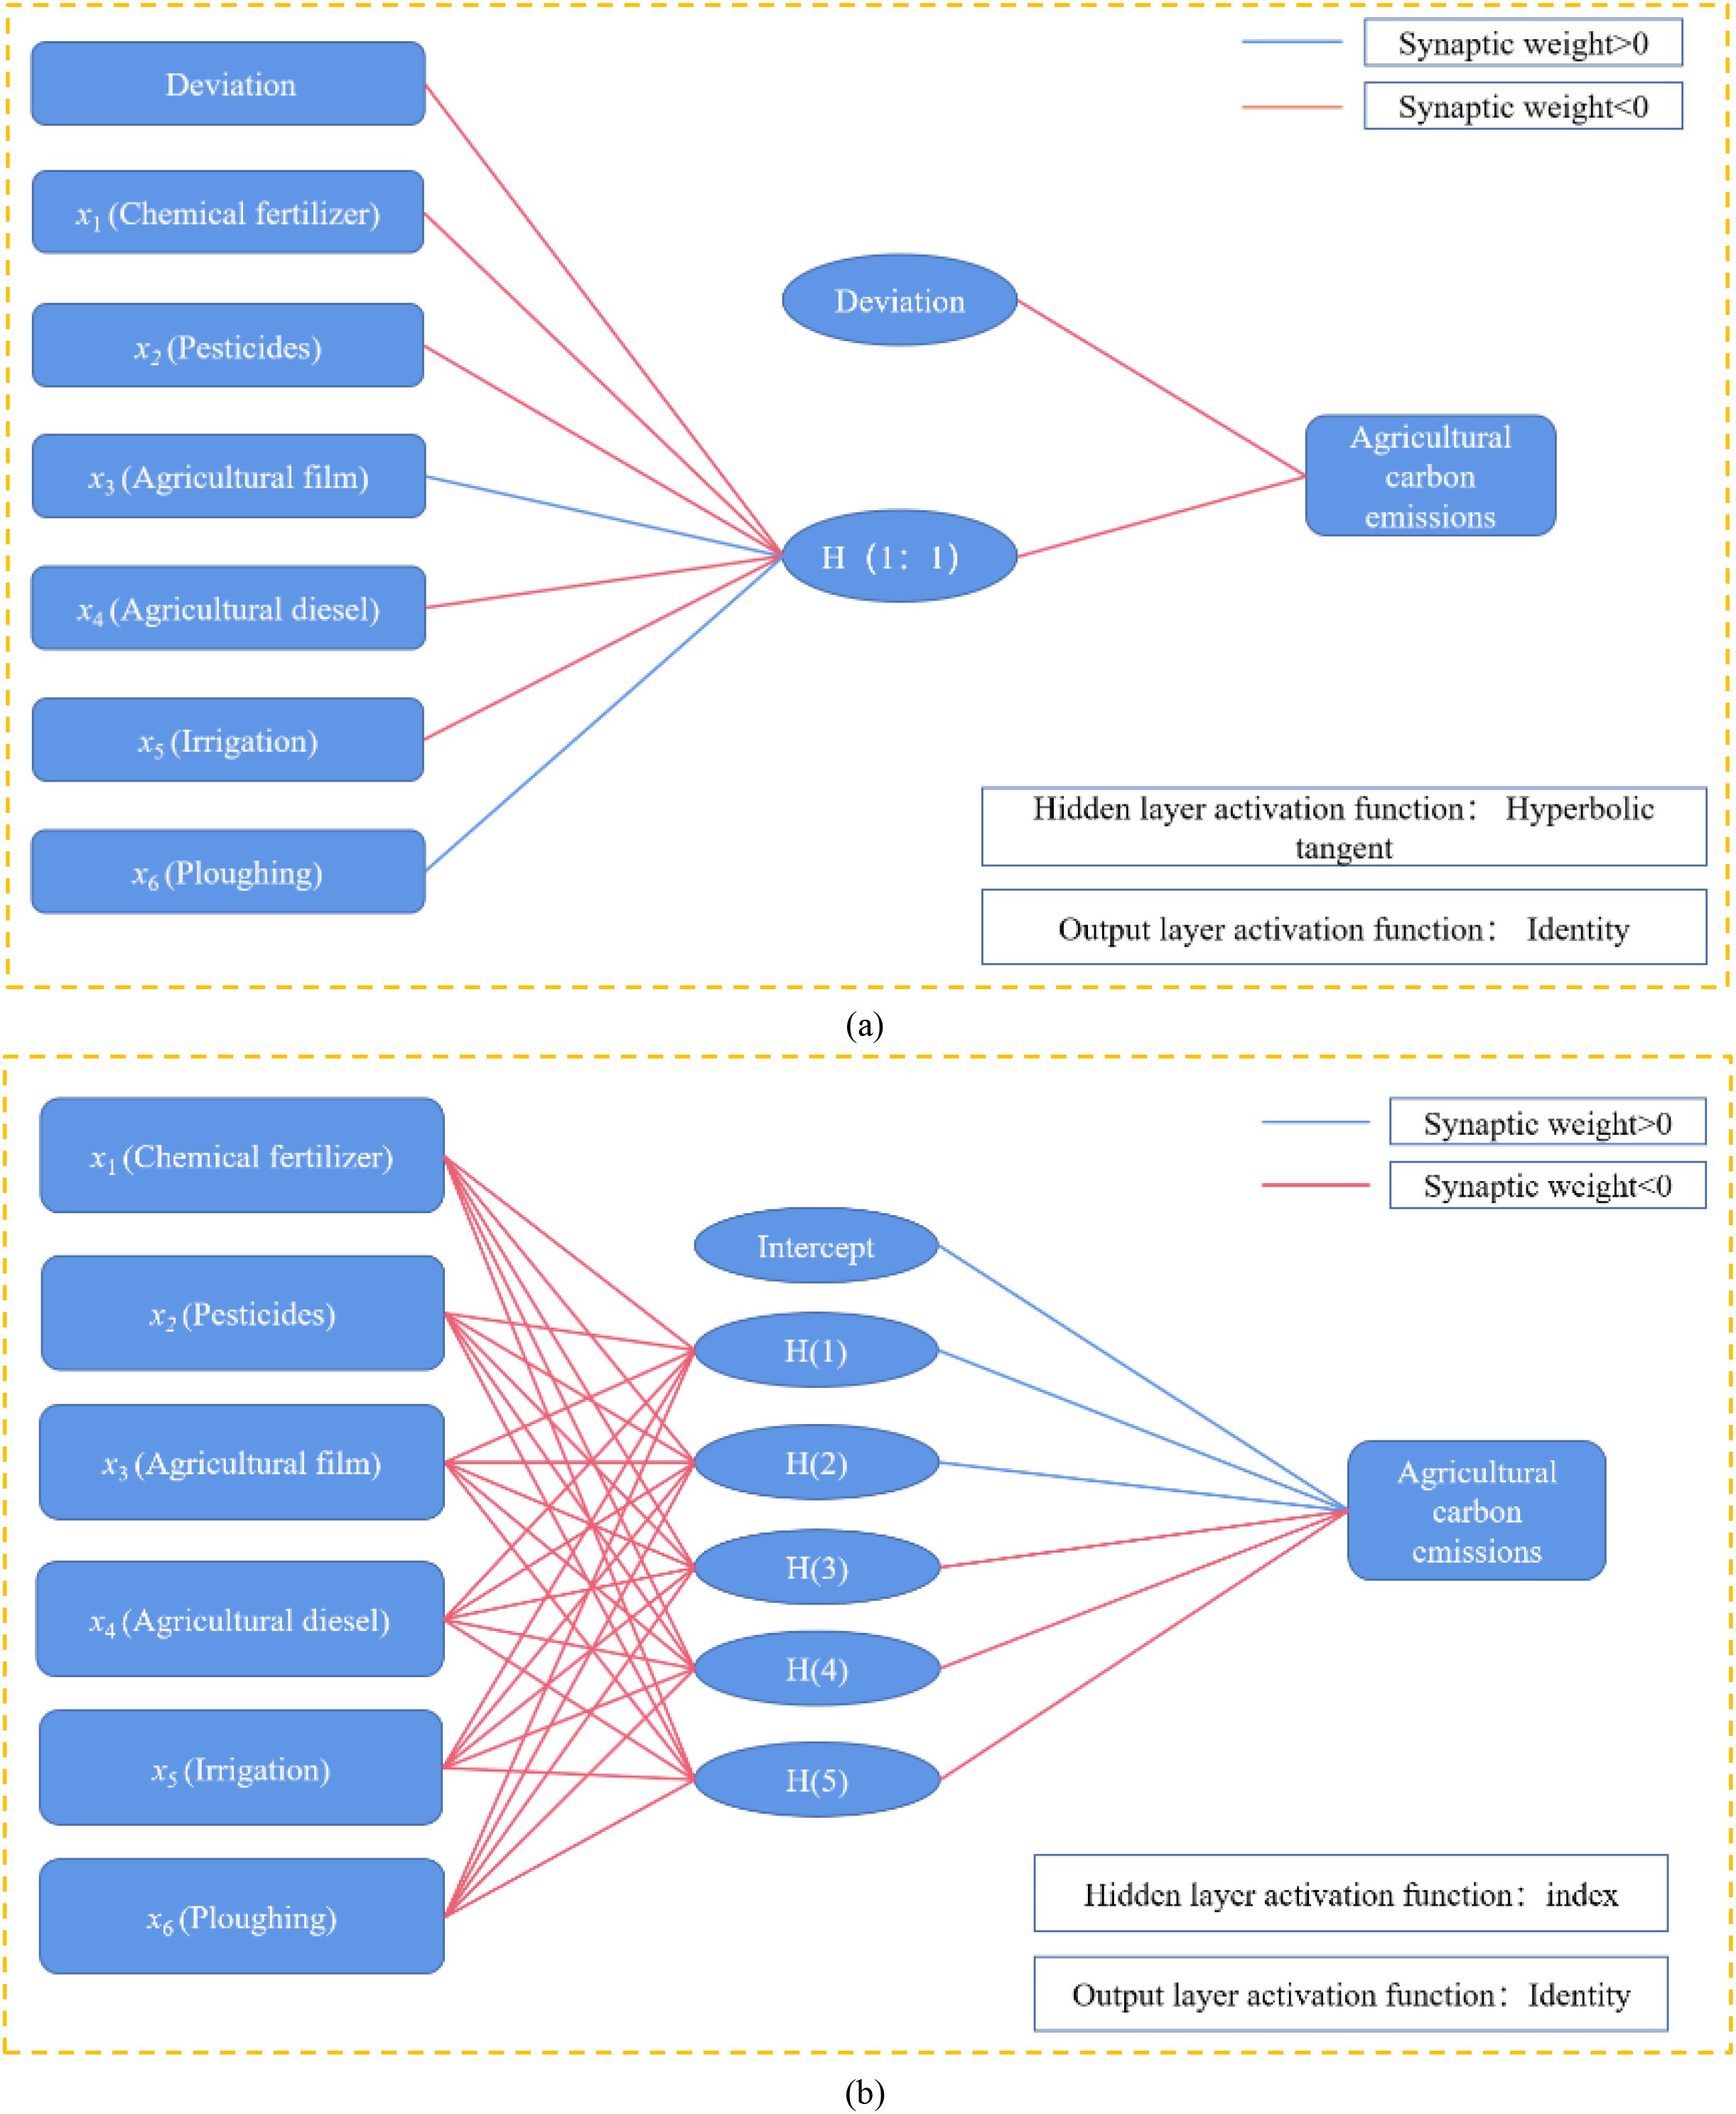
Figure 3. Neural network model of total carbon emission prediction. (a) Multilayer perceptron. (b) Radial basis function.
In Figure 3A, the hidden layer activation function of multilayer perceptron is hyperbolic tangent, namely (Equation 1):
In Figure 3A, the weight calculation method of each input layer is as follows:
1. Set the initial random weight (For the convenience of calculation, we write “deviation” as the first input factor), and are the weights of input layer and hidden layer respectively.
2. Multiply each factor of the input layer () by the weight ().
3. Calculate the output result of hidden layer ().
4. Calculate the error between the output result of hidden layer and the real result ().
5. Update weight.
Taking as an example, Using the above method, the synaptic weight of the input layer of the multilayer perceptron can be calculated as:
The deviation and synaptic weight of the input layer are -0.215 and -1.679, respectively. The deviation of the hidden layer is -0.307. The factors of the input layer are calculated with weights, combined with a bias, and processed through the hyperbolic tangent function to obtain the hidden layer output, which is then used with the output layer’s weight and bias to calculate the total carbon emissions.
In Figure 3B, the hidden layer activation function of the radial basis function is SoftMax, that is (Equation 2):
The results of radial perceptron can be calculated by using the same method as multilayer perceptron. The specific steps will not be repeated.
Figure 4 shows a comparison between the carbon emission results calculated from the neural network model in Figure 3 and the original carbon emission data.
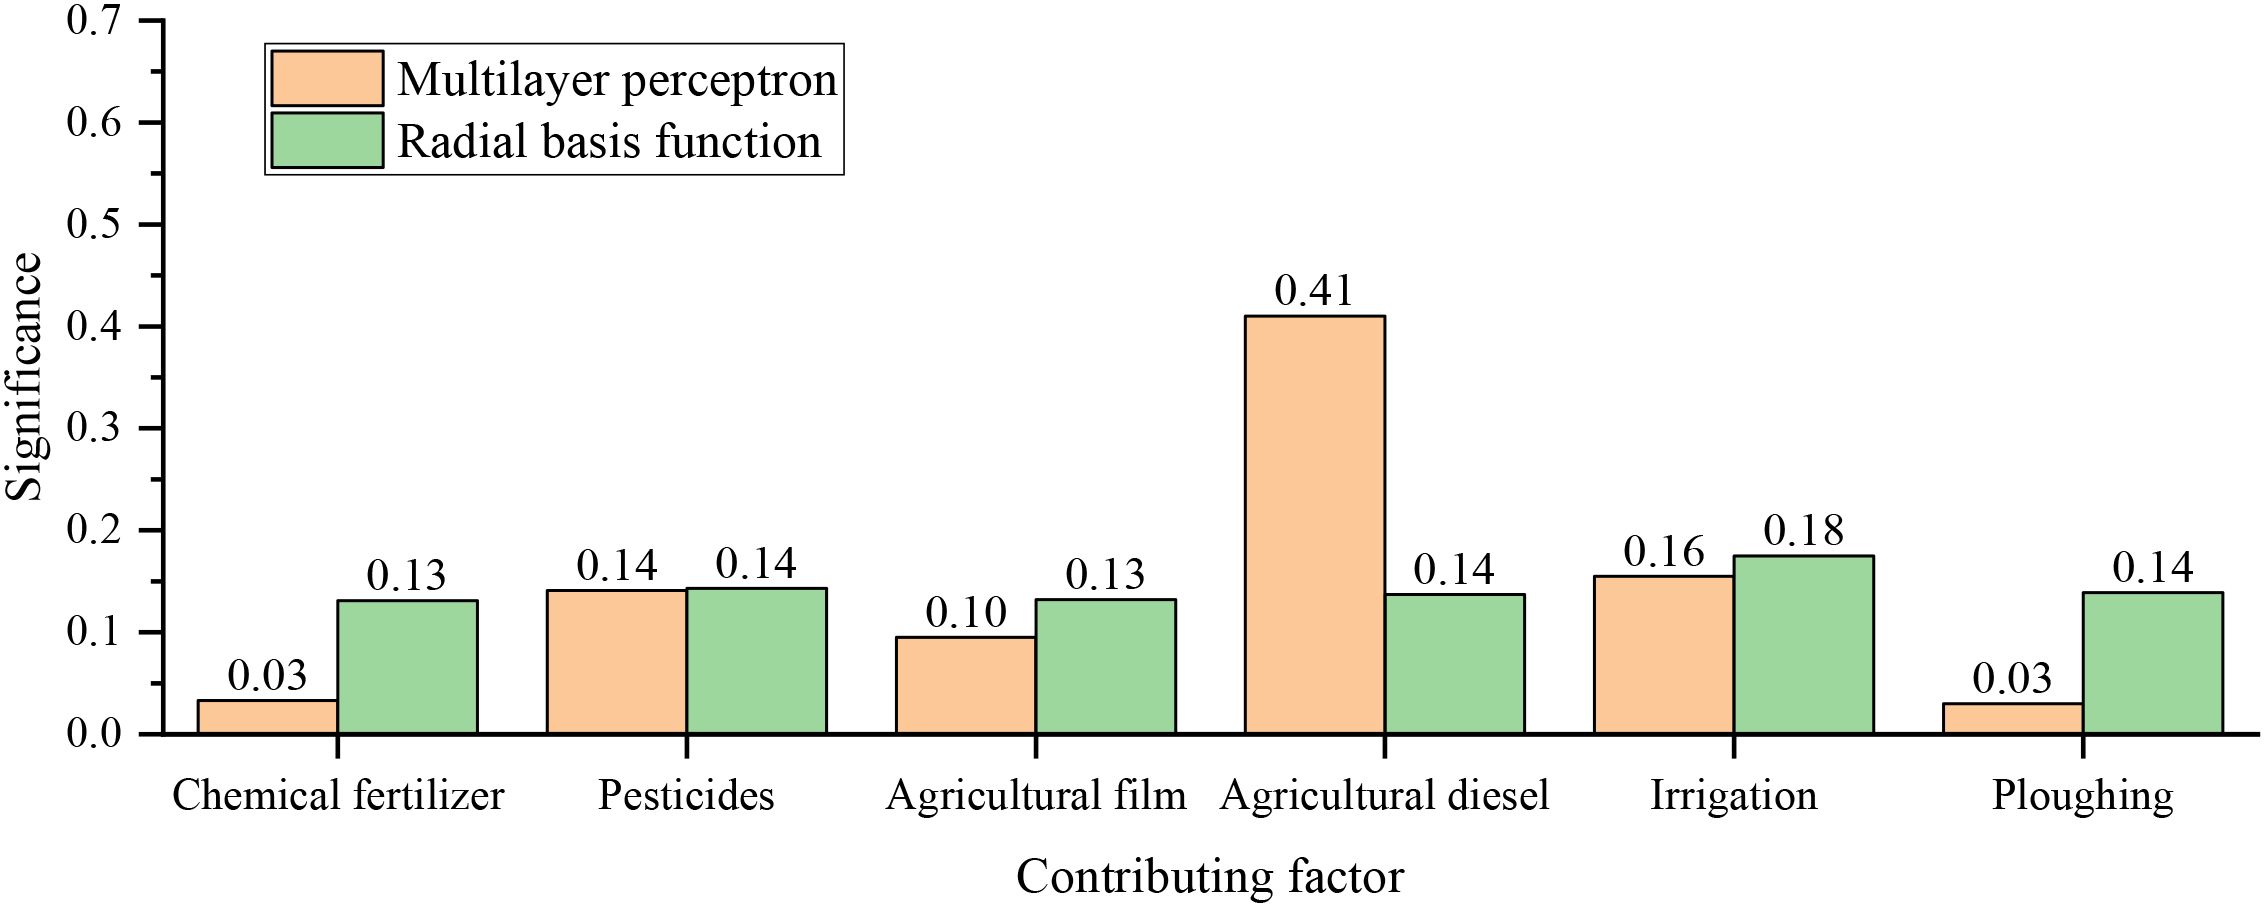
Figure 4. Importance analysis of influencing factors.
Figure 4 shows the importance of each influence factor under the two neural network models. Figure 4 shows that in the multi-layer perceptron model, the order of importance of influencing factors is Agricultural diesel >Irrigation > Pesticides > Agricultural film > Chemical fertilizer > Ploughing. In the RBF model, the order of importance of influencing factors is Irrigation > Agricultural diesel =Ploughing = Pesticides >Chemical fertilizer = Agricultural film.
The importance of influencing factors reflects their role in neural network models. As can be seen from Figure 4, in the multi-layer perceptron model, the weight difference of each influencing factor is obvious, among which the importance of agricultural diesel is the highest, the importance of fertilizer and ploughing is less. In the RBF model, the importance arrangement of each influencing factor is relatively close, which is concentrated in the range of 0.13~0.18, indicating that the model is not sensitive to the perception of each influencing factor and cannot distinguish the importance of all influencing factors, resulting in low accuracy of regression prediction.
As can be seen from Figure 4, the carbon emission prediction results obtained by the two neural network models of multi-layer perceptron and radial basis function have a high similarity with the original recovery result. In order to analyze the fitting degree of the two models in detail, the residual (δi) and correlation coefficients () of the two prediction results should be calculated. as shown in Figure 5.
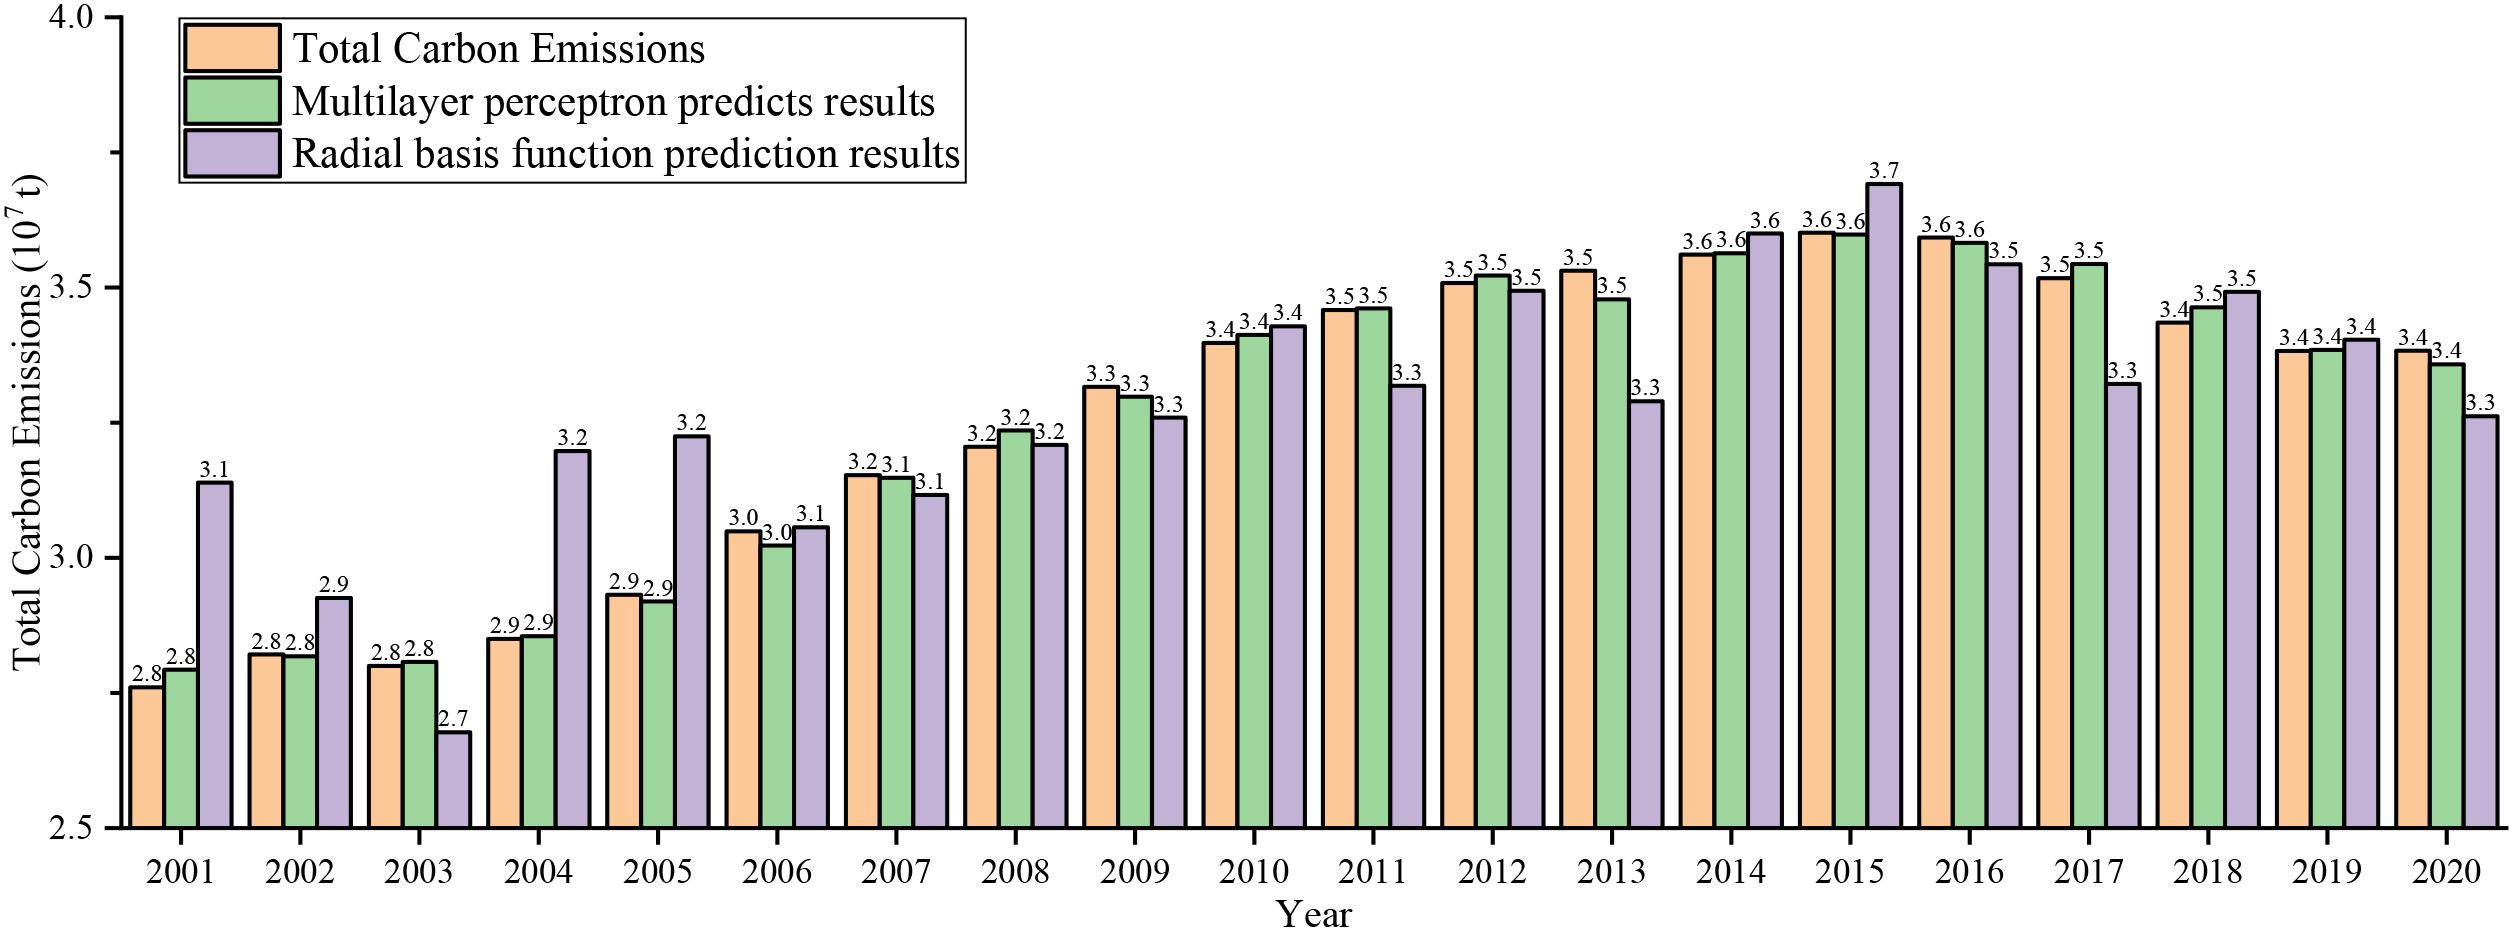
Figure 5. Neural network model prediction results.
The Figure 6 shows that the absolute value of multilayer perceptron residual ∈[0,0.06], correlation coefficient R2 = 0.998. the absolute value of radial basis function residual ∈[0,0.4], correlation coefficient R2 = 0.933. the accuracy of multilayer perceptron is obviously higher than that of radial basis function. The results show that the accuracy of the multi-layer perceptron is obviously higher than that of the radial basis function, and it has a good effect on the regression and prediction of total agricultural carbon emissions. Therefore, the multi-layer perceptron is selected for further prediction calculation.
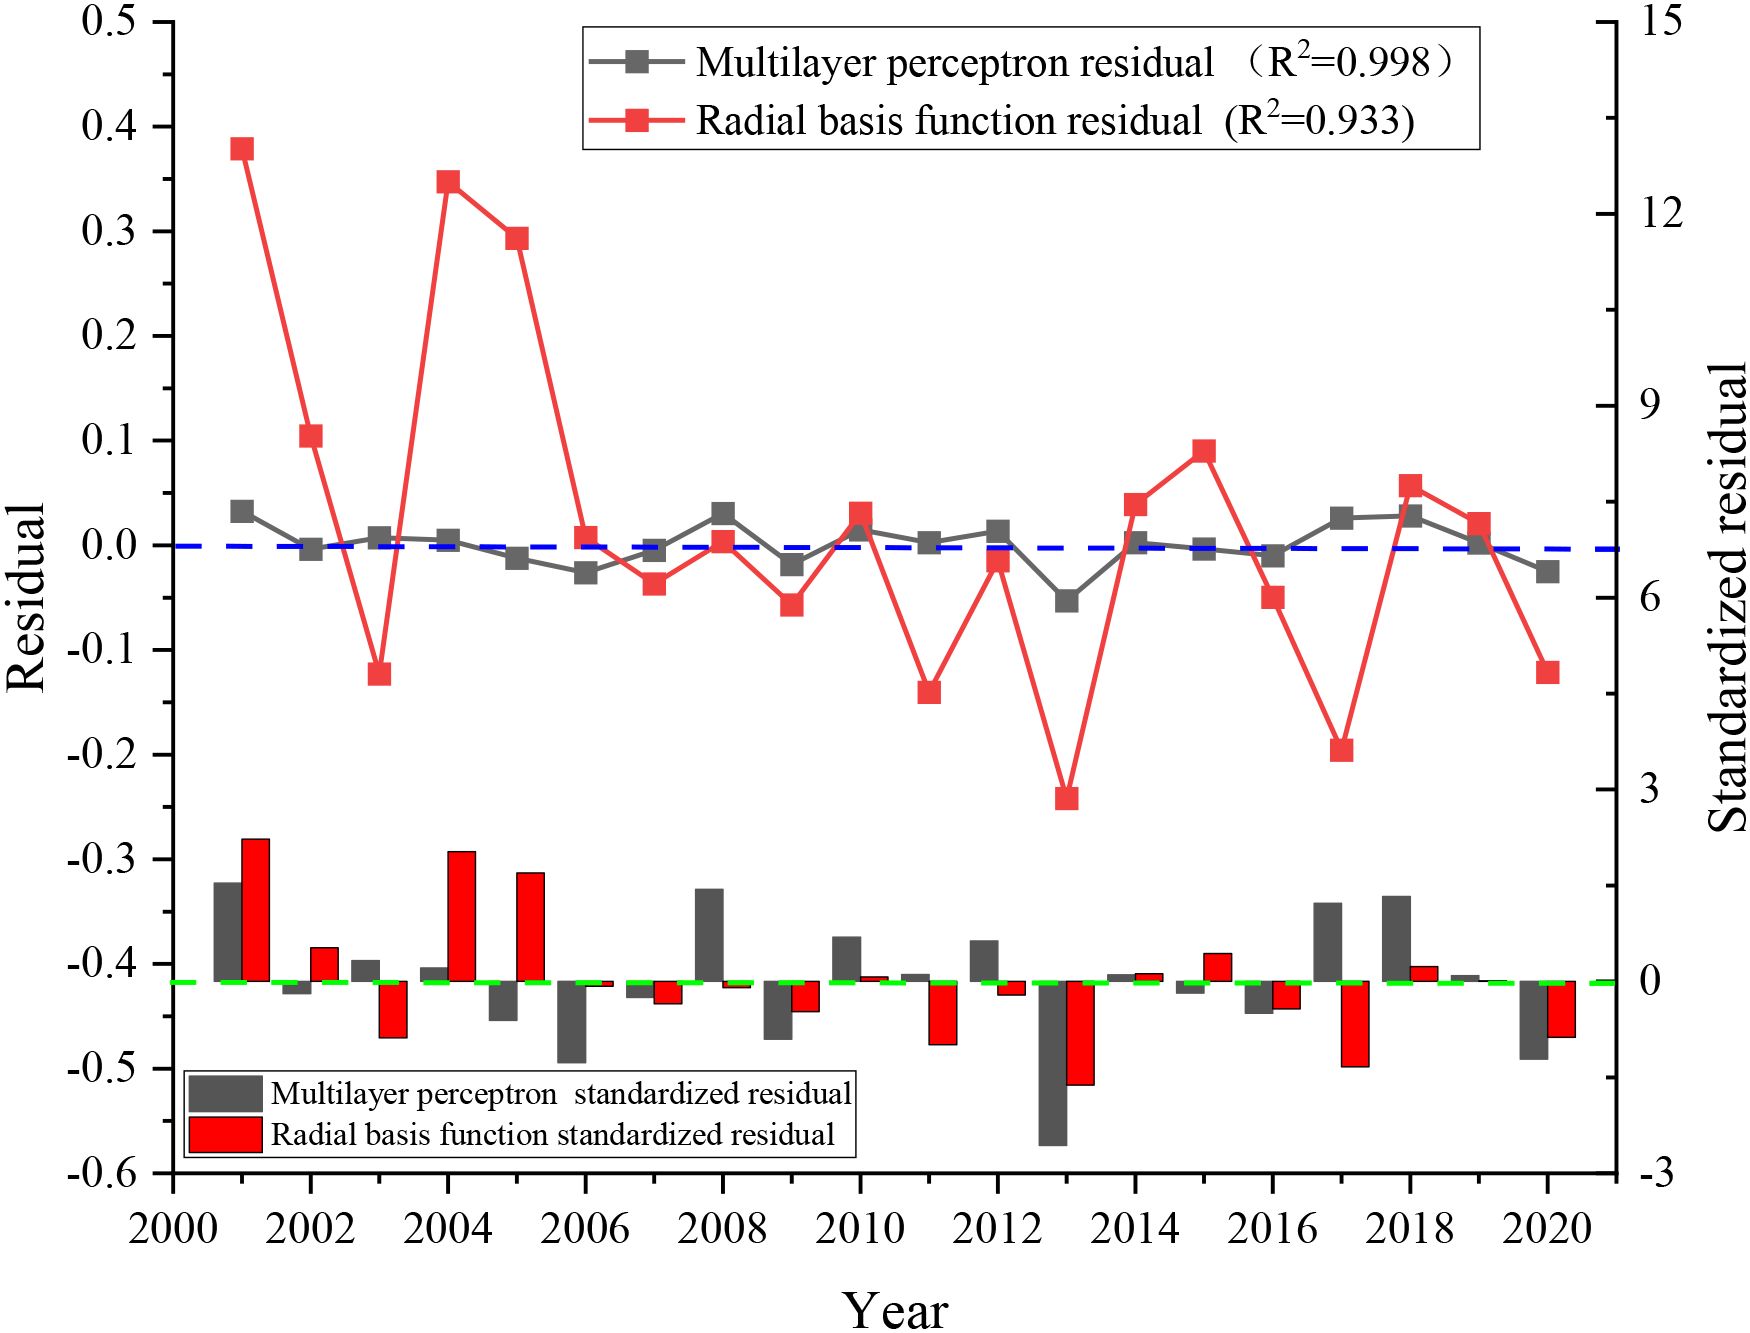
Figure 6. Residual analysis of neural network prediction results.
2.2 Nonlinear prediction model based on complex plane
2.2.1 Classification of influencing factors
In this section, the nonlinear surface fitting method is used to analyze the variation rule of total carbon emission with each influencing factor (Zhang et al., 2022). First, SPSS software was used to analyze the linear correlation between total carbon emissions and various influencing factors, as shown in Table 1. In Table 1, A: Agricultural film, B: Chemical fertilizer, C: Ploughing, D: Agricultural diesel, E: Irrigation F: Pesticides, CE: Carbon Emissions.

Table 1. Correlation analysis between total carbon emission and influencing factors.
As can be seen from Table 1, different from the importance of each factor in the neural network model, correlation analysis shows that the Pearson (Aldrich (1995); Tjostheim et al. (2022) correlation between each factor and the total carbon emission is as follows in descending order: chemical fertilizer, agricultural film, agricultural diesel, ploughing, pesticide and irrigation.
The six influencing factors are not independent variables. In order to better analyze the impact of these influencing factors on total carbon emissions, the six influencing factors are grouped and multidimensional prediction is made. First, each influencing factor is grouped in pairs to obtain 15 permutations, as shown in Table 2.
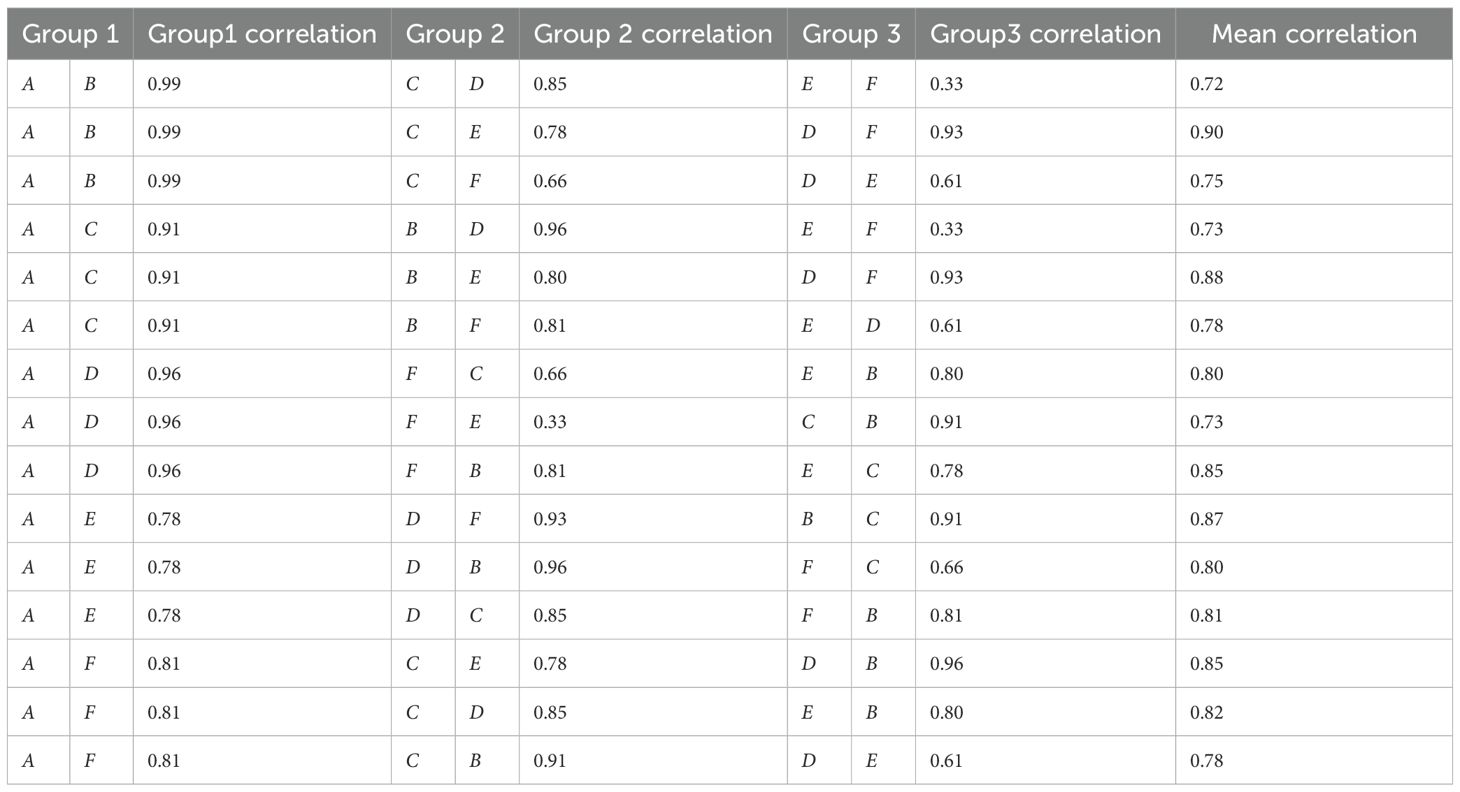
Table 2. Correlation grouping.
Calculate the mean value of the correlation coefficients of the influencing factors of the three groups corresponding to each permutation in Table 2. The greater the mean value, the greater the correlation of the influencing factors in each group in the permutation. The average correlation of the second group was the highest of 0.90, so the second category was selected for calculation: was agricultural film and chemical fertilizer, was tillage and irrigation, and was diesel oil and pesticide. , and correspond to two influencing factors respectively, as shown in Table 3. Assume that Total Carbon Emissions is Z. Since Chemical fertilizer, Agricultural film, Agricultural diesel, Ploughing, Pesticide and Irrigation are not completely independent parameters, in order to simplify calculation and increase the principle of visibility, imaginary units j and i are introduced, and Z is divided into three parts, namely (Equation 3):
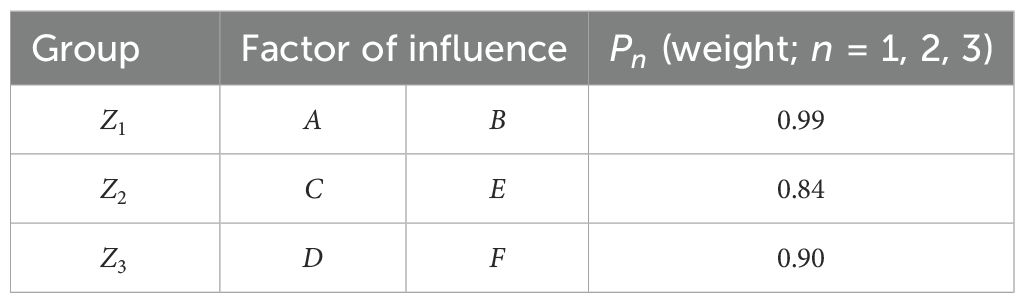
Table 3. Weight of group.
Therefore (Equation 4):
2.2.2 Model establishment
As shown in Table 3, Let a, b and c be the weights of , and respectively, then = and = , As shown in Equation 5.
Three-dimensional nonlinear fitting surfaces of {= Chemical fertilizer, = Agricultural film, }, {= Ploughing, = Irrigation, } and {= Agricultural diesel, = Tillage, } were established respectively, as shown in Figure 7. The fitting formula is shown in Equation 6.
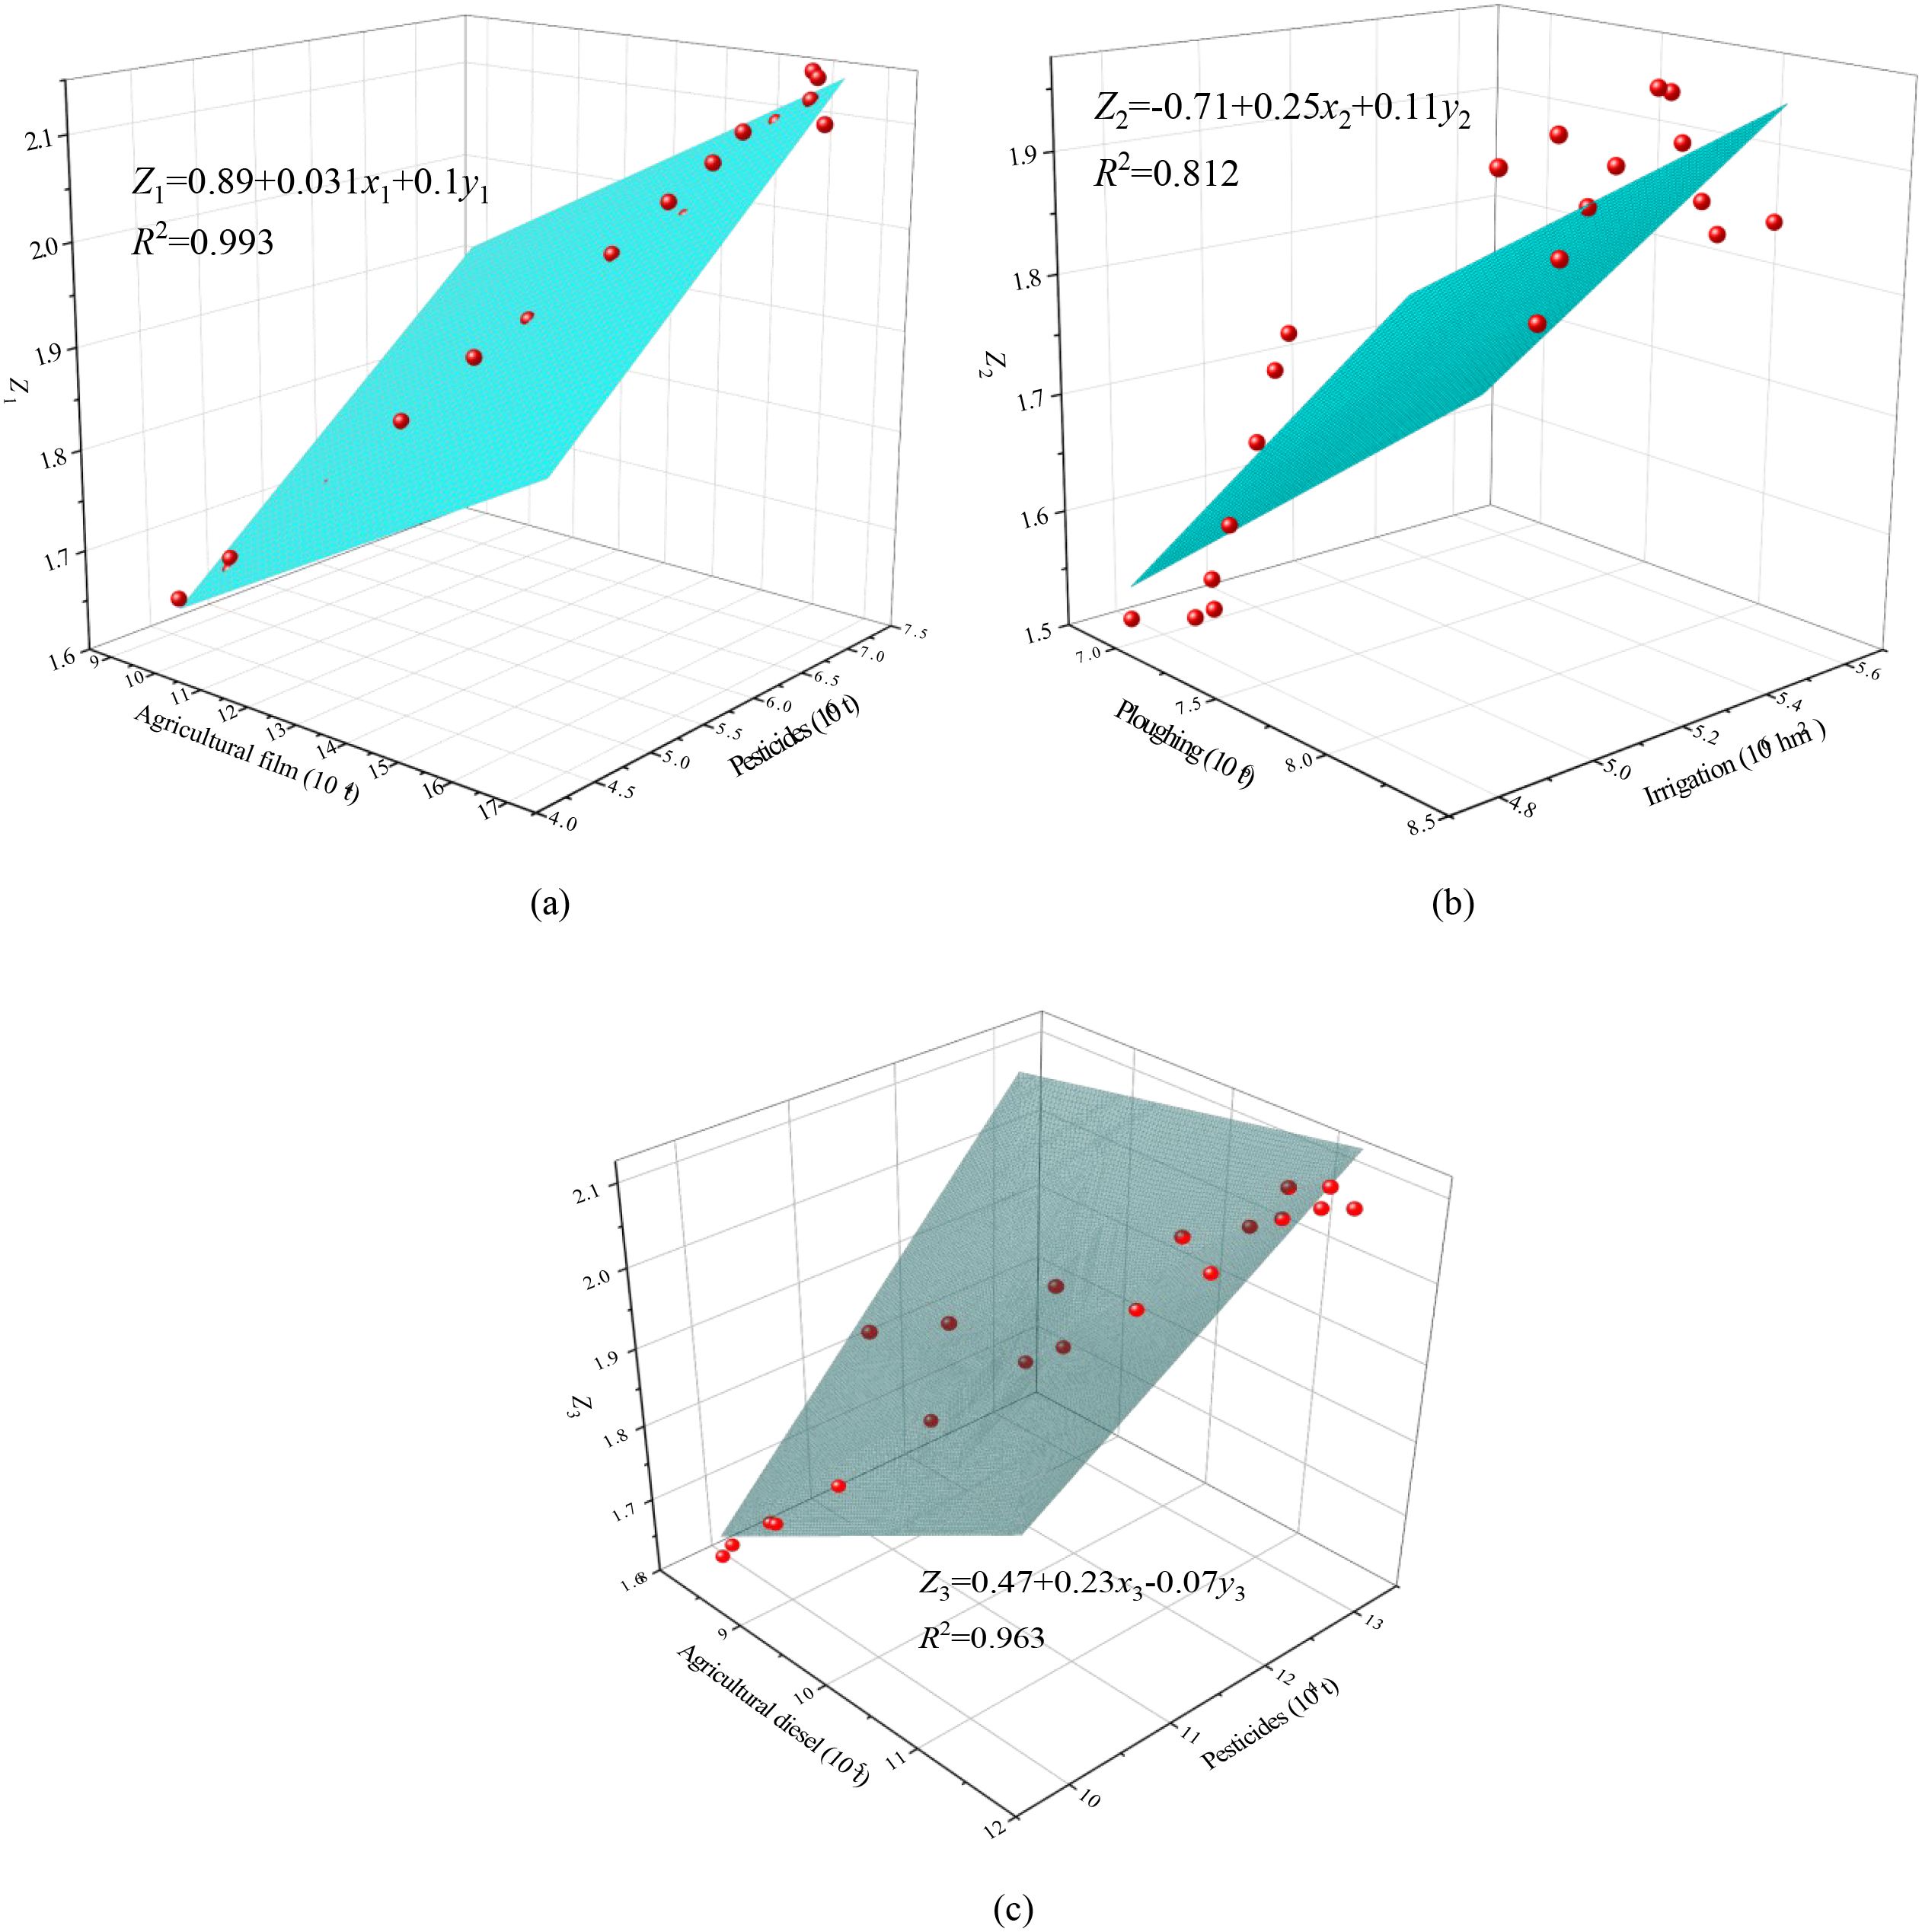
Figure 7. The fitting formula of each influencing factor. (A) . (B) . (C) fitting formula.
By substituting Equation 6 into Equation 3, the fitting formula of total carbon emission based on six influencing factors can be obtained:
Equation 7 represents the influence rule of the six influencing factors on the total carbon emission. The calculation results of the real and imaginary parts of Equation 7 are combined with their corresponding years to draw a three-dimensional dot plot, as shown in Figure 8.
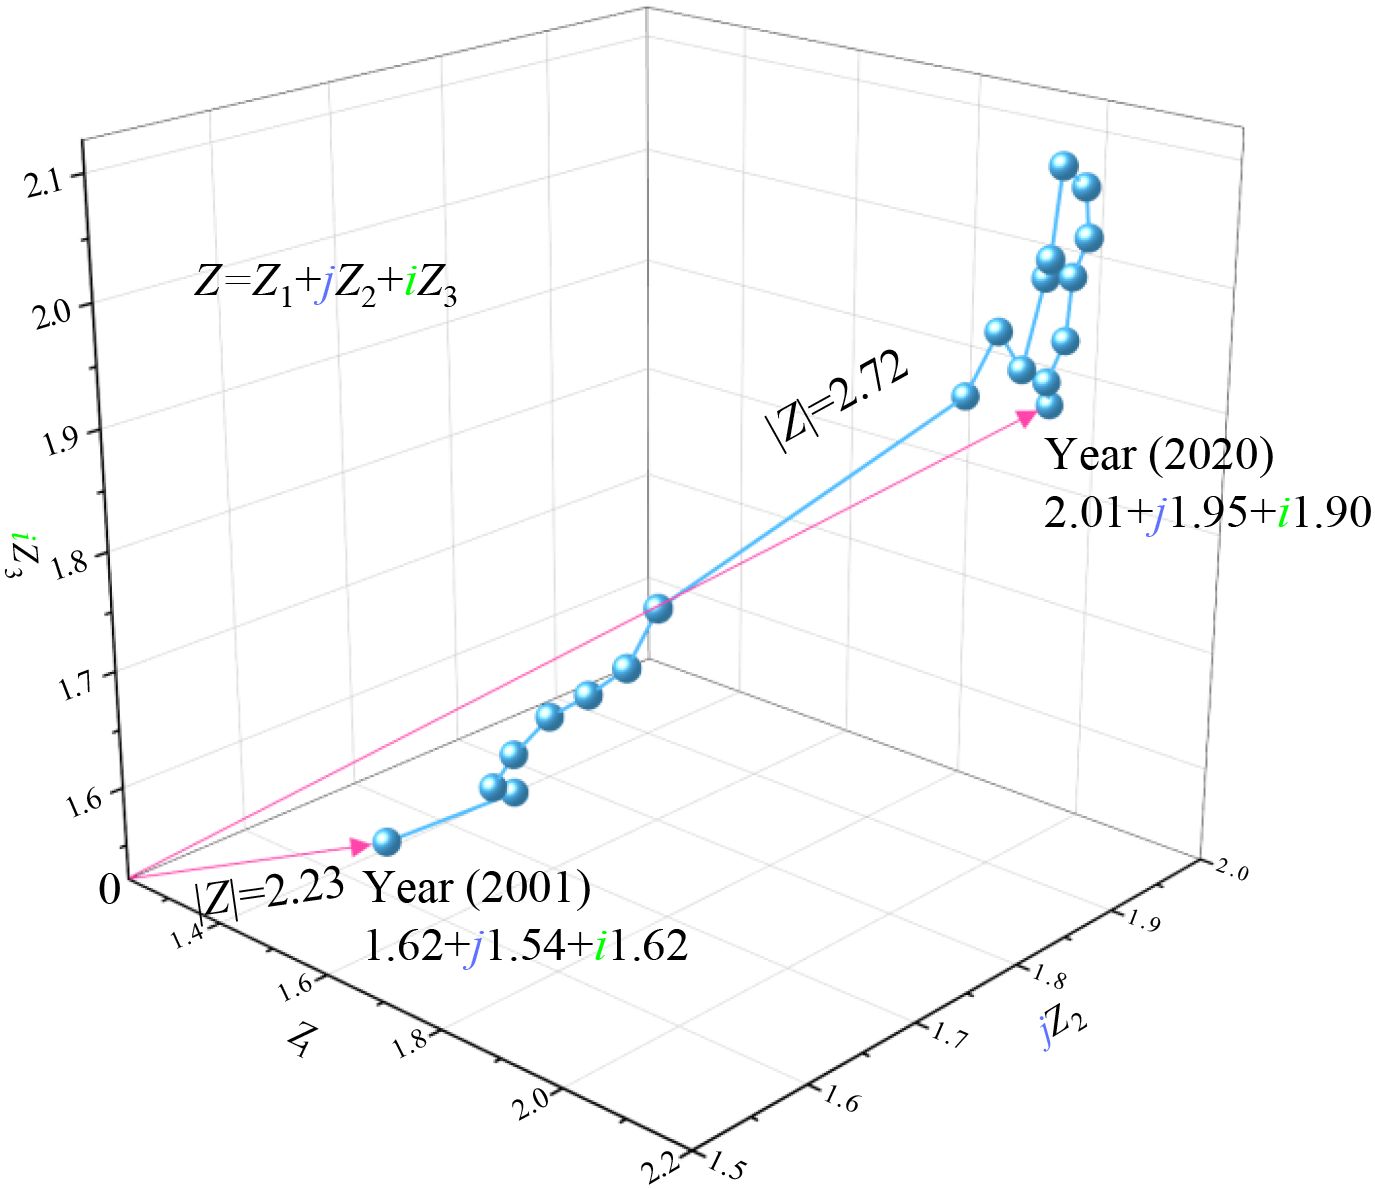
Figure 8. Complex plane model diagram.
The prediction results of the carbon emission model were calculated by Equation 7. To further analyze the trend of total carbon emissions over years, quadratic polynomial fitting was performed on the prediction curve, and the curve of carbon emissions over years was obtained as follows (As shown in Equation 8):
The influencing factors of agricultural carbon emissions were substituted into polynomial calculation. Figure 9 shows the comparison between the predicted results and the actual agricultural carbon emissions. The overall development trend of the two is unchanged, and the numerical difference is small. As can be seen from Figure 10, the absolute value of multilayer perceptron residual ∈[0,0.1], and the standardized residual value is mostly located at [-2, 1.5]. The correlation coefficient between the calculated actual value and the predicted value R2 = 0.974, indicating that the polynomial can better fit the predicted results of the model.
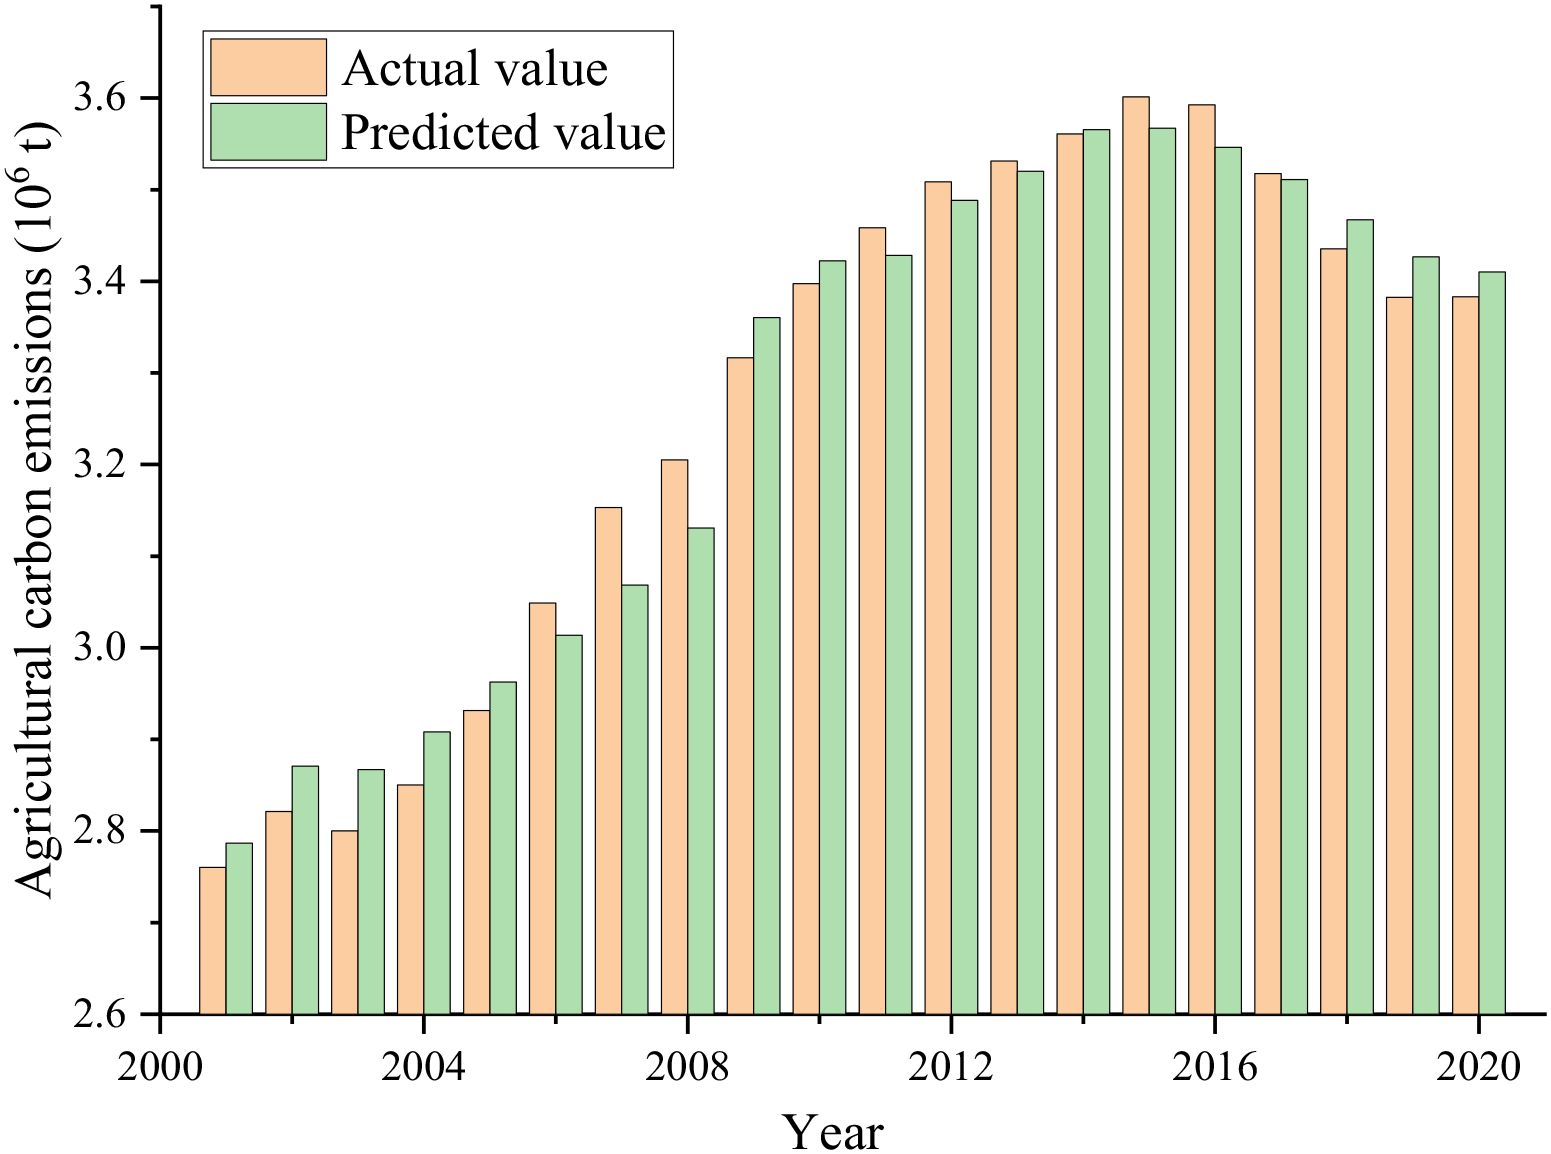
Figure 9. Nonlinear surface prediction model results.
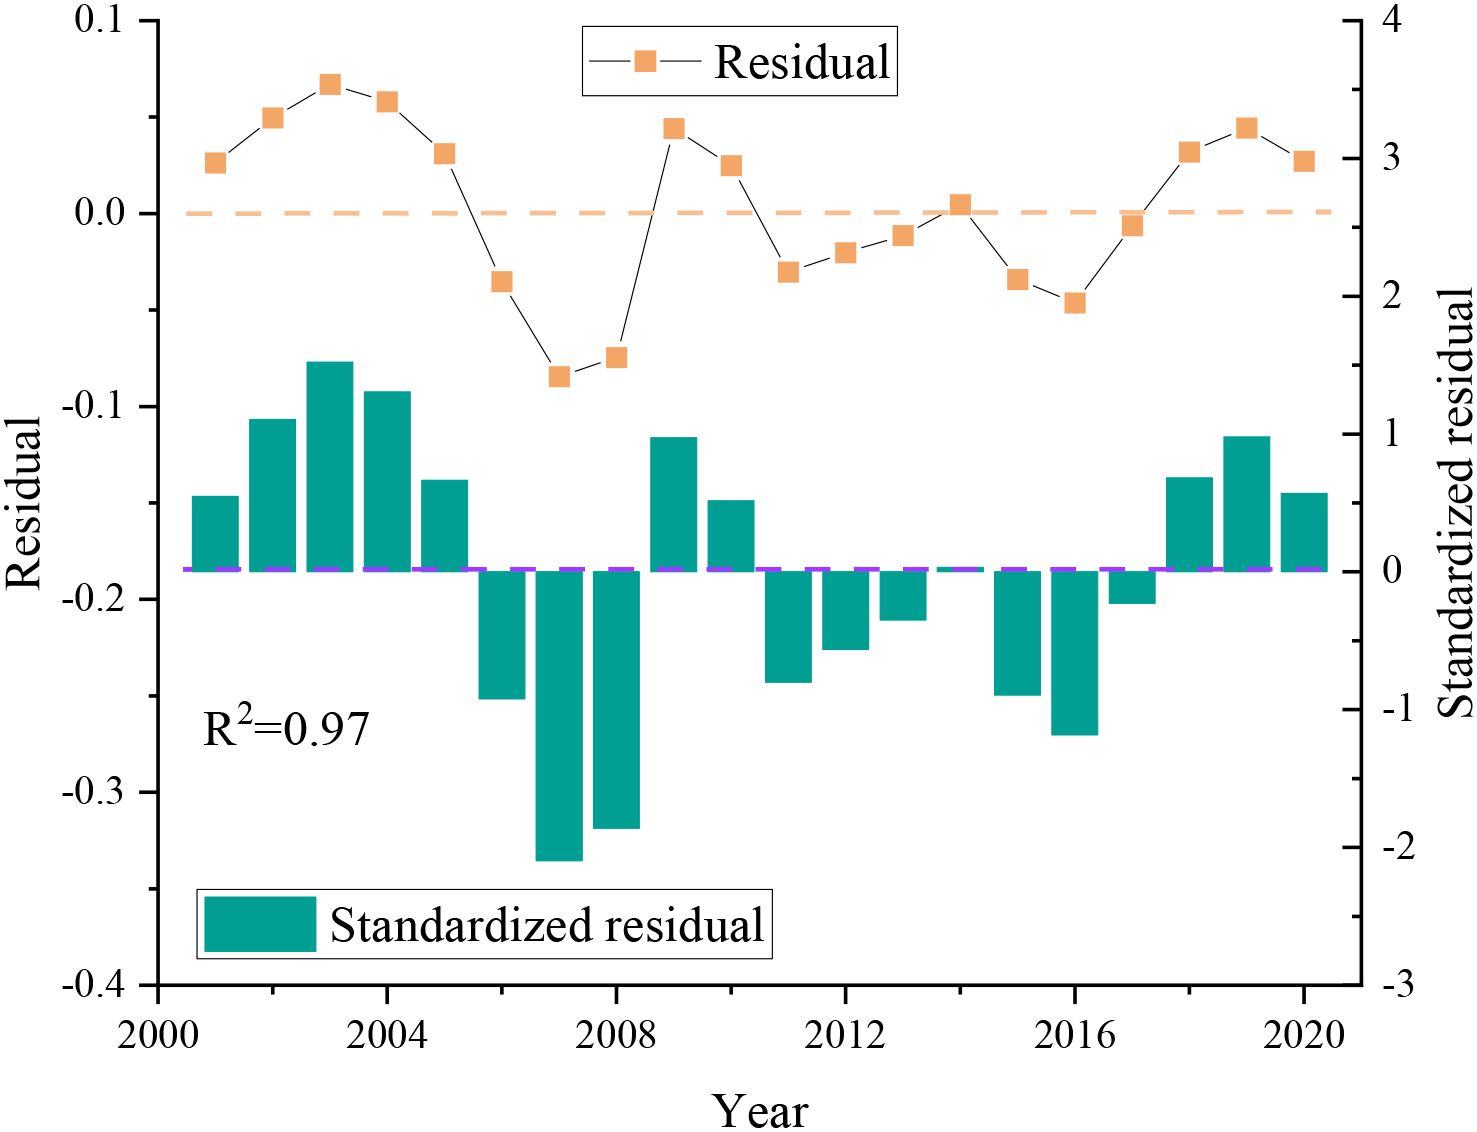
Figure 10. Residual analysis of nonlinear surface prediction results.
3 Predicted results
3.1 Backward prediction of each influencing factor
In order to use the model established in section 2 to predict agricultural carbon emissions, it is necessary to first determine the future trend of each influencing factor. Therefore, the Gaussian multi-peak fitting method is adopted in this section to fit the data and time of six factors affecting agricultural carbon emissions.
Before the calculation, the scatter plot was used to test the data of each factor. According to Figure 10, irrigation data in 2013 and 2014 were significantly different from the overall curve trend and were identified as outliers. In order to make the model more accurate, we eliminate the two outliers and use the Lagrange interpolation method to approximate the function. The specific steps are as follows: take three points before and after the notch to construct the interpolation polynomial P5(x). After calculation, the remaining term is less than 3.2*10-3, which meets the accuracy requirements. The polynomial was used to recalculate the data at the year =2013 and 2014, and the corrected agricultural film-time scatter plot was obtained, as shown in the red dot in Figure 11.
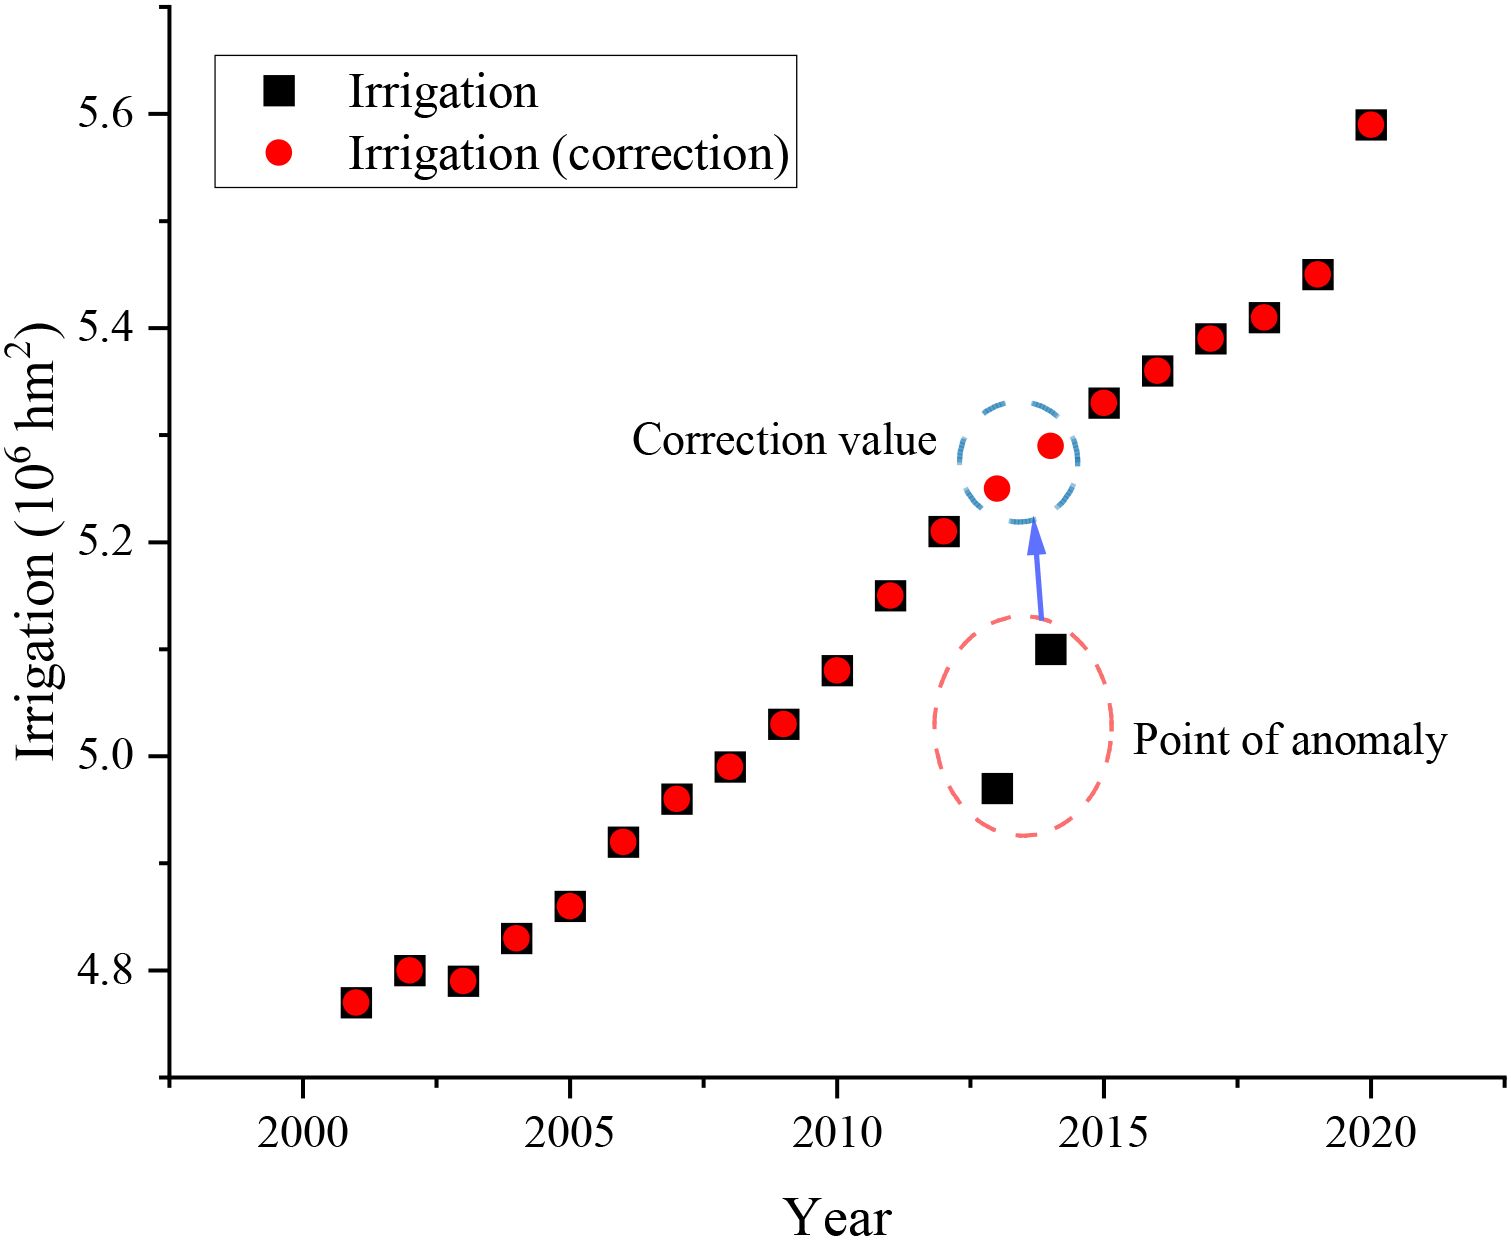
Figure 11. Test of outliers.
As shown in Figure 12. the fitting formula of agricultural diesel is as follows (As shown in Equation 9):
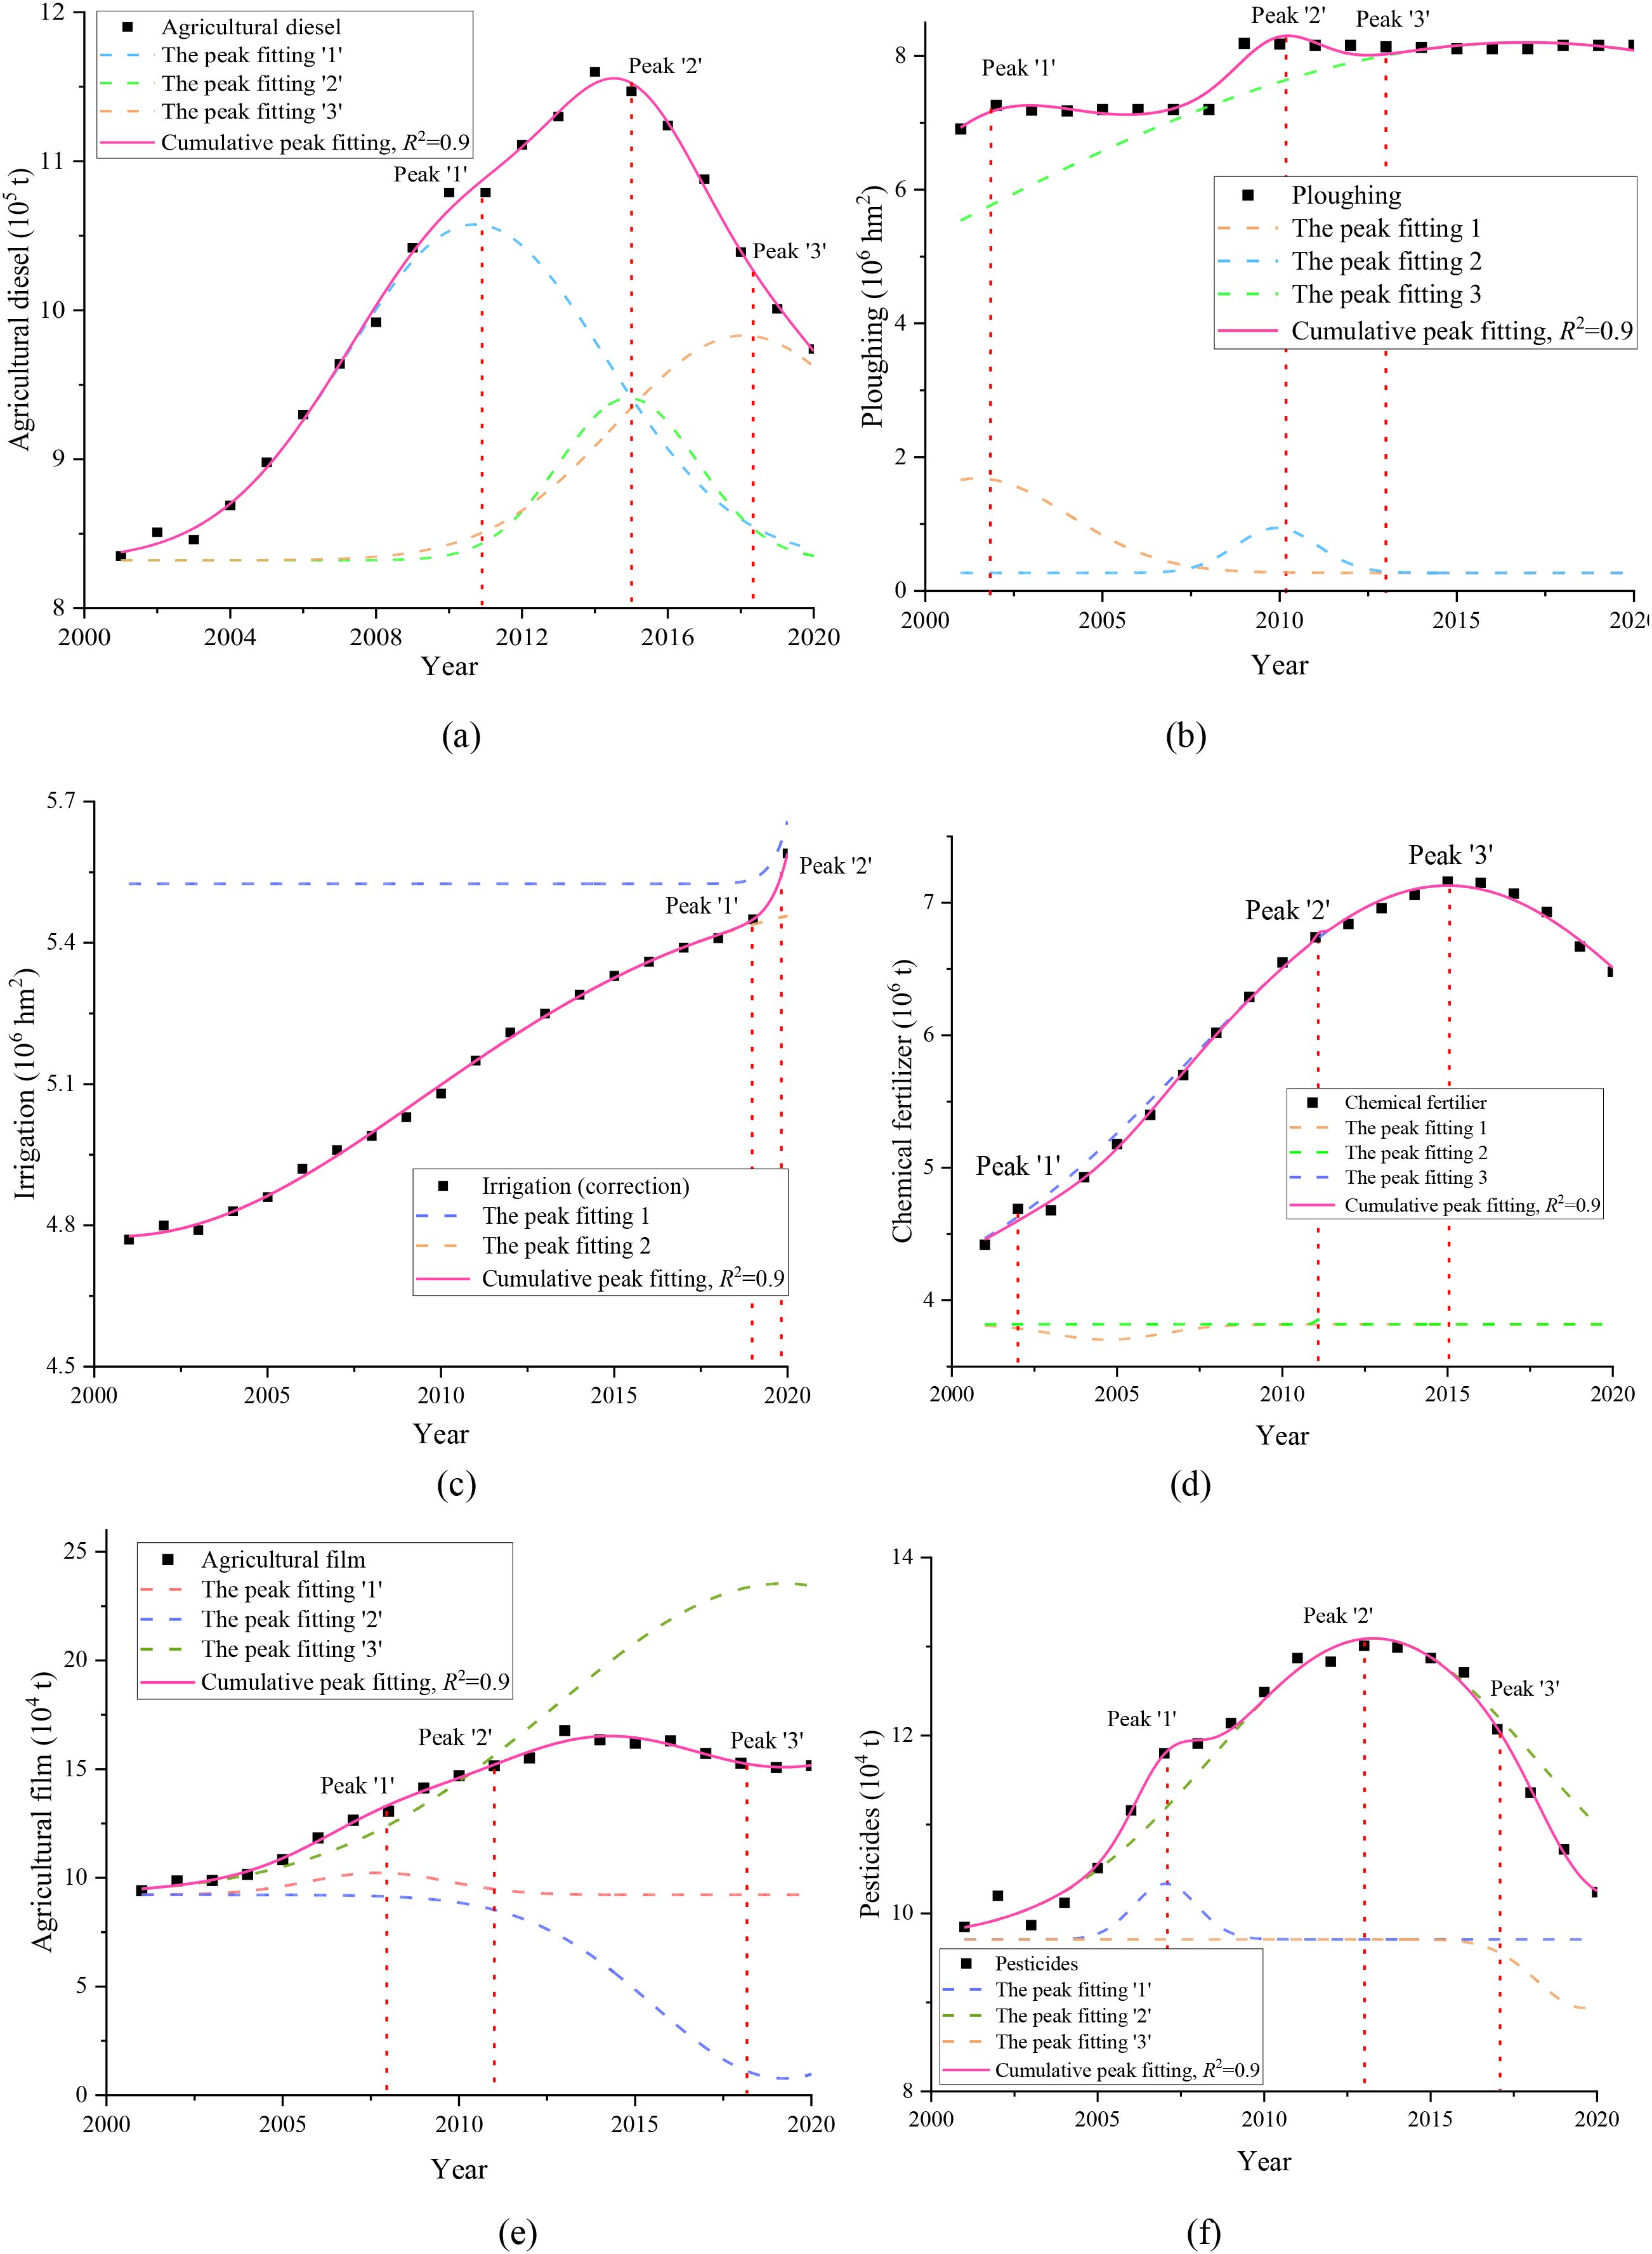
Figure 12. Gaussian multi-peak fitting results. (a) Agricultural diesel. (b) Ploughing. (c) Irrigation. (d) Chemical fertilizer. (e) Agricultural film. (f) Pesticides.
According to the above steps, calculate the fitting formula for the remaining influencing factors.
The fitting equation of each influencing factor is obtained through customs clearance calculation to predict the data of the next ten years, and the prediction results are shown in Figure 13.
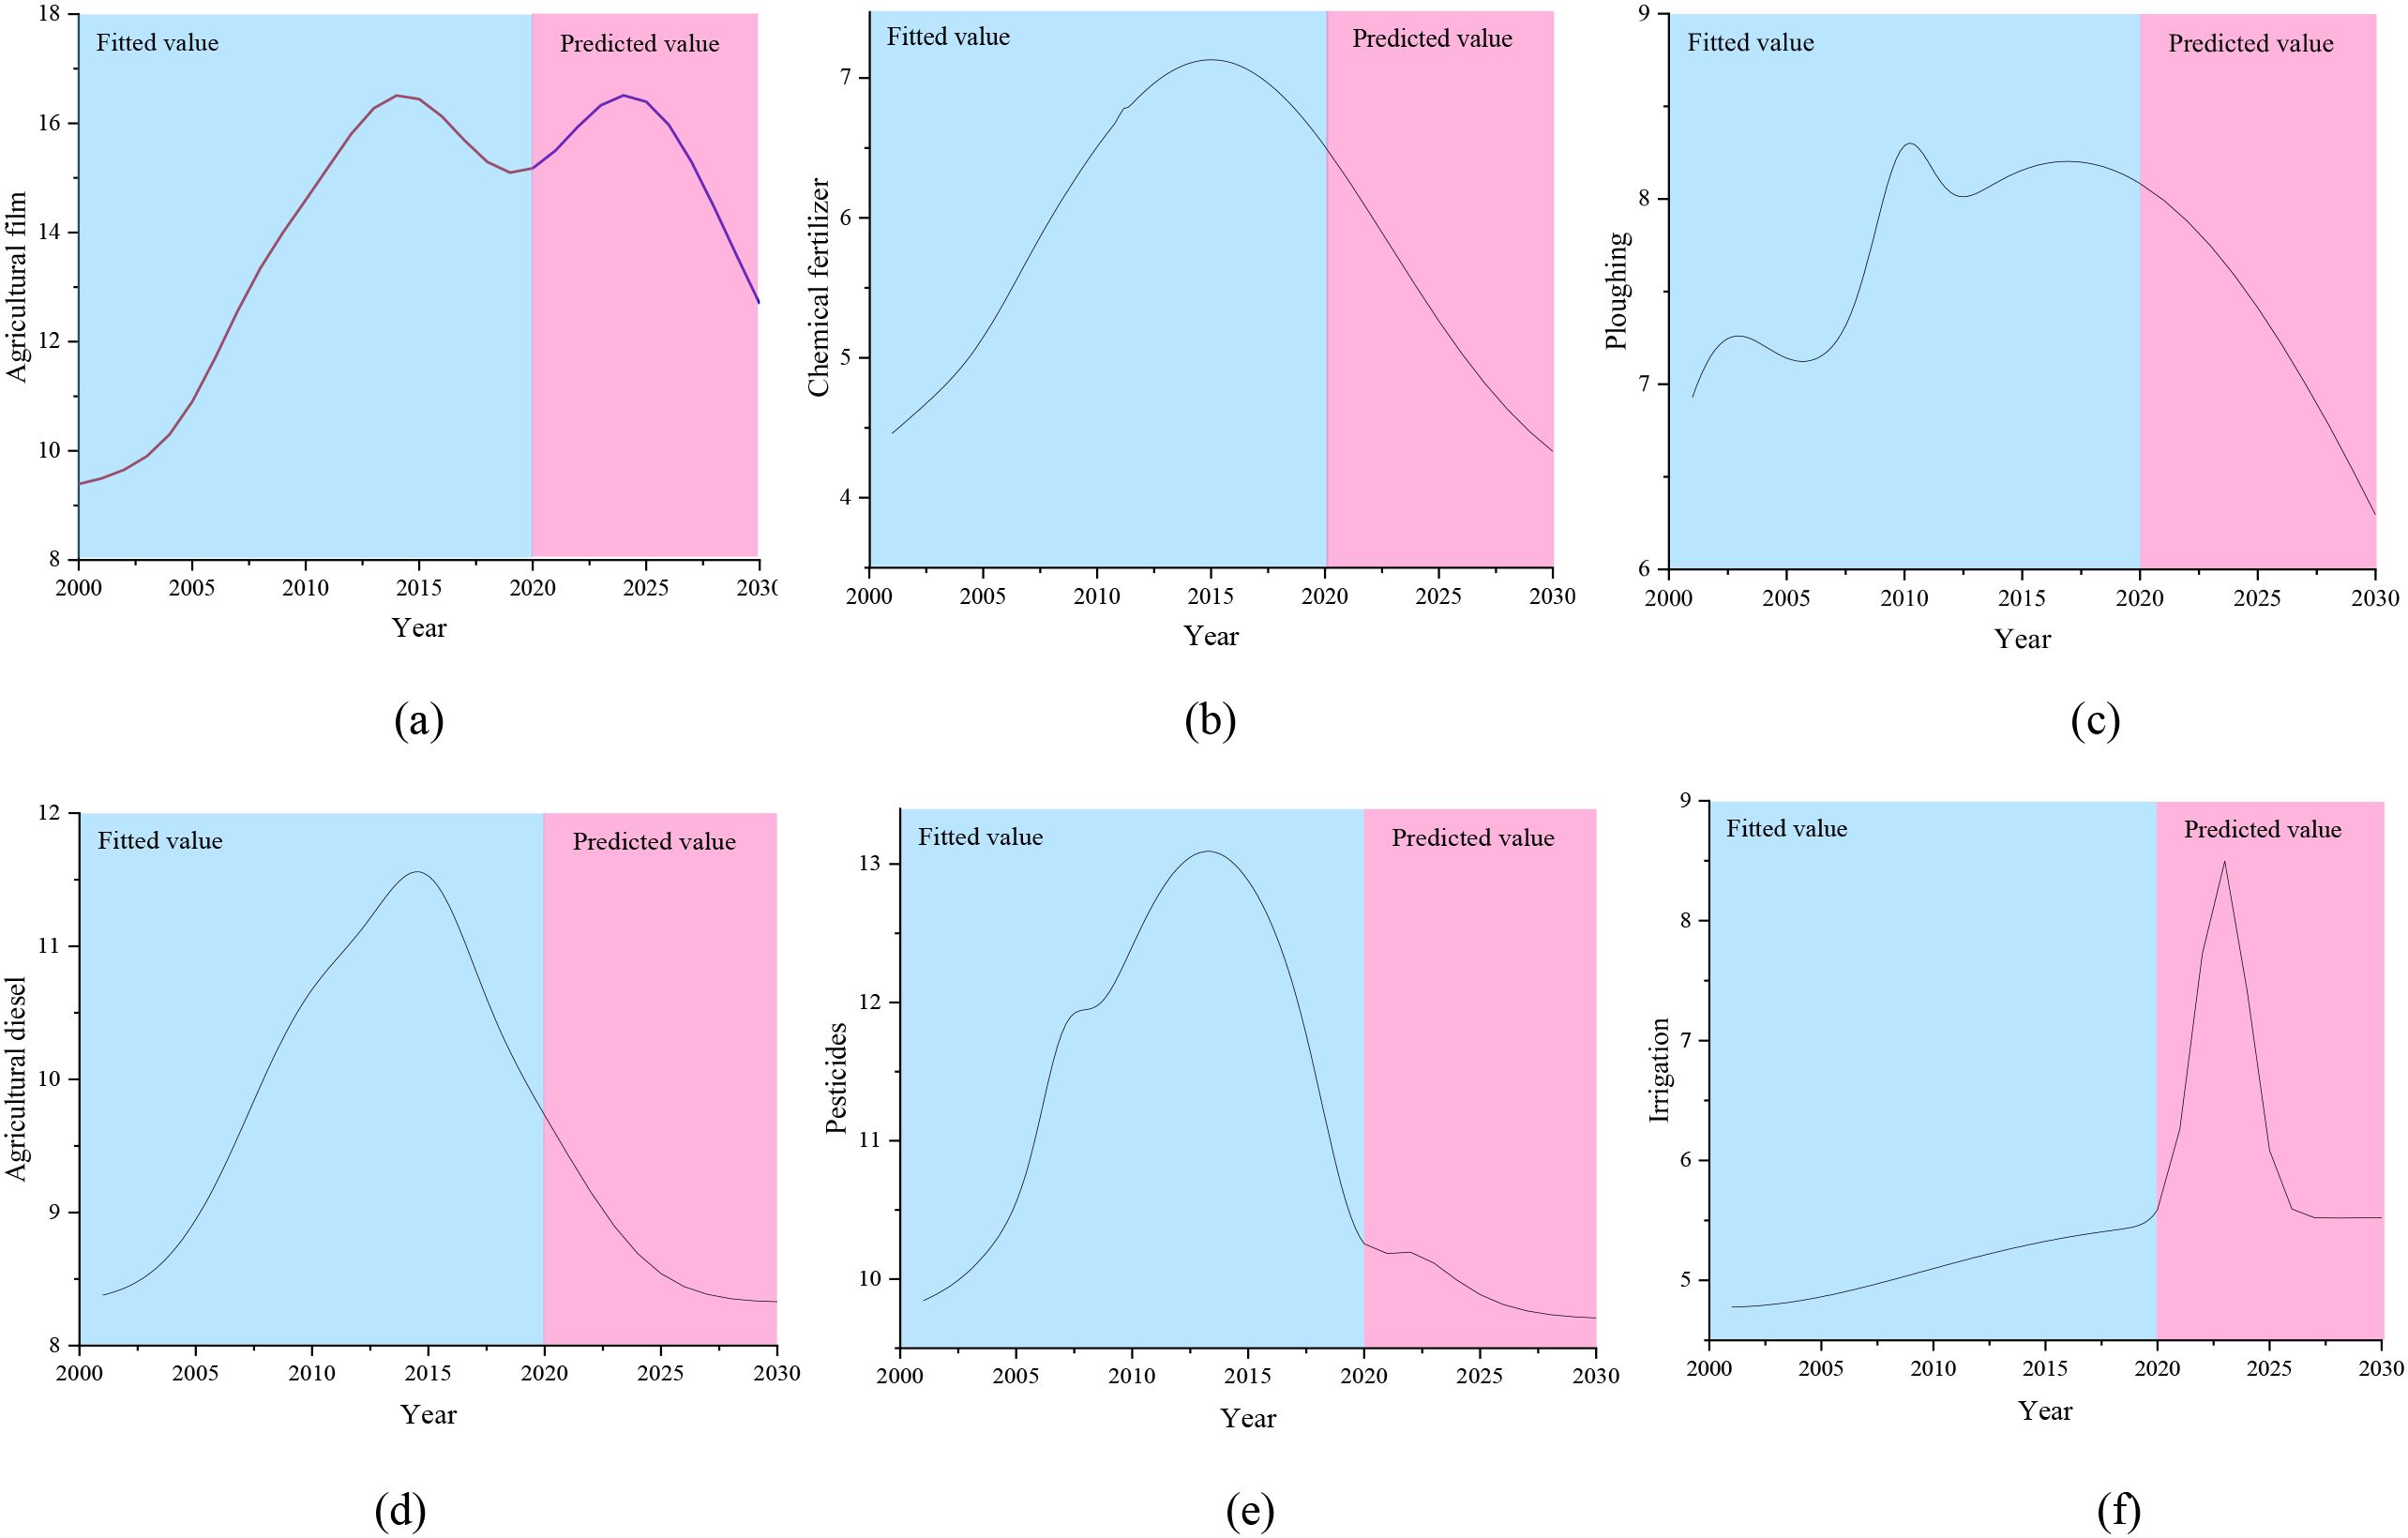
Figure 13. Predicted results of each influencing factor. (a) Agricultural film. (b) Chemical fertilizer. (c) Ploughing. (d) Agricultural diesel. (e) Pesticides. (f) Irrigation.
It can be seen from the above figures that the development trend of each influencing factor presents a trend of gradual development after a rise, and each factor reaches its peak and gradually declines between 2015 and 2025. Through the above function calculation, the predicted results of each factor after 2021 are as follows (Table 4):
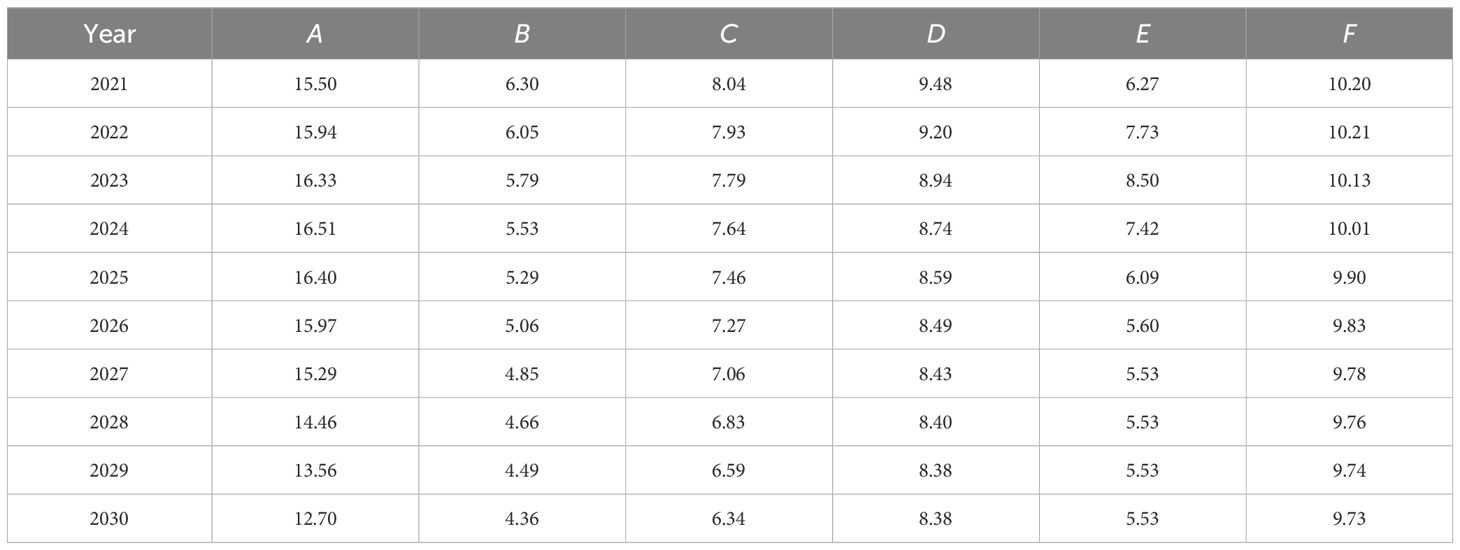
Table 4. Prediction results of each influence factor.
3.2 Analysis of carbon emission prediction results
The prediction results of each factor by Gaussian multi-peak fitting in Section 4 were respectively put into the multi-layer perceptron model and nonlinear surface fitting model for prediction calculation. The agricultural carbon emission data in the next ten years were obtained and the curve was drawn as follows:
The blue shaded part in the figure is the fitting effect diagram of the actual value. As can be seen from the Figure 14, the first stage was from 2001 to 2012, when agricultural carbon emissions in Henan Province rose rapidly. In the second stage, from 2012 to 2015, agricultural carbon emissions rose slowly and reached a peak, and then showed a downward trend after 2015. Henan Province is the core producing area of grain production in China, and its cultivated land area ranks the third in China. From 2001 to 2012, with the abolition of China’s agricultural tax and the rapid development of agriculture in Henan Province, the consumption of chemical fertilizer, agricultural diesel, irrigation and agricultural film in agricultural production increased significantly, resulting in a rapid growth of total agricultural carbon emissions. With the promotion of modern agricultural production system and the gradual improvement of production efficiency from 2012 to 2015, agricultural carbon emissions showed a slow growth, and showed a downward trend after 2015.In the third stage, there is a downward trend from 2015 to 2020, with the promotion of agricultural modernization in Henan Province, there will be a small increase from 2020 to 2023.
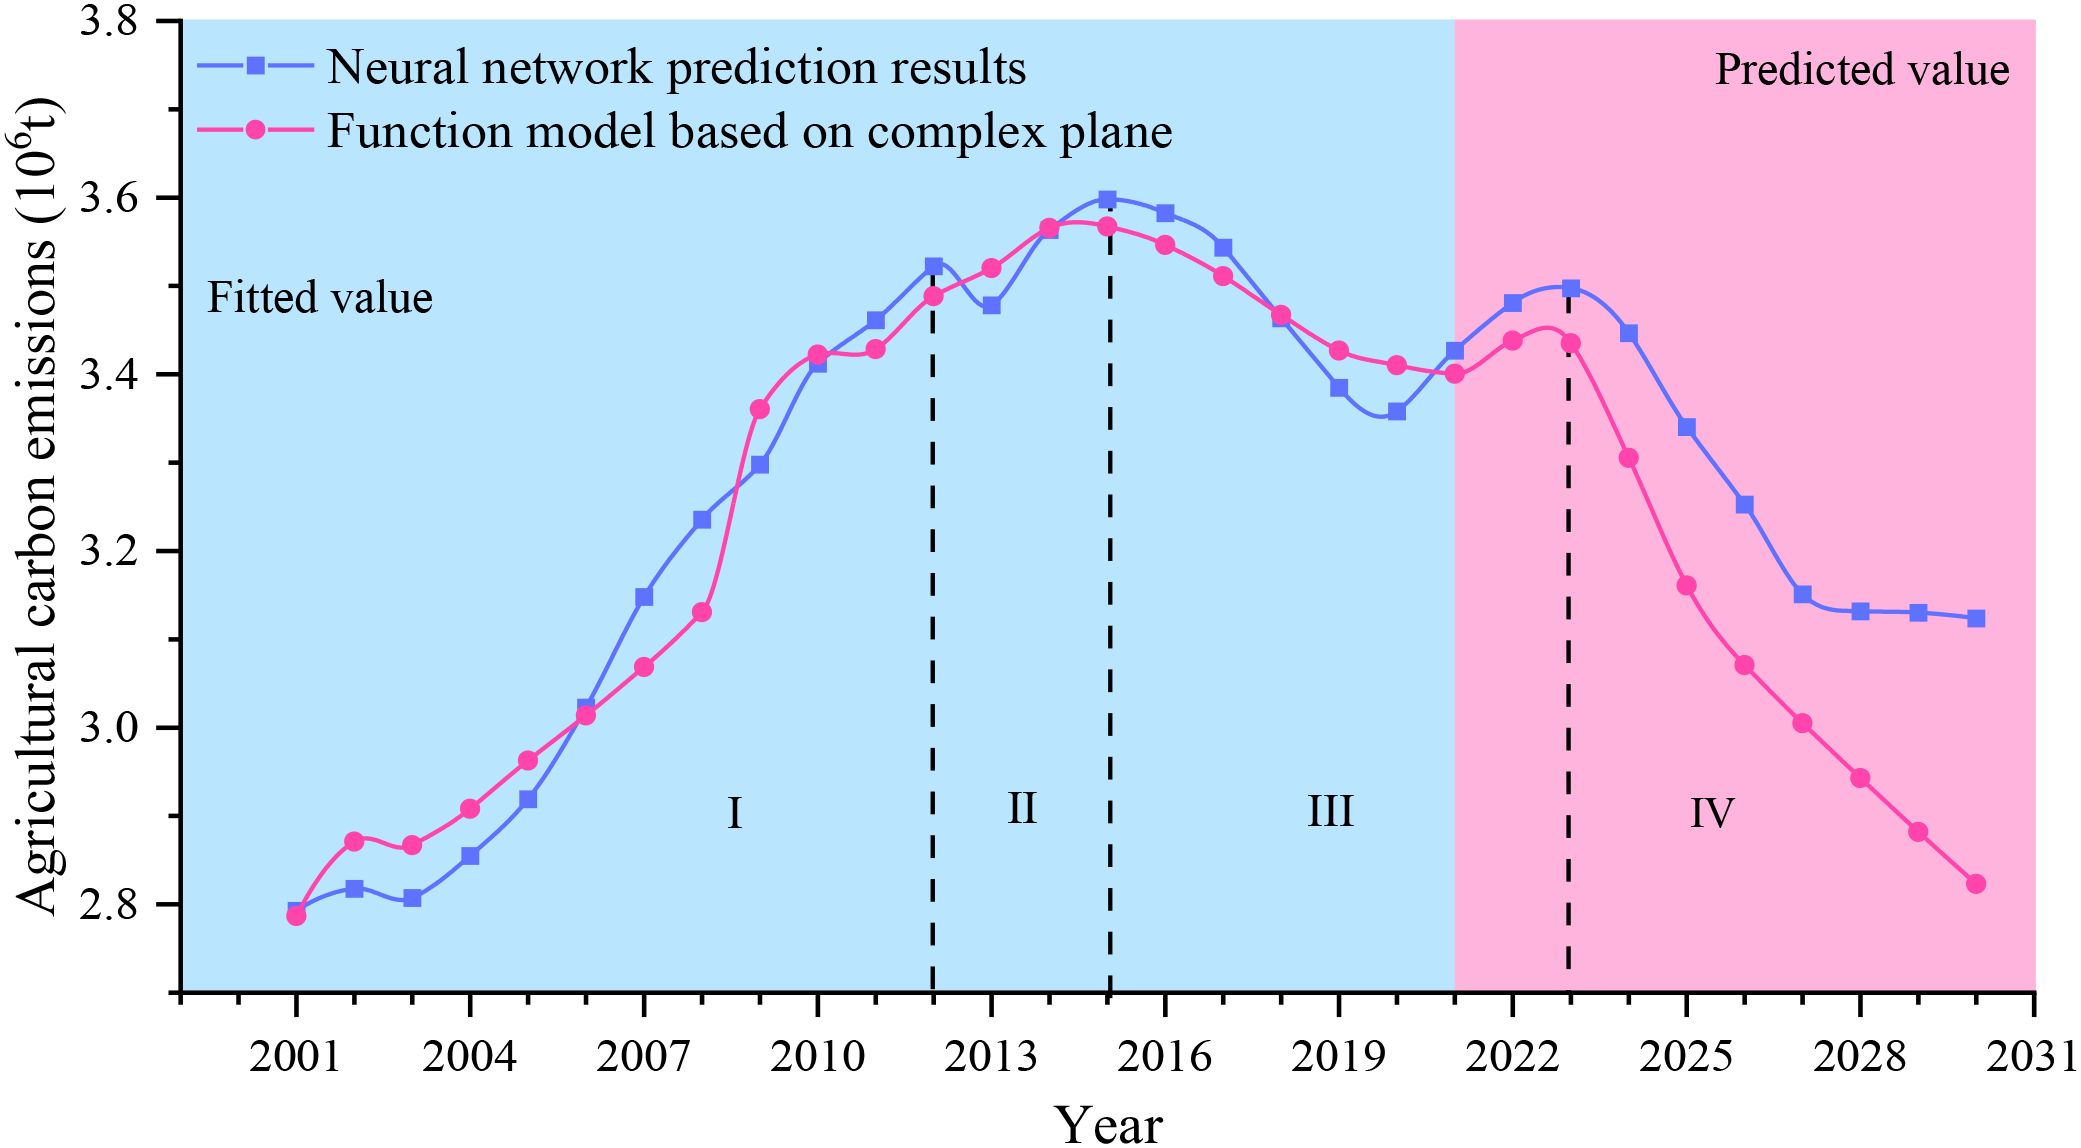
Figure 14. Projections of agricultural carbon emissions.
The pink shaded part of the figure shows the projected agricultural carbon emissions of Henan Province from 2021 to 2030. The first three stages show that the prediction results of the two models are close to each other. In the fifth stage, the prediction results of the two models show great differences. The predicted value of the multi-layer perceptron model is significantly higher than that of the nonlinear surface fitting model, and the downward trend tends to be gentle. This is because the nonlinear surface fitting model is based on the historical function relationship, and the closer the model is to the historical data, the better the prediction effect will be. Conversely, the further the model move away from historical data, the worse the prediction.
With the proposal of carbon neutrality and carbon peaking and the promotion of green sustainable agriculture, agricultural carbon emissions in Henan Province will inevitably show a downward trend. Therefore, the prediction model of agricultural carbon emission proposed in this paper is reasonable.
4 Discussion
Employing neural networks and nonlinear surface fitting with six influencing factors (including chemical fertilizers, pesticides, and agricultural plastic films), this study conducted regression analysis and projection of agricultural carbon emissions in Henan Province. From an interdisciplinary perspective, controlling agricultural emissions constitutes both a technological challenge and a socio-cognitive issue involving transformational producer awareness and societal consensus building.
Amid growing emphasis on green agriculture, the relationship between chemical inputs (e.g., fertilizers/pesticides) and carbon emissions has become a research focal point. Our predictive model offers novel pathways for quantitative analysis. Agricultural carbon emission reduction requires the dissemination of technical optimization protocols and education-driven “green production” principles to farmers. In this process, model predictions can enhance farmers’ intuitive understanding of emission impacts, catalyzing a behavioral shift from passive compliance to active participation (Lyu et al., 2023; Guo et al., 2023). In Henan—China’s core grain production region—integrating our predictions (e.g., post-2015 emission declines linked to policy interventions) into rural education programs could strengthen farmers’ trust in decarbonization policies, thereby improving compliance. Furthermore, Gaussian multi-peak projections indicate agricultural plastic film usage remains at elevated levels, warranting intensified promotion of biodegradable alternatives’ environmental merits. During usage decline phases, consolidating emission reductions through demonstration projects and experience-sharing prevents rebound. Such “temporally adaptive” education strategies enhance guidance relevance and efficacy.
Compared to the models employed in this study, deep learning models enable a shift from “verifying preset hypotheses” to “discovering complex patterns from data,” thereby providing a more powerful scientific tool for agricultural low-carbon development research in terms of accuracy, depth, and decision-making support value (Chai et al., 2022). Future research should integrate deep learning models to enhance their practical predictive guidance capabilities, while also incorporating subjective variables, such as “policy awareness” and “ecological values”, to explore the synergistic mechanisms between technical forecasting and value-based guidance. This will ultimately establish a virtuous cycle where data empowers education, and education accelerates emission reduction.
5 Conclusion
Based on six influencing factors—including chemical fertilizers, pesticides, and agricultural plastic films—this study employs neural network modeling and nonlinear surface fitting to conduct regression analysis and projection of agricultural carbon emission totals in Henan Province. The research provides dual insights for advancing agricultural green development, offering both intellectual guidance for policy formation and actionable pathways for implementation. Key findings are as follows:
1) The total carbon emissions prediction model based on two neural network methods of multilayer perceptron and radial basis function was established. The absolute value of residual error of multilayer perceptron model is less than that of radial basis function model, instructions in regression and prediction of carbon emissions, multi-layer perceptron model has a better effect. It’s Its identification of critical drivers, particularly highlighting agricultural diesel and irrigation, accentuates the dominant role of diesel consumption in carbon emissions.
2) Combine the results of neural network and nonlinear surface fitting method, the total carbon emission of Henan Province is predicted. It is concluded that the total carbon emission of Henan province shows a quadratic change law with time. Based on the time axis, the development of total agricultural carbon emissions in Henan Province from 2001 to 2030 shows the characteristics of rapid growth, stable growth and fluctuation decline.
3) Through comparative data analysis, the prediction results objectively reflect the transformative outcomes of agricultural development models. In the practice of agricultural carbon emission reduction, educational initiatives should prioritize promoting biodegradable alternatives through policy interpretation and cost-benefit analysis to enhance farmers’ environmental awareness. Simultaneously, it is essential to consolidate outcomes through demonstration projects and peer-to-peer knowledge exchange, achieving precisely calibrated “time-limited educational interventions” that foster multi-stakeholder participation in cultivating social norms of ecological consciousness.
Data availability statement
The original contributions presented in the study are included in the article/supplementary material. Further inquiries can be directed to the corresponding author.
Author contributions
JH: Writing – original draft. YP: Writing – review & editing.
Funding
The author(s) declare financial support was received for the research and/or publication of this article. Chongqing “14th Five-Year Plan” Key Project in Education Science. Research on Cultivating Students’ Media Literacy in the Era of Network Informatization. (Project Number: K22YE328104).
Conflict of interest
The authors declare that the research was conducted in the absence of any commercial or financial relationships that could be construed as a potential conflict of interest.
Generative AI statement
The author(s) declare that no Generative AI was used in the creation of this manuscript.
Any alternative text (alt text) provided alongside figures in this article has been generated by Frontiers with the support of artificial intelligence and reasonable efforts have been made to ensure accuracy, including review by the authors wherever possible. If you identify any issues, please contact us.
Publisher’s note
All claims expressed in this article are solely those of the authors and do not necessarily represent those of their affiliated organizations, or those of the publisher, the editors and the reviewers. Any product that may be evaluated in this article, or claim that may be made by its manufacturer, is not guaranteed or endorsed by the publisher.
References
Aldrich J. (1995). Correlations genuine and spurious in pearson and yule. Stat. Sci. 10, 364–376. doi: 10.1214/ss/1177009870
Buhlmann P. and Hothorn T. (2007). Boosting algorithms: regularization, prediction and model fitting. Stat. Sci. 22, 477–505. doi: 10.1214/07-STS242
Chai Z., Yan Y., Zibibula S., Yang S., Maliyamuguli A., and Wang Y. (2022). Carbon emissions index decomposition and carbon emissions prediction in xinjiang from the perspective of population-related factors, based on the combination of STIRPAT model and neural network. Environ. Sci. pollut. Res. 29, 31781–31796. doi: 10.1007/s11356-021-17976-4
Chen Y. and Wang S. (2022). Evaluation of agricultural carbon emission reduction effect of agricultural comprehensive development investment - event analysis based on high standard basic farmland construction policy. Agric. Technol. Econ. 1, 67–80. doi: 10.13246/j.cnki.jae.20220301.001
Chen S., Zhang K., and Zhang Y. (2021). Measurement and decoupling effect of agricultural carbon emission performance. Stat Decision-Making. 37, 85–88. doi: 10.13546/j.cnki.tjyjc.2021.22.019
Cheng B. and Titterington D. (1994). Neural networks-A review from A statistical perspective. Stat. Sci. 9, 2–30. doi: 10.1214/ss/1177010638
Chu L., Jiang Z., and Ren T. (2020). Experience decomposition and peak prediction of agricultural carbon emissions in China - based on dynamic policy scenarios. J. China Agric. Univ. 25, 187–201. doi: 10.11841/j.issn.1007-4333.2020.10.19
George E., Liang F., and Xu X. (2012). From minimax shrinkage estimation to minimax shrinkage prediction. Stat. Sci. 27, 82–94. doi: 10.1214/11-STS3839
Goddard M., Wray N., and Verbyla K. (2009). Estimating effects and making predictions from genome-wide marker data. Stat. Sci. 24, 517–529. doi: 10.1214/09-STS306
Guo H., Zhou X., Dong Y., Wang Y., and Li S. (2023). On the use of machine learning methods to improve the estimation of gross primary productivity of maize field with drip irrigation. Ecol. Model. 476, 110250. doi: 10.1016/j.ecolmodel.2022.110250
Hall P. and Tajvidi N. (2000). Nonparametric analysis of temporal trend when fitting parametric models to extreme-value data. Stat. Sci. 15, 153–167. doi: 10.1214/ss/1009212755
Koondhar M., Aziz N., and Tan Z. (2021). Green growth of cereal food production under the constraints of agricultural carbon emissions: A new insights from ARDL and VECM models. Sustain. Energy Technol. Assessments. 47, 101452. doi: 10.1016/j.seta.2021.101452
Liu Y., Liu N., and Xu P. (2022). Carbon emission prediction model for the production stage of residential building materials in cold regions. J. Tsinghua. Univ. (Natural. Sci. Edition). 1, 05–29. doi: 10.16511/j.cnki.qhdxxb.2022.22.044
Lyu Y., Yang X., Ma X., Pan H., and Zhang X. (2023). Promoting coordinated development of the fertilizer production-crop plantation combined system through an integrated approach. Ecol. Model. 478, 110280. doi: 10.1016/j.ecolmodel.2023.110280
Palmer T. (2020). Short-term tests validate long-term estimates of climate change. Nature 582-7811, 185–186. doi: 10.1038/d41586-020-01484-5
Pan Y., Zhang H., Wang C., and Zhou Y. (2023). Impact of land use change on regional carbon sink capacity: Evidence from Sanmenxia, China. Ecol. Indicators. 156, 1111891470. doi: 10.1016/j.ecolind.2023.111189
Papamarkou T., Hinkle J., Young M., and Womble D. (2022). Challenges in markov chain monte carlo for bayesian neural networks. Stat. Sci. 37, 425–442. doi: 10.1214/21-STS840
Qiao Q. (2021). Simulation and prediction of carbon emissions from land use in guiyang under the background of low carbon economy. Guizhou. Univ. Finance. Econ. 4. doi: 10.27731/d.cnki.ggzcj.2021.000353
Qiu Z., Jin H., Gao N., Xu X., Zhu J., Li Q., et al. (2021). Temporal characteristics and trend prediction of agricultural carbon emissions in Jiangsu province. J. Agric. Environ. Sci. 41, 658–669. doi: 10.11654/jaes.2021-0647
Scuderi A., Cammarata M., and Branca F. (2021). Agricultural production trends towards carbon neutrality in response to the EU 2030 green deal: economic and environmental analysis in horticulture. Agric. Economics-Zemdelska. Ekonomika. 67, 435–444. doi: 10.17221/145/2021-AGRICECON
Shang J., Ji X., Shi R., and Zhu M. (2022). Research on the spatial correlation network structure and driving factors of agricultural carbon emission efficiency in China. J. Ecol. Agric. China (English Chinese). 30, 543–557. doi: 10.12357/cjea.20210607
Tian Z., Zhang H., and Niu W. (2021). Carbon emission peak prediction and emission reduction strategy of yangtze river economic belt. Resour. Industry. 23, 97–105. doi: 10.13776/j.cnki.resourcesindustries.20210104.004
Titterington D. (2004). Bayesian methods for neural networks and related models. Stat. Sci. 19, 128–139. doi: 10.1214/088342304000000099
Tjostheim D., Otneim H., and Stove B. (2022). Statistical dependence: beyond pearson’s rho. Stat. Sci. 37, 90–109. doi: 10.1214/21-STS823
Wu G., Liu J., and Yang L. (2021). Dynamic evolution of China’s agricultural carbon emission intensity and carbon offset potential. Popul. Resour. Environ. China. 31, 69–78. doi: 10.12062/cpre.20210606
Xiong C., Chen S., and Xu L. (2020). Driving factors analysis of agricultural carbon emissions based on extended STIRPAT model of Jiangsu province, China. Growth Change 51, 1401–1416. doi: 10.1111/grow.12384
Yang C., Hu P., Diao B., Cheng J., and Cui H. (2021). Environmental performance evaluation of policies in main grain producing areas:from the perspective of agricultural carbon emissions. Popul. Resour. Environ. China 31, 35–44. doi: 10.12062/cpre.20210804
Yang Q., Zhao R., Zhao T., Hu M., Zhang Y., and Zhu R. (2022). The relationship between agricultural carbon emission efficiency and food security at county scale. Agric. Resour. regionalization. China. 1, 05–30. doi: 10.7621/cjarrp.1005-9121.20230215
Zhang J., Chen H., Liu D., Geng T., Dong J., et al. (2022b). Differences in agricultural carbon emission efficiency of farmers and multi-level influencing factors - mizhi county in shaanxi province as an example. Agric. Resour. regionalization. China. 1, 05–30. doi: 10.7621/cjarrp.1005-9121.20220909
Zhang D., Wang T., and Zhi J. (2022a). Prediction of carbon emissions and eco-economic analysis of shandong province based on IPSO-BP neural network model. Ecol. Sci. 41, 149–158. doi: 10.14108/j.cnki.1008-8873.2022.01.017
Zhang F., Xu N., and Wu F. (2021). Research on China ‘ s Carbon Emissions Prediction From 2020 to 2100 Under the Shared Socio-Economic path. Ecology 41, 9691–9704. doi: 10.5846/stxb202012073118
Zhao R., Liu Y., and Tian M. (2018). Impacts of water and land resources exploitation on agricultural carbon emissions: the water-land-energy-carbon nexus. Land. Use Policy 72, 480–492. doi: 10.1016/j.landusepol.2017.12.029
Zhu H., Cao B., and Zhao W. (2022). Timing evolution and spatial convergence characteristics of agricultural total factor carbon emission performance in China. Stat Decision-making. 38, 63–68. doi: 10.13546/j.cnki.tjyjc.2022.09.012
Keywords: prediction model, neural network, complex plane, ecological values, agricultural carbon emissions
Citation: Hao J and Pan Y (2025) Prediction model based on neural network and complex plane analysis: a case study of agricultural carbon emissions in Henan Province. Front. Agron. 7:1684447. doi: 10.3389/fagro.2025.1684447
Received: 15 August 2025; Accepted: 13 October 2025;
Published: 28 October 2025.
Edited by:
Francesco Morari, University of Padua, ItalyReviewed by:
Doan Quang Tri, Vietnam Meteorological and Hydrological Administration, VietnamDmitriy Martyushev, Perm National Research Polytechnic University, Russia
Copyright © 2025 Hao and Pan. This is an open-access article distributed under the terms of the Creative Commons Attribution License (CC BY). The use, distribution or reproduction in other forums is permitted, provided the original author(s) and the copyright owner(s) are credited and that the original publication in this journal is cited, in accordance with accepted academic practice. No use, distribution or reproduction is permitted which does not comply with these terms.
*Correspondence: Yisha Pan, cHlzeml5b3VAMTYzLmNvbQ==