 Luisa C. Baccin
 Marcelo L. Moretti
- Department of Horticulture, Oregon State University, Corvallis, OR, United States
Weed control remains a critical challenge for organic blueberry producers in the Pacific Northwest, where most U.S. organic blueberry hectarage is concentrated. Electrical weed control (EWC) offers a nonchemical alternative by applying high-voltage currents to plant foliage, disrupting vascular function through heat-induced tissue damage. This study evaluated how operational speed and the number of EWC applications influence weed control efficacy across five field studies in certified organic blueberry fields in Oregon, using two types of commercial EWC equipment. Slower speeds (0.5–1 km h-1; 69–35 kJ m-2) achieved the highest efficacy, providing >80% weed control at 28 days after initial treatment (DAIT) and reducing biomass by up to 73% compared to nontreated. Sequential applications were critical for sustained control: two applications at 2 or 4 km h-1 (17–9 kJ m-2 per application) provided 77–83% weed control at 42 DAIT. Species-specific responses were observed, with northern willowherb (Epilobium ciliatum) and Pennsylvania smartweed (Persicaria pensylvanica) being more sensitive to EWC with 85–100% control at 42 DAIT, while tall fescue (Festuca arundinacea) and sharppoint fluvellin (Kickxia elatine) required multiple treatments and higher energy doses (≥24 kJ m-2) to reach 67–73% control at the same period. In a combined methods study long-term efficacy declined with single-application treatments, with control dropping below 20% by 56 DAIT, whereas sequential applications sustained >40% control. These results demonstrate that EWC provides effective nonchemical weed management in organic blueberry production, with operational speed and sequential applications key to maintain high levels of weed control.
1 Introduction
Highbush Blueberries (Vaccinium corymbosum L.) are highly valued for their nutritional benefits, being rich in antioxidants, vitamins, and dietary fiber. These health-promoting qualities have contributed to their growing popularity in consumer diets and food products, fueling a notable rise in both production and consumption (Golovinskaia and Wang, 2021; Silva et al., 2020; Zhang, 2022). The organic blueberry industry in the Pacific Northwest (PNW) has grown substantially in recent years, driven by the favorable climate and increasing consumer demand for organic produce (Yeh et al., 2023). However, organic blueberry growers face persistent challenges in managing weeds, particularly perennial species like field bindweed (Convolvulus arvensis L.), yellow nutsedge (Cyperus esculentus L.), curly dock (Rumex crispus L.) and Canada thistle (Cirsium arvense L.). Weeds compete for water and nutrients, complicate harvest operations, and can reduce yields by up to 92% (Burkhard et al., 2009). Certified organic systems have limited effective options for weed management. Common strategies such as mechanical cultivation, hand-weeding, and organic mulches are labor-intensive, provide inconsistent control, and are ineffective on deep-rooted perennials (DeVetter et al., 2015; Moretti and Pedroso, 2023; Strik and Vance, 2017). Consequently, there is a need for alternative, nonchemical approaches that are both effective in woody perennials and compatible with organic certification. Recent evaluations of nonchemical methods, including saturated steam and rotary brush, have shown promising results but also highlight the operational challenges and need for innovation in sustainable weed management (Moretti and Pedroso, 2023).
Electrical weed control (EWC) employs high-voltage electric current to disrupt plant tissues, causing lethal damage through heat generated by electrical flow, cellular rupture, and protein denaturation (Diprose and Benson, 1984; Diprose et al., 1980). It offers potential as a nonchemical weed management strategy, particularly in organic systems, for controlling perennial weeds that regenerate from underground structures, such as rhizomes and tubers (Diprose et al., 1980). Electrical weed control (EWC) targets shoots and root systems by delivering energy through metal electrodes in contact with the aboveground tissues (Slaven et al., 2023). The degree of tissue damage is influenced by multiple factors, including plant density and morphology, water content, plant and soil electrical conductivity, and the total energy dosage applied (Slaven et al., 2023; Sahin and Yalınkılıç, 2017; Vigneault and Benoit, 2001; Vigneault et al., 1990). While effective on many weed species, EWC’s efficacy is related to morphology and anatomy of treated plants, due to differences in leaf structure and physiology, branching patterns, and root structure (Bauer et al., 2020; Vigneault and Benoit, 2001). Plants with hair-like structures on their leaves or waxy coatings may offer additional electrical flow restriction, potentially reducing the current’s effectiveness in reaching vital plant tissues (Bauer et al., 2020). These anatomical factors highlight the need for further research to quantify the impact of these traits across different species and growth stages, which will help optimize the application of electrical weed control methods and reduce unnecessary energy use (Vigneault et al., 1990).
Soil characteristics strongly influence electrical energy transfer during EWC. Wet soils enhance conductivity, improving current flow to plant tissues, whereas dry or compacted soils impede flow and reduce control efficacy (Slaven et al., 2023; Bauer et al., 2020; Vigneault et al., 1990). Soil texture also affects current flow, with sandy soils offering less resistance and clayey soils potentially requiring higher energy for effective control (Bauer et al., 2020). Additionally, higher soil conductivity (EC) and salinity can disperse current more widely, lowering weed mortality unless voltage is increased (Schreier et al., 2022).
The efficacy of EWC depends on operational parameters such as speed, energy dose, and number of applications. Slower speeds (0.5–1 km h-1) tend to provide more effective control by delivering more energy to each plant, resulting in greater reductions in weed biomass, while repeated applications of EWC enhance long-term control by hindering the plant’s ability to regenerate (Feys et al., 2023). Specifically, as tractor speed increases, the duration of electrode-plant contact decreases, resulting in reduced energy deposition per unit area. As a result, the performance of EWC is site-specific, depending on interactions between plant and soil conditions, equipment configurations, and local environmental factors (Diprose et al., 1980). Equipment configurations also affect operational costs, since engine speed and transmission gear selection are the most significant factors that affect the fuel efficiency of agricultural tractors; higher speeds reduce operational costs (Grisso et al., 2010). Despite its potential, research on EWC remains scarce, particularly in perennial cropping systems such as blueberries and under the variable field conditions of the PNW.
This study aimed to evaluate the viability of EWC in organic highbush blueberry systems by assessing how application speed and the number of treatments affect weed control efficacy. We hypothesized that lower operational speeds would result in greater weed control due to increased energy delivery, and that multiple applications would improve the control of newly emerging weeds over time. We further hypothesized that EWC efficacy would be species dependent, with differences in plant morphology and anatomy influencing susceptibility to treatment.
2 Materials and methods
2.1 Site and equipment description
Three study protocols were developed between 2022 and 2024: (1) operational speed and weed control, (2) number of operations, and (3) combined methods of weed control (Table 1). All studies were conducted in Western Oregon in certified organic highbush blueberry fields. In each field, the plants were grown on rows of raised beds centered 2.4 m apart. Plants were spaced 0.9 m apart in the planting line. The beds were mulched with sawdust and black polypropylene landscape fabric (weed mat) and irrigated by drip irrigation positioned under the weed mat. EWC treatments were applied as a basal application on both sides of the planting rows, covering 6 m per treated section. Figure 1 shows the average temperature (°C) and daily rainfall (mm) recorded during each study period at the respective locations. Direct measurements of soil volumetric water content (VWC) or electrical conductivity (EC) were not collected. Instead, precipitation data are presented to provide context on soil moisture conditions at the time of treatment. EWC treatments were evaluated across all five studies using two types of commercial equipment developed by Zasso Group AG (Figure 2). The studies were designed based on feasible operational speeds for the equipment. Changes in equipment used were driven by availability at the time of the study.
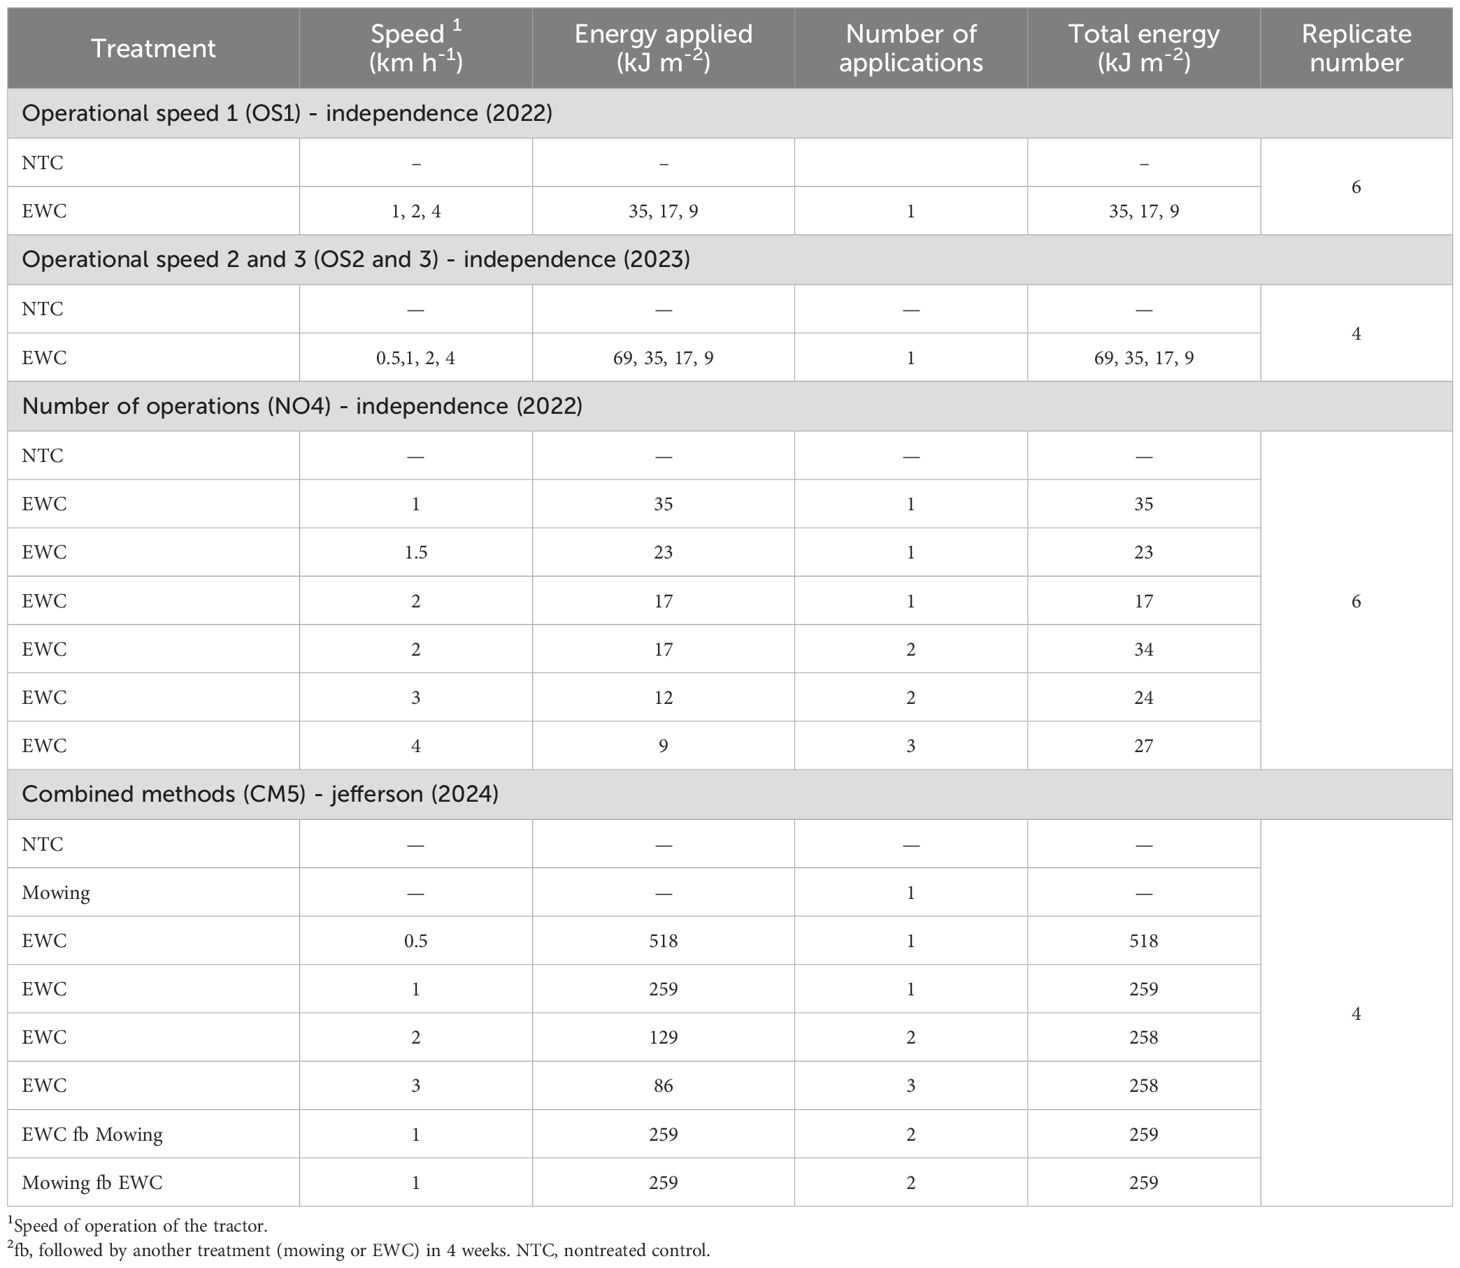
Table 1. Application rates, timing, and total energy of electrical weed control (EWC) treatments in Independence, OR (2022, 2023) and combined methods, including EWC and mowing, in Jefferson, OR (2024).
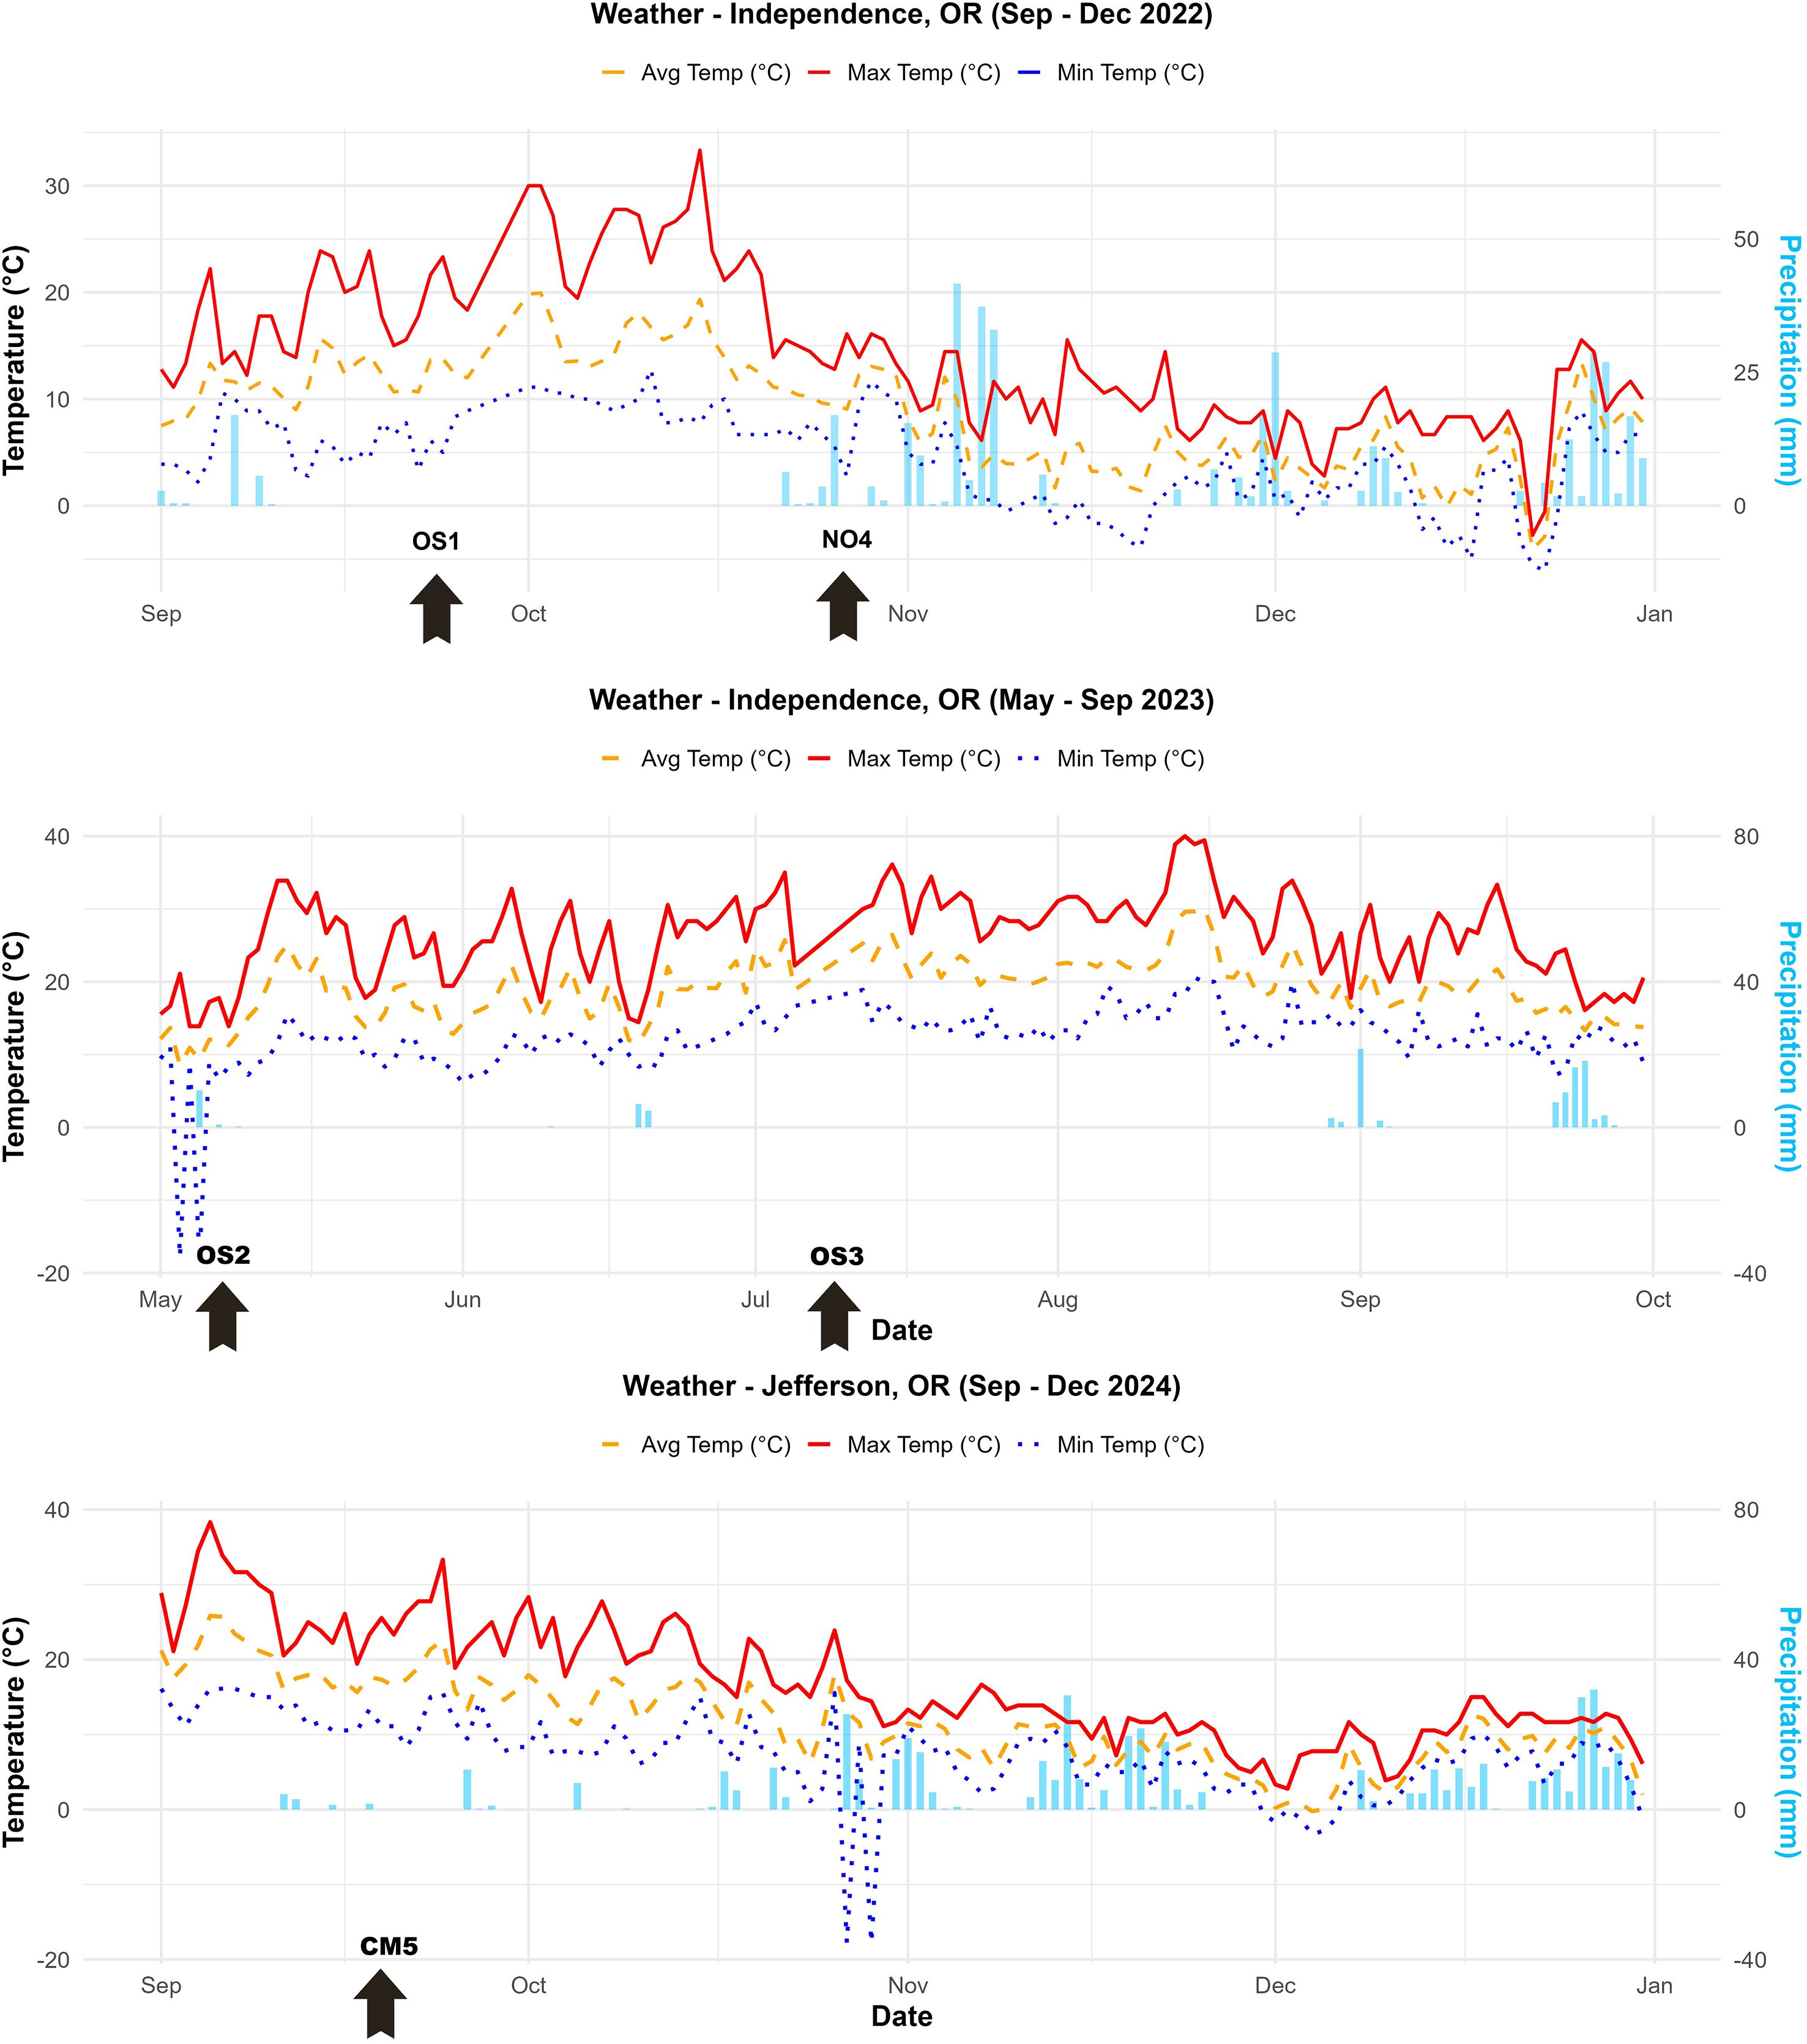
Figure 1. Average daily temperature (°C) and daily rainfall (mm) during each study period. Weather data were obtained from Weather Underground. For Independence, OR, data came from the nearest station located 5 miles east-northeast of Independence (44.88°N, 123.1°W). For Jefferson, OR, data were collected from the Salem station (44.94°N, 123.04°W).Temperature data are shown as maximum (red line), average (yellow dashed line), and minimum (blue dotted line) in °C. Precipitation is represented by light blue bars (mm). .
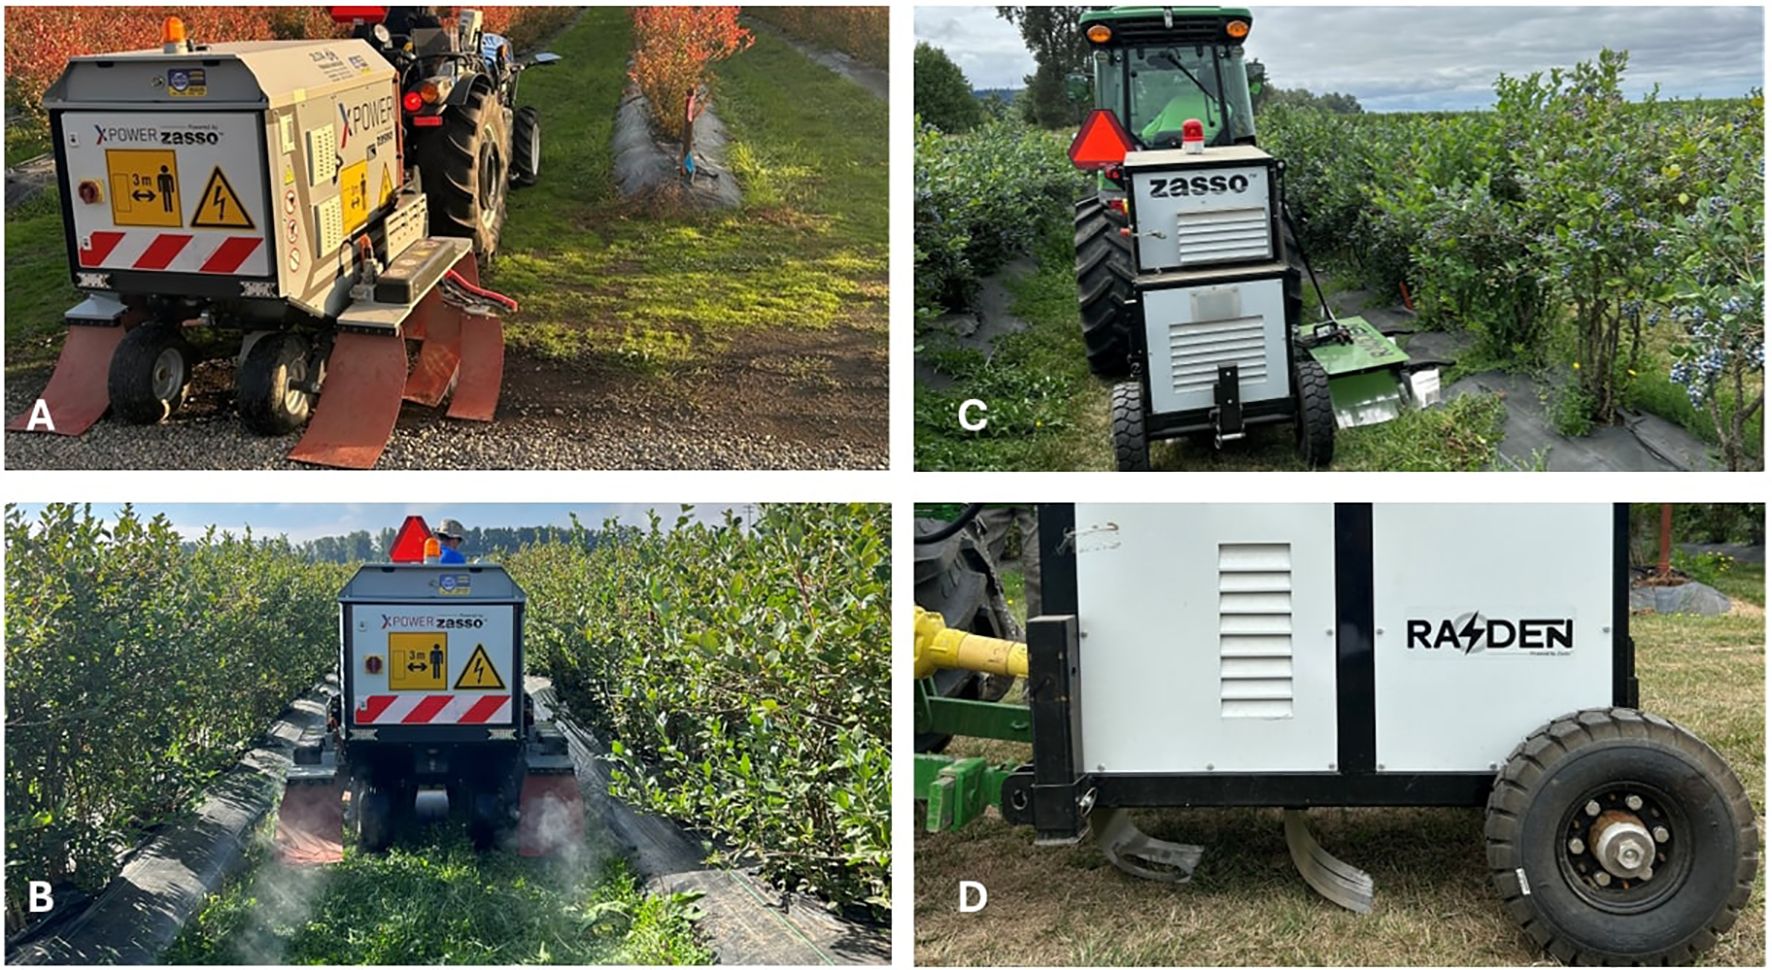
Figure 2. Electrical Weed Control (EWC) equipment used in the blueberry studies. (A, B) Zasso XPower XPS system, PTO-powered by a 60-kW narrow tractor (T4.80, New Holland), delivering up to 24 kW of direct current (DC) through a 0.3-m applicator. (C, D) Zasso Raiden system, PTO-powered by a narrow tractor (5090 GC Narrow, John Deere), delivering up to 6 kW of direct current (DC) through a 0.4-m applicator.
2.2 Operational speed
Three field studies were conducted in 2022 and 2023 to evaluate the effect of operational speeds ranging from 0.5 to 4 km h-1 (OS1, OS2, and OS3) on EWC performance, using a nontreated control for comparison. OS1 study tested different speeds (1, 2 and 4 km h-1) and was conducted in September 2022 in Independence, Oregon (44.904°N, 123.143°W). The soil type was Newberg loam, and the field was naturally infested with sharppoint fluvellin (Kickxia elatine L.), predominantly at BBCH 29, with an average weed density of 3 plants m2 and a prostrate growth habit.
EWC was applied using the Zasso Raiden system (Zasso™, Brazil), a compact unit delivering up to 6 kW of direct current (DC) through metal electrodes. The applicator, mounted on a narrow tractor (5090 GC Narrow, John Deere), treated a 0.4-m-wide swath along the planting row (Figures 2C, D).
OS2 and OS3 tested speeds of 0.5, 1, 2 and 4 km h-1 and were conducted in May and July 2023, respectively, at two nearby locations (44.90°N, 123.13°W and 44.90°N, 123.12°W). The soil at both sites was Cloquato silt loam. The predominant weed species included tall fescue (Festuca arundinacea Schreb.), Canada thistle (Cirsium arvense L.), sharppoint fluvellin (K. elatine), Pennsylvania smartweed (Persicaria pensylvanica L.), and willowherb (Epilobium ciliatum Raf.), ranging from BBCH 19 - 29. As in OS1, EWC was conducted using the Zasso Raiden system mounted on a narrow tractor, with identical operational setup and treated width of 0.4m.
2.3 Number of operations
A “number of operations” study (NO4) was conducted in winter 2022 in a blueberry field in Independence, Oregon (44.90°N, 123.13°W). The soil type was Cloquato silt loam. The field was dominated by K. elatine at BBCH 29. Treatments differed not only in speed but also in the number of sequential applications (spaced 14 days apart), such that faster speeds were combined with multiple passes to approximate the total energy delivered by slower, single-pass operations. For example, a single pass at 1 km h-1delivered 35 kJ m-2, while two passes at 2 km h-1 delivered a similar cumulative dose (34 kJ m-2). Likewise, a single pass at 1.5 km h-1 (23 kJ m-2) could be compared with two passes at 3 km h-1 (24 kJ m-2). This setup allowed evaluation of the effect of number of applications while accounting for differences in total energy delivered (Table 1).
2.4 Combined methods
A “combined methods” study (CM5) was conducted in September 2024 at a commercial organic blueberry farm in Jefferson, Oregon (44.68°N, 122.98°W). The soil was Newberg fine sandy loam and the weed community consisted of curly dock (Rumex crispus L.), broadleaf plantain (Plantago major L.) at BBCH 29, and Italian ryegrass (Lolium perenne ssp. multiflorum Lam.) and hairy crabgrass (Digitaria sanguinalis L.) at BBCH 59, with an average weed height of 15 cm.
Treatments included mowing alone, EWC alone, and mowing followed by EWC. Mowing was performed using a push-behind rotary mower (PRO 26, DR Power Equipment). EWC was applied using the Zasso XPower XPS system (Zasso™, Brazil), a tractor-mounted unit designed for perennial orchards. This system was powered by a 60-kW narrow tractor (T4.80, New Holland, USA) via the power take-off (PTO) and delivered up to 24 kW of direct current (DC) via an onboard generator. The rear-mounted applicator featured 30-cm-wide electrodes for targeted application near planting rows (Figures 2A, B).
2.5 Dose response and contrast analysis
To evaluate treatment effects across locations, data for single applications with speed ranging from 0.5 to 4 km h-1 and respective energy levels ranging from 9 to 69 kJ m-2 were pooled from four field trials (OS1, OS2, OS3, and NO4) to conduct dose–response analyses. These analyses assessed the relationship between energy level and weed control efficacy, as well as percentage of weed biomass reduction.
In addition, the studies NO4 and CM5 were combined to perform a contrast analysis. This analysis compared the efficacy of different application strategies: (i) a single application at 1 km h−1 and (ii) two sequential applications at 2 km h−1. Weed control ratings and dry weed biomass were analyzed to determine whether repeated applications at higher speed provided comparable or improved efficacy relative to a single, slower application.
2.6 EWC energy calculation
For all EWC treatments, energy delivery was calculated using the following equation, assuming a power factor of 90% energy efficiency for the XPS system and 64% for the Raiden system based on manufacturers’ information:
Where E real = real energy (kJ m-2), Power = the generator power (kW = kJ s-1), PF = power factor, speed = speed of operation (m s-1), and width = width of the treated area (m).
2.7 Data collection
The efficacy of weed control was assessed based on visual assessments of the percentage of weed control from 7 up to 56 days after initial treatment (DAIT) using a standardized scale from 0 to 100%, where 0% indicated no visible weed control and 100% indicated complete weed necrosis (Canadian Weed Science Society, 2018). Weed control assessments were made for all species present (total weed control) and at species level. Aboveground weed biomass was harvested at 28 DAIT for OS1, 42 DAIT for OS2, OS3, and NO4, and 56 DAIT for CM5. Biomass was collected from a defined 0.25 m² quadrat within each plot, dried at 60 °C for 72 hours, and weighed.
2.8 Statistical analysis
Each experiment was arranged in a randomized complete block design (RCBD) with four to six replicates per treatment. Individual plots measured 3 by 6 m, with treatments applied on both sides of the blueberry rows. Weed control ratings were expressed as proportions (0–1) and adjusted using the Smithson–Verkuilen transformation [y′=(y(n−1)+0.5)/n] to shift boundary values slightly within (0 and 1). Transformed data were analyzed with a beta GLMM (logit link) in the ‘glmmTMB’ package in R version 4.3.1 (Brooks et al., 2017). Dry weed biomass data were analyzed using linear mixed-effects models (LMMs) fitted with the ‘lmerTest’ package (Kuznetsova et al., 2017). For all models, block was included as a random effect, and fixed effects included treatment (application speed or number of applications), days after initial treatment (DAIT), studies (for OS2 and OS3) and their interaction. Model assumptions for GLMMs were checked using the DHARMa package (Hartig, 2020), and for LMMs using residual plots, the Shapiro–Wilk test for normality, and Levene’s test for homogeneity of variances. Biomass data were log-transformed to meet model assumptions.
For the NO4 study planned contrasts were used to evaluated weed control and biomass reduction for: (1) constant energy, single versus two applications; (2) different energy, single versus two applications; and (3) different energy, two versus three applications, at 42 DAIT. Contrast vectors were specified as non-orthogonal contrasts with elements summing to zero, and Sidak correction was applied to adjust for the lack of statistical independence using ‘emmeans’ package in R (Aho, 2013).
To further evaluate treatment effects, data from OS1, OS2, OS3, and NO4 were pooled to perform a dose–response analysis for single-application treatments with energy levels ranging from 9 to 69 kJ m-2 (0.5 to 4 km h−1). Weed control ratings and weed biomass reduction (expressed as percentage) were modeled using nonlinear regression models in the ‘drc’ package (Ritz et al., 2015). Candidate models included three-, four- and five-parameter log-logistic, and Weibull functions. Model selection was guided by visual inspections, Akaike’s Information Criterion (AIC), and residual diagnostics (data not shown). The three-parameter log-logistic model (LL.3) provided the best fit and was retained for all subsequent analyses. Effective doses (ED values) were obtained using the ED() function in DRC. To report biologically relevant values, we specified the code to estimate values on absolute range (type = absolute), which estimates the dose corresponding to a fixed level of response such as ED50 as 50% control or biomass reduction. This approach differs from relative ED estimation, which defines effect levels as percentages of the model’s asymptotic maximum (d). Absolute EDs were used to report benchmarks (ED50, ED90) even in cases where the fitted upper limit did not reach the target percentage level. Parameter estimates are reported with standard errors (SE) in parentheses. In addition, data from NO4 and CM5 were pooled to conduct contrast analyses comparing a single application at 1 km h-1 with two sequential applications at 2 km h-1. Models were fitted including ‘study’ as a fixed factor and ‘block’ nested within study to account for differences in equipment and experimental design across studies. Estimated marginal means and pairwise contrasts were obtained using the ‘emmeans’ package (Lenth, 2023).
Means were compared using the least significant difference test at α = 0.05, with p-values adjusted by Bonferroni correction to control Type I error and avoid false positives. Estimated marginal means and compact letter displays were generated using the ‘emmeans’ package Figures were created using the ‘ggplot2’ package (Wickham, 2016), with colorblind-accessible palettes applied via the ‘viridis’ package (Garnier, 2018).
3 Results
3.1 Operational speed
Operational speed influenced weed control, as the applied energy is inversely related to speed. Across all three studies, total weed control declined with faster driving speeds across the three operational speed studies. In OS1, an operational speed of 1 km h-1 (35 kJ m-2) significantly greater weed control than 2 or 4 km h-1at all evaluation dates from 7 to 56 DAIT (Figure 3). At 7 DAIT, control at 1 km h-1 (47%) was 22% higher than 2 km h-1and 26% higher than 4 km h-1.By 56 DAIT, the 1 km h-1 (89%) still maintained significantly higher control than both 2 km h-1 (76%) and 4 km h-1 (70%). Additionally, dry aboveground weed biomass was significantly reduced at 1 km h-1compared to the nontreated control.

Figure 3. Percentage of weed control (A) and dry weed biomass (B) in response to different operational speeds of electrical weed control (1, 2, and 4 km h-1) in certified organic blueberry fields, Independence, OR in 2022 (n=6). Percentage of weed control (C) and dry weed biomass (D) in different operational speeds of electrical weed control (0.5, 1, 2, and 4 km h-1) and nontreated control (NTC) in certified organic blueberry fields, Independence, OR 2023 (n=8). Different letters indicate significant differences based on the LSD test (α = 0.05).
A combined analysis of OS2 and OS3 indicated that the three-way interaction between study, speed, and DAIT was not significant (p = 0.74), allowing data to be pooled for analysis. Slower speeds (0.5 and 1 km h-1) achieved higher weed control than 2 and 4 km h-1at all recorded evaluation dates (14, 28, and 42 DAIT). At 14 DAIT, control exceeded 71% at 0.5 and 1 km h-1 but dropped to 62% and 40% at 2 and 4 km h-1, respectively. By 42 DAIT, control remained above 63% for the slowest speeds but fell to 46% at 2 km h-1and only 24% at 4 km h-1 (Figure 3). Weed biomass was also lower at these slower speeds compared to 4 km h-1. As speed increased, the amount of contact time between the electrode and the plants was reduced, resulting in lower energy transfer. Within the Raiden unit tested here, weed injury was strongly correlated with energy dosage. Slower speeds, which allowed for greater energy deposition, were more effective at damaging weed tissues and reducing regrowth.
These results support our first hypothesis, showing that slower operational speeds (0.5–1 km h-1) provided significantly higher weed control and biomass reduction than faster speeds, with up to 89% control at 1 km h-1 compared to 70% at 4 km h-1 by 56 DAIT.
3.2 Effect of sequential applications on weed control and species-specific responses to EWC
In this study, operational speed and number of applications interacted significantly with DAIT for weed control (p = 0.011). Weed control improved over time and differed significantly between treatments at 21, 28, 35 and 42 DAIT (Table 2). At 28 DAIT, two applications at 4 km h-1 (61%) achieved significantly higher control than a single application at 2 km h-1 (52%). At 42 DAIT, two applications at 2 or 3 km h-1 (77% and 79%) and three applications at 4 km h-1 (83%) provided the highest control, compared to applications at 1, 1.5, or 2 km h-1.
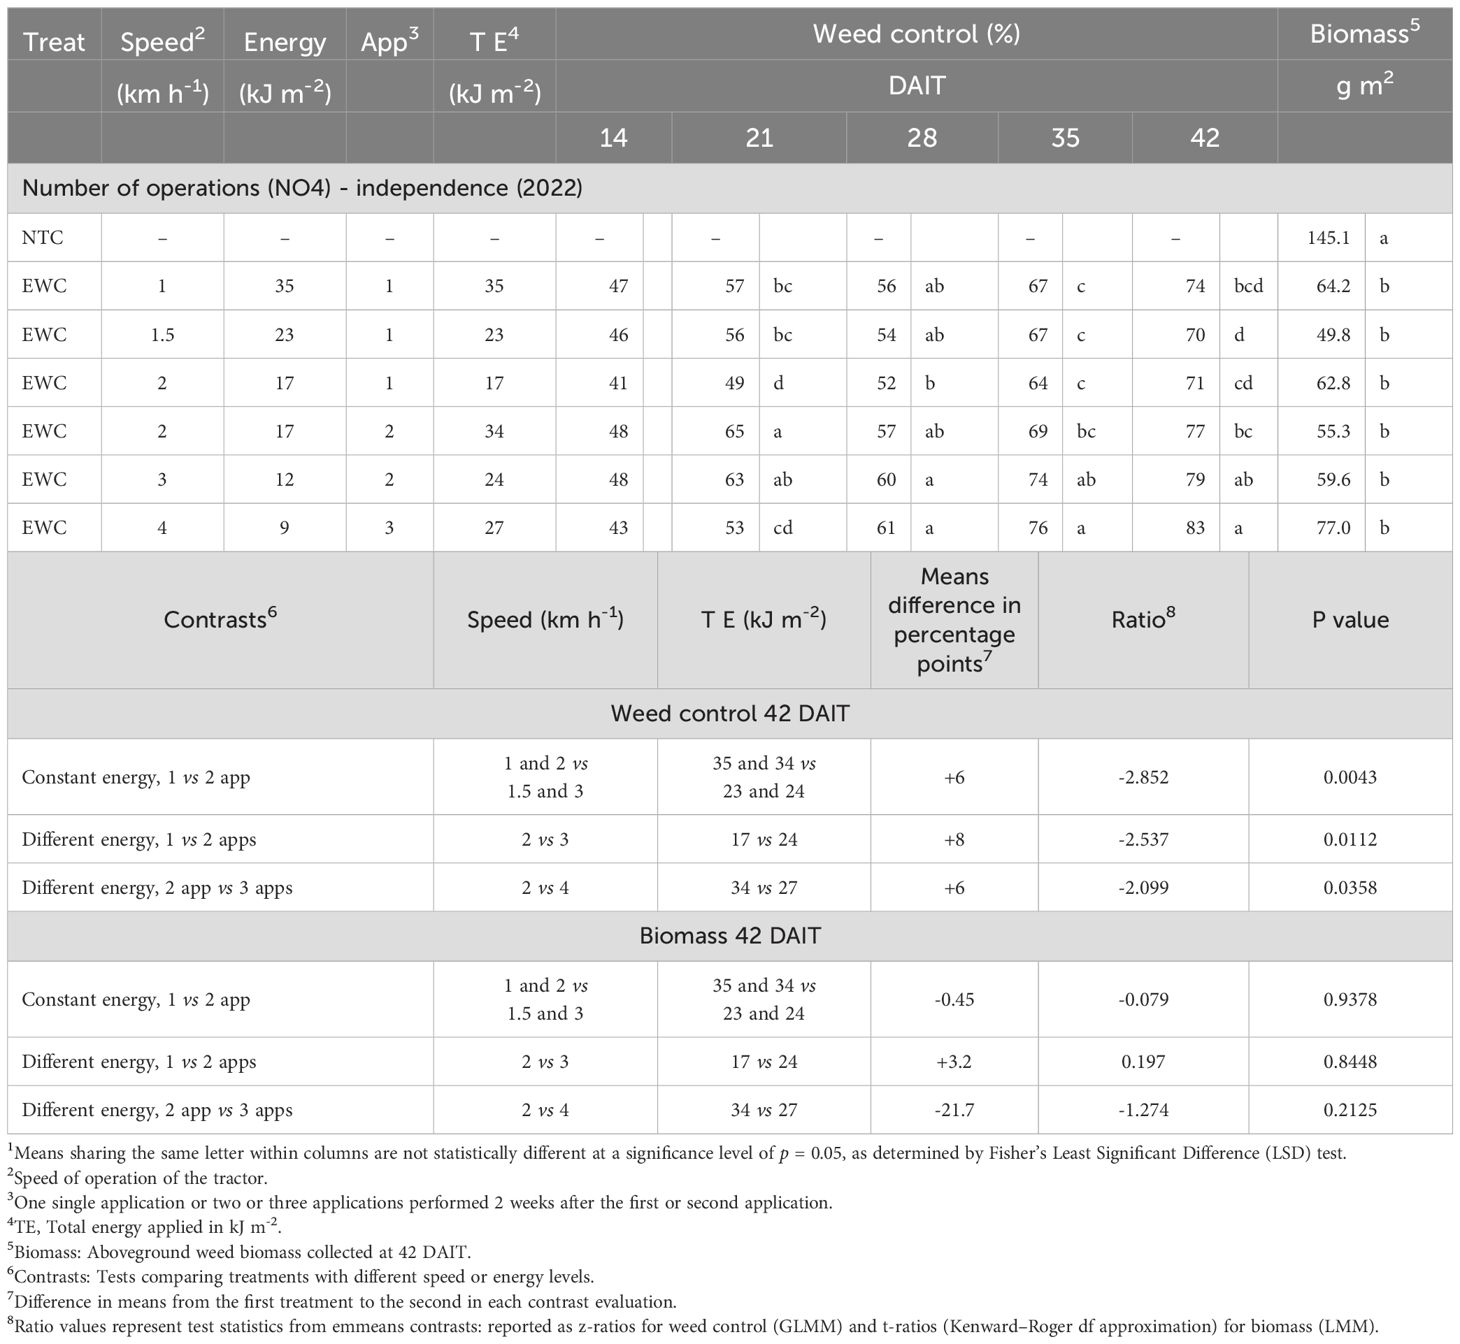
Table 2. Weed control (%) and aboveground weed biomass (g m−2) following electrical weed control (EWC) applications in NO4, during the fall application timing study (2022). Weed control was evaluated at 14, 21, 28, 35, and 42 days after initial treatment (DAIT)1.
At 42 DAIT, planned contrasts highlighted the benefits of sequential EWC applications (Table 2). For the constant energy comparison (34–35 or 23–24 kJ m-2applied as either one or two passes), sequential applications provided 77–79% control, compared with 70–74% for single passes, representing an average improvement of 6 percentage points at the same total energy (z-ratio = –2.852, p = 0.004). For the different energy, one vs. two applications contrast, two passes at 3 km h-1 (24 kJ m-2) provided 79% control, which was 8 percentage points higher than the 71% obtained with a single pass at 2 km h-1 (17 kJ m-2; z-ratio = –2.537, p = 0.011). In the different energy, two vs. three applications contrast, three passes at 4 km h-1 (27 kJ m-2) achieved 83% control, 6 percentage points higher than the 77% from two passes at 2 km h-1 (34 kJ m-2; z-ratio = –2.099, p = 0.036). Multiple passes performance was higher because sequential passes targeted new weed emergence and regrowth, thereby sustaining control over time.
Aboveground weed biomass at 42 DAIT was significantly reduced by all EWC treatments compared to the nontreated control (p < 0.05). However, biomass did not differ significantly among EWC treatments themselves, regardless of operational speed or number of applications. Consistently, the planned contrast analysis also showed no significant differences between single versus sequential passes or across energy levels.
EWC efficacy was species specific (Table 3). F. arundinacea was controlled with sequential applications, reaching 67-68% with two or three passes at 3 or 4 km h-1 (24–27 kJ m-2) compared to by 42 DAIT. K. elatine required two or three applications at 3–4 km h-1 to reach 75-78% control. E. ciliatum and P. pensylvanica were highly susceptible, achieving >98% control, respectively, across all treatments by 42 DAIT, regardless of speed or number of passes. These results support our second hypothesis, showing that sequential passes improved control by 6–8 percentage points over single passes at equivalent energy, sustaining higher control over time by targeting regrowth and new emergence and our third hypothesis, demonstrating strong species effects, with upright broadleaf weeds (E. ciliatum, P. pensylvanica) highly susceptible (>98% control), while grasses (F. arundinacea) and prostrate broadleaf weeds (K. elatine) were more tolerant.
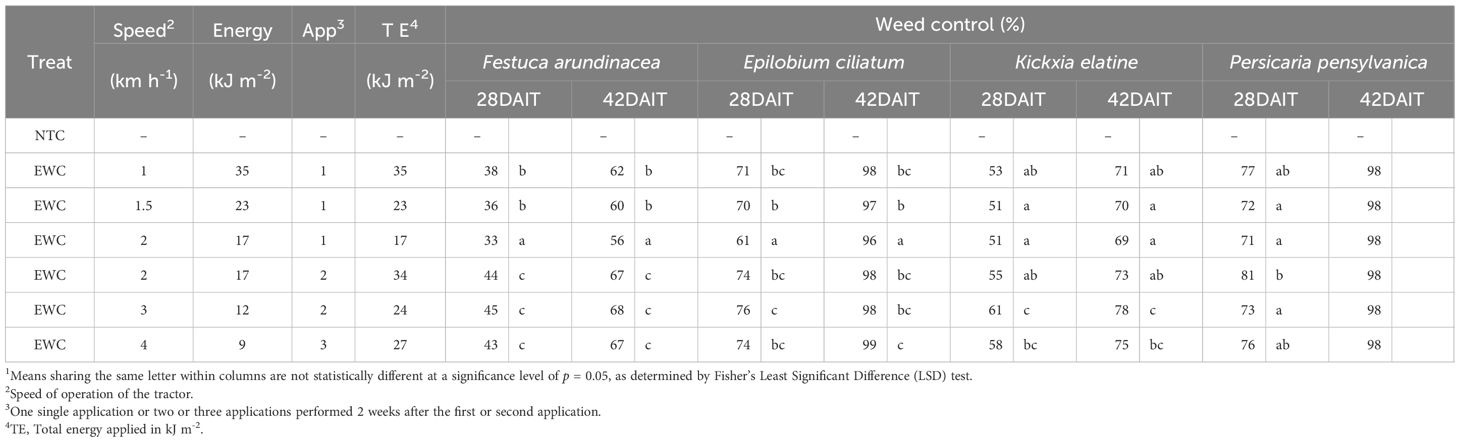
Table 3. Percentage of control of tall fescue (Festuca arundinacea), northern willowherb (Epilobium ciliatum), sharppoint fluvellin (Kickxia elatine), and smartweed (Persicaria pensylvanica) at 28, and 42 days after initial treatment (DAIT) following electrical weed control (EWC) at different speeds and number of applications1.
3.3 Combined treatment
In the combined treatment study, EWC at 0.5 and 1 km h-1 (518 and 259 kJ m-2, respectively) provided the greatest weed control at 28 DAIT, outperforming mowing and EWC applications at 2 and 3 km h-1 (130 and 86 kJ m-2, respectively) (Table 4). Combined approaches, mowing followed by EWC or EWC followed by mowing, and mowing alone provided 50–60% control and did not differ from each other at 28 DAIT. By 56 DAIT, the only treatment that maintained greater weed control was EWC at 2 km h−1 applied twice with 42% control, with all other treatments ranging from 14% to 25% control. Aboveground weed biomass at 56 DAIT was significantly reduced in the mowing followed by EWC treatment, which was 72% lower than the nontreated control. This suggests that mowing before EWC improved treatment efficacy, likely by reducing plant height and density, thereby increasing electrode contact with regrowth tissues.

Table 4. Weed control (%) and aboveground weed biomass (g m−2) in response to electrical weed control (EWC) and mowing treatments in a 2024 field study conducted in Jefferson, OR1.
3.4 Dose response and contrast analysis
Pooled data from OS1, OS2, OS3, and NO4 for single applications showed a positive relationship between energy applied (kJ m-2) and weed control efficacy (Figure 4). The LL.3 model estimated an upper limit of 81% control (d = 81.1 ± 7.3, p < 0.001), with a slope b = –1.15 (± 0.34, p < 0.001) and ED50 of 12. 1 kJ m-2 (± 2.68). Because the estimated upper limit was below 90%, an absolute ED90 (dose achieving 90% control) could not be calculated. At the lowest tested dose (9 kJ m-2; 4 km h-1), predicted control was 43%, increasing to 58% at 17 kJ m-2 (2 km h-1) and 69% at 36 kJ m-2 (1 km h-1). At the highest dose (72 kJ m-2; 0.5 km h-1), predicted control reached 75%. These results indicate that increasing energy by reducing operational speed substantially improved weed control at lower doses, but gains diminished beyond 36–45 kJ m-2,(equivalent to 1 and 0.8 km h-1, respectively), where efficacy stabilized below 80%.
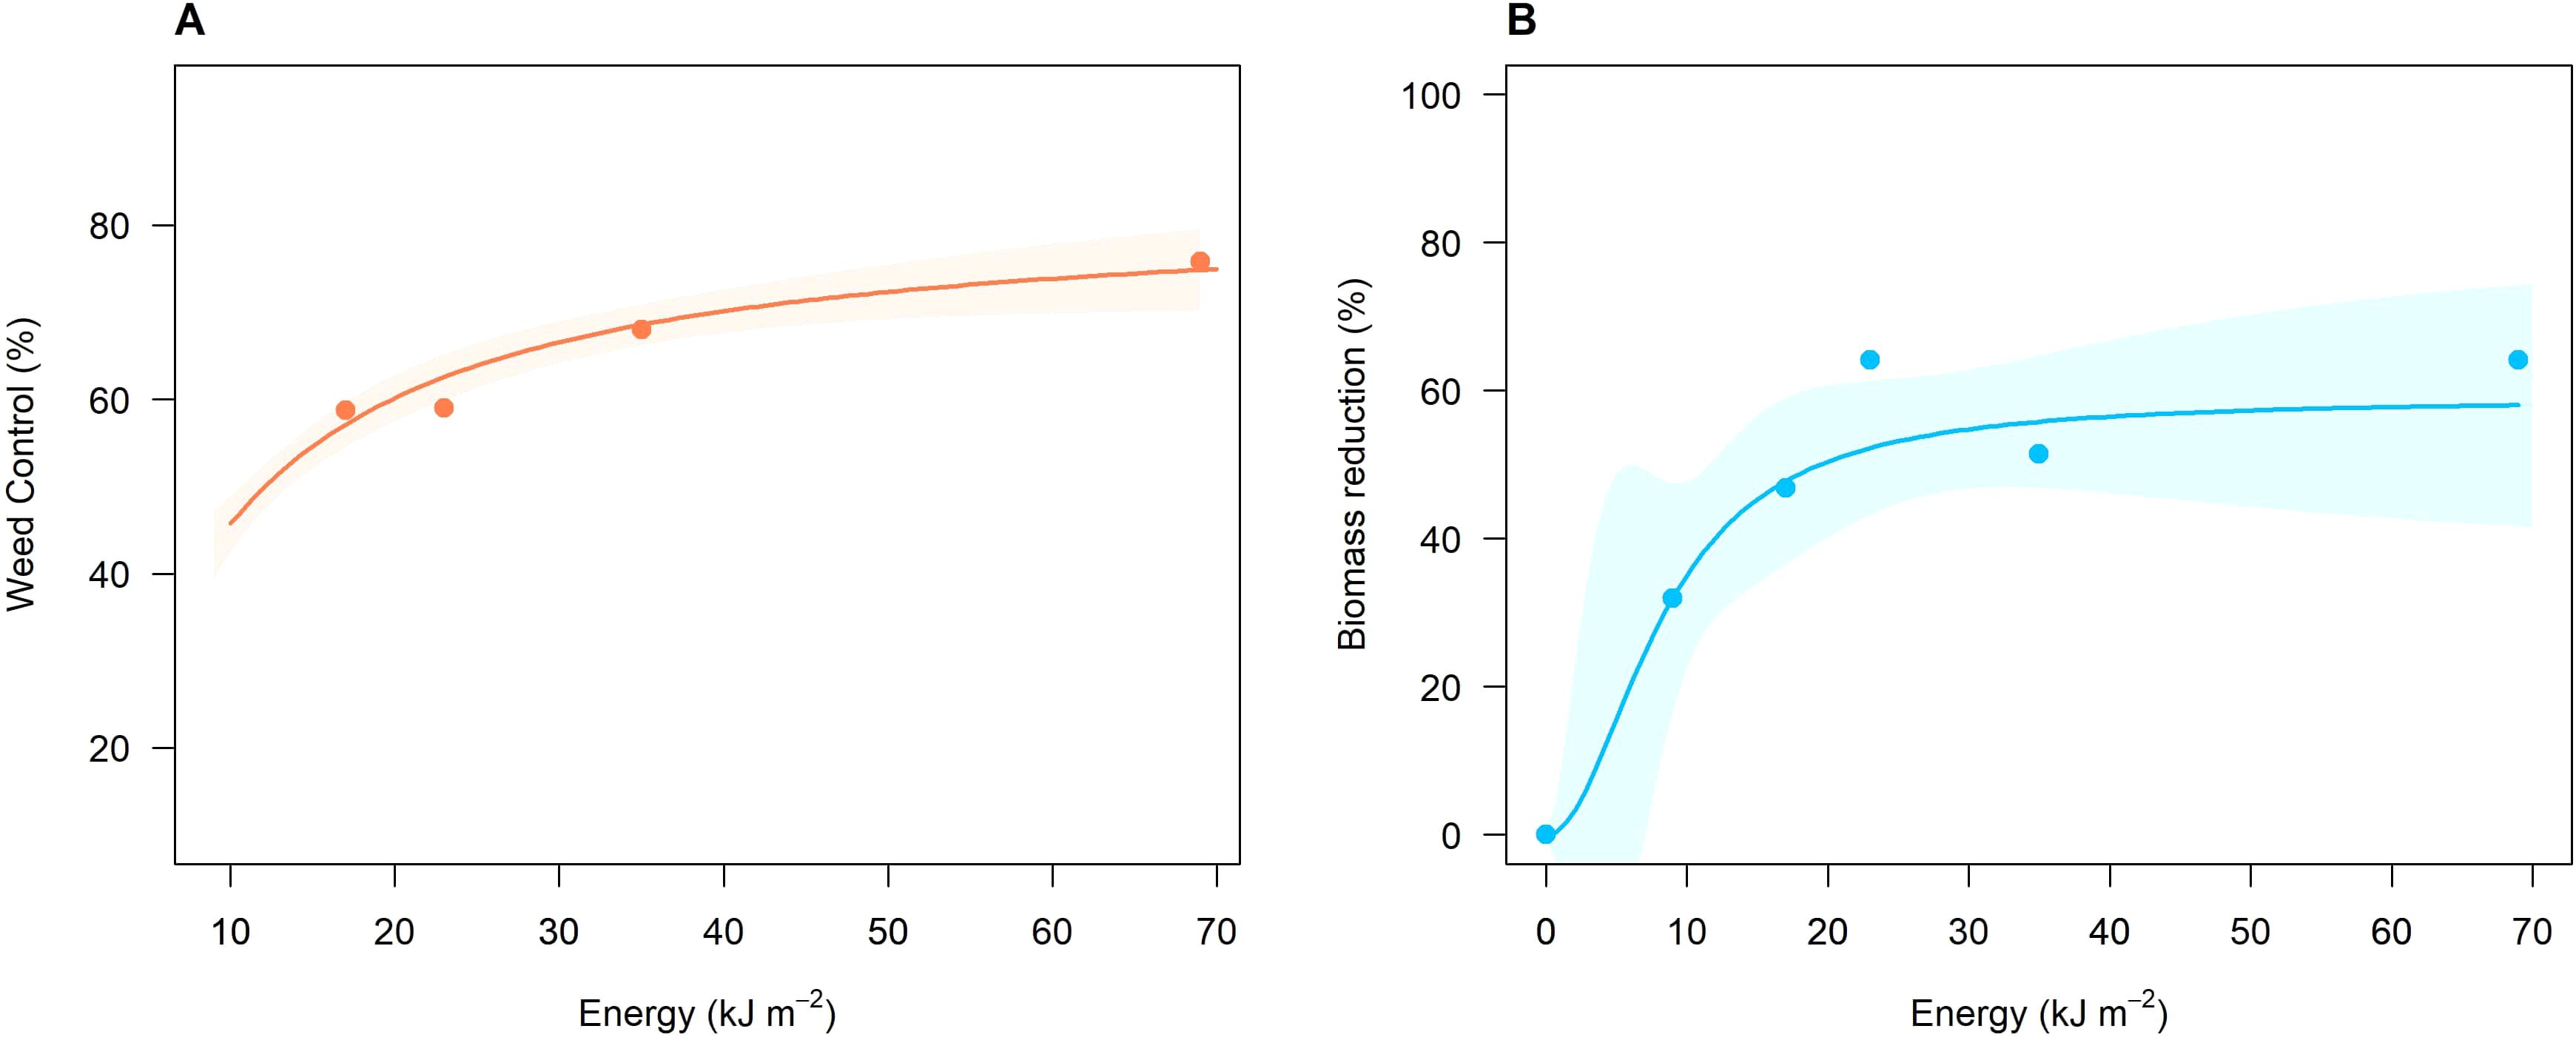
Figure 4. Dose–response of energy (kJ m-2) of electrical weed control (EWC) on (A) weed control efficacy and (B) weed biomass reduction, pooled across studies. Points represent observed means, solid lines are model predictions (three-parameter log-logistic function), and shaded areas represent 95% confidence intervals. Parameter estimates (± SE) for the weed control model were b (slope) = –1.15 (± 0.34), d (upper limit) = 81% (± 7.3%), and e (inflection point) = 8.0 (± 1.08) kJ m-2. Energy required to reach 50% control was 12.1 (± 2.68). For the biomass reduction model, estimates were b = –2.03 (± 2.06), d = 58% (± 11.2), and e = 8.2 (± 2.3) kJ m-2. Energy required to reach 50% biomass reduction was 19.42 (± 16.66).
In contrast, aboveground weed biomass reduction was less responsive and more heterogeneous. The biomass model estimated an upper limit of 58% (± 11.2, p < 0.001), with slope b = –2.03 (± 2.06, p = 0.33) and ED50 19.42 (± 16.66). Predicted biomass reduction was 32% at 9 kJ m-2 and increased gradually to 58% at 72 kJ m-2, but confidence intervals were wide. These results indicated that, while weed control improved with increasing energy dose, biomass reductions were inconsistent and less responsive to treatment intensity likely affected by variability in weed species and density among fields. Planned contrasts comparing a single application at 1 km h-1 with two sequential applications at 2 km h-1 showed that sequential applications provided significantly higher weed control than a single slower pass, with an average increase of 13.9 percentage points (z = −2.79, p = 0.0053) (Table 5). This advantage was observed regardless of the equipment used. In contrast, effects on weed biomass were not significant (t = 1.17, p = 0.25).
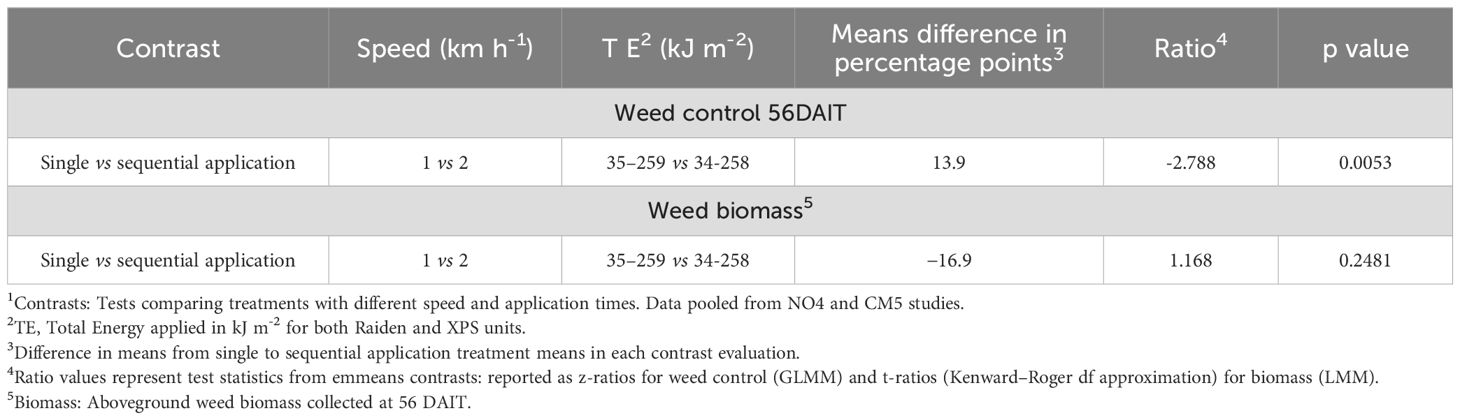
Table 5. Planned contrasts (NO4 and CM5 pooled) comparing single vs. two sequential electrical weed control (EWC) applications on weed control and weed biomass at 56 DAIT1.
4 Discussion
Overall, our results demonstrate that EWC effectively controlled multiple weed species in organic blueberries, with 63% to 89% total weed control achieved at 0.5 and 1 km h-1 by up to 56 DAIT, and up to 73% reduction in aboveground weed biomass relative to the nontreated control. Comparable levels of control have been reported in earlier electrothermal studies. Diprose et al. (1980) achieved up to 75% control of annual beet, which includes volunteer weed beet from cross-pollination and crop plants that have bolted, in sugar beet fields using the Lasco Lightning Weeder at voltages ≥5 kV and long contact times, often stopping the tractor to apply 4–8.4 kV for 4–22 s per plant. While effective, these systems required high energy inputs, with continuous-contact electrocution estimated at 19 MJ ha-1 (Diprose and Benson, 1984), equivalent to 1,900 kJ m-2, over 54 times higher than the 35 kJ m-2 applied in treatments tested here. When compared to other nonchemical methods, Moretti and Pedroso (2023) reported 72% to 99% control in organic highbush blueberry systems using saturated steam (SS) combined with a rotary brush, but SS required 10 to 21 times more energy (365–740 kJ m-2) than EWC to achieve >90% weed control and treatment effects last 14 days. Unlike SS or other energy-intensive alternatives such as flaming (100–433 kJ m-2) or infrared systems (200–388 kJ m-2) (Coleman et al., 2019), EWC transmits lethal energy into underground structures, contributing to longer-lasting control. Given that high energy requirements and operational hazards were historically key barriers to adoption (Korres et al., 2019; Wei et al., 2010), the reduced energy demand observed with the Raiden and XPS units tested here suggests that modern EWC systems may represent a substantial improvement in the practicality and cost-effectiveness of this technology for specialty crop production.
A limitation of this study is that the number of operations experiment in Independence and the combined-methods experiment in Jefferson could not be repeated, owing to the large plot size requirements, reliance on commercial farms, and limited access to EWC equipment after the studies. Such logistical constraints are common when evaluating novel technologies. To strengthen inference, we conducted pooled analyses across sites and experiments, which consistently demonstrated similar patterns, and thereby increase confidence in the validity of our findings. Nevertheless, given the novelty of EWC in perennial fruit systems and the rising interest in nonchemical alternatives, these findings represent valuable early evidence of the potential of this technology in organic blueberry production.
Although slower operational speeds enhance immediate weed control by increasing energy delivery per unit area, they can compromise operational efficiency by prolonging treatment times, cost of application, and limiting area treated and retreatment time, potentially allowing new weed emergence between applications. The results presented here indicated that applying multiple times at faster speed (2–4 km h-1) achieved equal or greater weed control than a single treatment at 0.5–1 km h-1, provided the total energy applied per area was the same. This aligns with Peters et al. (2020), who found that one pass of the Weed Zapper™ could achieve >80% control of waterhemp escapes, but multiple passes improved efficacy in moderately dense infestations, particularly at later evaluation dates. Similarly, our results showed that sequential applications provided significantly greater weed control than single applications, regardless of the equipment used. Delivering energy across two applications at 2 km h-1 was more effective than concentrating energy in a single 1 km h-1 application and offered the additional advantage of controlling later-emerging weeds.
By contrast, biomass responses were more variable and did not differ significantly between sequential and single applications. Biomass reflects both surviving plants and regrowth, as well as new emergence following applications and evaluation dates, introducing greater variability than control ratings. Site-to-site differences in weed species composition, density, growth stage, seasonal timing, and soil or mulch conditions likely amplified this variability. These sources of heterogeneity widened confidence intervals, obscuring statistical significance despite the observed reduction of biomass under sequential applications. Operational speed also has major implications for the commercial scalability of EWC. For the XPS unit (0.3 m working width) tested in the combined-methods study, at 1 km h-1 a full day of operation could treat 0.24 ha under ideal conditions, whereas increasing speed to 4 km h-1 could raise coverage to 0.96 ha day−1. Such efficiency gains directly affect labor requirements, fuel consumption, and scheduling flexibility. Tractor fuel-use studies indicate that higher travel speeds can reduce daily operating hours, but must be balanced against increased load levels and power demand (Hansson et al., 2003; Grisso et al., 2014).
Adoption will also depend on how well equipment can navigate orchard constraints such as narrow row spacing, uneven terrain, and low-hanging branches. Modifications to blueberry field design such as larger row width, uniform bed shape and elevation, or training plants to facilitate access to the treated area could improve treatment efficacy. In addition to the Zasso and XPower units used in this study, other commercial EWC systems have been used in vineyards and orchards and could be adapted for blueberry production. Equipment improvements such as adjustable electrodes, height sensors, and integrated soil moisture monitoring may further enhance performance and safety. Adjustable electrodes allow the operator to modify the distance between the applicator and the soil surface or canopy, ensuring consistent energy delivery across uneven ground, raised beds, or varying plant heights.
The superior biomass reduction observed when mowing preceded EWC indicates that treatment sequence is an important determinant of efficacy. Mowing likely altered plant architecture by cutting tall stems and exposing regrowth tissues, which improved electrode contact and facilitated more effective energy transfer. This geometry effect may explain why mowing followed by EWC outperformed EWC followed by mowing, even when total energy applied was similar. Dense weed stands increase simultaneous electrode contacts, which can lower the energy delivered per plant and reduce efficacy if the lethal threshold is not reached (Vigneault and Benoit, 2001; Vigneault et al., 1990). This highlights the importance of stand structure, both height and density, in determining the effectiveness of combined mowing and EWC strategies. From a management perspective, mowing before EWC may be particularly useful in tall or dense perennial weed stands where direct electrode contact with basal tissues would otherwise be limited.
Differences in EWC efficacy across species are likely influenced by plant morphology (Diprose and Benson, 1984; Drolet and Rioux, 1983; Bauer et al., 2020). F. arundinacea, for example, is a perennial plants that has a dense fibrous root system and elevated lignin content in its tissues, which can dissipate electrical energy and limit the extent of current penetration and resulting damage. A single low-speed application may not deliver sufficient energy to overcome this reduced energy transfer, so multiple applications yield better results. In contrast, Epilobium ciliatum and Persicaria pensylvanica have upright growth forms and broader leaves that facilitate better electrode contact and more efficient energy delivery. These morphological characteristics likely contributed to the greater susceptibility observed for these species, >85% control, compared to grasses and prostrate broadleaf weeds. Such findings are consistent with theoretical models suggesting that plant structure and surface conductivity influence the lethal energy threshold for electrical treatments (Bauer et al., 2020; Vigneault and Benoit, 2001). Further research is needed to fully quantify how morphological traits across growth stages impact EWC efficacy under field conditions.
While this study focused on single-season outcomes, long-term weed population dynamics are an important consideration for evaluating EWC in perennial organic systems. By delivering lethal doses to both above- and underground structures, repeated applications could weaken perennial weeds by depleting root and rhizome carbohydrate reserves (Bauer et al., 2020; Slaven and Borger, 2024) and reduce seedbank inputs by suppressing annual weeds before seed set (Gallandt, 2006). Over time, such effects may lower overall weed pressure, but selective efficacy could also shift community composition toward species less affected by electrical injury, such as grasses with dense fibrous roots or prostrate growth forms. Strategic seasonal timing targeting early flushes of annuals in spring and perennial escapes before dormancy may help maintain broad-spectrum control, limit biomass accumulation, and reduce energy demand for later passes. Incorporating EWC within a multi-year, integrated management program will be essential to sustain efficacy and prevent shifts toward tolerant species.
Weed management has been identified as one of the most challenging aspects of organic blueberry production, and long-term studies have shown that mulch systems such as sawdust, compost topped with sawdust, and weed mat differ greatly in weed suppression, labor requirements, and economic return. Weed mat generally provides the most consistent long-term control with the lowest labor inputs (Strik and Vance, 2017), while thick applications of organic mulches, such as pine needles or compost, can reduce weed biomass and improve soil properties but may require more frequent maintenance (Burkhard et al., 2009). EWC is compatible with organic mulches, such as sawdust, bark, and can be safely applied over these materials without compromising performance. However, direct application over plastic mulch is not recommended, as it may damage the material. In highbush blueberries, EWC can be used effectively along the edges of plastic-mulched rows to suppress emerging weeds while maintaining the integrity of the mulch (L. Baccin, personal observations). Importantly, no injury to the blueberry plants was observed in our trials. Electrodes were operated to avoid direct stem or canopy contact, and mature plantings (5–10 years old) showed no visible symptoms during or after treatments. These findings indicate that EWC can be applied safely in established blueberry systems when operated correctly. Because EWC can operate safely over most organic mulches, it has potential to complement these systems by controlling escapes and edge-emerging weeds, extending mulch lifespan, and reducing hand weeding needs. Furthermore, fire risk is generally low under moist soil conditions or when non-flammable mulches are present, but caution is needed during dry periods or in the presence of dry organic debris. In particular, mulches composed of straw or other easily combustible residues can increase fire hazard, as ignition has been observed when dry straw or dead plant material was present (Slaven and Borger, 2024). Proper operator training and treatments at time of low fire risk are essential for mitigating this risk.
Although EWC equipment requires a high initial investment (ranging from $80,000 to $150,000 as of 2025), potential long-term savings from reduced weed pressure, fewer applications, and compatibility with organic certification may offset costs over time. Because operational parameters such as speed and number of applications directly affect labor hours, treated area, and fuel use, these factors will strongly influence cost-effectiveness. Operator training is also a key component of economic viability, as skilled operation improves treatment efficiency, reduces the risk of equipment damage or fire hazard, and ensures consistent weed control across variable field conditions. Further economic analyses are needed to assess viability across production scales and growing conditions. The present study demonstrate that EWC is an effective nonchemical weed management strategy in organic blueberry production. Consistent with our hypotheses, slower operational speeds generally increased immediate weed control, while sequential applications at moderate to faster speeds effectively maintained control by targeting later-emerging weeds. Species responses varied, with upright broadleaf weeds more effectively managed than grasses and prostrate forms, reflecting the influence of plant morphology on treatment efficacy. While this technology is promising, further work is needed to optimize EWC for commercial adoption, including evaluation of long-term weed suppression, crop response to repeated exposure to EWC, and operational efficiency. Evaluating labor requirements, energy use per year (MJ ha-1 yr-1), and costs is crucial for determining the scalability of this approach in organic systems and for establishing EWC as a reliable component of sustainable weed management.
Data availability statement
The raw data supporting the conclusions of this article will be made available by the authors, without undue reservation.
Author contributions
LB: Conceptualization, Data curation, Formal Analysis, Investigation, Methodology, Project administration, Resources, Software, Supervision, Validation, Visualization, Writing – original draft, Writing – review & editing. MM: Conceptualization, Data curation, Formal Analysis, Funding acquisition, Investigation, Methodology, Project administration, Resources, Software, Supervision, Validation, Visualization, Writing – review & editing.
Funding
The author(s) declare financial support was received for the research and/or publication of this article. This research was supported by the United States Department of Agriculture – National Institute of Food and Agriculture, Organic Agriculture Research and Extension Initiative (OREI), Award No. 2021-51300-34911.
Acknowledgments
The authors thank David King for his valuable assistance with treatment applications, and the Weed Science Lab members in the Department of Horticulture at Oregon State University for their support with field data collection. We are grateful to Agricare Inc. for providing access to the certified organic orchard where this research was conducted. We also extend our appreciation to Burrows Equipment for supplying the tractor and the Zasso electric weeder used in the field studies.
Conflict of interest
The authors declare that the research was conducted in the absence of any commercial or financial relationships that could be construed as a potential conflict of interest.
Generative AI statement
The author(s) declare that no Generative AI was used in the creation of this manuscript.
Any alternative text (alt text) provided alongside figures in this article has been generated by Frontiers with the support of artificial intelligence and reasonable efforts have been made to ensure accuracy, including review by the authors wherever possible. If you identify any issues, please contact us.
Publisher’s note
All claims expressed in this article are solely those of the authors and do not necessarily represent those of their affiliated organizations, or those of the publisher, the editors and the reviewers. Any product that may be evaluated in this article, or claim that may be made by its manufacturer, is not guaranteed or endorsed by the publisher.
Nomenclature
Pennsylvania smartweed; Persicaria pensylvanica (L.); tall fescue; Festuca arundinacea Schreb.; Northern willowherb; Epilobium ciliatum Raf.; sharppoint fluvellin; Kickxia elatine (L.); highbush blueberry; Vaccinium corymbosum L.
References
Aho K. A. (2013). Foundational and applied statistics for biologists using R (Boca Raton, FL: CRC Press).
Bauer M., Marx C., Bauer F., Flury D., Ripken T., and Streit B. (2020). Thermal weed control technologies for conservation agriculture – a review. Weed Res. 60, 241–250. doi: 10.1111/wre.12418
Brooks M. E., Kristensen K., Van Benthem K. J., Magnusson A., Berg C. W., Nielsen A., et al. (2017). glmmTMB balances speed and flexibility among packages for zero-inflated generalized linear mixed modeling. R J. Vol. 9. 378–400. doi: 10.32614/RJ-2017-066
Burkhard N., Lynch D., Percival D., and Sharifi M. (2009). Organic mulch impact on vegetation dynamics and productivity of highbush blueberry under organic production. HortScience 44, 688–696. doi: 10.21273/HORTSCI.44.3.688
Canadian Weed Science Society (2018). Description of 0–100 rating scale for herbicide efficacy and crop phytotoxicity. Available online at: https://weedscience.ca/cwss-visual-ratings-scale/ (Accessed April 26, 2025).
Coleman G. R. Y., Stead A., Rigter M. P., Slaven M., and Borger C. P. D. (2019). Using energy requirements to compare the suitability of alternative methods for broadcast and site-specific weed control. Weed Technol. 33, 633–650. doi: 10.1017/wet.2019.32
DeVetter L. W., Granatstein D., Kirby E., and Brady M. (2015). Opportunities and challenges of organic highbush blueberry production in Washington State. HortTechnology 25, 796–804. doi: 10.21273/HORTTECH.25.6.796
Diprose M. and Benson F. A. (1984). Electrical methods of killing plants. J. Agric. Eng. Res. 30, 197–209. doi: 10.1016/S0021-8634(84)80021-9
Diprose M. F., Benson F. A., and Hackam R. (1980). Electrothermal control of weed beet and bolting sugar beet. Weed Res. 20, 311–322. doi: 10.1111/j.1365-3180.1980.tb01625.x
Drolet C. and Rioux R. (1983). Évaluation d’une rampe utilisant un courant électrique pour le contrôle des mauvaises herbes (Ottawa, Canada: Energy, Research and Development in Agriculture and Food Program (ERDAF), Rep), 345Z.01843-1-EC24–66.
Feys J., De Cauwer B., Reheul D., Sciffer C., Clercx S., and Palmans S. (2023). Impact of electrocution on shoot and tuber vitality of yellow nutsedge (Cyperus esculentus). Agriculture 13, 696. doi: 10.3390/agriculture13030696
Gallandt E. R. (2006). How can we target the weed seedbank? Weed Sci. 54, 588–596. doi: 10.1614/WS-05-063R.1
Garnier S. (2018). viridis: Default color maps from ‘matplotlib’ (R package version 0.5.1). Available online at: https://CRAN.R-project.org/package=viridis (Accessed April 26, 2025).
Golovinskaia O. and Wang C. K. (2021). Review of functional and pharmacological activities of berries. Molecules 26, 3904. doi: 10.3390/molecules26133904
Grisso R., Perumpral J. V., Roberson G. T., and Pitman R. (2014). Using tractor test data for selecting farm tractors (Blacksburg: Virginia Cooperative Extension, Publication), 442-072–11.
Grisso R., Pitman R., Perumpral J. V., and Roberson G. T. (2010). Gear up and throttle down to save fuel (Blacksburg, VA: Virginia Cooperative Extension, Publication), 442–450.
Hansson P. A., Lindgren M., Nordin M., and Pettersson O. (2003). A methodology for measuring the effects of transient loads on the fuel efficiency of agricultural tractors. Appl. Eng. Agric. 19, 251–257. doi: 10.13031/2013.13657
Hartig F. (2020). DHARMa: Residual Diagnostics for Hierarchical (Multi-Level/Mixed) Regression Models. R package version 0.3.2.0. Available online at: https://florianhartig.github.io/DHARMa/ (Accessed October 15, 2025).
Korres N. E., Burgos N. R., Travlos I., Vurro M., Gitsopoulos T. K., Varanasi V. K., et al. (2019). New directions for integrated weed management: modern technologies, tools and knowledge discovery. Adv. Agron. 155, 243–319. doi: 10.1016/bs.agron.2019.01.006
Kuznetsova A., Brockhoff P. B., and Christensen R. H. B. (2017). lmerTest package: Tests in linear mixed effects models. J. Stat. Software 82, 1–26. doi: 10.18637/jss.v082.i13
Lenth R. (2023). emmeans: Estimated Marginal Means, aka Least-Squares Means (R package version 1.8.9). Available online at: https://CRAN.R-project.org/package=emmeans (Accessed April 26, 2025).
Moretti M. L. and Pedroso R. M. (2023). Weed control with saturated steam in organic highbush blueberry. Front. Agron. 5. doi: 10.3389/fagro.2023.1297979
Peters T. J., Borgen R. M., and Lystad A. L. (2020). “Weed control using high voltage electricity,” in Sugarbeet Res Ext Rep (Sugarbeet Research and Education Board, Fargo, ND).
Ritz C., Baty F., Streibig J. C., and Gerhard D. (2015). Dose-response analysis using R. PloS One 10, e0146021. doi: 10.1371/journal.pone.0146021
Sahin H. and Yalınkılıç M. (2017). Using electric current as a weed control method. Eur. J. Eng. Res. Sci. 2, 59–64. doi: 10.24018/ejeng.2017.2.6.379
Schreier H., Bish M., and Bradley K. (2022). The impact of electrocution treatments on weed control and weed seed viability in soybean. Weed Technol. 36, 481–489. doi: 10.1017/wet.2022.56
Silva S., Costa E. M., Veiga M., Morais R. M., Calhau C., and Pintado M. (2020). Health promoting properties of blueberries: a review. Crit. Rev. Food Sci. Nutr. 60, 181–200. doi: 10.1080/10408398.2018.1518895
Slaven C. and Borger C. (2024). What is the best fit for electric weed control in Australia? (Northam, Australia: Department of Primary Industries and Regional Development). Available online at: https://www.agric.wa.gov.au (Accessed April 26, 2025).
Slaven M. J., Koch M., and Borger C. P. D. (2023). Exploring the potential of electric weed control: a review. Weed Sci. 71, 403–421. doi: 10.1017/wsc.2023.38
Strik B. C. and Vance A. J. (2017). “Weed management strategies in long-term organic blueberry production systems—impact of mulch type and weed control methods on economics,” in Acta Horticulturae, vol. 1180 . Ed. Olmstead J. W. (International Society for Horticultural Science, Leuven, Belgium), 347–354. doi: 10.17660/ActaHortic.2017.1180.47
Vigneault C. and Benoit D. (2001). “Electrical weed control: theory and applications,” in Physical Control Methods in Plant Protection. Eds. Vincent C., Panneton B., and Fleurat-Lessard F. (Springer, Berlin), 174–188.
Vigneault C., Benoit D. L., and McLaughlin N. B. (1990). Energy aspects of weed electrocution. Rev. Weed Sci. 5, 15–26.
Wei D., Liping C., Zhijun M., Guangwei W., and Ruirui Z. (2010). Review of non-chemical weed management for green agriculture. Int. J. Agric. Biol. Eng. 3, 52–60. doi: 10.3965/j.issn.1934-6344.2010.04.052-060
Yeh D. A., Kramer J., Calvin L., and Weber C. (2023). The Changing Landscape of U.S. Strawberry and Blueberry Markets: Production, Trade, and Challenges from 2000 to 2020. USDA Economic Research Service Report EIB-257 (Washington, DC: USDA). Available online at: https://www.ers.usda.gov (Accessed May 8, 2025).
Zhang J. (2022). IBO reports on status of global blueberry industry. Available online at: https://www.producereport.com/article/ibo-reports-status-global-blueberry-industry (Accessed May 19, 2025).
Keywords: energy dose, electrophysical weed control, field efficacy, highbush blueberry, non-chemical weed management, organic weed management, perennial weed control
Citation: Baccin LC and Moretti ML (2025) Electrical weed control in organic highbush blueberry: influence of operational speed and number of applications on weed control. Front. Agron. 7:1688961. doi: 10.3389/fagro.2025.1688961
Received: 19 August 2025; Accepted: 06 October 2025;
Published: 27 October 2025.
Edited by:
Bruno Canella Vieira, Syngenta, SwitzerlandReviewed by:
Stephen Christopher Marble, University of Florida, United StatesBadal Verma, Indian Institute of Agricultural Biotechnology (ICAR), India
Copyright © 2025 Baccin and Moretti. This is an open-access article distributed under the terms of the Creative Commons Attribution License (CC BY). The use, distribution or reproduction in other forums is permitted, provided the original author(s) and the copyright owner(s) are credited and that the original publication in this journal is cited, in accordance with accepted academic practice. No use, distribution or reproduction is permitted which does not comply with these terms.
*Correspondence: Luisa C. Baccin, YmFjY2lubEBvcmVnb25zdGF0ZS5lZHU=
†ORCID: Luisa C. Baccin, orcid.org/0000-0001-6456-6044
Marcelo L. Moretti, orcid.org/0000-0001-8313-9195