 Vijayakumar Shanmugam1,2*
 Virender Kumar2
 Raman Meenakshi Sundaram1
 Rapolu Mahender Kumar1
 Panneerselvam Peramaiyan3
 Varunseelan Murugaiyan2
 Amaresh Kumar Nayak4
- 1ICAR-Indian Institute of Rice Research, Hyderabad, India
- 2International Rice Research Institute, Los Baños, Philippines
- 3IRRI South Asia Regional Centre, Varanasi, Uttar Pradesh, India
- 4ICAR-Central Rice Research Institute, Cuttack, Odisha, India
India, the second-largest food producer and world’s largest livestock rearer, lacks comprehensive quantitative data on domestic organic waste generation, which hinders sustainable nutrient management and increases reliance on costly inorganic fertilizers. This study addresses this gap by quantifying the national and state-level potential of key organic wastes to bridge the country’s fertilizer demand. We quantify the annual generation of Nitrogen (N), Phosphorus (P), and Potassium (K) from various organic wastes and utilize these data to evaluate the potential for organic farming across Indian states by analyzing the nutrient balance between organic supply potential and inorganic fertilizer demand. Annually, India generates 667.7 million tons (MT) of animal waste, contributing 4.49 MT of N, 1.77 MT of P, and 3.31 MT of K. Cattle and buffalo account for over 90% of this generation. Additionally, 762.8 MT of crop residue is generated, primarily from rice, wheat, and sugarcane, yielding 4.55 MT of N, 0.53 MT of P, and 6.61 MT of K. Oil meal (23.3 MT) contributes an additional 1.51 MT of N, 0.25 MT of P, and 0.24 MT of K annually. Collectively, organic waste generates a massive resource of 10.6 MT of N, 2.6 MT of P, and 10.2 MT of K per year. Uttar Pradesh leads in organic nutrient generation, contributing 14.6% of N, 12.3% of P, and 18% of K, followed by Madhya Pradesh. On average, 10.1 tons of organic waste is available per-hectare in India, which could provide 75.6 kg of N, 18.0 kg of P, and 71.7 kg of K annually. However, significant region-specific nutrient imbalances persist. Among 36 states and union territories, 17 and 20 show negative N and P balances, respectively, while all states except Kerala have a positive K balance. The quantified state-level nutrient balance provides an essential roadmap for region-specific agricultural planning. Positive nutrient balance states should prioritize a rapid transition toward organic farming policies, while negative balanced states require strategic integrated nutrient management policies.
1 Introduction
Soil fertility is critical for both crop growth and a healthy ecosystem (McGrath et al., 2014). However, intensive agricultural practices driven by a growing global population have led to widespread soil degradation and fertility decline (Bisht and Chauhan, 2020; Vijayakumar et al., 2024a, Vijayakumar et al., 2024b). The indiscriminate use of chemical fertilizers and pesticides to boost yields has further exacerbated the problem, contributing to water contamination and other environmental concerns (Aktar et al., 2009; Tudi et al., 2021). These fertilizers, often containing only one or two essential nutrients, are highly soluble and release their nutrients rapidly upon contact with water. Consequently, their nutrient use efficiency is lower. Additionally, the high cost of inorganic fertilizers renders them inaccessible to numerous farmers (Basak et al., 2023).
In contrast, organic waste offers a natural, environmentally friendly solution. It provides several essential plant nutrients, releases them steadily over time, promotes soil health and fertility (Wang et al., 2020; Rani, 2022), and avoids negative environmental consequences (Horrigan et al., 2002). Critically, the effective management of agricultural waste, particularly crop residues, is not only an opportunity for nutrient recycling but a necessity for environmental protection (Dutta et al., 2022). Organic waste management can be implemented at a modest expense, making it an economically viable option for farmers, particularly considering the prevalence of livestock ownership among Indian farmers (Röös et al., 2018). Incorporating organic waste enhances soil health by improving water and nutrient retention, leading to increased crop yields, reduced farming costs, and sustainable agricultural practices in the long term (Yadav et al., 2013a; Brar et al., 2015; Wang et al., 2020; Rani, 2022).
However, modern, mechanized harvesting often leaves vast quantities of crop residue that are often burnt in situ due to the lack of viable collection and processing infrastructure. This practice, a form of mismanagement, leads to severe air pollution, loss of valuable nutrients, and soil carbon depletion, underscoring the necessity of developing large-scale agricultural waste management strategies (Dutta et al., 2022). Traditionally, crop residue and oil meal have been utilized as animal feed, while animal dung is used as manure. This mixed farming system of Indian agriculture was more sustainable compared to modern, input-intensive practices (Deb, 2015; Baker et al., 2023).
In mixed farming, the waste products of one enterprise serve as input for others within the system, reducing the need for external resources and aligning with organic agriculture practices (Gamage et al., 2023). Animal waste serves as a natural reservoir of nutrients for the soil, enhances soil fertility, and promotes a healthy ecosystem. India boasts the world’s largest livestock population, encompassing cattle, buffalo, sheep, goats, horses, camels, pigs, mules, donkeys, yaks, and poultry (Radha and Kumar, 2022). These animals are vital to the nation’s food security, agriculture, and economy, providing essential resources like dairy products, fertilizer, meat, and draft power (Herrero et al., 2013; Dash, 2017).
Despite having the world’s largest livestock population and animal waste generation, the proportion of organic farming in the total agricultural land is extremely low. As of March 31, 2023, only 10.17 million hectares (Mha) of India’s agricultural land is certified organic, with Madhya Pradesh leading the way in certifications. Globally, India ranks 2nd in the organic agriculture area and 1st in the number of organic producers. Among the Indian states, Sikkim stands as a unique example, having successfully transitioned to a fully organic state in 2016, demonstrating the potential for broader adoption (Paunglad, 2022).
Estimating organic waste generation from various sources, such as animal waste, crop residue, and oil meal, is crucial to determining the potential extent of agricultural land that could be converted to organic farming (Pathak and Fagodiya, 2022). This assessment helps identify suitable regions for organic agriculture and the amount of organic manure needed to maintain soil fertility (Mishra et al., 2015). Additionally, understanding the state-wise and crop-wise contributions to total annual crop residue generation is imperative, as it reveals regional variations and the dominance of certain crops in residue generation, which is critical for developing sustainable residue management practices (Dutta et al., 2022). Regions with high organic waste generation are more suitable for organic agriculture, prompting policymakers to encourage farmers to adopt organic practices and provide the necessary support. Conversely, regions with low organic waste generation require alternative approaches, such as integrated nutrient management (INM) (Paunglad, 2022). Thus, assessing organic waste generation through crops and livestock can help identify regions conducive to organic agriculture and areas where reducing reliance on chemical fertilizers is viable. This approach will foster the sustainable development of the agricultural sector.
To date, there has been no comprehensive effort in India to quantify the annual generation of animal manure at both the national and state levels. Consequently, the generation of nitrogen (N), phosphorus (P), and potassium (K) from animal manures has not been estimated. Although there have been a few attempts to estimate the total generation of crop residue in the country, these estimates are outdated and do not accurately represent current generation levels. Additionally, none of these studies have assessed the generation of N, P, and K from crop residues. The same gap exists for oil meal and animal waste generation. The lack of accurate information about organic waste generation in India significantly impacts the agricultural sector, hindering policymakers from making informed decisions and supporting the transition to organic agriculture. This information is crucial for policy development and implementation at both the central and state government levels. Therefore, this study aimed to address the above knowledge gaps by a) estimating total organic waste generation in India by state, crop, and livestock category; b) calculating the total N, P, and K generation from various organic sources in each state; and c) assessing the state-wise balance of N, P, and K between organic sources and inorganic fertilizers.
2 Material and methods
2.1 Study area
India, the world’s most populous nation with over 1.43 billion people, the second-largest food producer, and the largest livestock rearer (1,387.2 million animals/year), lacks comprehensive data on annual organic waste production by state, crop, and livestock category. This study addresses this gap by estimating India’s annual organic waste generation, categorized by state, crop, and livestock. India comprises 28 states and 8 Union Territories (UTs). Data for Ladakh, recently designated as a UT separate from Jammu & Kashmir, is included within Jammu & Kashmir due to the unavailability of separate records. Chandigarh, another UT and the shared capital of Haryana and Punjab, is treated independently, with its data presented separately from these states. The overall methodology followed in the study is presented in Figure 1.
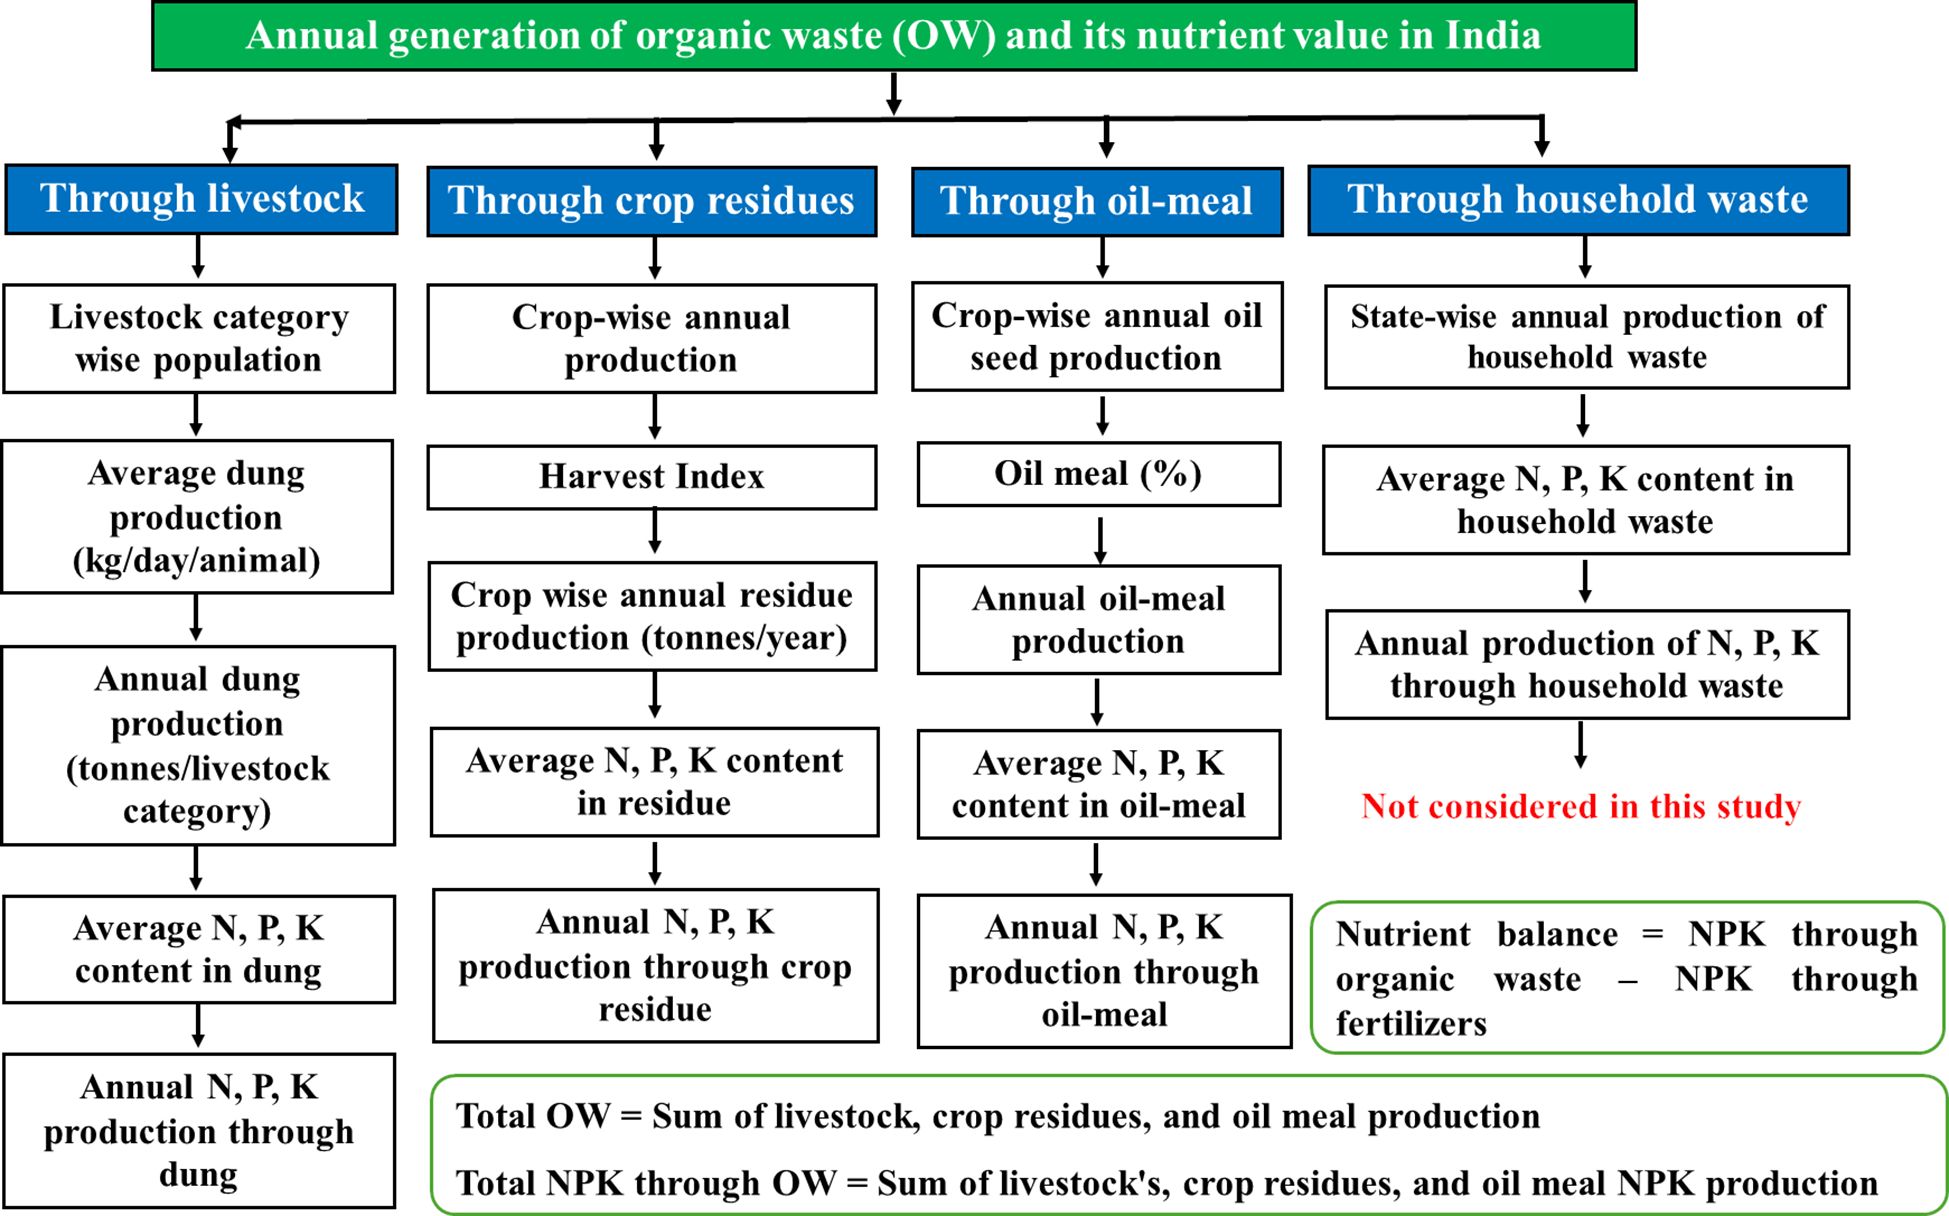
Figure 1. The overall methodology of the study.
2.2 Estimation of annual animal waste production and its nutrient value
The animal waste was estimated for 11 domestic animals: cattle, buffalo, sheep, goats, horses, camels, pigs, mules, donkeys, yaks, and poultry. Livestock population data from 1951 to 2019 were sourced from Indiastat.com. In India, a livestock census is conducted every five years, resulting in a dataset aligned with this periodicity (Supplementary Figure 1). For each livestock category, the total population was multiplied by the corresponding average daily dung generation (Table 1) to estimate daily dung output. This value was then scaled to an annual estimate by multiplying by 365 and expressed in metric tons per year (t/year). These calculations were systematically applied to each livestock category across all states.
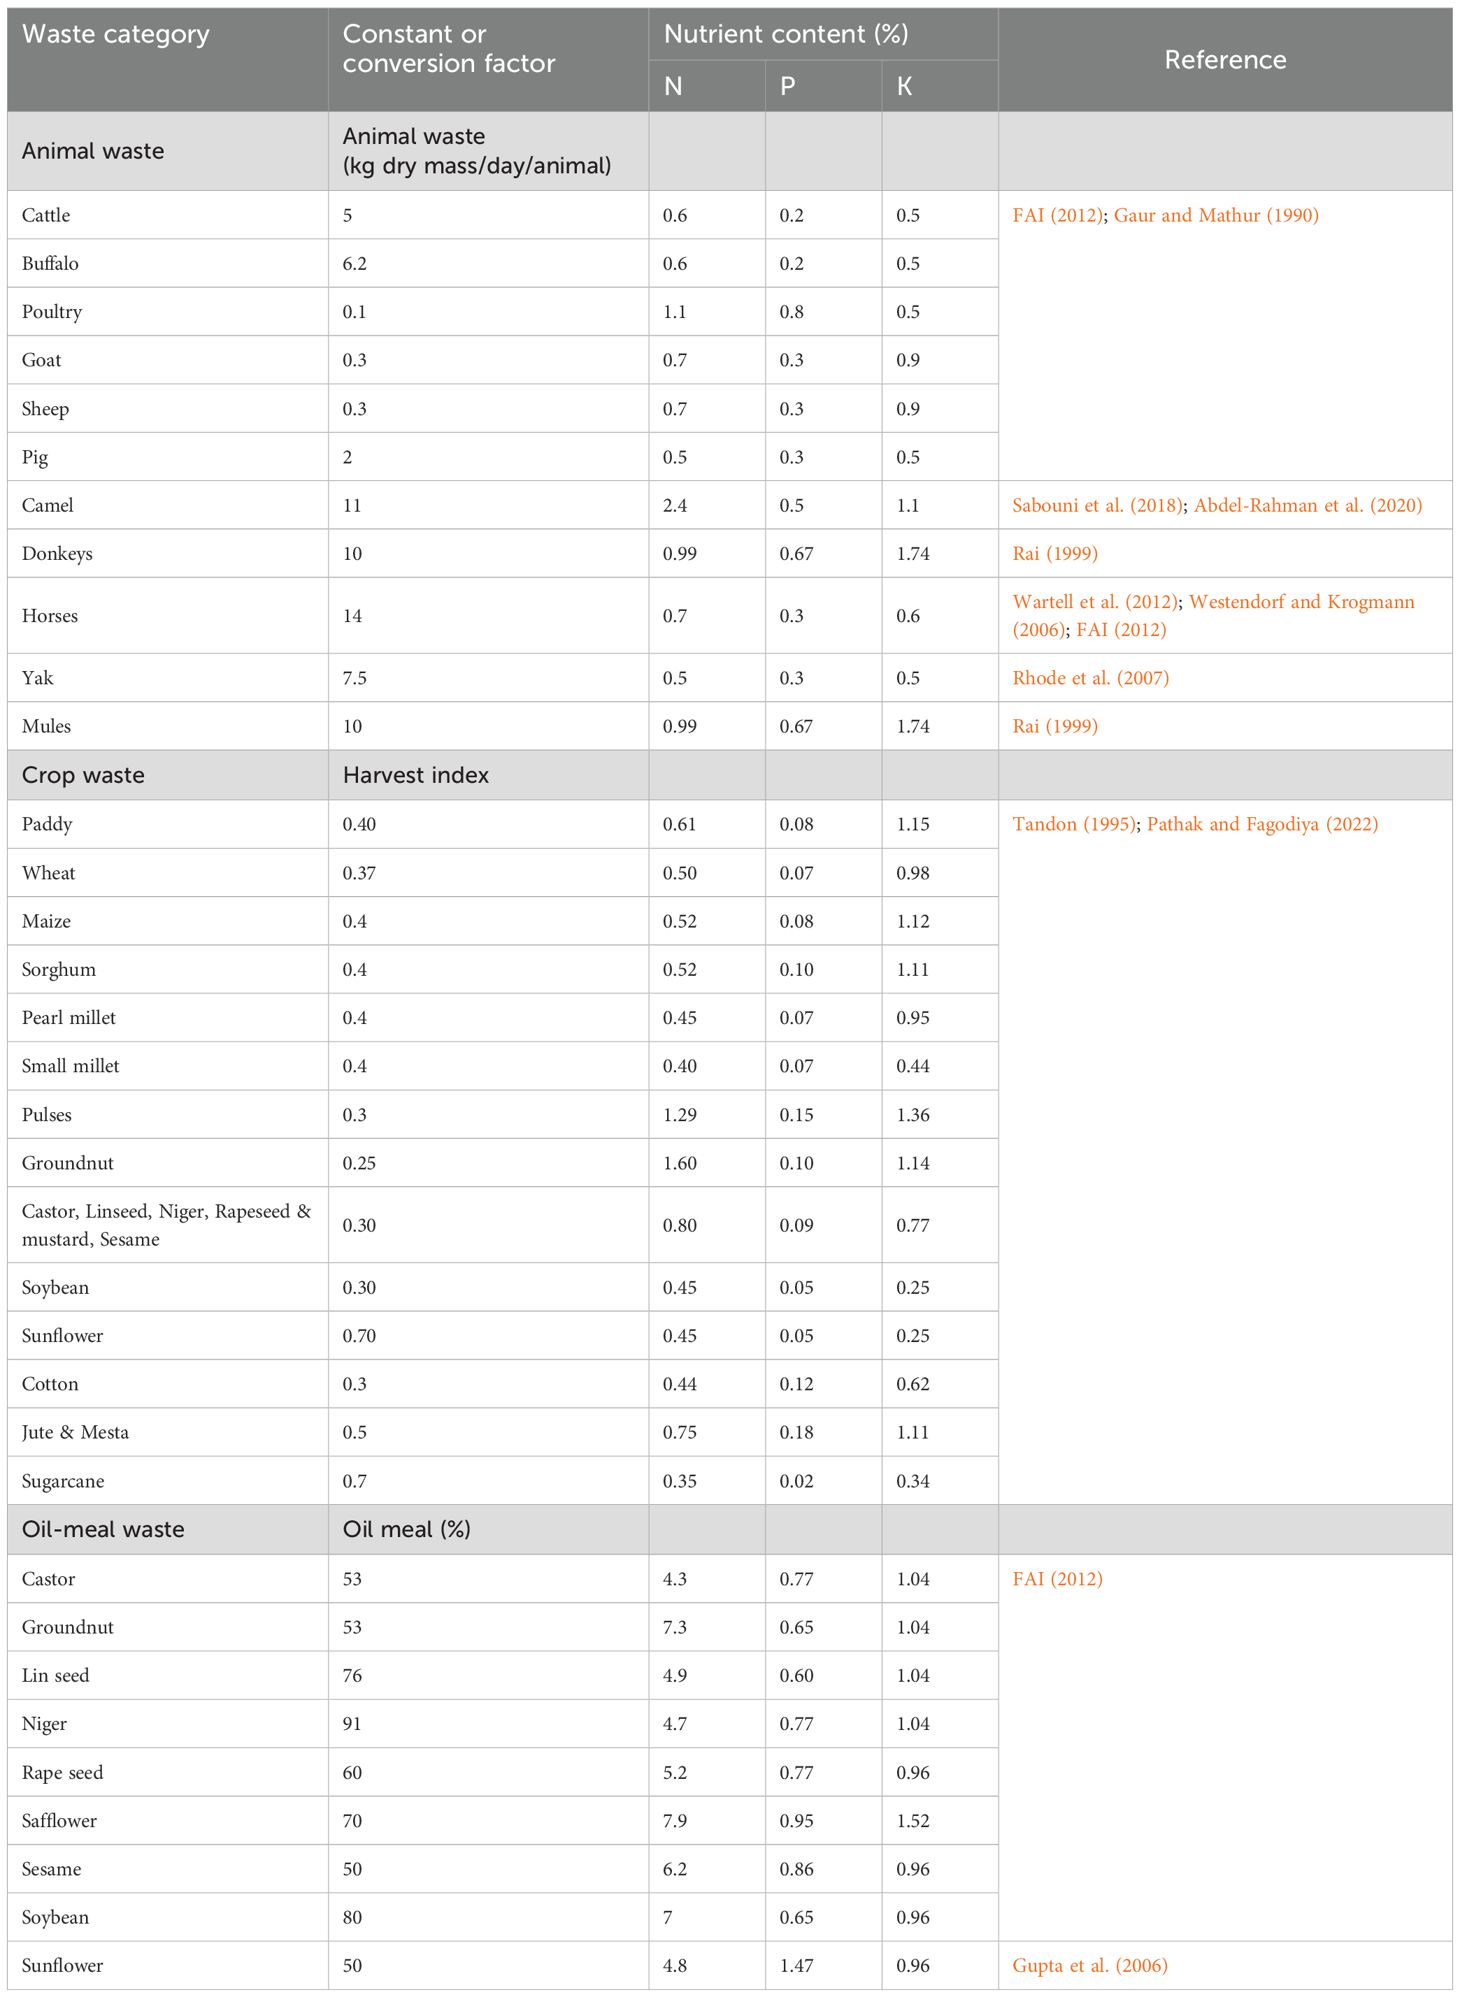
Table 1. Constants used for estimating waste generation and nutrient potential from crops and animals.
The annual generation of N, P, and K from animal waste is determined by multiplying the total annual dung generation by their respective N, P, and K content (Table 1). This computation is carried out for all the states and livestock separately.
2.3 Estimation of annual crop residue generation and its nutrient value
The annual crop residue generation for each crop was estimated in two steps. First, the biological yield was calculated by dividing the annual economic yield by the harvest index of the respective crop (Table 1). Subsequently, the straw yield (crop residue) was derived by subtracting the economic yield from the biological yield. The 2021 annual economic yield data for each crop were sourced from Indiastat.com. This study includes 4 cereals, 3 millets (aggregating all 6 small millets as one category), 9 pulses, 3 fiber crops, 9 oilseeds, and 1 sugar crop (sugar cane).
To estimate N, P, and K generation from crop residue, the computed residue is multiplied by the respective nutrient content in the residue (Table 1). These calculations were systematically applied to each crop and state, enabling the determination of crop-wise and state-wise total residue production and nutrient generation.
2.4 Estimation of annual oil meal generation and its nutrient value
The annual oil meal generation from various edible and non-edible oilseed crops was calculated using their respective oilseed to oil meal percentages and expressed in t/year (Table 1). State-wise and crop-wise oil meal generation was determined by performing separate calculations for each state and crop.
The total generation of N, P, and K from the oil meal was derived by multiplying the annual oil meal generation by its respective N, P, and K concentrations (Table 1), expressed in t/year. This methodology was applied separately for each crop and state, resulting in both state-wise and crop-wise estimates of N, P, and K production from oil meal.
2.5 Total N, P, and K generation in India from various organic waste
The total generation of N, P, and K in India from organic waste like animal waste, crop residue, and oil meal was calculated by summing their respective contribution.
2.6 Per-hectare organic waste availability and NPK balance
The state-wise total organic waste generation (t/year) was calculated by summing the annual generation of animal waste, crop residue, and oil meal. The computed state-wise annual organic waste generation was divided by each state’s net sown area (ha) to determine per-hectare organic waste availability. The data on net sown area and per-hectare N, P, and K fertilizer consumption for 2021–22 were obtained from Indiastat.com. Nutrient balance quantifies the difference between the NPK generation through organic waste sources (livestock waste, crop residue, and oil meal) and the NPK consumption supplied as inorganic fertilizer. This calculation provides a state-level assessment of organic nutrient generation potential and is distinct from the conventional agricultural definition, which tracks the net NPK changes within the soil profile before and after crop harvest. The NPK nutrient balance was computed using a formula presented below.
Total organic waste generation=Animal waste generation+ Crop residue generation+ Oil meal generation.
2.7 QGIS
The nutrient balance map of India, depicting state-wise N, P, K, and total NPK generation from organic waste, was generated using QGIS software (version 3.34). Four maps were generated, each representing N, P, K, and total NPK balance. The nutrient balance was classified into four groups: highly deficit (< -50 kg/ha, dark red), moderately deficit (-50 to 0 kg/ha, light brown), moderate surplus (0 to 50 kg/ha, light green), and highly surplus (> 50 kg/ha, dark green). Additionally, separate maps illustrating state-wise N, P, K, and total NPK generation from organic waste employed a gradient color scheme, with darker colors indicating higher generation and lighter colors representing lower generation.
2.8 Trend analysis
Trends and changes in dung generation (per 5 years, for different animals) were assessed using the Mann-Kendall (MK) test and Sen’s slope estimator. The MK test is a widely used non-parametric method for detecting monotonic trends in time series data (Wang et al., 2020). It operates under the null hypothesis that there is no trend in the data, with the alternative hypothesis suggesting the presence of a monotonic trend (Gadedjisso-Tossou et al., 2021). For a time series with n observations x1,x2,…,xn, the MK test statistic S is calculated as (Mann, 1945).
where xi and xj are ith and jth datapoints and sgn is the sign function.
The standardized version of S, known as Kendall’s tau statistic (τ), is calculated as:
where is the number of unique pairs of observations. The value of ranges between -1 and +1. and indicates a perfect positive and negative trend, respectively. Between these two extremes, there exists varying magnitudes of trends and indicates there is no trend.
The significance of the trend was tested using the Z-statistic of the standard normal distribution.
where Var is the variance of S. The trend is considered significant at 0.1%, 1%, and 5% level if is greater than 3.29, 2.58, and 1.96, respectively.
Sen’s slope, another non-parametric method, estimates the trend magnitude by measuring change per unit time (Kuriqi et al., 2020). For a n ordered time series with observations (t1,x1),(t2,x2),…,(tn,xn), the Sen’s slope estimator was calculated as
where ti and xi are the time and corresponding data point. represents the median of all possible pairwise slopes between data points, providing a robust measure of the trend’s magnitude that is less sensitive to outliers or extreme values in the dataset.
3 Result
3.1 Animal waste generation and its nutrient value
3.1.1 Animal waste generation in India from 1951 to 2019
The historical trend of animal waste generation in India, spanning from 1951 to 2019, reveals a significant increase over the years (Supplementary Table 1). In 1951, India’s animal waste generation was 412 million tons (MT) (Figure 2a). As the years progressed, India’s livestock population grew, and with it, animal waste generation also soared, with an annual growth rate of 0.75%. By 1956, India’s animal waste generation had increased to 423.7 MT, and by 1961, it had risen to 469.9 MT. This upward trajectory in animal waste generation continued through the 1960s, 70s, 80s, and 90s, with India generating 475.1 MT in 1966, 490.2 MT in 1972, 506.3 MT in 1977, 553.3 MT in 1982, 583.6 MT in 1987, 615.4 MT in 1992, and 620.6 MT in 1997. In 2003, there was a minor dip in animal waste generation, with India producing 617.2 MT. However, 2007 brought a resurgence, with animal waste generation rebounding to 664.3 MT. In 2012, there was a slight dip once more, yielding 657.4 MT, but it quickly rebounded in 2019, reaching 667.7 MT (Figure 2a).
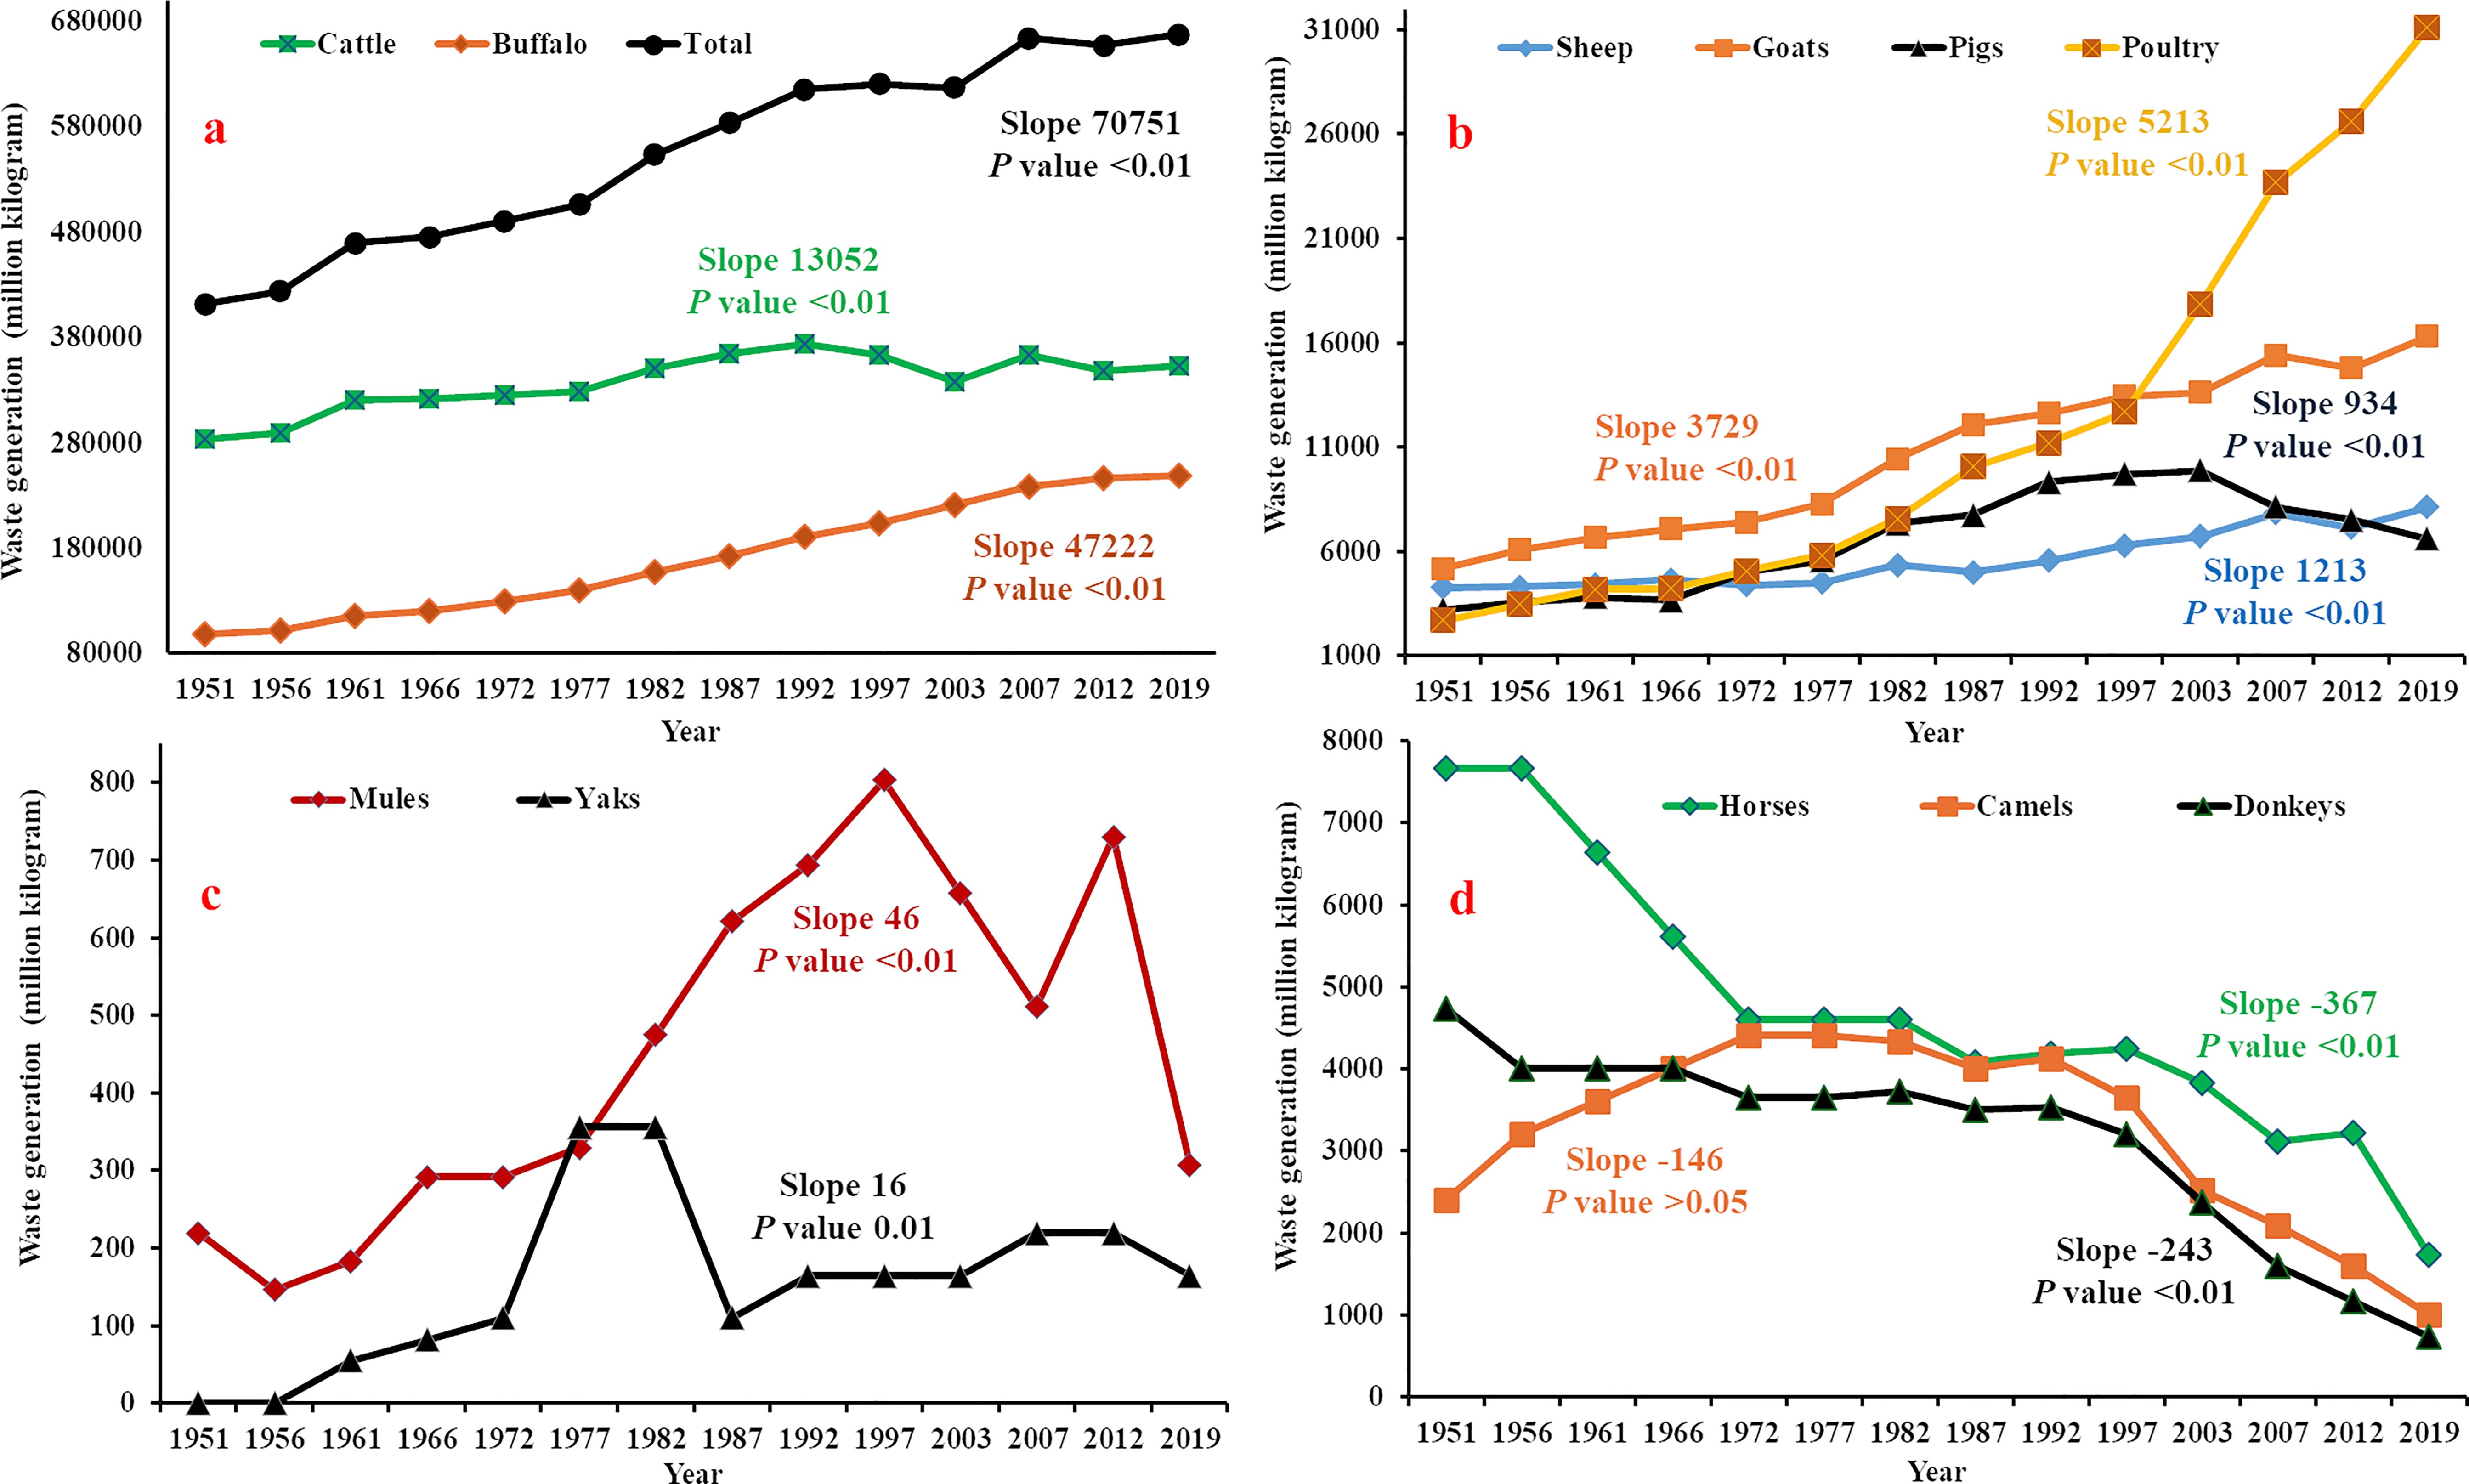
Figure 2. Trend analysis of quinquennial dung generation from different animals using the Mann-Kendall test and Sen’s slope estimator. (The p-values of <0.01, 0.01, and >0.05 indicate a highly significant, a significant, and a non-significant trend. Sen’s slope estimator represents the change in dung generation per 5 years). (a) Waste production through cattle, buffalo, and all livestock (total), (b) Waste generation through sheep, goat, pig, and poultry, (c) Waste generation through mules and yaks, and (d) Waste generation through horses, camel, and donkeys.
3.1.2 Animal category-wise waste generation
Animal waste generation varies greatly among different domesticated animals. The breakdown of animal waste generation in India by animal category in 2019 reveals that cattle and buffalo are the primary sources, accounting for over 90% of the total generation (Figure 2a). In 2019, cattle produced 353.1 MT (52.9%) of animal waste, while buffalo contributed 248.6 MT (37.2%), highlighting the significant role of these animals in the country’s waste generation. Poultry is the next important contributor to animal waste, with 31.1 MT, or 4.66% of animal waste. Sheep and goats are also important sources of animal waste generation, with 8.1 MT (1.22%) and 16.3 MT (2.44%) generated in 2019, respectively (Figure 2b). While these quantities are smaller compared to cattle and buffalo, they still make a significant contribution to the country’s animal waste generation. In 2019, horses produced 1.74 MT of animal waste, camels generated 1.00 MT, pigs generated 6.61 MT, mules generated 0.31 MT, donkeys generated 0.74 MT, and yaks generated 0.16 MT (Figure 2c). The trend analysis of animal waste generation from 1951 to 2019 revealed that the generation of cattle, buffalo, sheep, goat, pig, mules, and poultry increased annually by 0.24%, 1.53%, 0.90%, 2.15%, 1.06%, 0.33%, and 25.4%, respectively. On the contrary, horse, camel, and donkey annual waste generation decreased by -0.77, -0.58, and -0.91, respectively (Figure 2d).
3.1.3 State-wise animal waste generation
Animal waste generation in India varies greatly among states (Table 2). In 2019, Uttar Pradesh led in animal waste generation with 112.4 (16.8%) MT/year, followed closely by Rajasthan, Madhya Pradesh, Bihar, and Gujarat at 61.4 (9.2%), 59.95 (9.0%), 48.1 (7.2%), and 43.1 (6.5%) MT/year, respectively, due to their significant livestock populations. Maharashtra, West Bengal, and Andhra Pradesh also contribute significantly, generating 42.7 (6.4%), 41.4 (6.2%), and 29.1 (4.3%) MT/year, respectively. In contrast, the UTs of Andaman and Nicobar, Lakshadweep, Dadra and Nagar Haveli, Chandigarh, Daman and Diu generate minimal animal waste, with 0.16, 0.02, 0.08, 0.06, and 0.01 MT/year, respectively. In the north-eastern region of India, Assam takes the lead in animal waste generation with 24.7 (3.7%) MT/year, followed by Meghalaya at 2.44 (0.4%) MT/year.
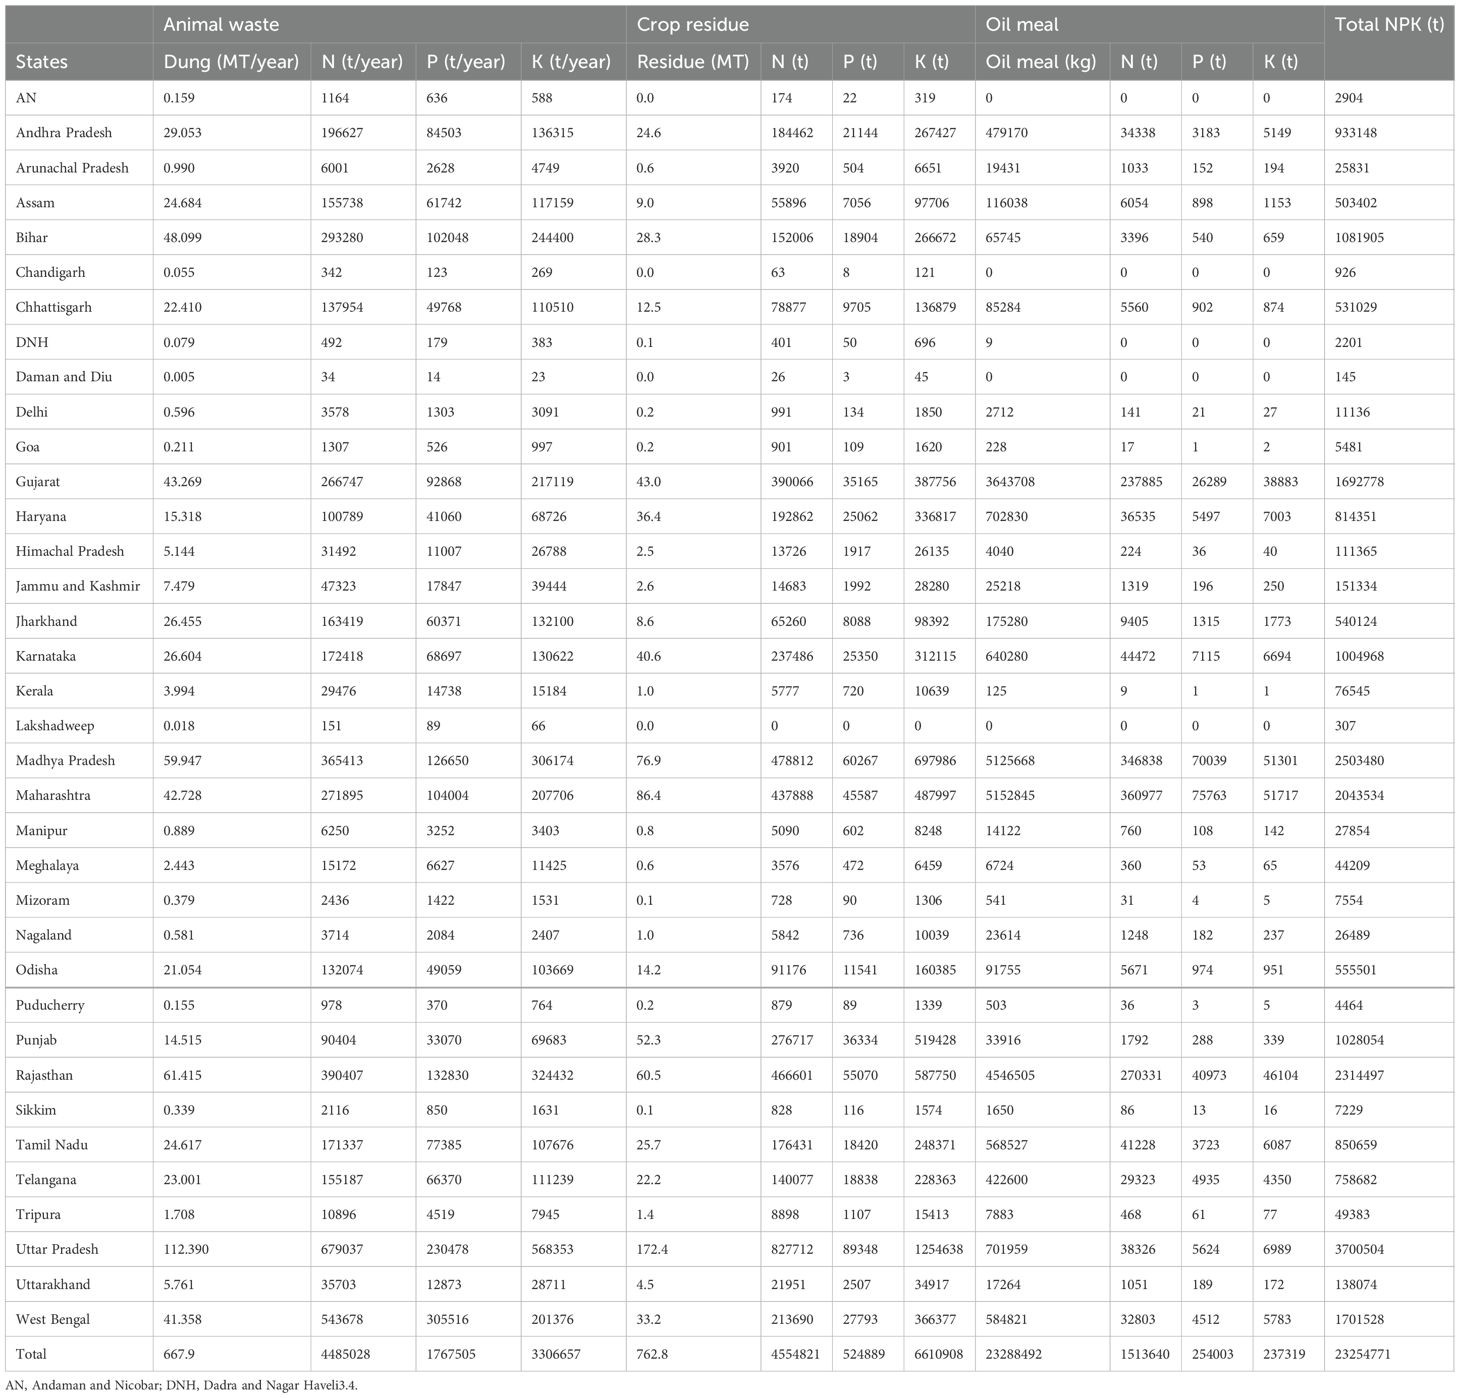
Table 2. State-wise organic waste generation and its nutrient value.
3.1.4 N generation through animal waste: a comparison between the state and animal species
The total N generation from different animal species is 4.49 MT per year (Table 2). Among the states, Uttar Pradesh emerges as the leading contributor to total N generation, accounting for a substantial 15.1% (6.79 lakh tons) of the total N generation. Following closely, West Bengal, Rajasthan, and Madhya Pradesh contribute 12.1% (5.44 lakh tons), 8.7% (3.90 lakh tons), and 8.2% (3.65 lakh tons), respectively. Bihar, Maharashtra, and Gujarat also exhibit noteworthy contributions, contributing 6.5%, 6.1%, and 6.0%, respectively. Andhra Pradesh, Karnataka, and Tamil Nadu each contribute around 3.8-4.4% to the total N generation. Jharkhand and Telangana contribute approximately 3.6% and 3.5%, respectively. Small union territories and states like Chandigarh, Lakshadweep, and Goa show comparatively modest N generation, aligning with their smaller livestock populations. A closer examination of livestock category-wise N generation reveals that cattle and buffalo are the major contributors, accounting for 47.2% and 33.3% of the total N generation, respectively, emphasizing their pivotal role in the N generation (Figure 3b). Poultry, Goat, and Sheep account for 13.9%, 2.5%, and 1.3% of the total N generation, respectively. Camel, mules & donkeys, and horses & ponies each contribute less than 0.5% of the total N generation.
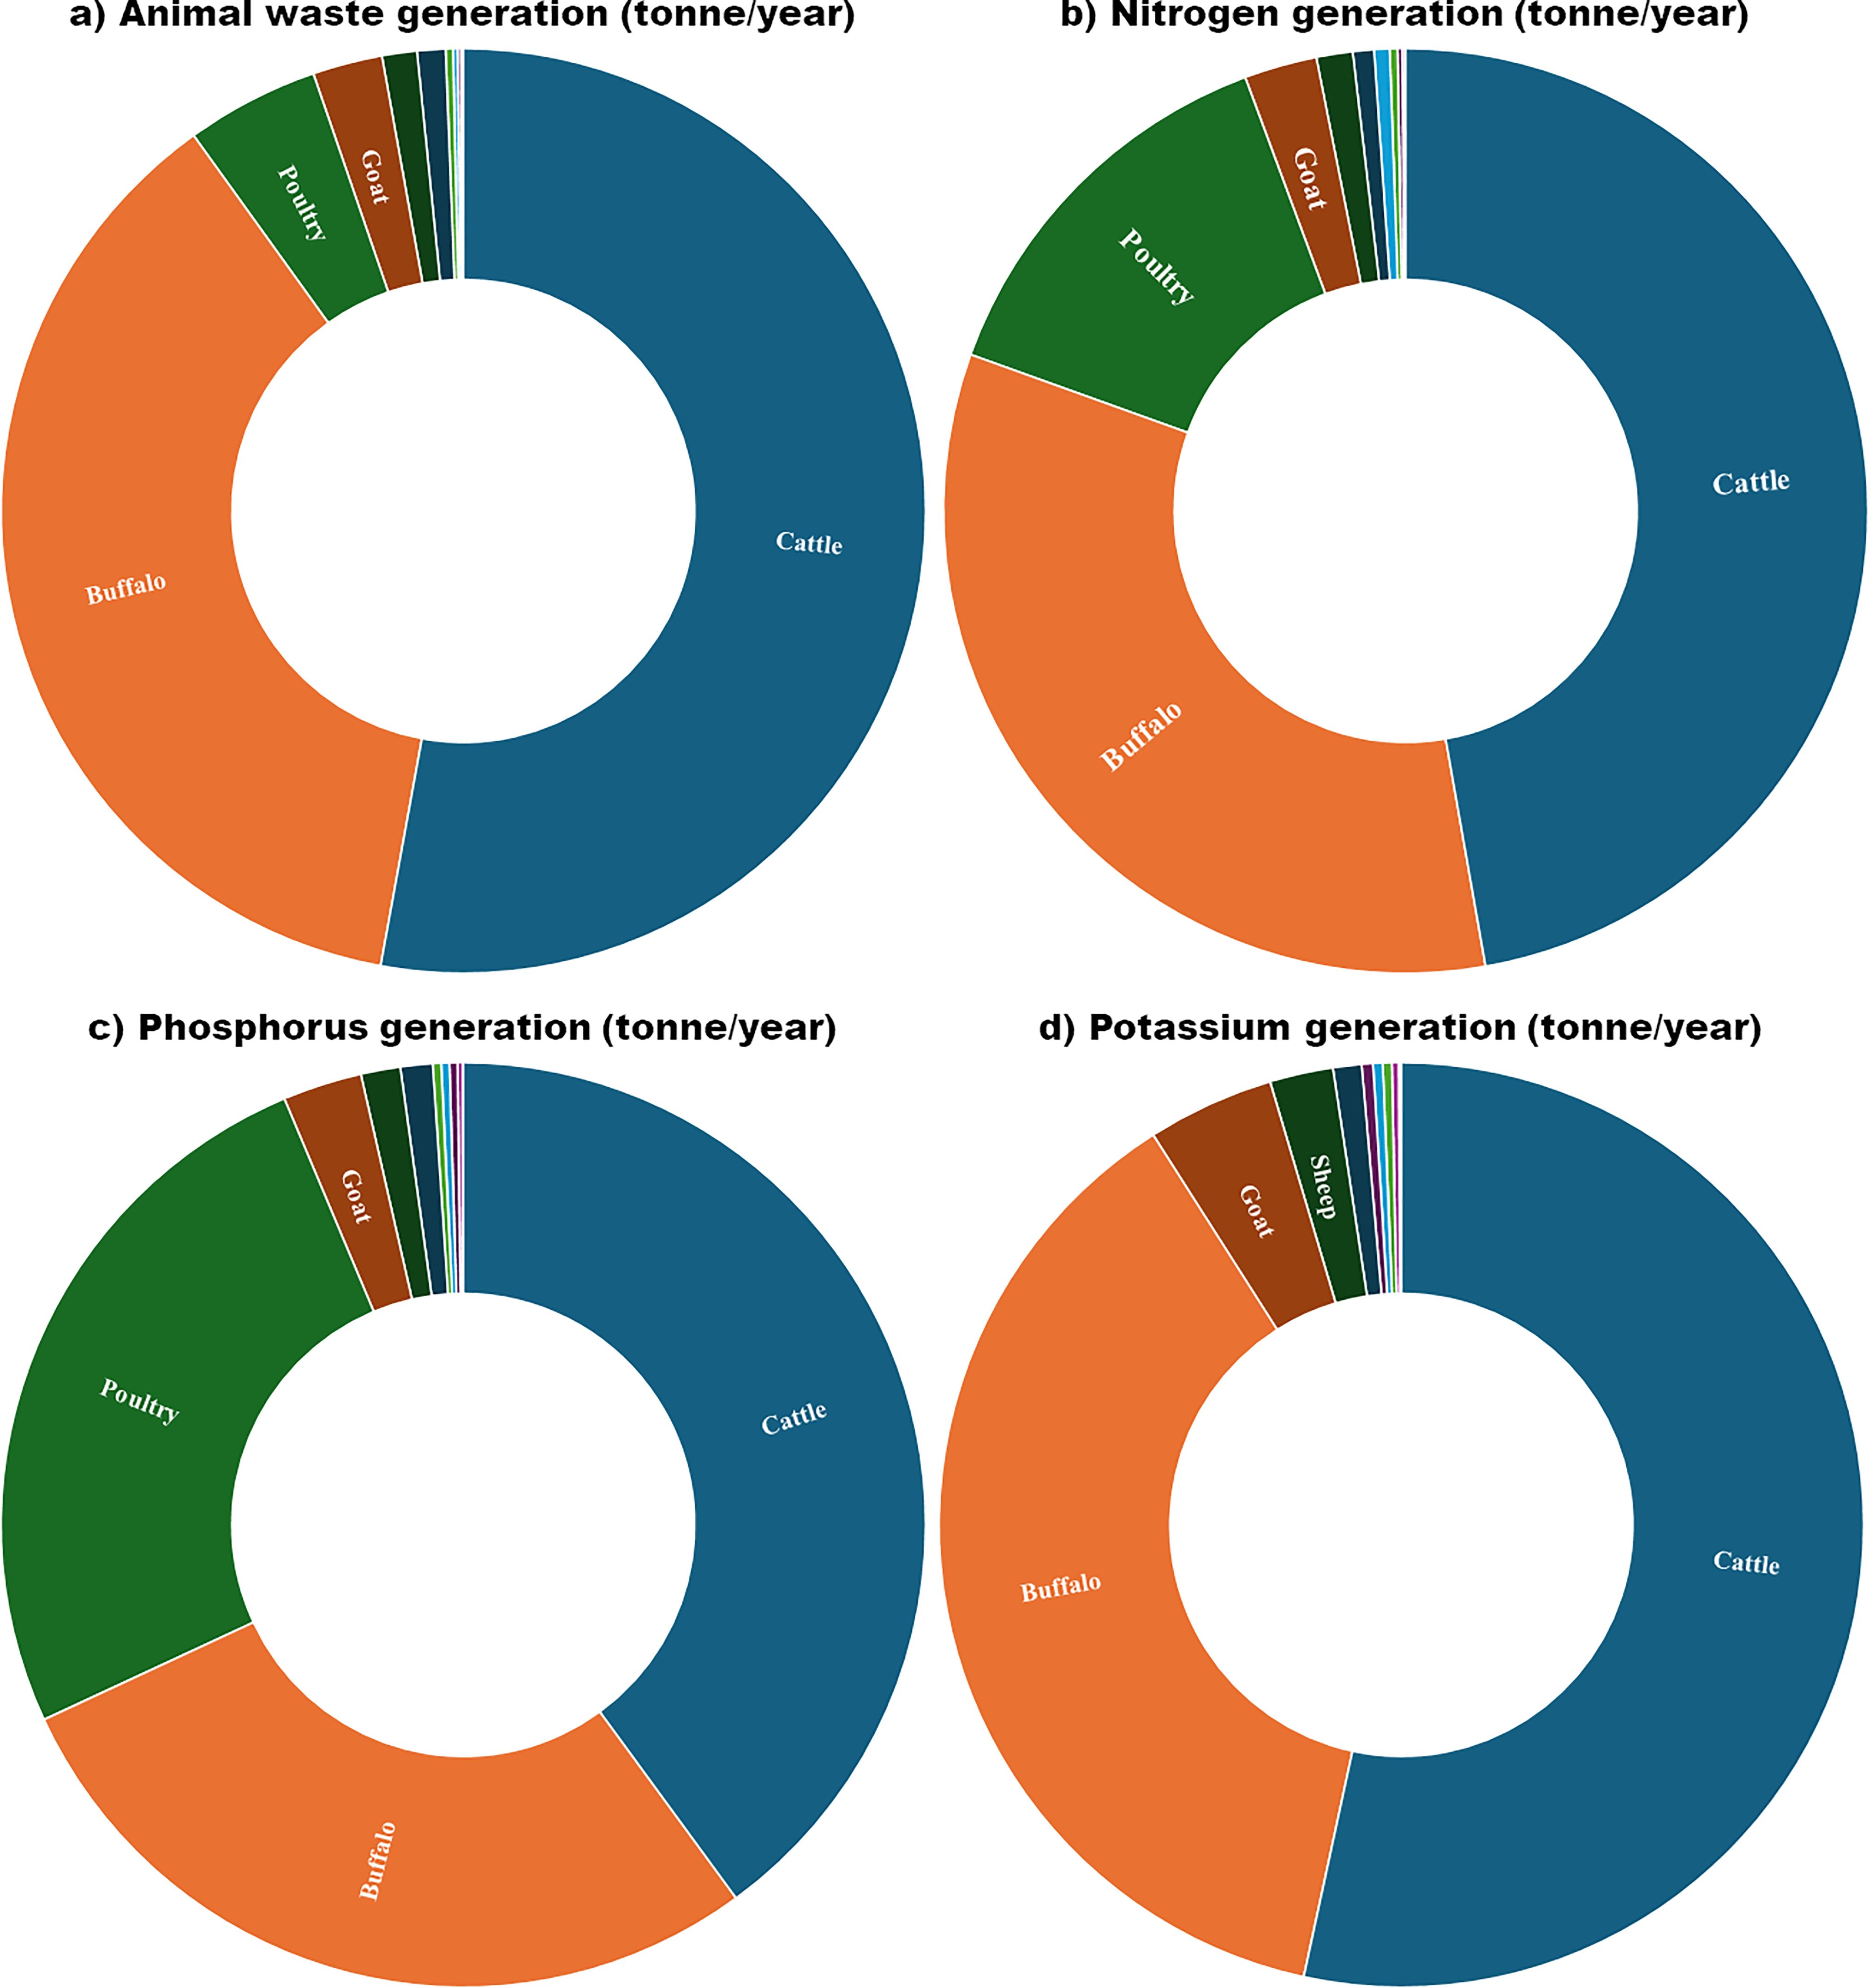
Figure 3. Animal species-wise organic waste and nutrient generation. (a) organic waste generation by different animals, (b) nitrogen generation through animal waste, (c) phosphorus generation through animal waste, and (d) potassium generation through animal waste.
3.1.5 P generation through animal waste: a comparison between the state and animal species
The total annual P generation across various animal species amounts to 1.77 MT. Similar to N patterns, cattle (39.9%), buffalo (28.1%), and poultry (25.6%) emerge as primary contributors to P generation, collectively constituting 93.7% of the total (Figure 3c). In contrast, pigs, goats, and sheep collectively contribute 5.3%. Estimation of P generation from animal waste highlights a distinct divergence in poultry manure’s contribution to N and P generation. Specifically, poultry contributes substantially to P generation, accounting for 25.6% of total generation, a value closely aligned with buffalo (28.1%). While the poultry contribution to N generation was only 13.9%. This discrepancy is directly correlated with the elevated P concentration within poultry manure. When examining P generation at the state level, West Bengal emerges as the leading contributor, representing a substantial 17.3% of the total P generation. Following closely, Uttar Pradesh, Rajasthan, and Madhya Pradesh contribute 13.0%, 7.5%, and 7.2% of the total P generation, respectively. The Southern states, Andhra Pradesh, Tamil Nadu, Karnataka, and Telangana, constitute 4.8%, 4.4%, 3.9%, and 3.8% of the total P generation, respectively (Table 2).
3.1.6 K generation through animal waste: a comparison between the state and animal species
The total K generation in a year due to animal waste is 3.31 MT. Among the animal species, cattle emerge as the predominant contributors, representing a substantial 53.4% of the total K generation, while buffalo contribute 37.6% (Figure 3d). Goats and sheep contribute 4.4% and 2.2%, respectively, while poultry contributes 0.07%. Unlike N and P, the contribution of poultry to total K generation is very meager. Horse & ponies and pigs contribute 0.3% and 1.0%, respectively. The breakdown of K generation across states highlights Uttar Pradesh as the foremost contributor, making up a significant 17.1% of the total. In close succession, Rajasthan and Madhya Pradesh contribute 9.81% and 9.26%, respectively. Bihar, Gujarat, Maharashtra, and West Bengal also play crucial roles, contributing 7.4%, 6.6%, 6.3%, and 6.1%, respectively (Table 2). Meanwhile, Southern states like Andhra Pradesh, Karnataka, Telangana, and Tamil Nadu contribute 4.1%, 3.95%, 3.4%, and 3.3%, respectively.
3.2 Annual crop residue generation in India
Annually, India generates 762.8 MT of crop residue, with notable disparities among its various states (Table 2). Among the states, Uttar Pradesh leads in generation with 172.4 MT (22.6%), followed by Maharashtra with 86.4 MT (11.3%), Madhya Pradesh with 76.9 MT (10.1%), Rajasthan with 60.5 MT (7.9%), Punjab with 52.3 MT (6.9%), Gujarat with 43.0 MT (5.6%), Karnataka with 40.6 MT (5.3%), and Haryana with 36.4 MT (4.8%). Crop-wise residue analysis revealed that rice, wheat, and sugarcane contribute 23.4% (178.3 MT), 24.1% (183.7 MT), and 22.8% (173.7 MT), respectively, to the annual crop residue generation (Figure 4a). Other significant contributors include maize (5.6%), soybean (4.2%), groundnut (3.9%), chickpea (3.4%), and rapeseed & mustard (2.8%). A significant portion (56.5%) of annual crop residue originates from cereals and millets, highlighting their dominant role. Sugarcane contributes 22.8%, while oilseeds, pulses, and fiber crops account for 11.7%, 6.83%, and 2.1%, respectively.
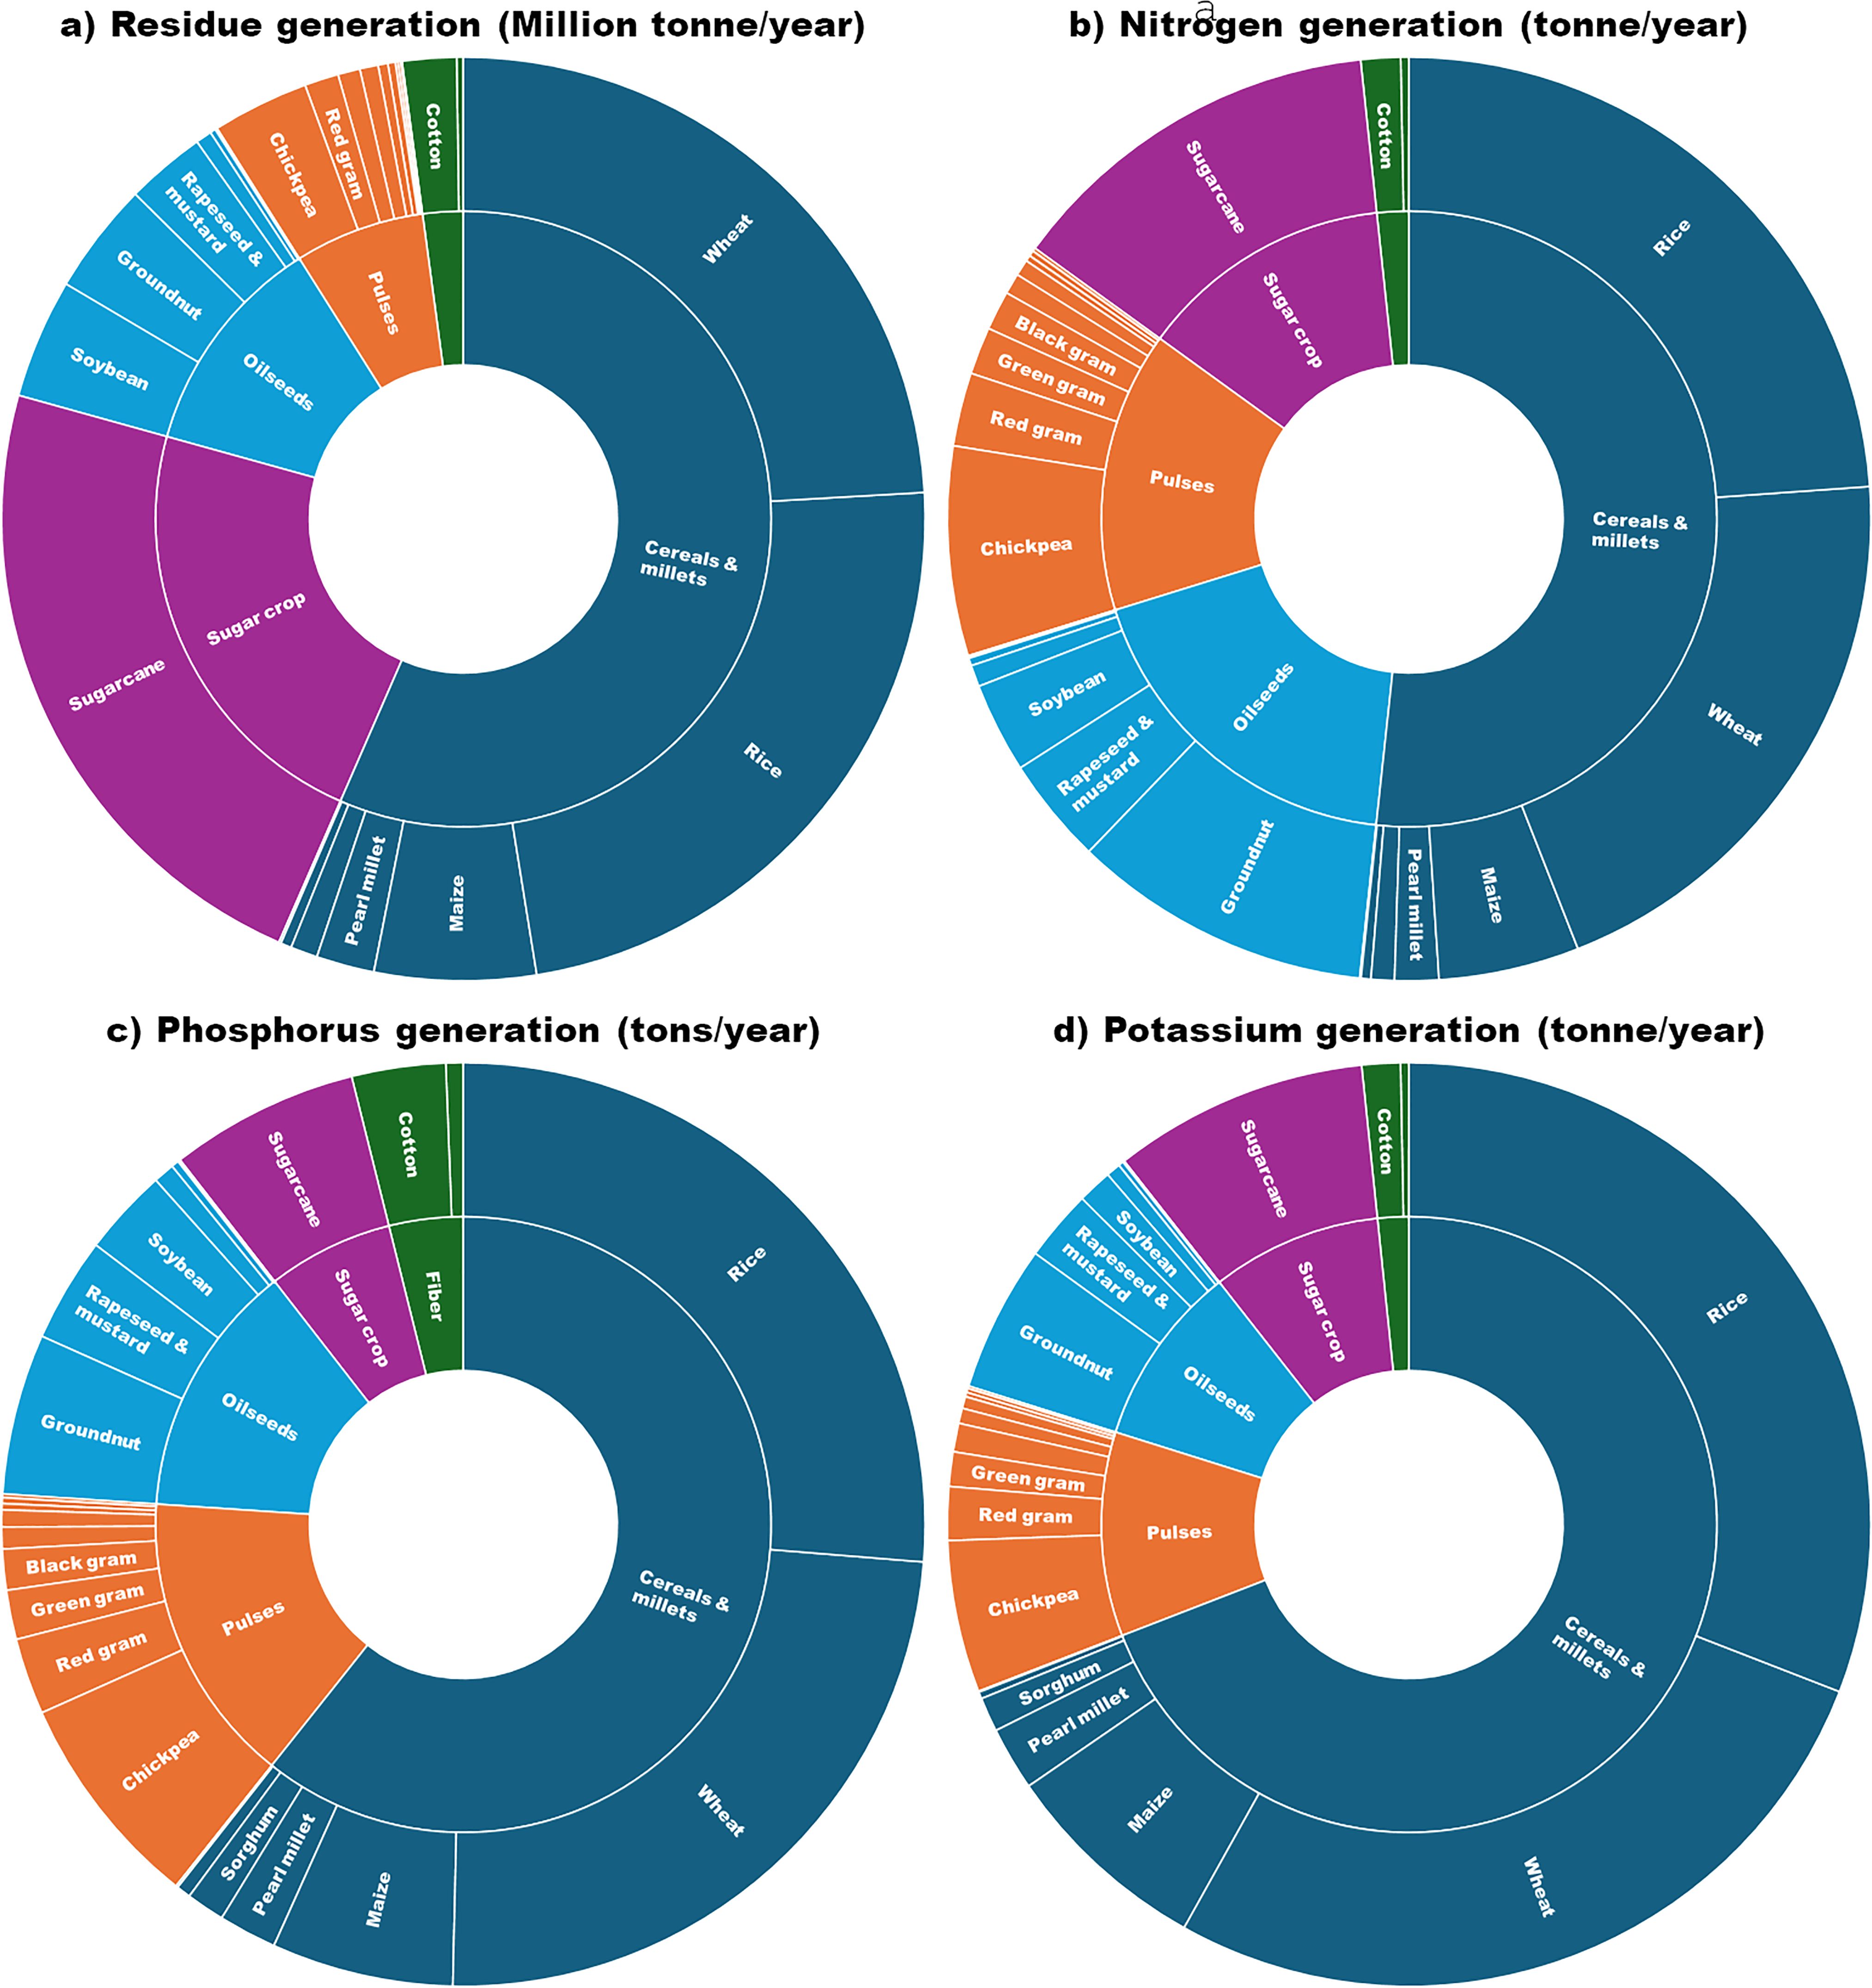
Figure 4. Crop-wise residue generation and its nutrient value. (a) total crop residue generation by different crops, (b) nitrogen generation through crop residue, (c) phosphorus generation through crop residue, and (d) potassium generation through crop residue.
3.2.1 N, P, K generation through crop residue
The annual generation of total N, P, and K through crop residues amounts to 45.6, 5.25, and 66.1 lakh tons, respectively (Table 2). Notably, significant contributions to this generation come from the states of Uttar Pradesh, Madhya Pradesh, Rajasthan, Maharashtra, Punjab, Gujarat, West Bengal, Karnataka, and Haryana. Among the crops, cereals and millets make a substantial contribution, accounting for 51.7% of the total N generation. In comparison, pulses contribute 18.5%, and various oilseeds collectively account for 14.8% of the total N generation (Figure 4b). Notably, rice and wheat emerged as the primary contributors, each representing 23.9% and 20.1%, respectively, of the total N generation. Following closely, sugarcane stands as the third major crop, contributing 13.4%, followed by groundnut (10.5%). Similar to N, for P and K, cereals and millets are the major contributors, collectively accounting for 60.7% and 69.1% of total P and K generation, respectively. Meanwhile, pulses and oilseeds contribute almost an equal share. Specifically, for P, pulses and oilseeds contribute 15.4% and 13.4%, respectively (Figure 4c). Similarly, for K, pulses and oilseeds contribute 10.7% and 9.6%, respectively (Figure 4d). Notably, rice, wheat, and sugarcane emerged as the primary contributors to P and K generation through crop residue, with each accounting for 26.3%, 24.1%, and 6.6% of total P and 30.9%, 27.2%, and 8.9% of the total K generation through crop residue, respectively.
3.3 Oil meal generation and its nutrient value
3.3.1 Oil meal generation
The total oil meal generation in India is 23.2 MT/year. Madhya Pradesh (22.0%) and Maharashtra (22.1%) are the top contributors to the total oil meal generation, together accounting for approximately 44.2% of the total generation (Table 2). Gujarat (15.6%) and Rajasthan (19.5%) also make substantial contributions, with a combined share of around 35.1%. The southern states (Tamil Nadu, Kerala, Karnataka, Telangana, and Andhra Pradesh) collectively contribute around 9.0% of the total oil meal generation in India. Karnataka (2.8%) leads among the southern states in terms of oil meal generation, followed by Tamil Nadu (2.4%) (Table 2). Soybean accounts for the highest oil meal generation among the crops, with a share of 47%, followed by Rapeseed & Mustard, accounting for 23.5%, Groundnut for 22.6%, and Castor for 4.2%. Together, these crops contribute 96.8% to the total oil meal generation (Figure 5a).
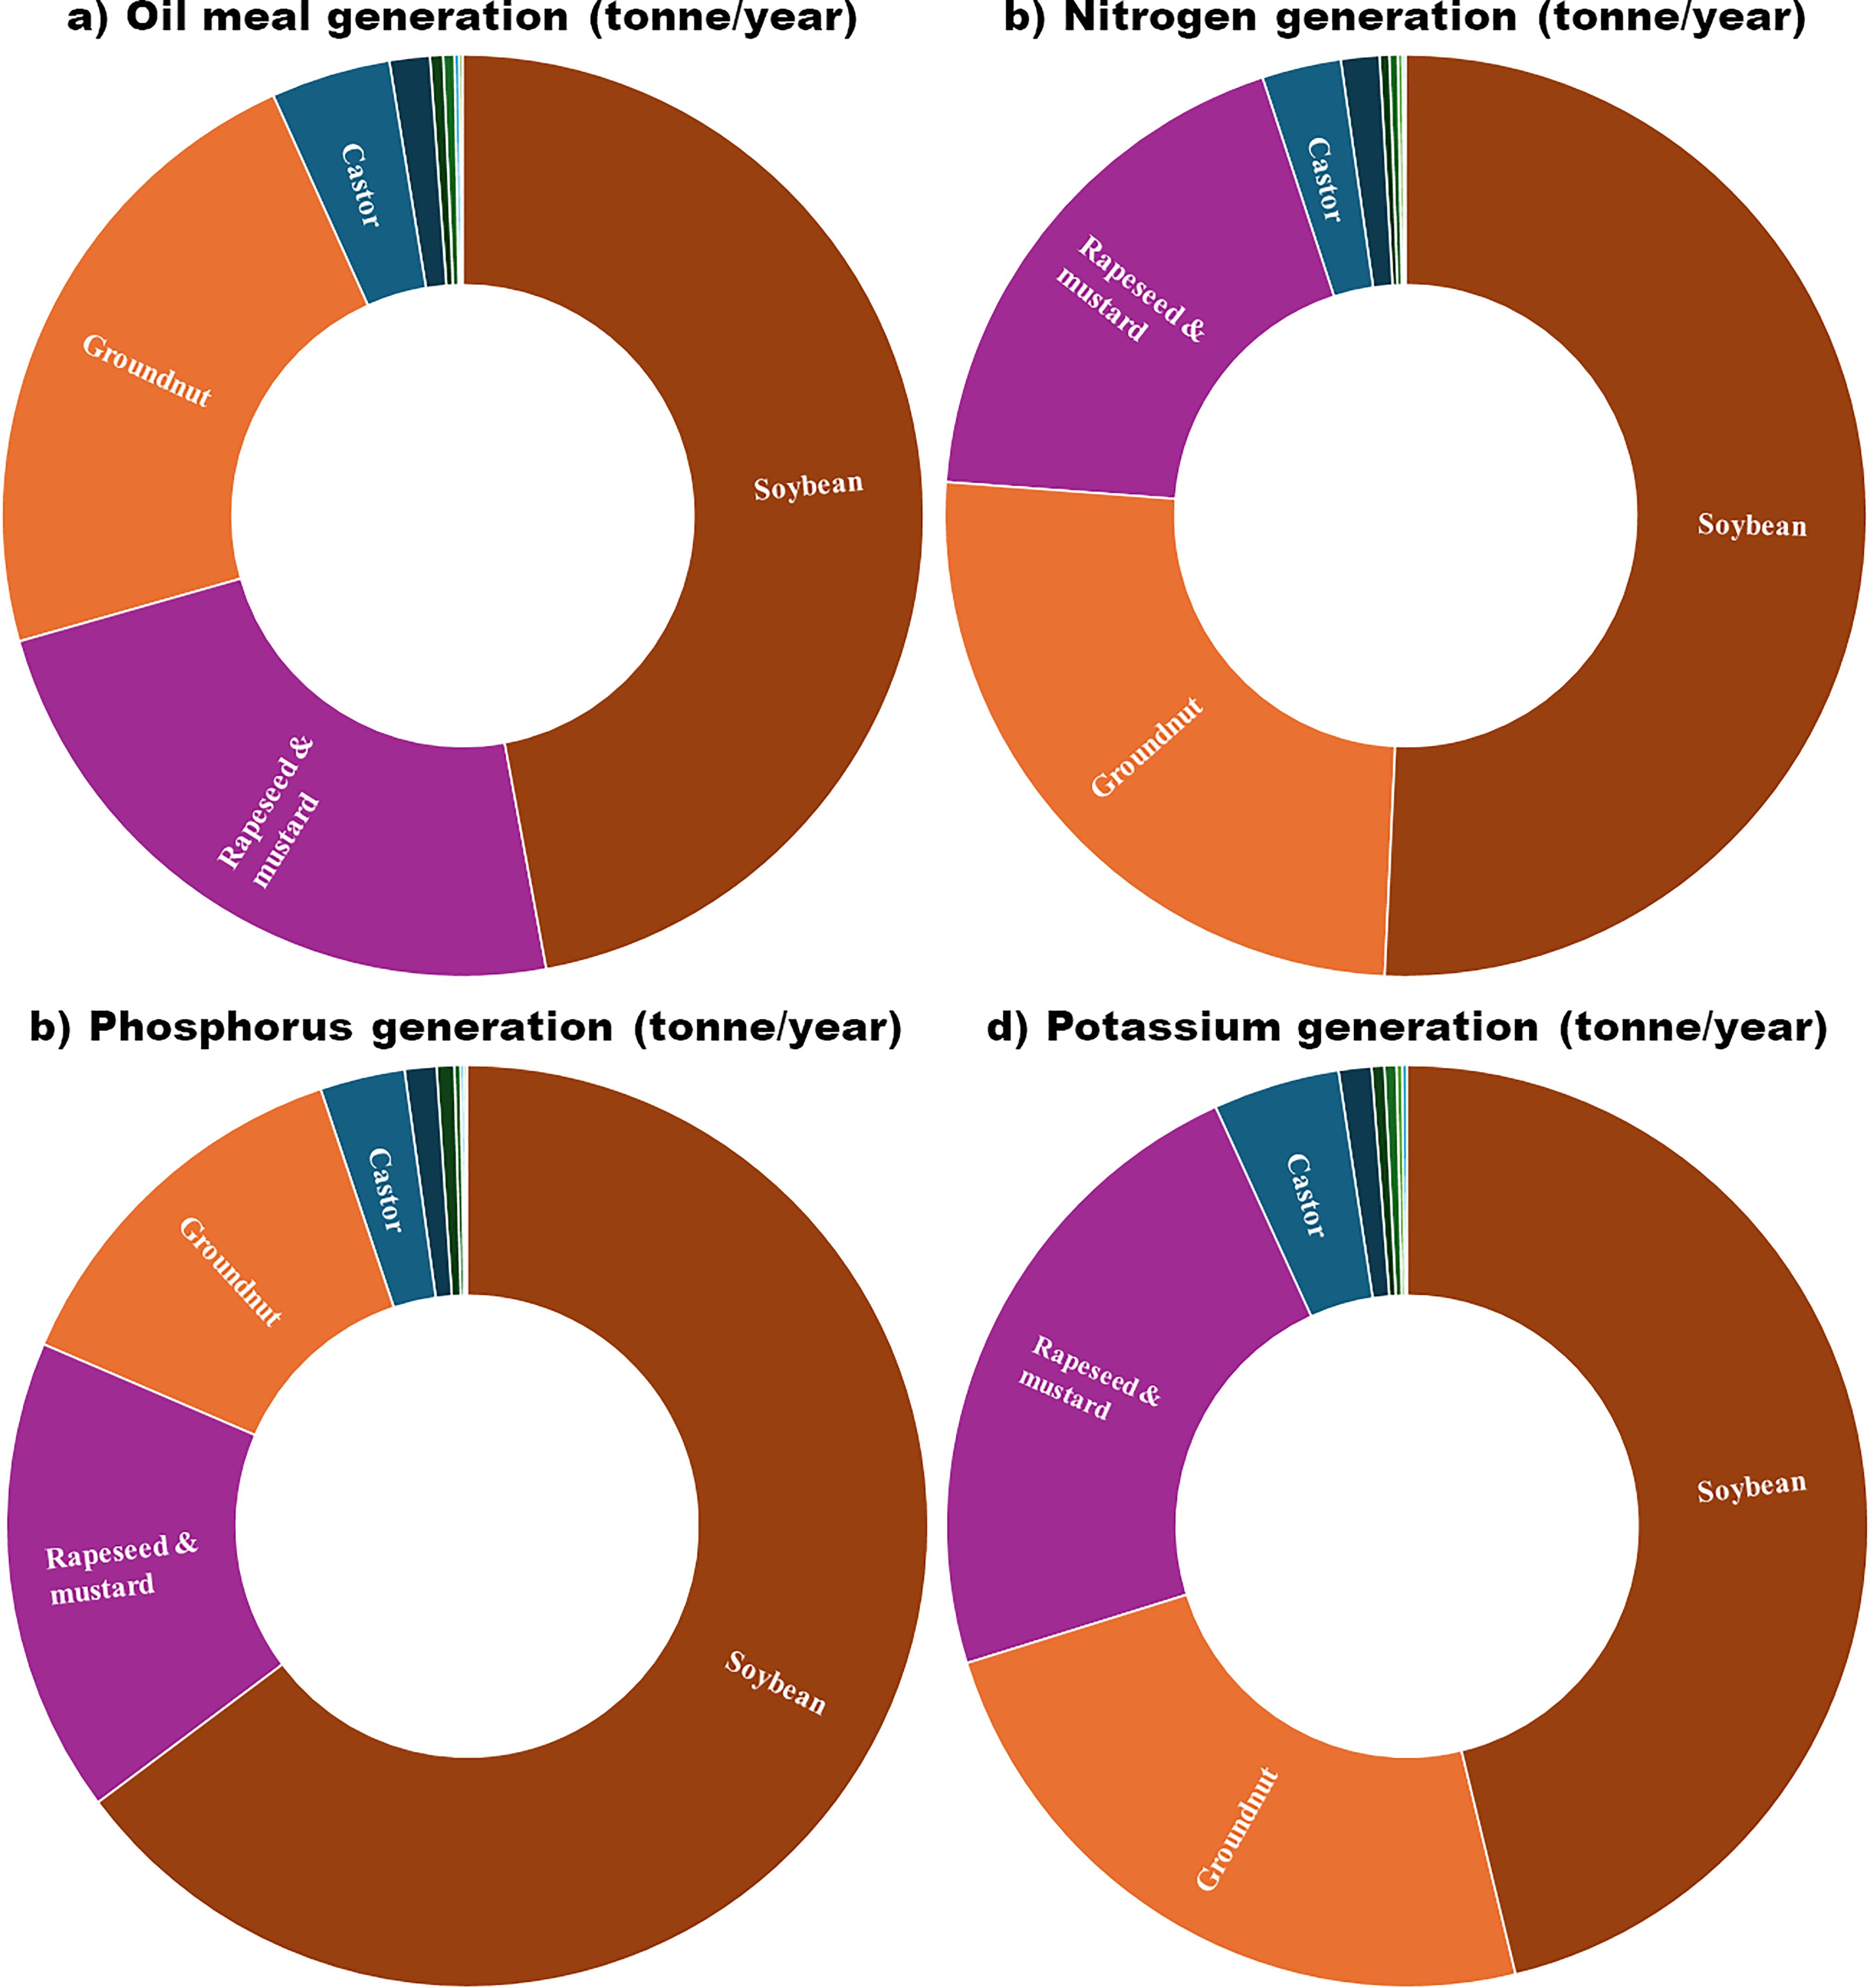
Figure 5. Crop-wise oil meal generation and N, P, K generation through oil meal. (a) total oil meal generation by different oilseed crops, (b) total nitrogen generation through oil meal, (c) total phosphorus generation through oil meal, and (d) total potassium generation through oil meal.
3.3.2 NPK generation through oil meal
The total N, P, and K generation through oil meal in India is 1.51, 0.25, and 0.24 MT/year, respectively (Table 2). Madhya Pradesh (22.9% of N, 27.6% of P, and 21.6% of K) and Maharashtra (23.8% of N, 29.8% of P, and 21.8% of K) are consistently the top contributors to total N, P, and K generation through oil meals. Rajasthan, Gujarat, and Uttar Pradesh also maintain their significant contributions in each category. Collectively, the southern states contribute around 9.9% (N), 7.5% (P), and 9.4% (K) to the total generation, although their individual contributions are relatively lower compared to the major northern states. Karnataka leads among the southern states in terms of total N, P, and K generation through oil meals, followed by Tamil Nadu. Among the Eastern Indian states, West Bengal emerges as the top state with a share of N-2.2%, P-1.8%, and K-2.4% in total generation (Table 2). Among the crops, soybean contributes the highest N, P, and K generation with 0.77 (50.7%), 0.16 (64.8%), and 0.11 (46.2%) MT/year, respectively, followed by Groundnut (N-25.5%, P-13.4% and K-24.0%) and Rapeseed & mustard (N-18.8%, P-16.7% and K-23%). Combining the contributions of Soybean, Groundnut, and Rapeseed & mustard, collectively, they account for approximately 95% of N (Figure 5b) and P (Figure 5c) generation and 93% of K generation (Figure 5d).
3.4 Total N, P, and K generation through various organic waste in India
The total generation of N, P, and K in India through various organic sources amounts to 10.6 MT, 2.6 MT, and 10.2 MT, respectively. Among the major states, Uttar Pradesh stands out prominently for its substantial contribution, accounting for 14.6% of N (Figure 6a), 12.3% of P (Figure 6b), and 18% of K (Figure 6c) generation. Madhya Pradesh, which exhibits the second-highest generation, contributing 11.3% of N, 10.1% of P, and 10.4% of K generation. Following closely, Rajasthan contributes 10.7% of N, 9.0% of P, and 9.4% of K generation. Gujarat (8.5% of N, 6.1% of P, 6.3% of K), Maharashtra (10.2% of N, 8.9% of P, 7.36% of K), and West Bengal (7.5% of N, 13.3% of P, 5.6% of K) also make substantial contributions. Additionally, states like Punjab, Haryana, Karnataka, Tamil Nadu, and Andhra Pradesh contribute noteworthy quantities, although comparatively lower when juxtaposed with the major states.
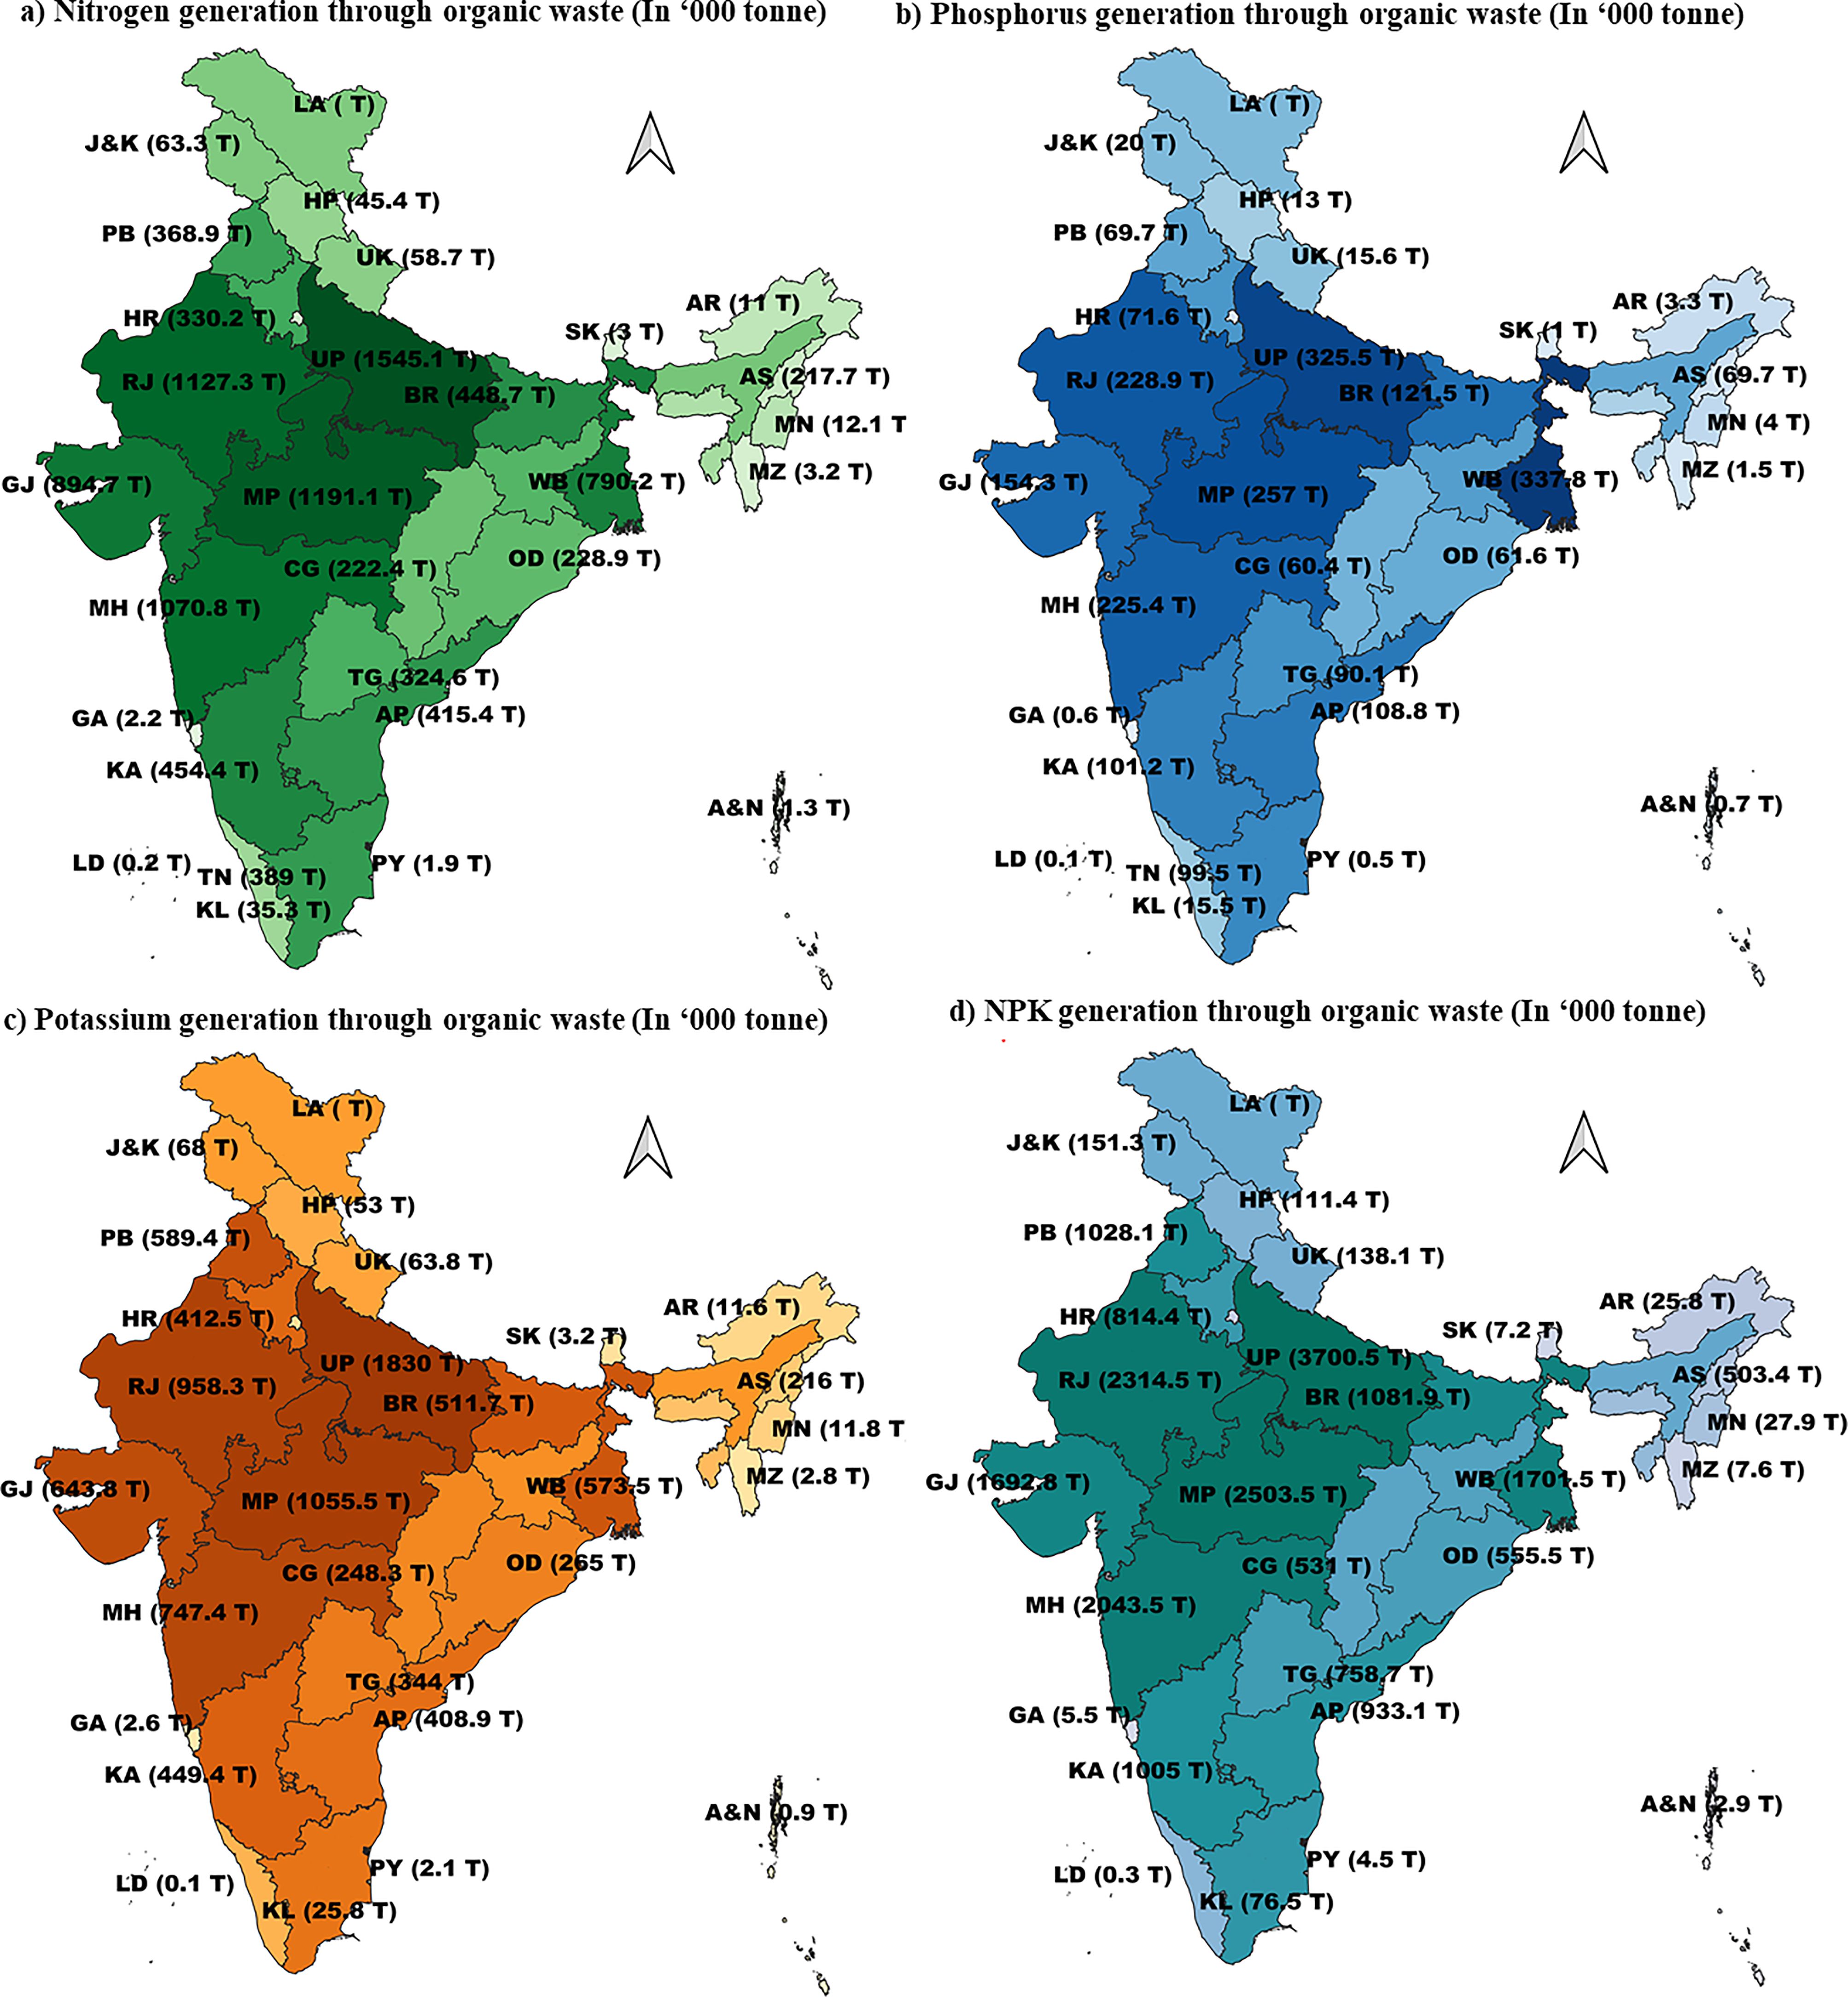
Figure 6. State-wise total nutrient generation through various organic waste (In ‘000 Tonne/year). (a) total nitrogen generation from organic waste, (b) total phosphorus generation from organic waste, (c) total potassium generation from organic waste, and (d) total NPK generation from organic waste.
Animal waste is a significant contributor to organic nutrient sources, accounting for 42.5% of the total N, 69.4% of the total P, and 32.6% of the total K derived from organic waste. This underscores its role as the primary source of organic phosphorus, surpassing both crop residue and oil meal. In contrast, crop residue plays a dominant role in providing organic K, contributing 65.1% of the total K, along with 43.2% of the total N and 20.6% of the total P. This highlights its importance as a key organic source of K, outweighing both animal waste and oil meal. On the other hand, oil meal makes a relatively minor contribution to organic nutrient pools, accounting for only 14.3% of the total N, 10.0% of the total P, and a mere 2.3% of the total K. Despite being nutrient-dense, particularly in N and P, the limited generation volume of oil meal compared to animal waste and crop residue results in its lower overall contribution to N, P, and K levels in organic waste.
3.5 Organic waste availability
The average availability of organic waste, comprised of animal waste, crop residue, and oil meal in India, is 10.1 t/ha, and it varies significantly between the states (Table 3). Crop residue emerges as the largest contributor to organic waste availability in India, with an average of 5.4 t/ha, followed closely by animal waste with 4.7 t/ha. In comparison, oil meal makes relatively smaller contributions (0.16 kg/ha) to organic waste availability. The Union Territories of Chandigarh and Delhi demonstrated a notably higher per-hectare organic matter availability, with 66.4 t/ha and 35.6 t/ha, respectively. Puducherry and the Andaman & Nicobar Islands exhibited approximately 21.9 t/ha and 12.4 t/ha, respectively. Among the states, excluding the union territories, Jharkhand displayed a higher per-hectare organic matter availability (26.4 t/ha). In Bihar, Assam, Himachal Pradesh, Jammu & Kashmir, Meghalaya, and Uttarakhand, organic waste availability ranged from 12.5 to 16.5 t/ha (Table 3). It is noteworthy that the annual total organic waste availability of Sikkim state is only 6.3 t/ha.
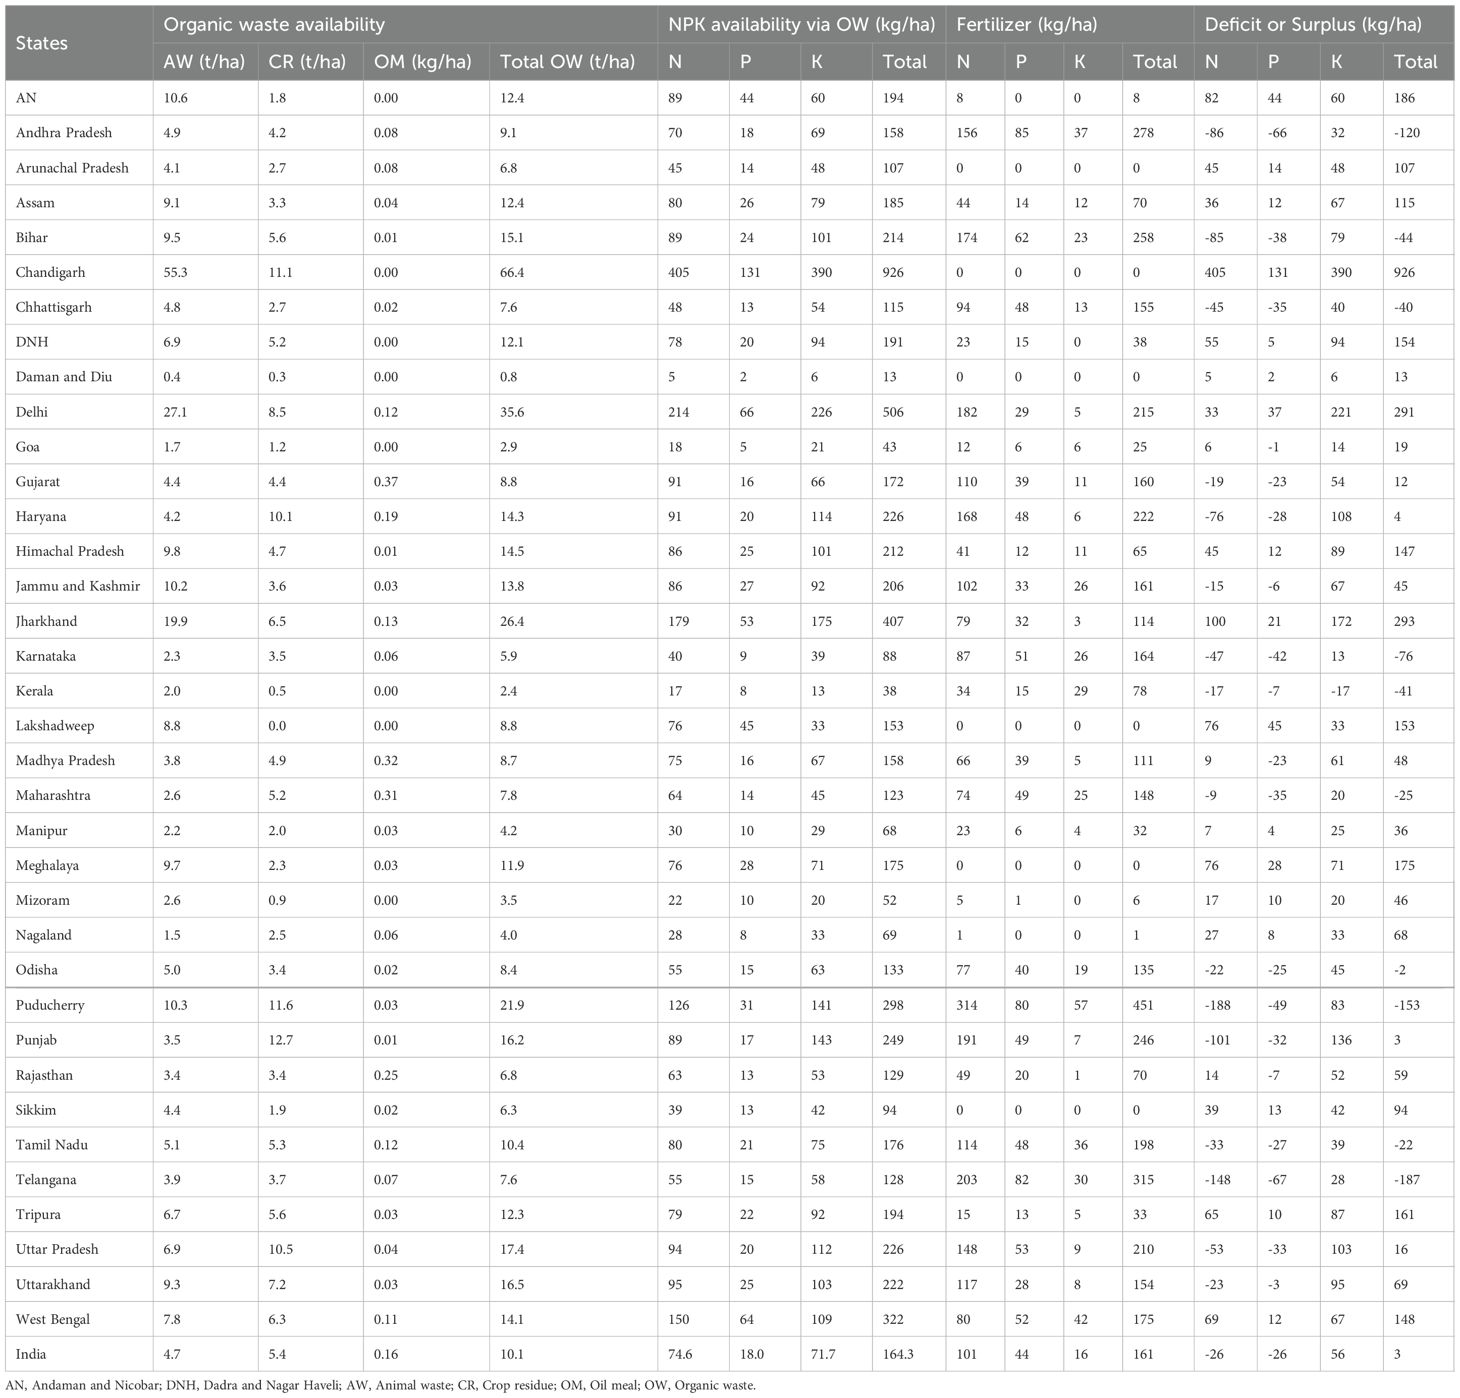
Table 3. State-wise per-hectare organic waste availability (t/ha) and NPK balance between organic waste and fertilizers.
3.6 NPK consumption through inorganic fertilizers
The utilization of N, P, and K fertilizers per-hectare in India exhibited substantial disparities across various states and UTs. On average, the annual (2020-21) consumption of N, P, and K through inorganic fertilizers stands at 101, 44, and 16 kg/ha, respectively, culminating in a total of 161 kg NPK/ha (Table 3). Notably, some states/UTs showed higher total NPK consumption through inorganic fertilizers, with Puducherry leading at 451 kg/ha, followed by Telangana at 315 kg/ha, and Andhra Pradesh at 278 kg/ha. Among three major nutrients, N emerges as the predominant nutrient consumed via fertilizers, with conspicuous discrepancies across states. For instance, Puducherry records a staggering 314 kg/ha of N consumption, while Telangana and Andhra Pradesh exhibit 203 kg/ha and 156 kg/ha, respectively, in stark contrast to the national average of 101 kg/ha. Bihar (258 kg/ha), Haryana (222 kg/ha), Punjab (246 kg/ha), and Uttar Pradesh (210 kg/ha) also manifest significantly elevated levels of NPK consumption through fertilizer. Conversely, several northeastern states, such as Sikkim, Meghalaya, and Arunachal Pradesh, along with Lakshadweep, report no fertilizer consumption. Nagaland, on the other hand, records 1 kg of N and zero kg P and K fertilizer consumption (Table 3). Among the northeastern states, only Manipur and Tripura exhibit significant inorganic fertilizer consumption (33 kg NPK/ha).
3.7 NPK balance between organic waste and inorganic fertilizers
The NPK balance between organic waste and inorganic fertilizers revealed that out of the 36 states and UTs, 10 have exhibited a negative NPK balance (Table 3). Among the states, Telangana, Puducherry, and Karnataka showed the highest negative balance of 187, 153, and 120 kg NPK/ha, respectively. Whereas Bihar, Chhattisgarh, and Kerala showed a negative balance of ~ 40 kg NPK/ha. Tamil Nadu and Maharashtra showed a negative balance of 20–25 kg NPK/ha. The remaining all other states showed a positive NPK balance (Figure 7). It is important to note that the agriculturally most intensive states, viz. Punjab and Haryana showed a positive balance of 3 to 4 kg NPK/ha. This highlights the potential for most of the states to fulfill the agricultural nutrient demands and maintain soil health through organic waste. However, the examination of individual nutrient-wise balance revealed significant disparities between states. Out of 36 states, 16 and 19 states displayed negative N and P balance, respectively, indicating a pronounced dependence on inorganic fertilizer for N and P nutrition in most states. However, K supply through organic sources is prevalent across almost all states, barring Kerala (Table 3).
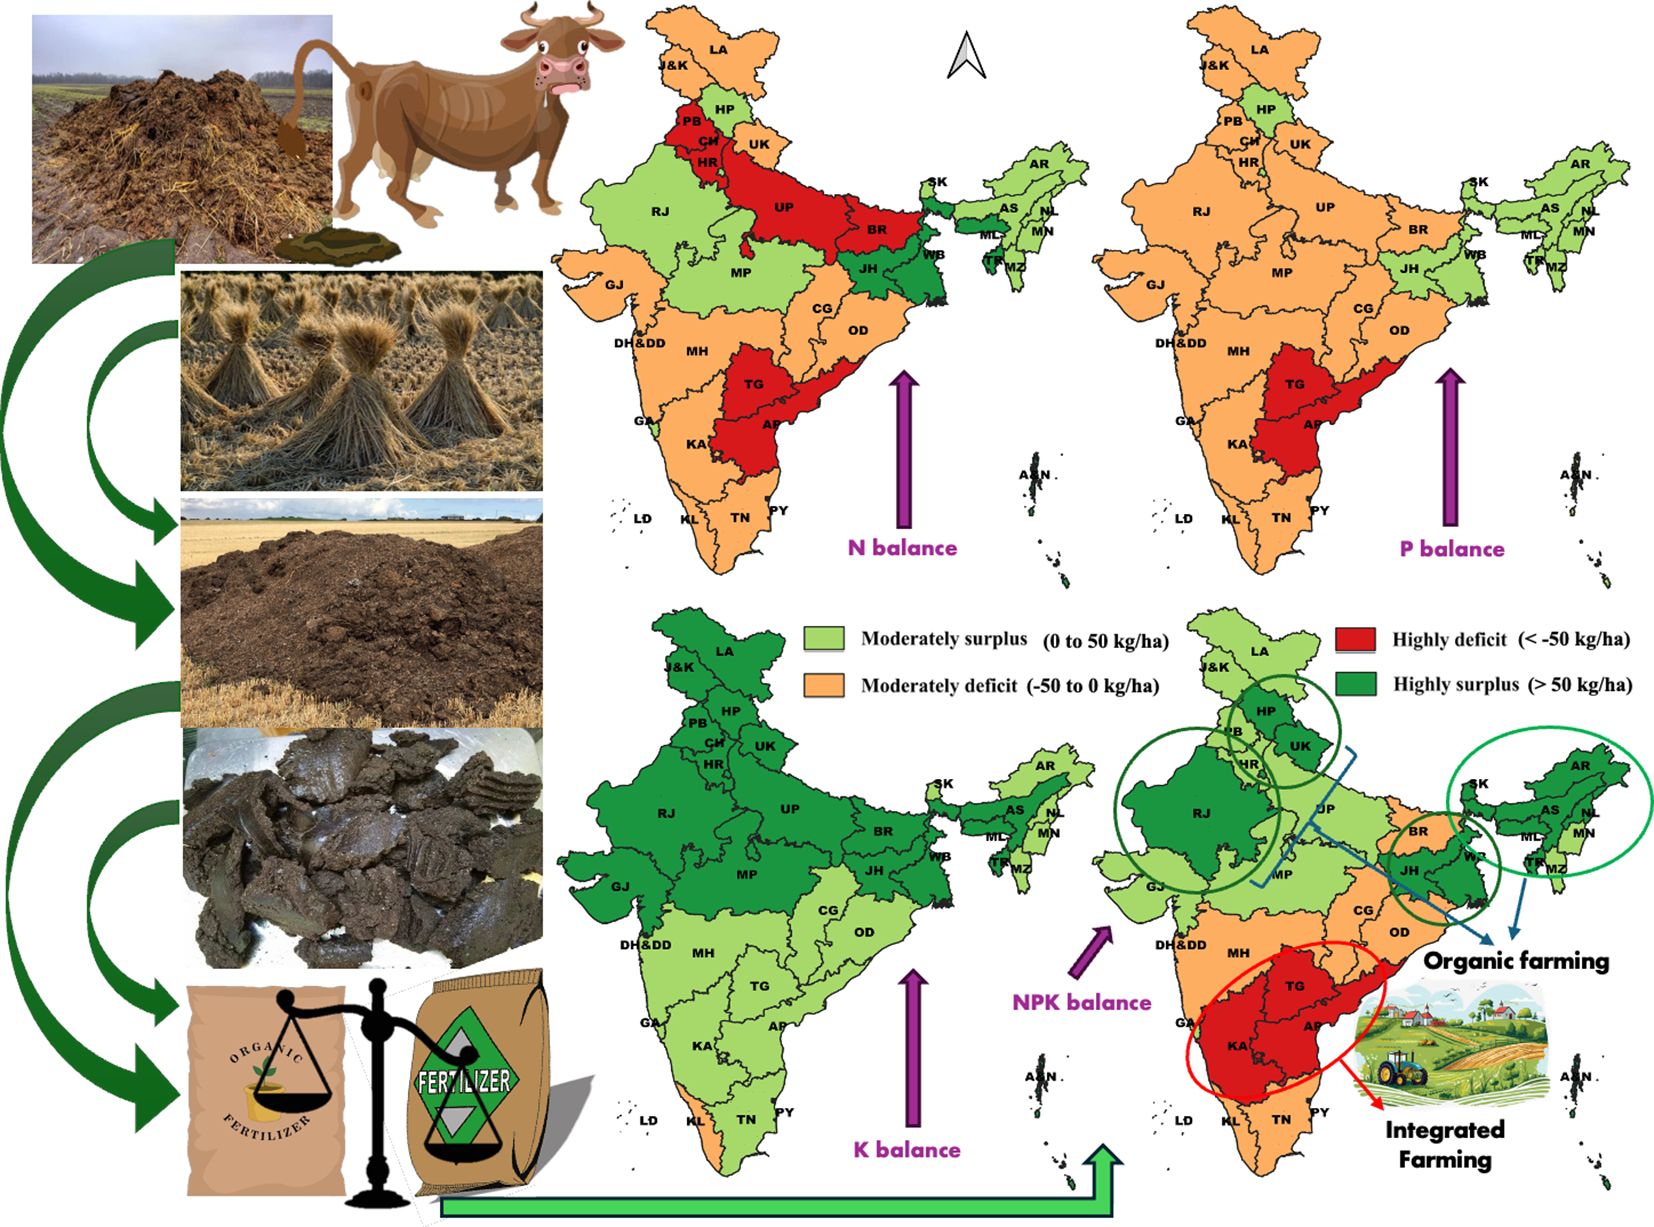
Figure 7. Comparison of nitrogen (N), phosphorus (P), potassium (K), and total NPK balance across states.
Among N and P, N is the most important nutrient that contributes to the maximum negative balance. In states like Punjab, Haryana, Uttar Pradesh, Bihar, Andhra Pradesh, and Telangana, where intensive agriculture is practiced, the N balance was found to be highly deficit (< -50 kg/ha). Similarly, the P balance was highly deficit in Andhra Pradesh and Telangana. On average, the availability of N, P, and K through organic waste stands at 74.6, 18, and 71.7 kg/ha, respectively, resulting in a total NPK availability of 164.3 kg/ha. In contrast, the average per-hectare consumption of N, P, and K through inorganic fertilizer is 101, 44, and 16 kg/ha, respectively, resulting in a total NPK consumption of 161 kg/ha (Table 3). The difference in the national average NPK between organic waste and inorganic fertilizer is only 3 kg/ha. While the total NPK balance is positive, N and P show significant deficits (-26 kg/ha each), whereas K exhibits a substantial surplus (+56 kg/ha). This indicates that the positive overall balance is primarily driven by the higher availability of K through organic sources. The limited availability of N and P from organic sources underscores the necessity of supplementing with inorganic N and P fertilizers to ensure sustainable agricultural practices.
4 Discussion
4.1 Animal waste generation trend in India from 1951 to 2019
India’s burgeoning livestock population, primarily cattle, buffalo, and poultry, has led to a substantial increase in animal waste generation since 1951. In 2019, animal waste output reached 667.7 MT, a hefty 62% increase from the 412 MT produced in 1951. Despite its potential as a valuable resource, inefficient collection and storage result in significant nutrient losses and environmental problems, including greenhouse gas emissions (GHG) and eutrophication. Efficient livestock waste management systems are crucial for minimizing environmental pollution and maximizing agricultural benefits (Malomo et al., 2018). Collaborative efforts between government and farmers are necessary to ensure proper waste collection, particularly from high-volume producers like cattle, buffalo, and poultry. This will minimize nutrient losses. Additionally, government policies that incentivize and facilitate the generation of biogas and vermicompost from animal waste are vital. Such a shift would promote the creation of renewable energy sources while simultaneously curbing GHG (Yadav et al., 2013b).
4.2 N, P, and K generation through animal waste
Cattle, buffalo, and poultry emerge as the primary contributors to N, P, and K generation through animal waste, as these animal species account for the bulk of animal waste generation. Among these, cattle alone account for 47% of N, 40% of P, and 53% of K, primarily due to their higher population over buffalo. Notably, poultry accounts for 25% of the total P generation from animal waste, almost on par with buffalo (28%), owing to the higher P content in poultry manure over cattle and buffalo (FAI, 2012). States with larger animal populations contribute significantly more to N, P, and K generation. Uttar Pradesh leads in N and K generation due to its large cattle and buffalo populations, while West Bengal leads in P generation because of its higher poultry population, along with significant cattle and buffalo numbers.
States producing large amounts of N, P, and K from animal manure have the potential to lessen their reliance on synthetic inorganic fertilizers like urea, di-ammonium phosphate, and muriate of potash. Rich in both macronutrients and micronutrients, animal manure provides a more sustained nutrient release compared to inorganic fertilizers. Furthermore, its application improves soil health by enhancing water-holding capacity, structure, texture, and bulk density (Brar et al., 2015). Thus, the shift toward organic manure would promote more sustainable and environmentally friendly farming practices (Pajura, 2023). However, N from animal manure is prone to volatilization and leaching, potentially causing water pollution (eutrophication) and ecological imbalances. Therefore, efficient collection, storage, processing, and utilization of animal waste are crucial to minimize N loss and GHG.
4.3 Annual crop residue generation and its nutrient value
The higher generation of crop residues in Uttar Pradesh, Maharashtra, Madhya Pradesh, Rajasthan, Punjab, Gujarat, Karnataka, and Haryana states is primarily attributed to their large agricultural area and intensive farming practices. These states practice multiple cropping systems, i.e., cultivating two or more crops from the same land within the years due to well-established irrigation infrastructure, leading to higher annual crop residue generation. Cereals like rice, wheat, and maize are the primary contributors due to their widespread cultivation in these states. Their higher biomass generation compared to other crops, except sugar cane, further amplifies residue generation. Following cereals, sugar cane is the largest contributor to total crop residue generation due to its high biomass generation potential. However, the N, P, and K content of crop residue does not mirror its overall volume. Sugarcane trash, for instance, has a significantly lower NPK content compared to pulses, oilseed crops, and cereals (Tandon, 1995; Pathak and Fagodiya, 2022). Consequently, residues from cereals, pulses, and oil seeds collectively contribute roughly 85% of the annual N, P, and K generation through crop residue.
Cereal crop residue, particularly rice and wheat, plays a critical role in K management. This is because cereal residues boast a higher K content compared to residues from oilseeds and pulses (Vijayakumar et al., 2023, Vijayakumar et al., 2024c). While pulses and oilseeds occupy less land and have lower biological yields than cereals, their residues contribute a significant 25% of total N and P due to their rich N and P content. Consequently, recycling cereal residues becomes particularly crucial in regions facing K depletion, while those with N and P depletion can benefit from incorporating pulse and oilseed residues. A prime example is the rice-wheat cropping system of the Indo-Gangetic Plain, considered India’s breadbasket, which is experiencing unsustainable K mining (Vijayakumar et al., 2024a, Vijayakumar et al., 2024b). Government policies promoting the proper collection and recycling of cereal residues could significantly mitigate K depletion in such intensive cropping systems.
4.4 Oil meal generation and its nutrient value
Madhya Pradesh and Maharashtra are the primary producers of oil meal due to their leading position in oilseed production. Soybean, groundnut, and rapeseed/mustard dominate oilseed production and subsequent N, P, and K generation through oil meal due to their large area in the county. Oil meals are rich in essential plant nutrients, often referred to as concentrated sources of organic manure (Mbewe, 2015). Traditionally, farmers incorporate them into the soil during land preparation or apply them as top dressing during crop growth for optimal nutrient supply and pest control (Campos et al., 2016; Chaudhary et al., 2017). Despite their numerous benefits, their agricultural use is limited due to high demand in other sectors, primarily livestock feed production (Sunil et al., 2015; Singh et al., 2022). For example, groundnut meal and soybean meal are used as protein-rich feed supplements for livestock (Ancua and Sonia, 2020; Singh et al., 2022). The higher market value of oil meals in both domestic and international markets makes their agricultural use economically less viable (Serrapica et al., 2019).
4.5 Total N, P, and K generation through various organic waste in India
The generation ratio of N to P to K through various organic waste in India stands at 4.1:1.0:4.0, respectively. The highest share of nutrient is consistently N, primarily due to the elevated N content found in both animal dung and oil meal. Animal waste is the single largest source of reusable N, making its collection and processing vital for national sustainability efforts. In contrast, P generation is the lowest across all organic waste categories, reflected in the low P component of the overall ratio (1.0). This lower yield is a critical finding, indicating that even complete recycling of organic waste may not fully address the nation’s P requirements. This underscores the need for strategic supplementation of P from external sources, or targeted P recovery technologies. The high K generation (4.0) is attributed primarily to the greater K content naturally present in crop residues, as potassium is highly mobile and accumulates in plant stalks and leaves.
Regional disparities are notable when comparing the organic nutrient generation per unit area. States like Punjab and Haryana, known for their Green Revolution-driven agriculture, exhibit high nutrient generation per unit area, reflecting high input intensity. On the other hand, states like Arunachal Pradesh and Manipur, with their hilly terrains and less intensive farming, contribute relatively lesser but still significant amounts of organic nutrients. The data on organic nutrient generation across Indian states not only reflects the agricultural landscape but also underscores the need for region-specific agricultural policies.
4.6 Organic waste availability
Despite having a smaller agricultural area, Chandigarh and Delhi exhibit a higher availability of organic waste per hectare, primarily due to the generation of a higher quantity of animal waste compared to crop residue and oil meal. Large numbers of cattle and buffalo are raised in these densely populated UTs to meet the high demand for milk and dairy products, resulting in higher generation of animal waste compared to crop residue or oil meal. Fodder, mostly wheat straw, is imported from neighboring states during the crop harvest to meet the year-round fodder needs of these herds. Consequently, these combined factors lead to a higher generation of organic waste in Chandigarh and Delhi than in other states. States with extensive agricultural activities, such as Punjab and Haryana, demonstrate moderate to high OM availability. This can be attributed to the prevalent practice of livestock rearing alongside crop cultivation, resulting in substantial dung and crop residue availability. Conversely, states with less intensive agriculture and livestock rearing, like Kerala and Mizoram, exhibit lower OM availability. States with significant livestock populations, such as Bihar and Jammu and Kashmir, showcase relatively higher OM availability due to greater dung generation.
4.7 NPK consumption through inorganic fertilizers
The disparities observed among states in the consumption of N, P, and K fertilizers can be attributed to a multitude of factors, ranging from soil fertility and cropping patterns to infrastructural development and socioeconomic dynamics. Cropping system influence: States like Punjab and Haryana, with their dominant rice-wheat cropping system, exhibit a high demand for fertilizers due to the inherent responsiveness of these crops (Vijayakumar et al., 2022; Vijayakumar et al., 2024a). Similarly, the rice-rice system prevalent in southern states like Andhra Pradesh, Telangana, and Puducherry also leads to high fertilizer use. In contrast, the hilly terrain and colder climate of northeastern India favor the cultivation of plantation crops, spices, and other crops that are less nutrient-demanding. Soil nutrient availability: Southern states generally have lower levels of readily available N, P, and K compared to northern and northeastern regions (Choudhury et al., 2013). Conversely, northeastern states are blessed with soils richer in organic matter and other nutrients. Irrigation Infrastructure: Well-developed irrigation systems in southern and northern states enable multiple cropping cycles throughout the year, further influencing fertilizer usage (Vijayakumar et al., 2022; Mallareddy et al., 2023). This contrasts with eastern and northeastern states, where underdeveloped irrigation infrastructure limits the adoption of fertilizer-intensive agricultural practices. Consequently, fertilizer consumption is demonstrably higher in southern and northern states compared to their eastern and northeastern counterparts.
4.8 NPK balance: a key indicator of organic agriculture potential
Sikkim maintains 100% of its agricultural land under organic cultivation despite possessing only 94 kg NPK/ha obtainable from organic waste (Paunglad, 2022). In stark contrast, Meghalaya, with nearly double Sikkim’s organic NPK availabilities (175 kg/ha), presents a compelling case for a full-scale organic transition. Arunachal Pradesh (107 kg/ha) boasts a similar promise. Even Nagaland, utilizing minimal inorganic fertilizers (1 kg NPK/ha), demonstrates potential, although its organic NPK availability is slightly lower (68 kg/ha). Furthermore, the soils of northeastern states are rich in organic carbon content (3.5% to 5.5%), further solidifying their suitability for organic practices (Choudhury et al., 2013). This scenario paints a promising picture for expanding India’s certified organic farming, particularly in the Northeast. Organic products often fetch premium prices, while localized organic inputs minimize external costs, potentially leading to significant socio-economic benefits for farmers. However, unlocking this potential hinges on proactive government policies and support systems to facilitate large-scale organic certification across the region.
Similarly, states like Andaman and Nicobar Islands and Lakshadweep hold promise for adopting 100% organic farming. The availability of NPK through organic waste in Andaman and Nicobar and Lakshadweep Islands is 194 kg/ha and 153 kg/ha, respectively, while the use of NPK fertilizer is insignificant (7.6 kg/ha in Andaman and Nicobar Islands and negligible in Lakshadweep). These island territories face limited accessibility to fertilizers due to their geographical remoteness and limited size. Therefore, encouraging organic agriculture in these states is a particularly suitable approach as it will reduce dependency on chemical fertilizers and also improve the quality of soil, environment, and food.
States like Himachal Pradesh, Uttarakhand, Rajasthan, Jharkhand, and West Bengal exhibit significant potential for organic farming, as evidenced by their NPK surplus of over 50 kg NPK per hectare. To harness this potential, both state and central governments must prioritize the promotion of organic farming through the implementation of favorable policies, streamlined certification processes, and robust support systems. Simplifying and expediting certification procedures in these states will encourage more farmers to transition to organic practices. Additionally, it is crucial to establish a reliable market infrastructure for organic products, ensuring farmers receive fair prices and reducing their dependence on middlemen, who often exploit the system. Equally important is the need to provide comprehensive training programs to farmers, enhancing their understanding of organic farming techniques and the certification process. By raising awareness and equipping farmers with the necessary skills, these states can not only boost organic farming adoption but also contribute to sustainable agricultural practices and improved livelihoods.
On the other hand, states such as Haryana, Punjab, Tamil Nadu, Gujarat, Andhra Pradesh, Karnataka, Bihar, Uttar Pradesh, and Telangana, renowned for their intensive cultivation and large-scale farming, have high usage levels of NPK fertilizer. Although these states produce significant quantities of NPK through organic waste, it falls short of meeting the entire demand of these states. Therefore, practices like INM should be encouraged in these states instead of promoting organic agriculture. Alternatively, policymakers can promote organic agriculture in these states only in selected areas after careful consideration of soil nutrient status, cropping pattern, and quantity of organic waste generation in that particular area.
5 Limitations of the study
Our findings provide valuable insights, though certain limitations must be acknowledged. The study likely underestimates organic waste and nutrient generation in India due to excluded sources. First, urban and household organic waste, significant in countries like India with a population of 1.4 billion, were not included due to data unavailability, highlighting the need for standardized methodologies to quantify such waste. Second, residues from horticultural crops (e.g., fruits, vegetables, and flowers), which occupy less land but may contribute substantially, were omitted, necessitating the development of new approaches to assess horticultural waste. Third, agro-industrial by-products such as coconut coir, rice husk, and sugar industry residues were excluded due to data unavailability. Fourth, waste generated by the fisheries sector (including fish processing waste and aquaculture waste) was not included. This omission is particularly relevant in coastal regions and islands where fisheries are major economic activities and significant local contributors to organic waste and nutrient streams. These exclusions suggest that the actual organic waste and nutrient generation are likely higher than reported. These limitations underscore the need for future research to address these gaps and enhance the accuracy of organic waste generation estimates in agriculture.
5.1 Challenges in the collection, storage, and transportation of organic waste
Not all organic waste generated in the country is available for agricultural or manure purposes. For instance, oil meals are predominantly utilized in the livestock feed industry, while cattle and buffalo waste is often used as fuel, clay plaster, and insulation material. Similarly, animal waste serves a multitude of purposes in rural Indian life. Approximately 60 million metric tons of cattle dung were used as cooking fuel till the 1990s (Saxena and Sewak, 2016; Kaur et al., 2017). Dung is also used for plastering walls and floors of rural mud houses, providing insulation in both winter and summer (Dash, 2017). Moreover, burning dung cake acts as a natural mosquito repellent, and the resulting ash is traditionally used as a cleaning agent for kitchen utensils (Gupta et al., 2016).
Livestock waste is often mixed with bedding material and is generated continuously across numerous small, dispersed farms. Collecting it efficiently and consistently from these scattered sources for centralized processing or application is costly and energy-intensive. Similarly, unlike concentrated industrial waste, crop residues are spread thinly across large agricultural fields. Collection requires specialized machinery (e.g., balers, choppers) and significant labor and fuel costs that often outweigh the economic incentive, especially for smallholders.
Livestock waste, in particular, has high moisture content, leading to rapid microbial activity, nutrient loss (e.g., N volatilization as ammonia), and potential odor issues. Large-scale, covered, and appropriately lined storage facilities are necessary to mitigate environmental contamination and preserve nutrient value, which represents a substantial capital investment. Similarly, Crop residues are bulky, which severely limits the amount that can be transported per trip, dramatically increasing transportation costs per unit of nutrient. Efficient storage requires compaction or pelletization. Poor road access in many rural areas and the sheer volume of material needed to supply processing facilities (like composting or biogas plants) pose significant barriers. The “farm-to-processor” distance is a crucial economic determinant for viability.
Establishing and operating centralized processing facilities (e.g., large-scale composting sites) requires significant upfront capital. Operational costs include labor, energy, equipment maintenance, and quality control. The final compost must be competitively priced against synthetic fertilizers, often making the process economically marginal without government subsidies or a carbon credit market. Overall, the existing inefficient collection and storage systems for organic waste in India may further limit the availability of animal and crop residues for agricultural use. Consequently, the actual quantity of organic waste accessible for nutrient recycling is likely lower than the total generated, highlighting a gap between potential and utilizable organic resources. Therefore, government policy should promote proper organic waste collection, storage, and recycling to bridge this gap.
6 Conclusion
This study provides the first comprehensive state-wise estimation of organic waste generation and its nutrient potential. By meticulously quantifying N, P, and K generation from animal waste, crop residues, and oil meals, it offers valuable region-specific data essential for strategic agricultural planning. The generated data is an immediate and actionable resource for policymakers seeking to transition toward sustainable practices. States with positive nutrient balances, such as those in the Northeast, Rajasthan, Uttarakhand, Himachal Pradesh, West Bengal, and Jharkhand, should be strongly encouraged to expand organic farming. This transition can be facilitated by strategically utilizing existing government schemes (e.g., Paramparagat Krishi Vikas Yojana - PKVY, or Mission Organic Value Chain Development for North Eastern Region - MOVCD-NER) to subsidize localized waste-to-manure infrastructure, composting units, and baling equipment.
Conversely, states facing significant N and P deficit balances, including Andhra Pradesh, Karnataka, Telangana, Odisha, Tamil Nadu, Maharashtra, Uttar Pradesh, Bihar, Punjab, and Haryana, must prioritize INM plans to overcome negative balance. By recycling organic waste efficiently, the nation can reduce its dependence on costly, imported inorganic fertilizers, thereby improving economic resilience for farmers and the national economy. Furthermore, incorporating organic matter back into the soil improves soil health, carbon sequestration capacity, and water-holding capacity, which directly contributes to environmental sustainability and climate resilience. Overall, this study equips policymakers with the robust, quantitative data needed to promote sustainable agriculture, optimize resource allocation, reduce dependence on inorganic fertilizers, and enhance environmental resilience across India’s diverse agro-climatic regions.
Data availability statement
The original contributions presented in the study are included in the article/Supplementary Material. Further inquiries can be directed to the corresponding author.
Author contributions
VS: Conceptualization, Data curation, Formal analysis, Writing – original draft, Writing – review & editing, Investigation, Methodology, Visualization. VK: Conceptualization, Writing – original draft, Writing – review & editing, Methodology, Supervision, Resources, Visualization. RS: Writing – original draft, Writing – review & editing, Resources, Supervision. RM: Visualization, Writing – original draft, Writing – review & editing, Methodology, Resources, Supervision. PP: Writing – original draft, Writing – review & editing, Conceptualization, Formal analysis, Investigation. VM: Visualization, Writing – original draft, Writing – review & editing, Conceptualization, Formal analysis, Investigation, Methodology. AN: Writing – original draft, Writing – review & editing, Conceptualization, Supervision.
Funding
The author(s) declare that no financial support was received for the research, and/or publication of this article.
Acknowledgments
The authors express their gratitude to Indiastat.com for generously providing the data on livestock population and crop yield. Additionally, we extend our appreciation to ICAR-IIRR, Hyderabad, India, for their invaluable support throughout the process of data collection, analysis, tabulation, and manuscript preparation.
Conflict of interest
The authors declare that the research was conducted in the absence of any commercial or financial relationships that could be construed as a potential conflict of interest.
The handling editor DD declared a past co-authorship with the author RS.
Generative AI statement
The author(s) declare that no Generative AI was used in the creation of this manuscript.
Any alternative text (alt text) provided alongside figures in this article has been generated by Frontiers with the support of artificial intelligence and reasonable efforts have been made to ensure accuracy, including review by the authors wherever possible. If you identify any issues, please contact us.
Publisher’s note
All claims expressed in this article are solely those of the authors and do not necessarily represent those of their affiliated organizations, or those of the publisher, the editors and the reviewers. Any product that may be evaluated in this article, or claim that may be made by its manufacturer, is not guaranteed or endorsed by the publisher.
Supplementary material
The Supplementary Material for this article can be found online at: https://www.frontiersin.org/articles/10.3389/fagro.2025.1689121/full#supplementary-material
Abbreviations
AP, Andhra Pradesh; AR, Arunachal Pradesh; AS, Assam; BR, Bihar; CG, Chhattisgarh; GA, Goa; GJ, Gujarat; HR, Haryana; HP, Himachal Pradesh; J&K, Jammu & Kashmir; JH, Jharkhand; KA, Karnataka; KL, Kerala; MP, Madhya Pradesh; MH, Maharashtra; MN, Manipur; ML, Meghalaya; MZ, Mizoram; NL, Nagaland; OD, Odisha; PB, Punjab; RJ, Rajasthan; SK, Sikkim; TN, Tamil Nadu; TR, Tripura; UK, Uttarakhand; UP, Uttar Pradesh; WB, West Bengal; TN, Tamil Nadu; TR, Tripura; AN, Andaman and Nicobar Islands; CH, Chandigarh; DH, Dadra and Nagar Haveli; DD, Daman and Diu; DL, Delhi; LD, Lakshadweep; PY, Pondicherry.
References
Abdel-Rahman E. H., Alzahrani F. S., and Sulieman A. M. E. H. (2020). Potential of camel dung as promising organic manure in Saudi Arabia. Adv. Life Sci. 7, 202–207.
Aktar M. W., Sengupta D., and Chowdhury A. (2009). Impact of pesticides use in agriculture: their benefits and hazards. Interdiscip. Toxicol. 2, 1–12. doi: 10.2478/v10102-009-0001-7, PMID: 21217838
Ancua P. and Sonia A. (2020). Oil press-cakes and meals valorization through circular economy approaches: A review. Appl. Sci. 10, 7432. doi: 10.3390/app10217432
Baker E., Kerr R. B., Deryng D., Farrell A., Gurney-Smith H., and Thornton P. (2023). Mixed farming systems: potentials and barriers for climate change adaptation in food systems. Curr. Opin. Env. Sustain. 62, 101270. doi: 10.1016/j.cosust.2023.101270
Basak B. B., Sarkar B., Maity A., Chari M. S., Banerjee A., and Biswas D. R. (2023). Low-grade silicate minerals as value-added natural potash fertilizer in deeply weathered tropical soil. Geoderma. 433, 116433. doi: 10.1016/j.geoderma.2023.116433
Bisht N. and Chauhan P. S. (2020). Excessive and disproportionate use of chemicals cause soil contamination and nutritional stress. Soil contamination-threats Sustain. solutions. 16, 1–0. doi: 10.5772/intechopen.94593
Brar B. S., Singh J., Singh G., and Kaur G. (2015). Effects of long term application of inorganic and organic fertilizers on soil organic carbon and physical properties in maize–wheat rotation. Agron 5, 220–238. doi: 10.3390/agronomy5020220
Campos E. V., De Oliveira J. L., Pascoli M., De Lima R., and Fraceto L. F. (2016). Neem oil and crop protection: from now to the future. Front. Plant Sci. 7. doi: 10.3389/fpls.2016.01494, PMID: 27790224
Chaudhary S., Kanwar R. K., Sehgal A., Cahill D. M., Barrow C. J., Sehgal R., et al. (2017). Progress on Azadirachta indica based biopesticides in replacing synthetic toxic pesticides. Front. Plant Sci. 8. doi: 10.3389/fpls.2017.00610, PMID: 28533783
Choudhury B. U., Mohapatra K. P., Das A., Das P. T., Nongkhlaw L., Fiyaz R. A., et al. (2013). Spatial variability in distribution of organic carbon stocks in the soils of North East India. Curr. Sci. 104 (5), 604–614.
Dash S. (2017). Contribution of livestock sector to Indian economy. Paripex-Indian J. Res. 6, 890–891.
Deb S. M. (2015). “Traditional livestock production and growth opportunities in India,” in Proceedings of 23rd international grassland congress -keynote lectures, Jhansi, Uttar Pradesh, India: Range Management Society of India 69–78.
Dutta A., Patra A., Hazra K. K., Nath C. P., Kumar N., and Rakshit A. (2022). A state of the art review in crop residue burning in India: Previous knowledge, present circumstances and future strategies. Environ. Chall. 8, 100581. doi: 10.1016/j.envc.2022.100581
Gadedjisso-Tossou A., Adjegan K. I., and Kablan A. K. (2021). Rainfall and temperature trend analysis by Mann–Kendall test and significance for Rainfed Cereal Yields in Northern Togo. Sci 3, 17. doi: 10.3390/sci3010017
Gamage A., Gangahagedara R., Gamage J., Jayasinghe N., Kodikara N., Suraweera P., et al. (2023). Role of organic farming for achieving sustainability in agriculture. Farming Syst. 1, 100005. doi: 10.1016/j.farsys.2023.100005
Gaur A. C. and Mathur R. S. (1990). “Organic manures. Soil fertility and fertilizer use. Vol IV,” in Nutrient management and supply system for sustaining agriculture in 1990s, New Delhi: IFFCO 149–159.
Gupta K. K., Aneja K. R., and Rana D. (2016). Current status of cow dung as a bioresource for sustainable development. Bioresources Bioprocessing 3, 1–11. doi: 10.1186/s40643-016-0105-9
Gupta M. K., Sharma S. D., Jha M. N., and Pandey R. (2006). Response of organic and chemical fertilizers to the establishment and growth of eucalyptus in sodic land of Uttar Pradesh, India. Indian Forrester 132, 726–736.
Herrero M., Grace D., Njuki J., Johnson N., Enahoro D., Silvestri S., et al. (2013). The roles of livestock in developing countries. Animal 7, 3–18. doi: 10.1017/S1751731112001954, PMID: 23121696
Horrigan L., Lawrence R. S., and Walker P. (2002). How sustainable agriculture can address the environmental and human health harms of industrial agriculture. Environ. Health Perspect. 110, 445–456. doi: 10.1289/ehp.02110445, PMID: 12003747
Kaur G., Brar Y. S., and Kothari D. P. (2017). Potential of livestock generated biomass: Untapped energy source in India. Energies 10, 847. doi: 10.3390/en10070847
Mallareddy M., Thirumalaikumar R., Balasubramanian P., Naseeruddin R., Nithya N., Mariadoss A., et al. (2023). Maximizing water use efficiency in rice farming: A comprehensive review of innovative irrigation management technologies. Water 15, 1802. doi: 10.3390/w15101802
Malomo G. A., Madugu A. S., and Bolu S. A. (2018). “Sustainable animal manure management strategies and practices,” in Agricultural waste and residues. Ed. Aladjadjiyan A. (London, UK: InTech). doi: 10.5772/intechopen.78645
Mbewe E. C. (2015). “The efficacy of sunflower seed cake as an organic fertilizer,” in United Nations University Land Restoration Training Programme [final project]. Reykjavik, Iceland: Árleynir. 22, 112. Available online at: http://www.unulrt.is/static/fellows/document/Mbewe2015.pdf (Accessed February 02, 2025).
McGrath J. M., Spargo J., and Penn C. J. (2014). “Soil fertility and plant nutrition,” in Encyclopedia of agriculture and food systems (Netherlands: Academic PressElsevier), 166–184. doi: 10.1016/B978-0-444-52512-3.00249-7b
Mishra A. K., Deep S., and Choudhary A. (2015). Identification of suita ble sites for organic farming using AHP & GIS. Egypt. J. Remote Sens. Space Sci. 18, 181–193. doi: 10.1016/j.ejrs.2015.06.005
Pajura R. (2023). Composting municipal solid waste and animal manure in response to the current fertilizer crisis-a recent review. Sci. Total Environ. 912, 169221. doi: 10.1016/j.scitotenv.2023.169221, PMID: 38101643
Pathak H. and Fagodiya R. K. (2022). Nutrient budget in Indian agriculture during 1970–2018: assessing inputs and outputs of nitrogen, phosphorus, and potassium. J. Soil Sci. Plant Nutt. 22, 1832–1845. doi: 10.1007/s42729-022-00775-2
Paunglad B. (2022). Lesson learned of organic agricultural policy of sikkim state, India to Thailand. NIDA Case Res. J. 14, 27–57.
Radha Y. and Kumar K. (2022). Development of livestock sector in andhra pradesh, India. J. Livest. Sci. 13, 239–249. doi: 10.33259/JLivestSci.2022.239-249
Rani N. (2022). “Rejuvenating soil health using organic manures for sustainable agriculture,” in New and future developments in microbial biotechnology and bioengineering. Sustainable agriculture: revitalization through organic products (Amsterdam, Netherlands: Elsevier), 181–198. doi: 10.1016/B978-0-12-822974-3.00190-7
Rhode D., Madsen D. B., Brantingham P. J., and Dargye T. (2007). Yaks, yak dung, and prehistoric human habitation of the Tibetan Plateau. Dev. Quat. Sci. 9, 205–224. doi: 10.1016/S1571-0866(07)09013-6
Röös E., Mie A., Wivstad M., Salomon E., Johansson B., Gunnarsson S., et al. (2018). Risks and opportunities of increasing yields in organic farming. A review. Agron. Sustain. Dev. 38, 1–21. doi: 10.1007/s13593-018-0489-3
Sabouni I., Allach M., and Ishak E. A. (2018). Evaluation of camels, sheep and chicken manures influences on growth and fruits quality of olive trees in Al Jouf region, Saudi Arabia. Int. J. Plant Anim. Env. Sci. 8, 32–39.
Saxena K. L. and Sewak R. (2016). Livestock waste and its impact on human health. Int. J. Agric. Sci. 6, 1084–1099.
Serrapica F., Masucci F., Raffrenato E., Sannino M., Vastolo A., Barone C. M., et al. (2019). High fiber cakes from mediterranean multipurpose oilseeds as protein sources for ruminants. Animals 9, 918. doi: 10.3390/ani9110918, PMID: 31690014
Singh R., Langyan S., Sangwan S., Rohtagi B., Khandelwal A., and Shrivastava M. (2022). Protein for human consumption from oilseed cakes: a review. Front. Sustain. Food Syst. 6. doi: 10.3389/fsufs.2022.856401
Sunil L., Appaiah P., Prasanth Kumar P. K., and Gopala K. A. G. (2015). Preparation of food supplements from oilseed cakes. J. Food Sci. Technol. 52, 2998–3005. doi: 10.1007/s13197-014-1386-7, PMID: 25892801
Tandon H. L. S. (1995). Recycling of crop, animal, human and industrial wastes in agriculture (New Delhi: FDCO).
Tudi M., Ruan H., Wang L., Lyu J., Sadler R., Connell D., et al. (2021). Agriculture development, pesticide application and its impact on the environment. Int. J. Environ. Res. Public Health 18, 1112. doi: 10.3390/ijerph18031112, PMID: 33513796
Vijayakumar S., Gobinath R., Kannan P., and Murugaiyan V. (2024b). Optimizing potassium mining in rice-wheat system: Strategies for promoting sustainable soil health - A review. Farming Syst. 2, 100099. doi: 10.1016/j.farsys.2024.100099
Vijayakumar S., Kumar D., Ramesh K., Bussa B., Kaje V. V., and Shivay Y. S. (2024a). Effect of split application of potassium on nutrient recovery efficiency, soil nutrient balance, and system productivity under rice-wheat cropping system (RWCS). J. Plant Nutt. 47, 1546–1563. doi: 10.1080/01904167.2024.2315974
Vijayakumar S., Kumar D., Ramesh K., Jinger D., and Rajpoot S. K. (2022). Effect of potassium fertilization on water productivity, irrigation water use efficiency, and grain quality under direct seeded rice-wheat cropping system, J. Plant Nutt. 45, 2023–2038. doi: 10.1080/01904167.2022.2046071
Vijayakumar S., Kumar D., Shivay Y. S., Sharma D. K., and Varatharajan T. (2024c). 4R stewardship-based potassium application to enhance iron, zinc, and copper nutrient levels in wheat (Triticum aestivum L.). Technol. Agron 4, e024. doi: 10.48130/tia-0024-0021
Vijayakumar S., Kumar D., Varatharajan T., Kaje V. V., and Deiveegan M. (2023). Enriching cationic micro-nutrients concentration in basmati rice through potassium fertilization. J. Plant Nutt. 46, 3355–3369. doi: 10.1080/01904167.2023.2203183
Wang F., Shao W., Yu H., Kan G., He X., Zhang D., et al. (2020). Re-evaluation of the power of the Mann-Kendall test for detecting monotonic trends in hydrometeorological time series. Front. Earth Sci. 8, 14. doi: 10.3389/feart.2020.00014
Wang X., Yan J., Zhang X., Zhang S., and Chen Y. (2020). . Organic manure input improves soil water and nutrients use for sustainable maize (Zea mays. L) productivity on the Loess Plateau. . PloS One 15, e0238042. doi: 10.1371/journal.pone.0238042, PMID: 32841280
Wartell B. A., Krumins V., Alt J., Kang K., Schwab B. J., and Fennell D. E. (2012). Methane production from horse manure and stall waste with softwood bedding. Bioresour. Technol. 112, 42–50. doi: 10.1016/j.biortech.2012.02.012, PMID: 22418082
Westendorf M. and Krogmann U. (2006). Horse manure management: bedding use [online]. Available online at: http://esc.rutgers.edu/fact_sheet/horse-manure-management-bedding-use/ (Accessed February 02, 2025).
Yadav S. K., Babu S., Yadav M. K., Singh K., Yadav G. S., and Pal. S. (2013a). A review of organic farming for sustainable agriculture in Northern India. Int. J. Agron. 718145, 1–8. doi: 10.1155/2013/718145
Keywords: crop residue, animal waste, nitrogen, phosphorus, potassium
Citation: Shanmugam V, Kumar V, Sundaram RM, Kumar RM, Peramaiyan P, Murugaiyan V and Nayak AK (2025) Quantifying India’s nitrogen, phosphorus, and potassium generation potential from agricultural and animal waste for sustainable nutrient management. Front. Agron. 7:1689121. doi: 10.3389/fagro.2025.1689121
Received: 20 August 2025; Accepted: 20 October 2025;
Published: 12 November 2025.
Edited by:
Debarup Das, Indian Agricultural Research Institute (ICAR), IndiaReviewed by:
Abd Al Karim Jaafar, Damascus University, SyriaSuvana Sukumaran, Central Research Institute for Dryland Agriculture (ICAR), India
Copyright © 2025 Shanmugam, Kumar, Sundaram, Kumar, Peramaiyan, Murugaiyan and Nayak. This is an open-access article distributed under the terms of the Creative Commons Attribution License (CC BY). The use, distribution or reproduction in other forums is permitted, provided the original author(s) and the copyright owner(s) are credited and that the original publication in this journal is cited, in accordance with accepted academic practice. No use, distribution or reproduction is permitted which does not comply with these terms.
*Correspondence: Vijayakumar Shanmugam, dmlqaXRuYXVAZ21haWwuY29t; dmlqYXlha3VtYXIuc0BpY2FyLm9yZy5pbg==