 Hannah R. Blyth1,2
 Laurent Cornette2
 Barrie Hunt2
 Richard P. Haslam1
 Frédéric Beaudoin1
 Dana R. MacGregor1*
- 1Rothamsted Research, Harpenden, United Kingdom
- 2Gowan Crop Protection Ltd, Harpenden, United Kingdom
Pre-emergent herbicides are essential tools in weed management, yet for some, we lack a molecular-level understanding of how they work. Here, we investigated how three Group 15 pre-emergent herbicides - flufenacet, S-ethyl dipropylthiocarbamate (EPTC), and tri-allate - affected growth and biochemical responses of two blackgrass (Alopecurus myosuroides) biotypes. Using a sterile, agar-based system, we quantified early seedling growth across a range of herbicide concentrations. ED40 doses defined from these (60 nM for flufenacet on shoots, 90 mM for flufenacet on roots, 600 nM for EPTC, and 6 μM for tri-allate) were used to assess the herbicides’ effects on cuticular wax composition and fatty acid metabolism using two biotypes: herbicide-sensitive “Rothamsted”, and “Peldon” which has well-characterized metabolic herbicide resistance. Flufenacet and tri-allate were both less effective on Peldon. At the ED40 dose, EPTC was less effective on Rothamsted. Flufenacet inhibited both shoot and root growth. Tri-allate and EPTC inhibited shoot growth but had no significant effect on root growth. As expected for Group 15 herbicides, total shoot wax content was affected by EPTC (Peldon -32% and Rothamsted -20%), flufenacet (Peldon -13% and Rothamsted -48%) and tri-allate (Peldon -10% and Rothamsted -32%) as were many of the compounds with chain lengths ≥C26. Unexpectedly, many of the C14-C26 species measured were altered in tri-allate, e.g. shoot α-linolenic acid was reduced by 80% and 93% in Peldon and Rothamsted, respectively. Together, these results reveal Group 15 pre-emergent herbicides cause distinct, biotype- and organ-specific actions and suggest they have different target(s) in planta.
Introduction
Herbicides are essential tools for managing weeds in agricultural systems. They are classified by the Herbicide Resistance Action Committee (HRAC) based on factors such as chemical structure, mode of action (MoA), timing of application, and target weed species (HRAC, 2024). This classification system is widely used by growers as rotating or mixing herbicides from different classes is shown to improve control efficacy and reduce selection pressure for resistance. Indeed, proper stewardship and integrated weed management practices are particularly important as the repeated use of the same herbicide or herbicides with a similar MoA can lead to the selection of herbicide-resistant weed populations (Hicks et al., 2018; Comont et al., 2019, 2020).
In 2020, HRAC updated the MoA classification system and transitioned from letter to number MoA codes (Liebl et al., 2020). The system was further updated in 2024 (Lerchl et al., 2024). As part of this update, herbicides previously within Groups N (“Lipid synthesis inhibition (not ACCase)”), Z (“Unknown mode of action”), and K3 (“Inhibition of cell division (inhibition of VLCFAs)”) were reclassified into Group 15 (HRAC, 2010, 2024; Liebl et al., 2020). Group 15 herbicides are suspected to act in the “Inhibition of Very Long-Chain Fatty Acid Synthesis (VLCFA)” (HRAC, 2024) where VLCFAs are fatty acids that contain more than 18 carbon atoms. VLCFA-inhibitors are characterized by 1) inducing phenotypes resembling those of elongase mutants (Lechelt-Kunze et al., 2003) and 2) ability to kill plants by disrupting the composition and abundance of VLCFAs in waxes, phospholipids, and sphingolipids, which are essential for plant viability (Bach and Faure, 2010). Data from Gronwald (1991) suggest that while the thiocarbamates (e.g. EPTC and triallate) inhibit acyl-CoA elongases associated with the endoplasmic reticulum, Group 15 chloroacetamides (e.g. alachlor, metolachlor, acetochlor) may also inhibit fatty acid desaturases located in the chloroplast envelope. In line with this hypothesis, Beffa et al. (2024) proposed that, unlike most herbicide groups that inhibit a single enzyme, Group 15 herbicides may act via multiple enzymes or pathways in the VLCFA biosynthetic pathway. The outputs of this complex biosynthetic pathway that requires multiple enzymes and enzyme complexes and is compartmentalized within the cell are essential for plant life as described more fully below.
Several studies support the view that Group 15 herbicides affect the VLCFA biosynthesis pathway. For instance, changes in composition and content of wax, cuticular lipids, and foliar fatty acid and hydrocarbons content are directly correlated with the rate of application of EPTC (S-ethyl dipropylthiocarbamate) (Gentner, 1966). Additionally, flufenacet (N-(4-fluorophenyl)-N-(propan-2-yl)-2-{[5-(trifluoromethyl)-1,3,4-thiadiazol-2-yl] oxy} acetamide) inhibits VLCFA elongation and alters lipid profiles in heterologous yeast systems expressing Arabidopsis or other plant 3-KETOACYL-COA SYNTHASEs (KCS) enzymes (Le Ruyet et al., 2025; Trenkamp et al., 2004). By contrast, tri-allate (S-2,3,3-trichloroallyl di-isopropylthiocarbamate) did not affect elongases in the heterologous system (Trenkamp et al., 2004), although it reduced fatty acid levels in susceptible wild oat populations, presumably by acting on fatty acid synthase (FAS) (Rashid et al., 1997).
Blackgrass (Alopecurus myosuroides), the most problematic weed in UK cereal systems, presents an ideal and agronomically relevant context system to study Group 15 herbicide responses. All three herbicides, flufenacet (Dücker et al., 2020, 2019), EPTC (Fryer and Makepeace, 1978), and tri-allate (Allison, 2024), are applied pre-emergence to control blackgrass (Lainsbury, 2024). Blackgrass populations exhibit rapid adaptation, multiple-herbicide resistance, and enhanced metabolism traits (Comont et al., 2022), traits that collectively cause serious yield losses and generate management challenges (Varah et al., 2020). Although Group 15 resistance has been reported in Germany and Sweden (Heap, 2024), little is known about blackgrass’s response(s) to our selected Group 15 herbicides. Here, we focused on two well-characterized blackgrass biotypes that have been selected to exhibit archetype phenotypes: either “Sensitive” (Rothamsted) or “Non-target Site Resistance (NTSR)” conferred by enhanced metabolism (Peldon) from (Mellado-Sánchez et al., 2020). We are beginning to gain an understanding of the range of molecular mechanisms that underpin various weedy traits in these populations (Fu et al., 2023; Harrison et al., 2024; Cai et al., 2023), but their responses to Group 15 herbicides are unreported.
Therefore, to fill the knowledge gap identified by Beffa et al. (2024) additional data that determine which Group 15 herbicides have the same or similar effects on the VLCFA biosynthetic pathway are needed. It is important to do these experiments in relevant plants, preferably agricultural weeds, as metabolic differences in the yeast system limit the capacity to gain mechanistic insights into the effects of herbicides on VLFCA biosynthesis. For example yeast uses type I cytosolic FAS rather than the type II plastidial FAS system used by plants (Günenc et al., 2022). Furthermore, several Arabidopsis KCSs that are active in planta are inactive in yeast, likely due to missing cofactors (Batsale et al., 2023). Most relevant here, tri-allate’s proto-herbicidal form requires metabolic activation in planta, which is unlike to occur in yeast (Schuphan and Casida, 1979). As far as we are aware there are no data showing that EPTC has been tested in these systems. Mechanistic studies conducted in Arabidopsis or model species are informative, e.g. in Arabidopsis flufenacet inhibits cytokinesis and mimics elongase (Lechelt-Kunze et al., 2003; Bach et al., 2011), however, Arabidopsis lacks KCS10, an enzyme involved in condensing C22–C24 VLCFAs (Venegas-Calerón et al., 2007; Batsale et al., 2023). Moreover, without biochemical evidence, attributing decreased VLCFAs to direct inhibition of elongase activity is misleading, because in plants the substrate pools that make VLCFAs depend on both plastidial and mitochondrial metabolism (i.e. the acyl-CoA and malonyl CoA pools respectively). Therefore, existing data may not transfer directly to agriculturally relevant weeds.
Fatty acid (FA) biosynthesis in plants is compartmentalized, with de novo synthesis of C16 and C18 fatty acids occurring in plastids and subsequent elongation to VLCFAs in the endoplasmic reticulum (ER). These processes have been studied in detail in plant and other organisms and have been reviewed extensively (Batsale et al., 2021; Li-Beisson et al., 2013; Ohlrogge and Jaworski, 1997; Harwood, 2005; Günenc et al., 2022). VLCFA biosynthesis is catalyzed by the fatty acid elongase (FAE) complex, and involves four sequential enzymes, including KCSs, which determine chain-length specificity (Haslam and Kunst, 2013; Kunst and Samuels, 2009). These VLCFAs are incorporated into membrane phospholipids, sphingolipids, suberin and cuticular waxes, contributing to essential structural and physiological functions. Likewise, the current understanding of VLCFA–inhibiting herbicides have been reviewed recently by Jhala et al. (2024). While there is evidence that some Group 15 herbicides, including a thiocarbamate, inhibit KCS activity in yeast (Le Ruyet et al., 2025), as we argue above, not all (e.g. tri-allate and EPTC) have been adequately tested and it is possible that some of these compounds have a more complex mode of action with multiple enzyme targets (Beffa et al., 2024). Therefore, it is necessary to consider plant cell metabolism at a larger scale considering that differences in physiological status and metabolic pathways between tissues and organs may also result in difference in sensitivity to specific compounds.
To clarify the distinct and potentially multifaceted modes of action of Group 15 herbicides in an agriculturally relevant weed species, we assessed physiological and biochemical responses in blackgrass following exposure to flufenacet, EPTC, and tri-allate under sterile, controlled conditions. These analyses focused on plant growth, wax content, and FA composition across two contrasting blackgrass biotypes: Rothamsted (sensitive) and Peldon (NTSR via enhanced metabolism). By directly comparing herbicide effects on shoot and root development and lipid profiles, our study aimed to resolve whether these herbicides operate via shared or distinct mechanisms and whether biotype-specific traits influence sensitivity.
Materials and methods
Alopecurus myosuroides biotypes
The processes used to generate the “purified populations” are fully described in Mellado-Sánchez et al. (2020). In short, the seed lines were selected specifically to robustly exhibit “Herbicide Sensitive” or “NTSR-only Resistance” phenotypes. The resistant population (Peldon) were derived from individuals originally collected by (Moss, 1990), but selected to exhibit strong NTSR herbicide resistance against acetyl-coenzyme A carboxylase (ACCase)-inhibiting herbicide (fenoxaprop) while carrying the wild-type alleles of all known TSR mutations for acetolactate synthase (ALS) or ACCase. The herbicide-sensitive population (Rothamsted) were derived from clones of plants that were tested to be completely sensitive to a panel of herbicides from individuals originally collected from the herbicide-free section of Broadbalk (Moss et al., 2004).
Seed sterilization and media preparation
Surface sterilization of blackgrass seed was performed following an adapted version of the method from Speakman and Krüger (1983). Seeds were soaked in Terramycin (10 ppm) for 20 hours on a rotator in the dark, rinsed, and then treated with AgNO3 (0.1%) and NaCl (0.5%) solutions before final rinses with sterile water.
For media preparation, Hoagland’s No. 2 Basal Salt Mixture (H2395-10L, Merck) was mixed with Ultrapure Milli-Q water to create a 0.85X solution, the pH was adjusted to 7.0 with 1N KOH and Agar was added for a final concentration of 0.7%. This mixture was then autoclaved for 15 minutes at 121 °C. Herbicides were added once the media had cooled to ~55 °C at appropriate volumes to obtain the doses required. The herbicide formulations tested in this study included Avadex 480 (480 g/l tri-allate), Eptam (800 g/l EPTC), and Sunfire (500 g/l flufenacet). 140 mL media without (control) or with the herbicide (treatment) was added to each labelled sterile container (E1674.0001 DUCHEFA OS140, Melford). Sterilized seed were then placed on the surface of the solidified agar.
Plant growth conditions and sampling procedure
For testing responses to different herbicide doses, 10–12 sterilized seeds were spaced out on the prepared agar media and grown under controlled conditions in a Controlled Environment Chamber (17 °C/11 °C with 16 hours of light at 220 μmol m-2 s-1) for two weeks. Three dose-response curves were generated for each herbicide to narrow down the relevant range (See Figure 1; Supplementary Figure 1). The differences in herbicide doses required to induce these changes in our agar-based system (e.g. Figure 1) reflect the differences in recommended field rate use for these herbicides; e.g. recommended rates for field use of tri-allate are approximately 10X that of flufenacet (2250 g tri-allate/ha compared to 240 g flufenacet/ha (Lainsbury, 2024).
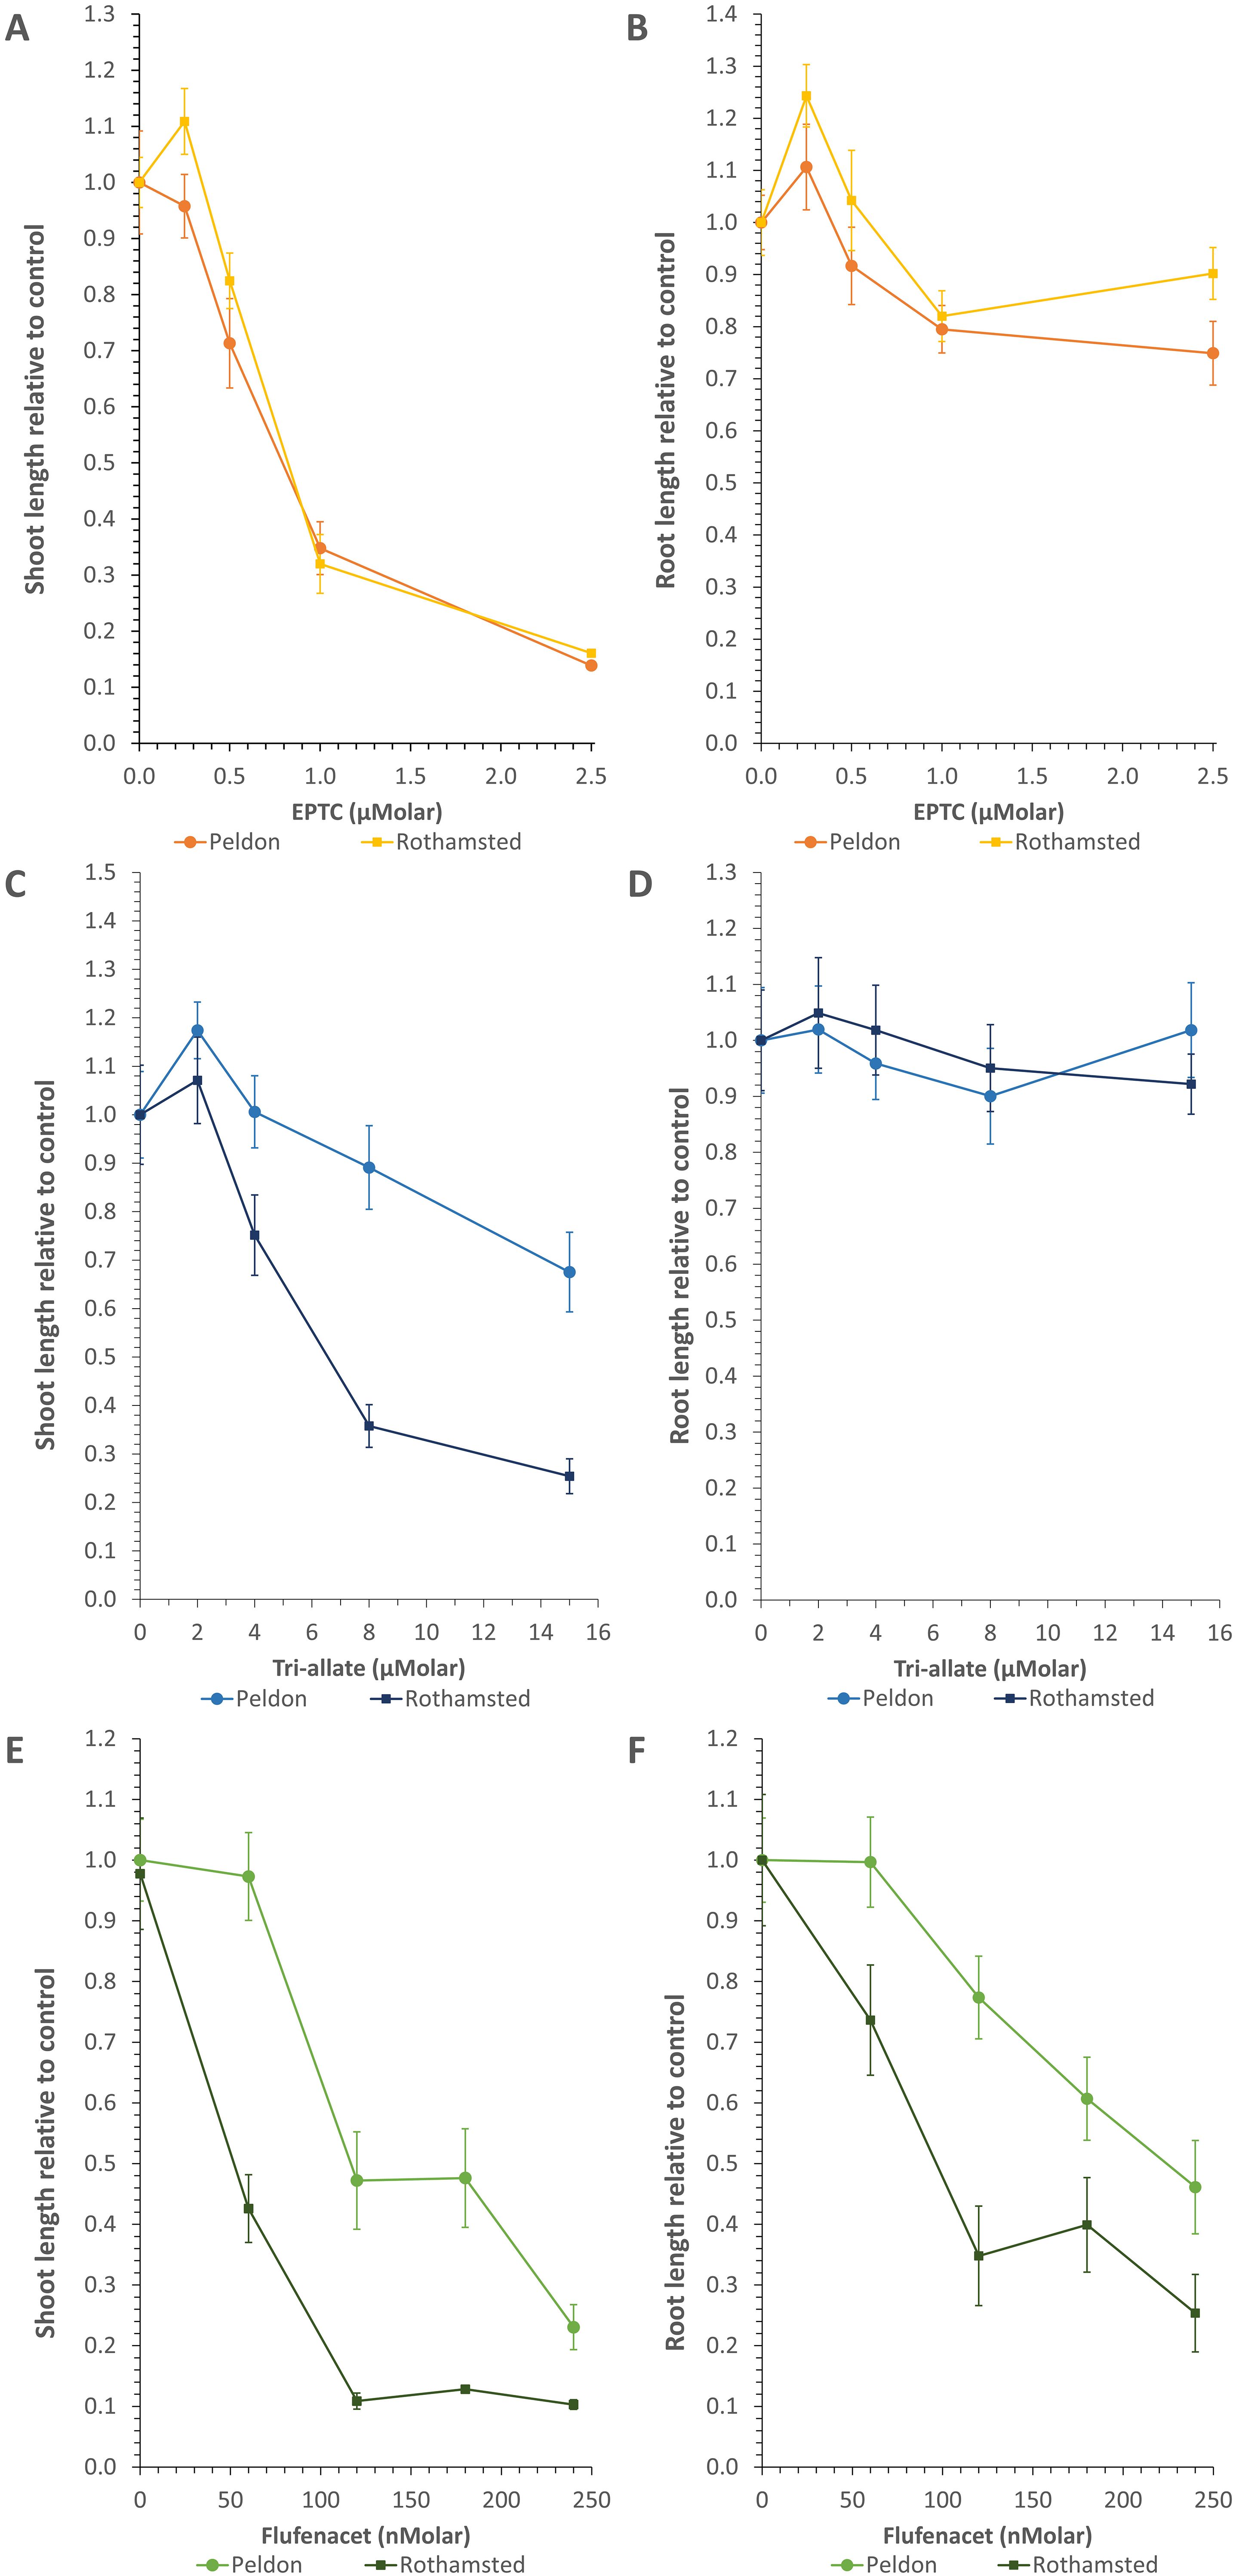
Figure 1. Example curves illustrating the different effects of the pre-emergent herbicides on the two blackgrass biotypes on shoots and roots. Average lengths relative to the biotype control ± standard error for (A, B) EPTC; (C, D) tri-allate; and (E, F) flufenacet. Statistical analyses for these data are presented in Supplementary Tables 1, 2.
Each dose-response series was completed as a separate experimental run. For each herbicide dose, there were three replica containers. After two weeks, each seedling was gently removed from its container with forceps and laid between two sheets of acetate. Each row between the acetate sheets corresponds to a biological replicate (a single container of 10–12 seedlings). The acetate-mounted seedling rows were scanned using a flatbed scanner (with white and black background contrast). Image analysis was conducted in ImageJ measuring the length of each plant’s root and shoot separately.
For the material used in lipid analysis, referred to as “single-dose experiments”, an increased number of 18–20 seeds were grown under the same controlled conditions. Each single-dose experiment for a given herbicide (EPTC, tri-allate, or flufenacet) was conducted as a separate experimental run, with treated and control samples grown and processed concurrently. Application of the herbicides were conducted in independent runs at different times. From each single-dose experiment, one replicate set (three biological replicates each of control and treated containers) was used to verify that the ED40 dose achieved the expected growth inhibition. The remaining three replicate sets (nine control containers and nine herbicide-treated containers total) were used for lipid extraction and analysis. Seedlings from these were carefully removed from the container, and then, using sterilized scissors, roots and shoots were separated from the seed and placed into a pre-weighed glass tube. One tube contained root or shoot material from one biological replicate (one container). After adding the material, the tubes were reweighed to determine the fresh weight, then freeze-dried overnight and sealed for storage.
Herbicide dose response testing, ED40 identification and analysis
ImageJ was used to quantify root and shoot lengths from scanned images that included a reference ruler. The data were analyzed in Excel to calculate growth means and standard errors. For each treatment replicate, the measured length was divided by the average length of the corresponding control group replicates from the same experimental batch. This normalization step expressed the data as a ratio relative to the control mean, centering the control values at 1.0. Therefore, treatment values greater than 1.0 indicate increased growth compared to control, while values less than 1.0 represent growth inhibition relative to the untreated state.
Response data were visualized in Excel, and normalized data were used to identify the herbicide and dose resulting in approximately 40% growth inhibition (ED40) by interpolation from dose-response curves. ED40 doses were established through this dose-response analysis and validated in an independent replicate series grown in parallel under identical conditions before proceeding with biochemical sampling. This approximate effective dose was chosen as the target dose for herbicide treatments to ensure sufficient plant tissue, especially root tissue, would be available for subsequent analyses while still inducing an herbicidal effect on plant growth.
EPTC was tested across three dose-response series (test 1: 0, 0.50, 1.00, 5.00, 10.0 μM; test 2: 0, 0.25, 0.50, 1.00, 2.50 μM; test 3: 0, 0.20, 0.40, 0.80, 1.00 μM) and a single dose at 0.60 μM with a control. Tri-allate received similar testing across three dose-response series (test 1: 0, 0.50, 1.00, 5.00, 10.0 μM; test 2: 0, 5.00, 10.0, 25.0, 50.0 μM; test 3: 0, 2.00, 4.00, 8.00, 15.0 μM) and a single dose at 6.00 μM with control. Flufenacet was assessed across three dose-response series spanning broader concentration ranges (test 1: 0, 0.10, 10.0, 100.0, 1000 μM; test 2: 0, 50.0, 100, 250, 500 nM; test 3: 0, 60.0, 120, 180, 240 nM) with two single doses at 60 nM and 90 nM with controls.
Wax extraction and analysis by GC-FID/MS
Freeze-dried shoot and root samples were immersed for 60 seconds in 10 mL of chloroform containing 10 mM of docosane (C22 alkane) and eicosanol (C20 primary fatty alcohol) as Internal Standards (IS) to extract surface lipids. Chloroform extracts were transferred to a clean glass tube and evaporated under nitrogen. Samples were derivatized in 100 µL of N,O-bis(trimethylsilyl)trifluoroacetamide): trimethylchlorosilane (99:1; BSTFA/TMS) at 85 °C for 1 hour. Surplus BSTFA-TMCS was evaporated under N2 gas, and the samples dissolved in 200 µL of hexane and transferred to a glass vial. Compounds are identified using a Mass Spectrometer (MS) and quantified using a flame-ionization detector (FID). 1 mL of silylated samples was analyzed by GC using a 30 m, 0.25-mm, 0.25 mm HP-1MS capillary column with helium as the carrier gas using the following method: spitless injection, inlet and detector temperatures were set at 325 °C, constant flow rate of 1.5 ml/min, the oven start temperature was set at 50 °C and held for 1 min then increased to 325 °C at a rate of 7 °C/min and the final temperature was held at 325 °C for 15 min. Quantification is based on flame ionization detector peak areas and an internal molecular standard. The total amount of cuticular wax is expressed per unit of fresh weight (FW).
Lipid extraction, fatty acid methyl ester, analysis by GC-FID
Lipids were extracted from an average of 39.4 mg of leaf or an average of 35.6 mg root material (for sample weights see relevant extraction data file). Glassware was used throughout the procedure. The samples and 1 ml of isopropanol were incubated at 75 °C for 20 minutes. Subsequently, 2 mL of chloroform/methanol (2:1) and 0.7 mL of water were added. After 30 seconds of vortexing, an additional 2 mL of chloroform/water (1:1) was added. The mixture was centrifuged for 3 minutes at 500 g, and the lower chloroform phase was gently transferred to a new tube. Lipids were extracted by adding 1 mL of chloroform to the first tube, repeating the centrifugation, and recovering the lower phase. Both extractions were combined. The chloroform was evaporated using N2 gas while keeping the sample in a 37°C block. Once all the solvent was evaporated, the lipids were resuspended in 200 μL of chloroform and stored at -80°C for subsequent fatty acid analysis.
Gas chromatographic (GC) analysis of fatty acid methyl esters was chosen to rapidly determine oil composition and abundance. The full process of fatty acid methyl ester (FAME) analysis consists of the hydrolysis of lipids, the transesterification of the released fatty acids, injection, separation, identification, and quantitation of the FAMEs. Lipids are extracted and directly esterified in the methylation mixture. FAMEs are identified by comparison of their retention times with those of individual purified standards and also by their absolute mass and fractionation pattern in GC coupled with mass-spectrometry. Relative retention times and equivalent chain-length values provide useful information for identification. FAMEs are then quantitated by peak area after correction using individual response factors. Absolute concentrations are determined by adding an internal standard e.g., C17:0 (carbons:desaturations).
FAMEs were analyzed by Gas Chromatography (GC) (Agilent 7890A, Agilent Technologies) using an Agilent J&W 122–2332 column (30 m × 250 µm × 0.25 µm, Agilent Technologies). Inlet and detector temperatures were set to 250 °C, and 1 µL of each sample was analyzed using a 15:1 split ratio injection and a constant flow rate of 1.5 mL/minute. The oven temperature cycle has a start temperature of 150 °C held for 2 minutes to allow vaporized samples and the solvent (hexane) to condense at the front of the column. The oven temperature was then increased to 240 °C at 10 °C/minute. The final temperature of 240 °C was held for one minute and 50 s, giving a total run time of 12 min and 50 s per sample. FAMEs were detected using a Flame Ionization Detector (FID). Chromatograms were analyzed using the offline session of the Agilent ChemStation software (Agilent Technologies, USA). The peak area of each FAME was normalized to the internal standard and further normalized to the weight of the initial sample. The retention time and identity of each peak were calibrated using the Supelco® 37 Component FAME Mix (certified reference material TraceCERT®, Sigma-Aldrich®).
Statistical analysis model
Student’s T-tests with a two-tailed distribution and two-sample homoscedastic variance were used to compare within a biotype between control and treated samples. Additionally, A two-way, fully balanced analysis of variance (ANOVA) was performed for each quantified lipid species in blackgrass shoots and roots, using GenStat 23rd edition. The experimental design consisted of two fixed factors: biotype (Peldon and Rothamsted) and treatment (control and herbicide), arranged in a 2 × 2 factorial structure for each herbicide (Tri-allate, EPTC, and FFT). Each FAMES and wax component were analyzed separately using a univariate ANOVA approach. The statistical model can be summarized as:
where Y is the concentration of a given lipid species.
Means, standard errors of the difference (SEDs), F statistics, and p-values were extracted for each main effect and their interaction. All lipid-by-herbicide combinations were reported individually. In the figures, P-values less than 0.05 (*) or 0.01 (**) are identified as statistically significant.
Results
Phenotypic characterization of biotype responses to pre-emergent herbicides
The three pre-emergent herbicides inhibited shoot and/or root growth of blackgrass to different extents (Figures 1, 2; Supplementary Figure 1; Supplementary Tables 1, 2). Flufenacet and tri-allate had distinct differences between the Rothamsted and Peldon biotypes (Figures 1, 2; Supplementary Figure 1). Flufenacet exhibited the highest efficacy, requiring nanomolar concentrations to inhibit growth (Figures 1E, F; Supplementary Figure 1). Complete inhibition occurred ≥1 μM flufenacet for Rothamsted and ≥10 μM flufenacet for Peldon (Supplementary Figure 1). Although VLCFA-inhibiting herbicides are described as shoot-growth-inhibiting herbicides (Jhala et al., 2024), flufenacet affected both shoot and root growth of blackgrass biotypes, although shoots were consistently more affected than roots at equivalent doses (Figures 1E, F; Supplementary Figure 1). At 90 nM flufenacet, Rothamsted shoots were 3-fold more sensitive than Peldon, and Rothamsted roots were 1.5-fold more sensitive than Peldon (Figures 1C, D, 2; Supplementary Figure 1). Tri-allate required micromolar concentrations to achieve comparable results in both biotypes (Figures 1C, D, 2; Supplementary Figure 1). Complete inhibition occurred ≥25 μM tri-allate for Rothamsted and ≥50 μM tri-allate for Peldon (Supplementary Figure 1). At 6 μM tri-allate, Rothamsted shoots were 1.6-fold more sensitive than Peldon shoots (Figure 2). EPTC displayed intermediate efficacy, acting in the low micromolar range, with no additional inhibition above 5 μM for either biotype (Figures 1A, B, 2; Supplementary Figure 1). Unlike the flufenacet and tri-allate, over a range of doses the two blackgrass biotypes exhibited similar sensitivity to EPTC (Figures 1A, B, 2; Supplementary Figure 1). Opposite to tri-allate or flufenacet, Rothamsted shoots were 1.3-fold less sensitive to EPTC than Peldon at 600nM EPTC (Figure 2). As observed with tri-allate, EPTC inhibited shoot growth more strongly than root growth (Figures 1A, B; Supplementary Figure 1). These differences in herbicide efficiency are consistent with reported field use (Lainsbury, 2024).
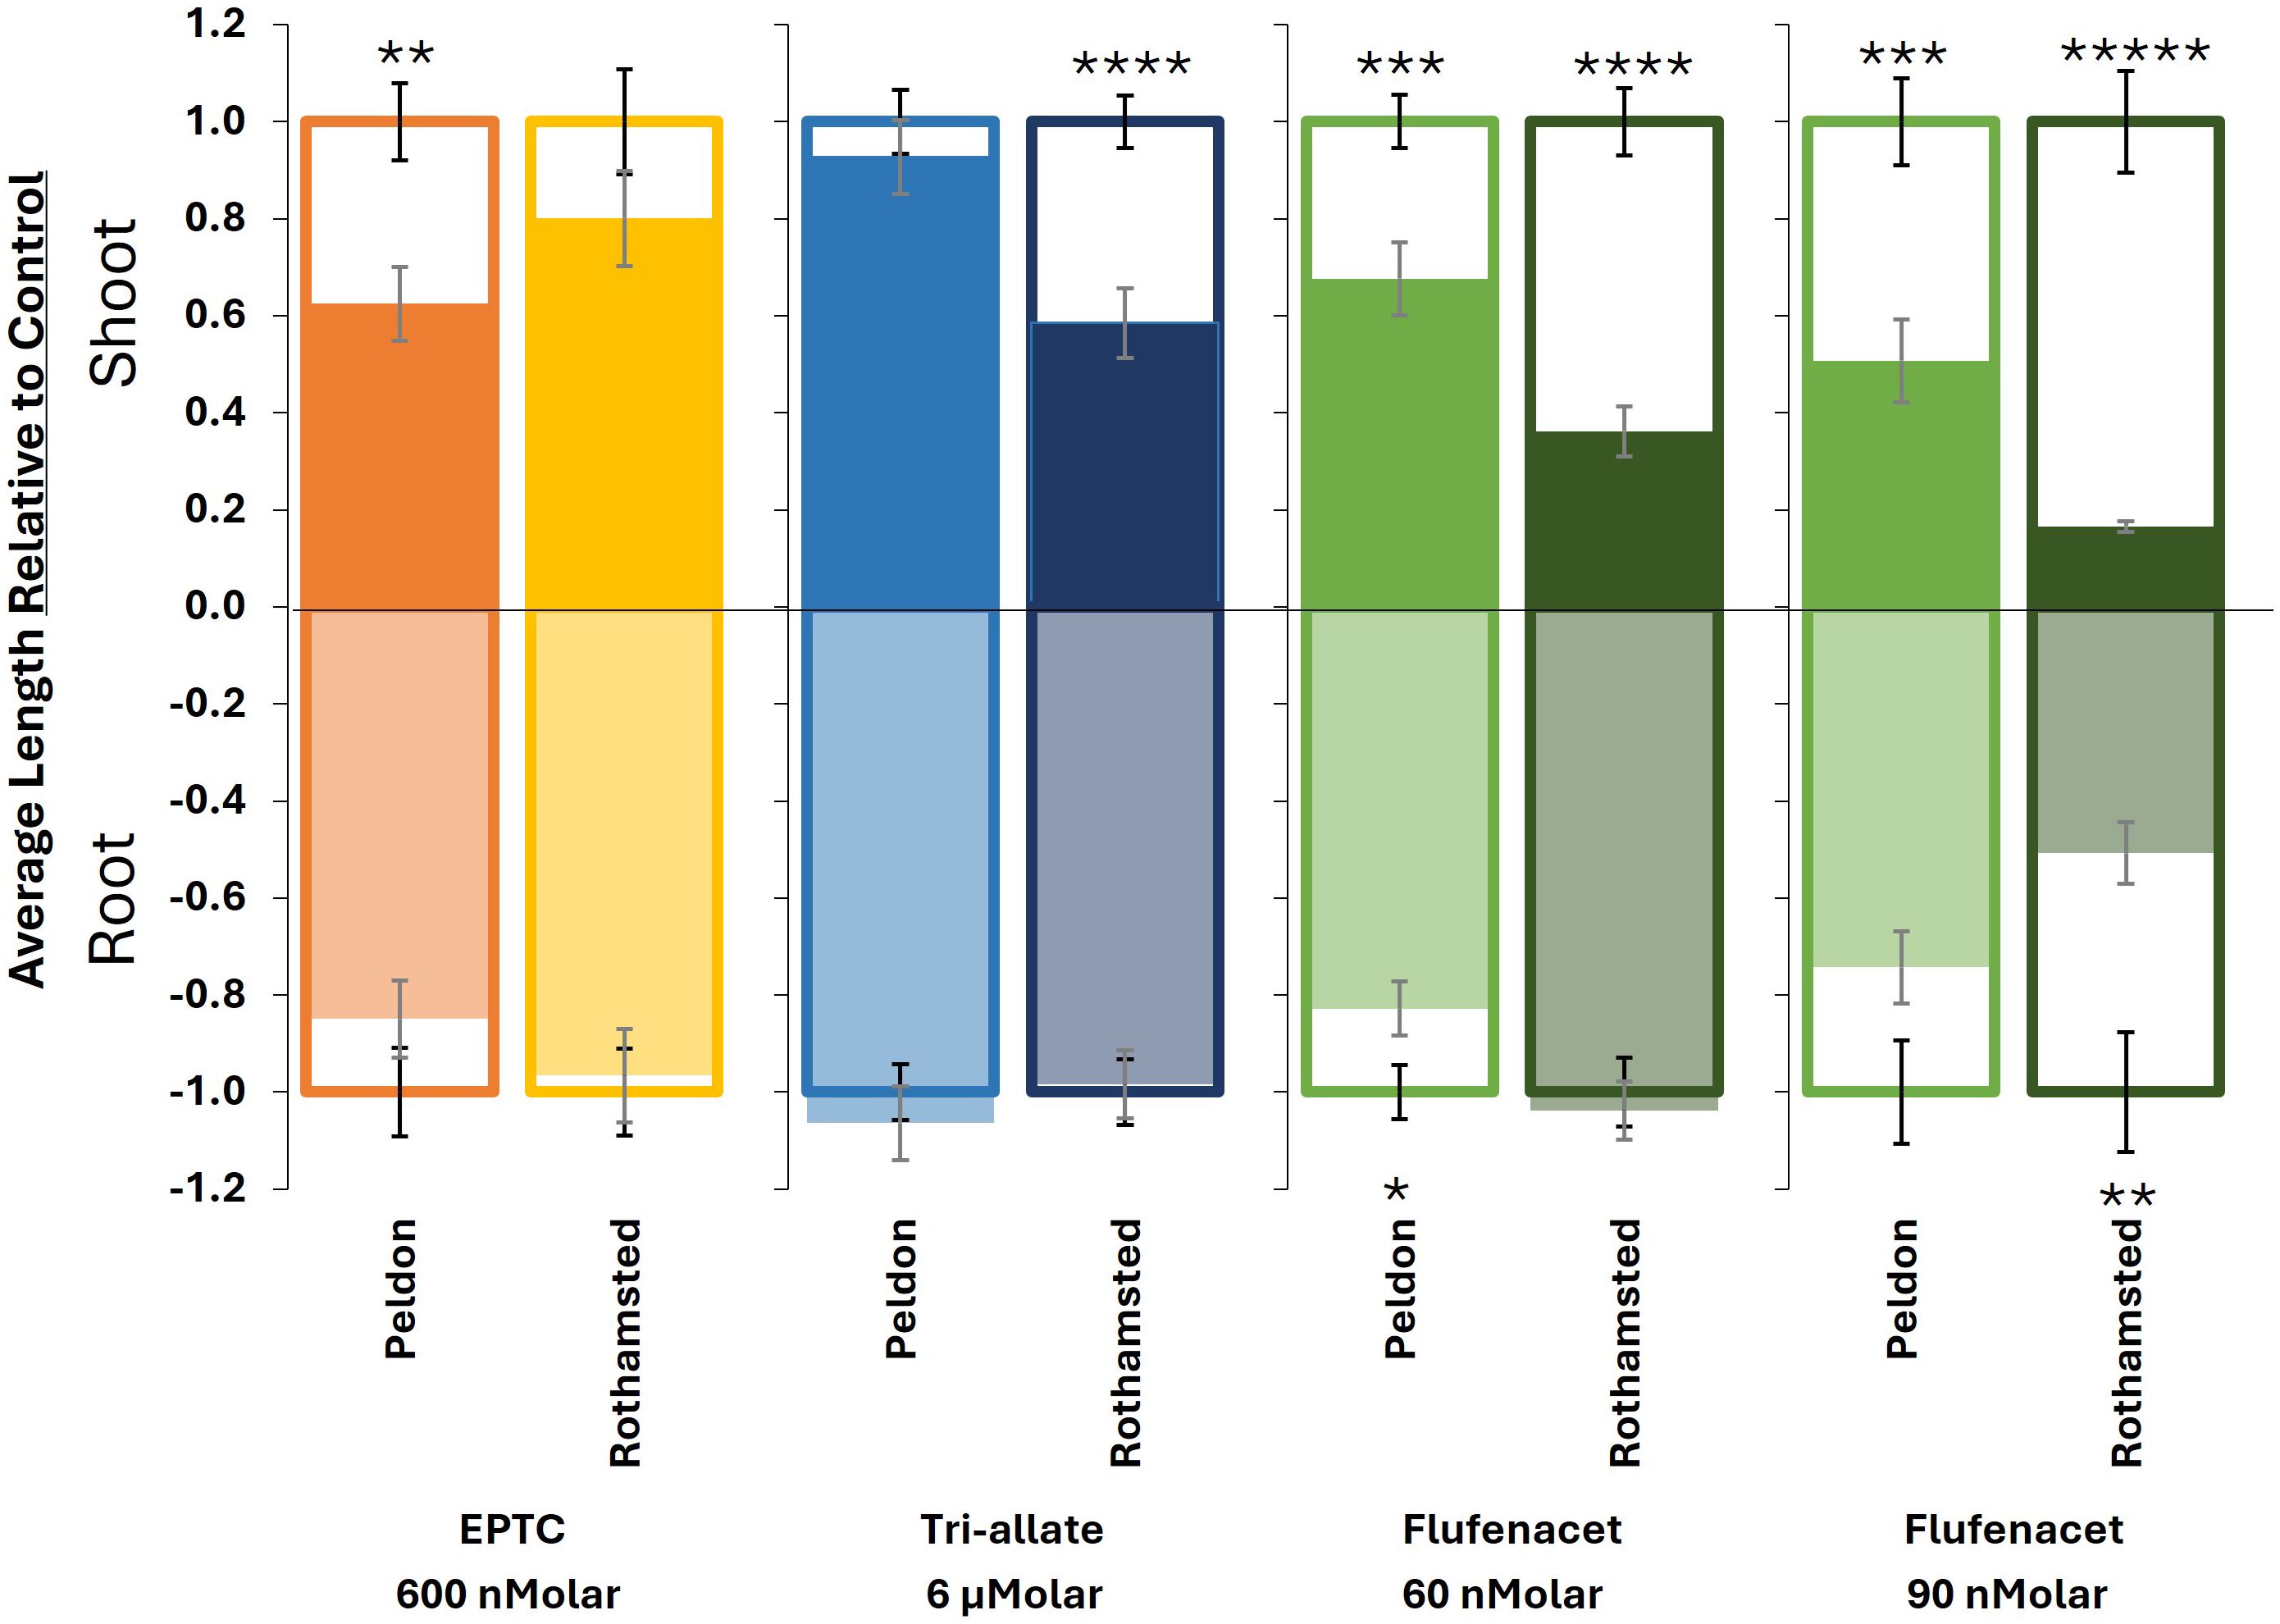
Figure 2. Bar plots of the average length of shoots (up) and roots (down) relative to the untreated controls for each Blackgrass biotype and herbicide single-dose treatment. The outlines represent the control, while the fill represents the response to herbicide treatment at the selected respective dose: EPTC (600 nMolar), tri-allate (6 μM) and flufenacet (60 nM and 90 nMolar). Where the fill (herbicide) extends past the outline (control), the herbicide-treated samples are larger than the control. Error bars represent standard error. Significance codes results of paired t-tests comparing control to the herbicide-treated samples of the same biotype, *P ≤ 0.05, **P ≤ 0.01, ***P ≤ 0.001, ****P ≤ 0.0001, *****P ≤ 0.00001.
The dose used for further biochemical analysis was based on the ED40 for the most sensitive blackgrass biotype (Figure 1; Supplementary Figure 1). For EPTC and tri-allate, shoot growth was a more sensitive indicator of herbicide effects. For flufenacet, which also affected root growth, an additional “root” ED40 was determined. The estimated ED40 values were 60 nM for flufenacet (based on Rothamsted shoot responses), 90 nM for flufenacet (based on Rothamsted root responses), 600 nM for EPTC (based on Peldon shoot responses), and 6 μM for tri-allate (based on Rothamsted shoot responses) (Figure 2).
Analysis of differences in total waxes with or without pre-emergent herbicides
In the closed, sterile, agar-based experimental conditions, the average leaf surface wax load was 15.6 ng/mg for Peldon and 16.6 ng/mg for Rothamsted (based on values for control treatments in Table 1). The leaf cuticular wax composition of blackgrass was unusual, consisting of approximately 91% very long chain fatty alcohols (VLC-FAOH), 5.8% fatty aldehyde and 3.5% alkanes (Table 1, average of controls). Hexacosanol (C26:0 FAOH) represents about 84% of total leaf wax (Figure 3; Supplementary Table 3). Only one molecular species of fatty aldehyde, hexacosanal (C26), was detected, and alkanes ranged from C27 to C35 (Table 1; Figure 3); although detected, values for C27 and C31 were close to the level of detection; therefore, they are not reported herein.
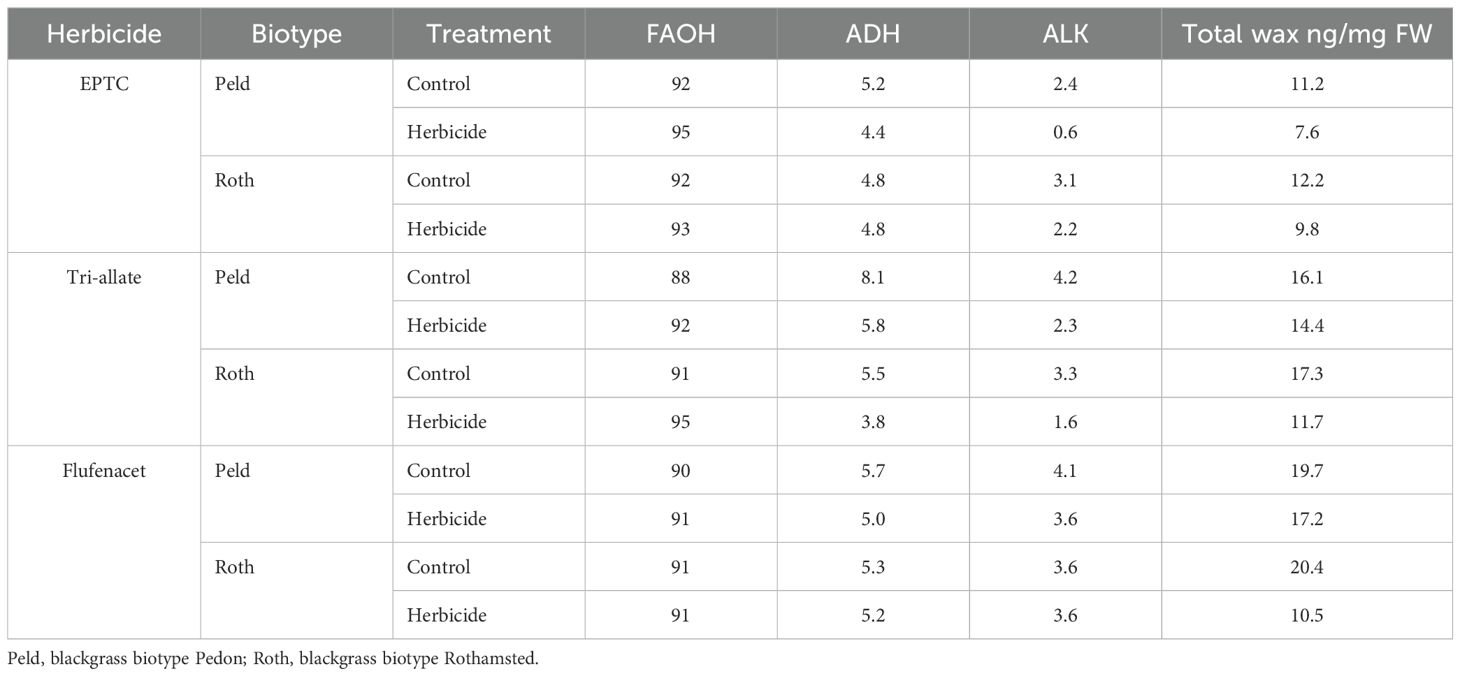
Table 1. Percentage mass composition of fatty alcohols (FAOH), aldehydes (ADH), and alkanes (ALK) in the total shoot wax content of two blackgrass biotypes.
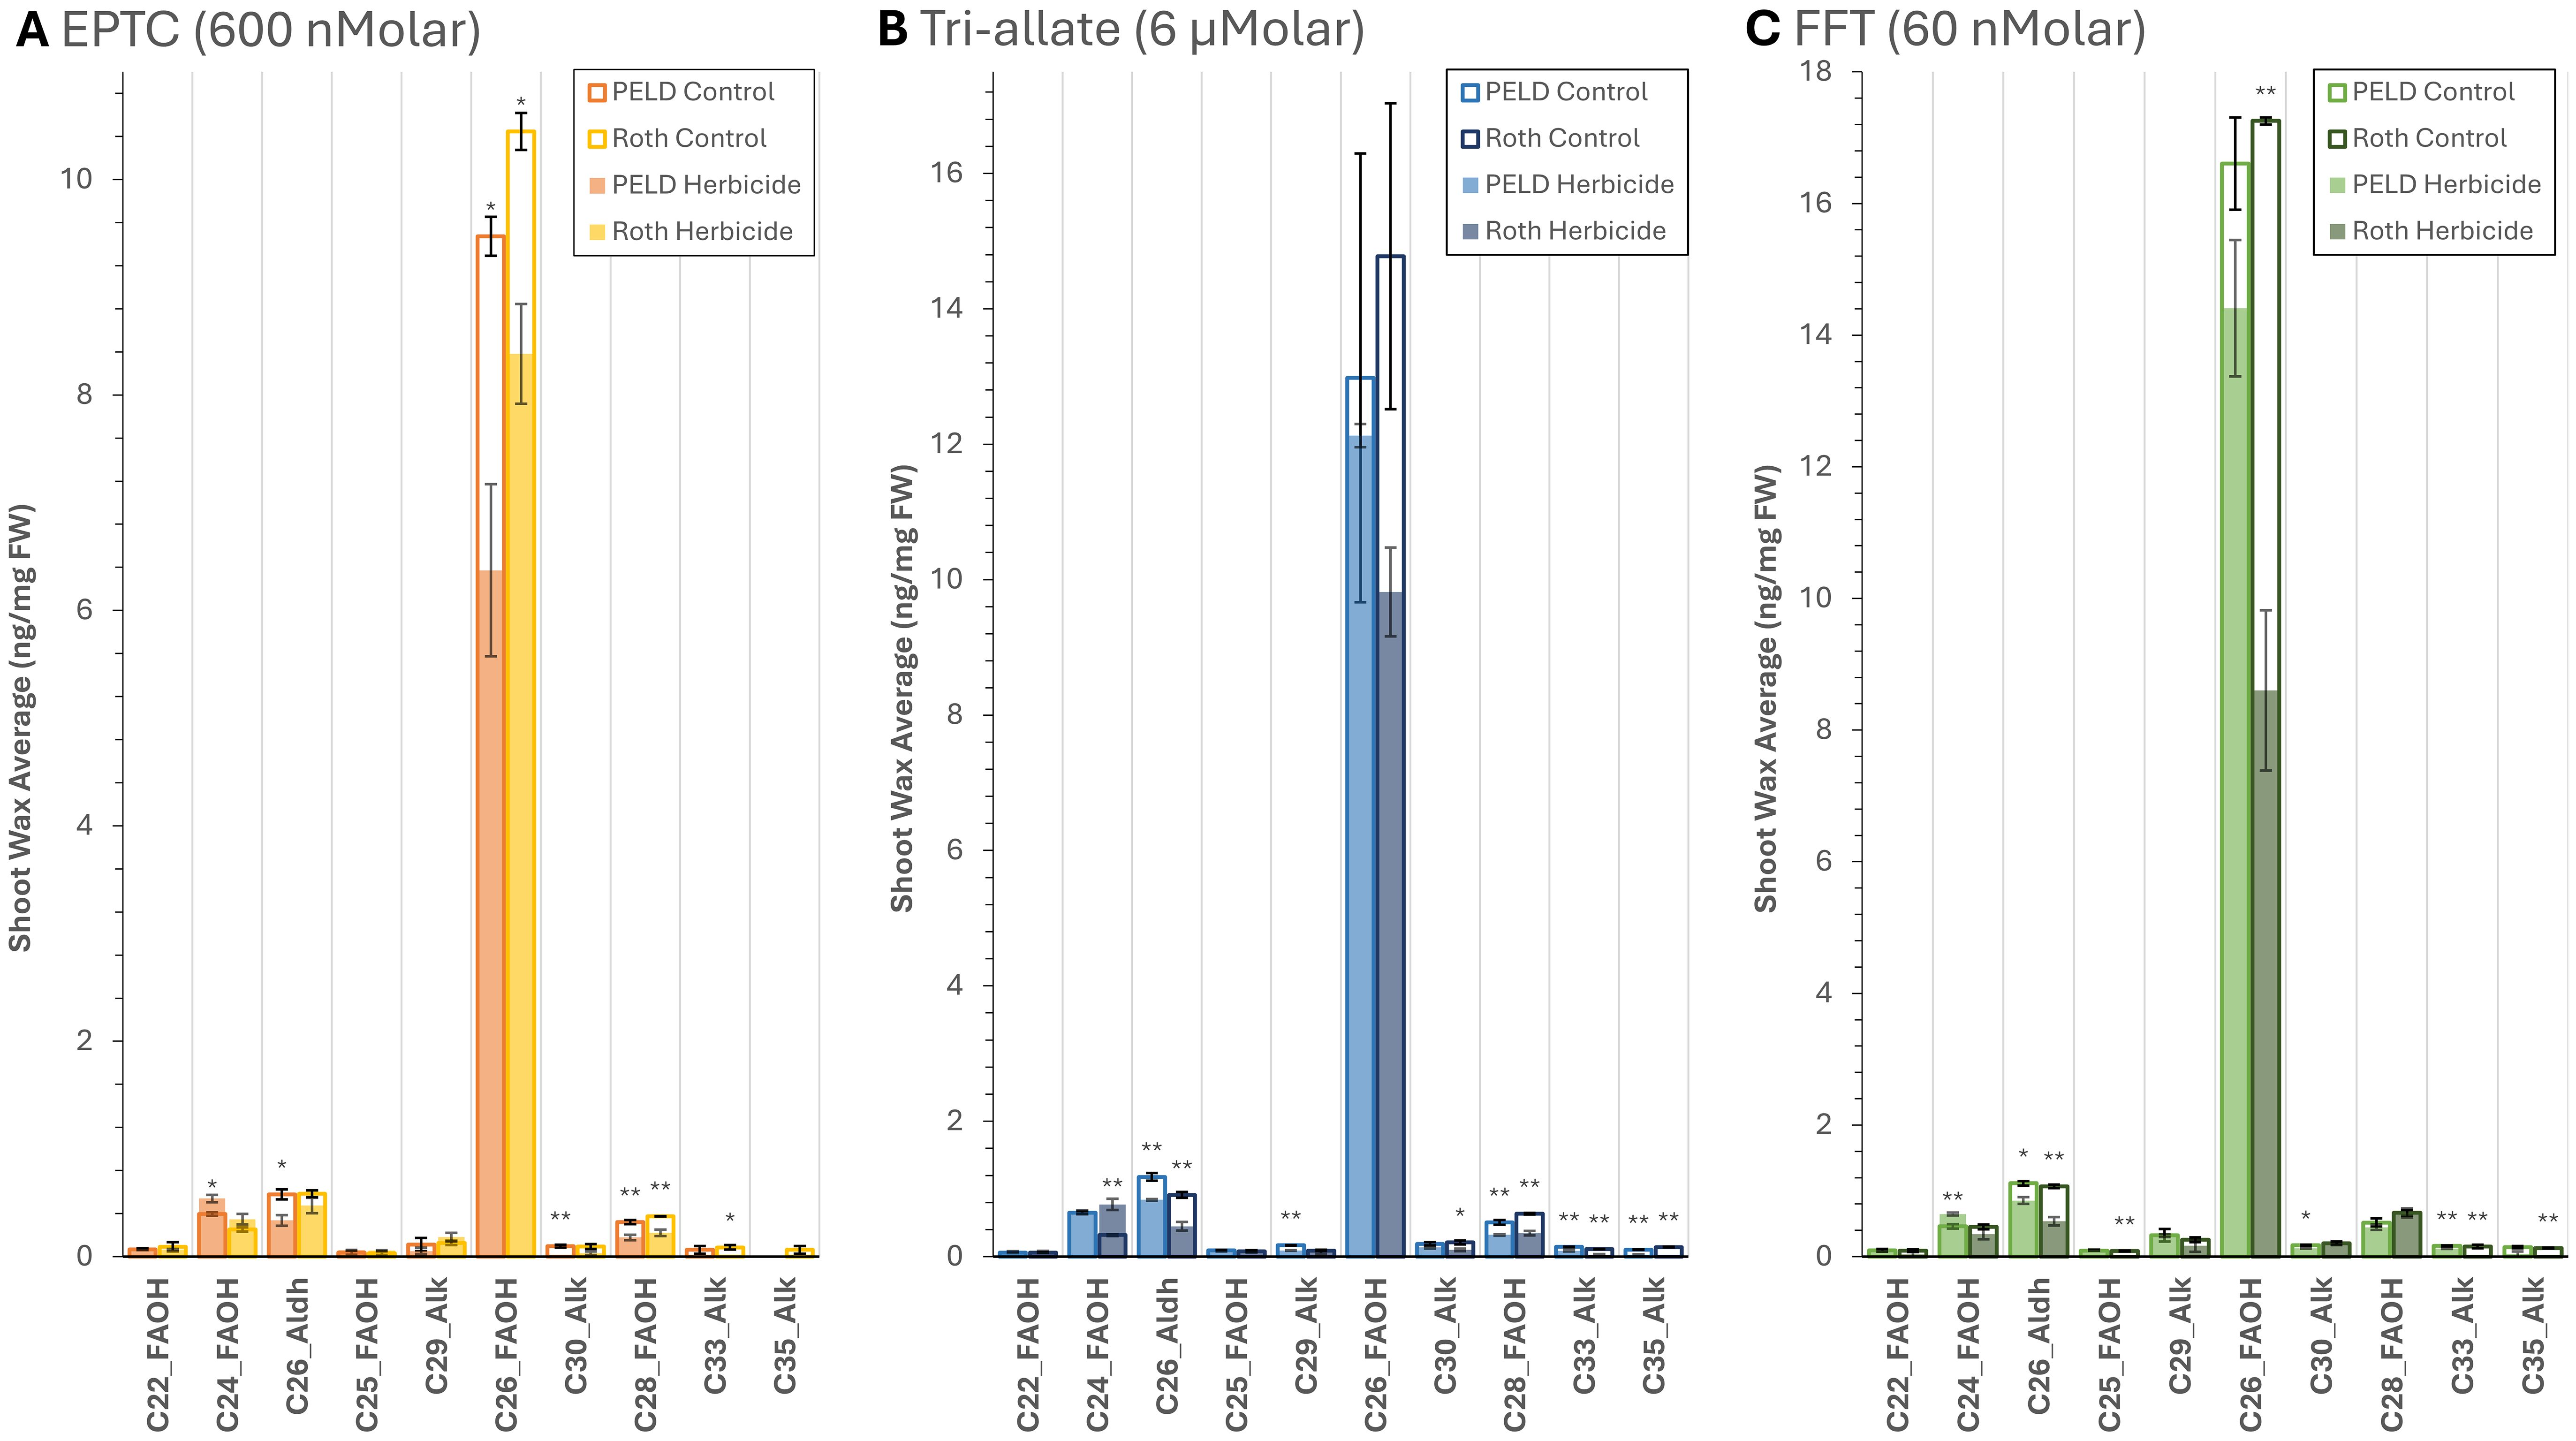
Figure 3. Rothamsted and Peldon shoot wax average composition ng/mg FW sample with and without herbicide treatment with (A) EPTC, (B) Tri-allate and (C) flufenacet (FFT). Analysis of data generated through GC-FID. The outlines represent the control, while the fill represents the response to herbicide treatment, n=3. *P ≤ 0.05 and **P ≤ 0.01 by Student’s T-tests with a two-tailed distribution and two-sample homoscedastic variance. Peld, blackgrass biotype Pedon; Roth, blackgrass biotype Rothamsted.
Application of any of the three herbicides decreased the total surface wax amount in both biotypes (Table 1; Figure 3; Supplementary Table 3) as supported by Student’s T-tests (annotated by “*” in Figure 3) and ANOVA analyses (Supplementary Table 4). However, the different Group 15 herbicides affected surface wax composition differently (Table 1; Figure 3; Supplementary Tables 3,4). Each wax species was quantified using a C22 Alkane as an internal standard. Consistent with the morphological data in Figure 2, the change in Rothamsted’s surface wax load in response to EPTC was less than that of Peldon, with a 19.7% vs. 31.7% reduction in total surface wax, respectively (Table 1). Also matching the morphological effects, the opposite was observed with flufenacet and tri-allate. Flufenacet and tri-allate reduced surface wax load in Rothamsted by 48.3% and 32.4% respectively, but only by 12.9% and 10.2% in Peldon, respectively (Table 1). Similar differences were seen for all molecular species of surface waxes (Figure 3). Supplementary Figure 2 highlights the lower-abundance species. Flufenacet did not affect the proportion of total fatty alcohols, aldehydes, and alkanes in Rothamsted or Peldon. In contrast, the proportion of aldehyde and alkane were decreased in Peldon after treatment with EPTC and in both biotypes after treatment with Tri-allate (Table 1). All three herbicides affected wax molecular species with carbon chain lengths of 26 or longer, while having little effect on C22 and C24 compounds (Figure 3).
Analysis of differences in FAMES with or without pre-emergent herbicides
Fatty acid contents from both shoot and root tissues were quantified accurately using pentadecanoic acid (C15:0) as an internal standard and response factors calculated for each individual fatty acid using the 37 FAMEs standard (SUPELCO). The resulting data reflected a fatty acid composition characteristic of photosynthetic and non-photosynthetic tissues from shoot and root tissues, respectively (Figure 4; Supplementary Figure 3,Supplementary Tables 5-8). In green leaf tissue, the profile is dominated by α-linolenic acid (C18:3Δ9,12,15 n3; ca. 61%), followed by linoleic acid (C18:2Δ9,12 n6; ca. 19%) and palmitic acid (C16:0; ca. 11%) (Figure 4; Supplementary Tables 5,6, control). In root tissue, linoleic acid (C18:2Δ9,12 n6; ca. 41%) is the dominant fatty acid, followed by α-linoleic acid (C18:3Δ9,12,15 n3; ca. 22%) and palmitic acid (C16:0; ca. 21%) (Table 2; Supplementary Tables 7, 8, controls). Fatty acids with chain lengths ranging from 20 to 26 carbons were detected by GC-FID, but the combined proportion of these is only 5% of the total fatty acids measured in shoots (Figure 4; Supplementary Table 6, controls). C20-C26 fatty acids were slightly more abundant in root tissue (7-9%) because they are incorporated in the suberin polymer found in the endodermis (Casparian strip) and periderm (Figure 4; Supplementary Table 8, controls).
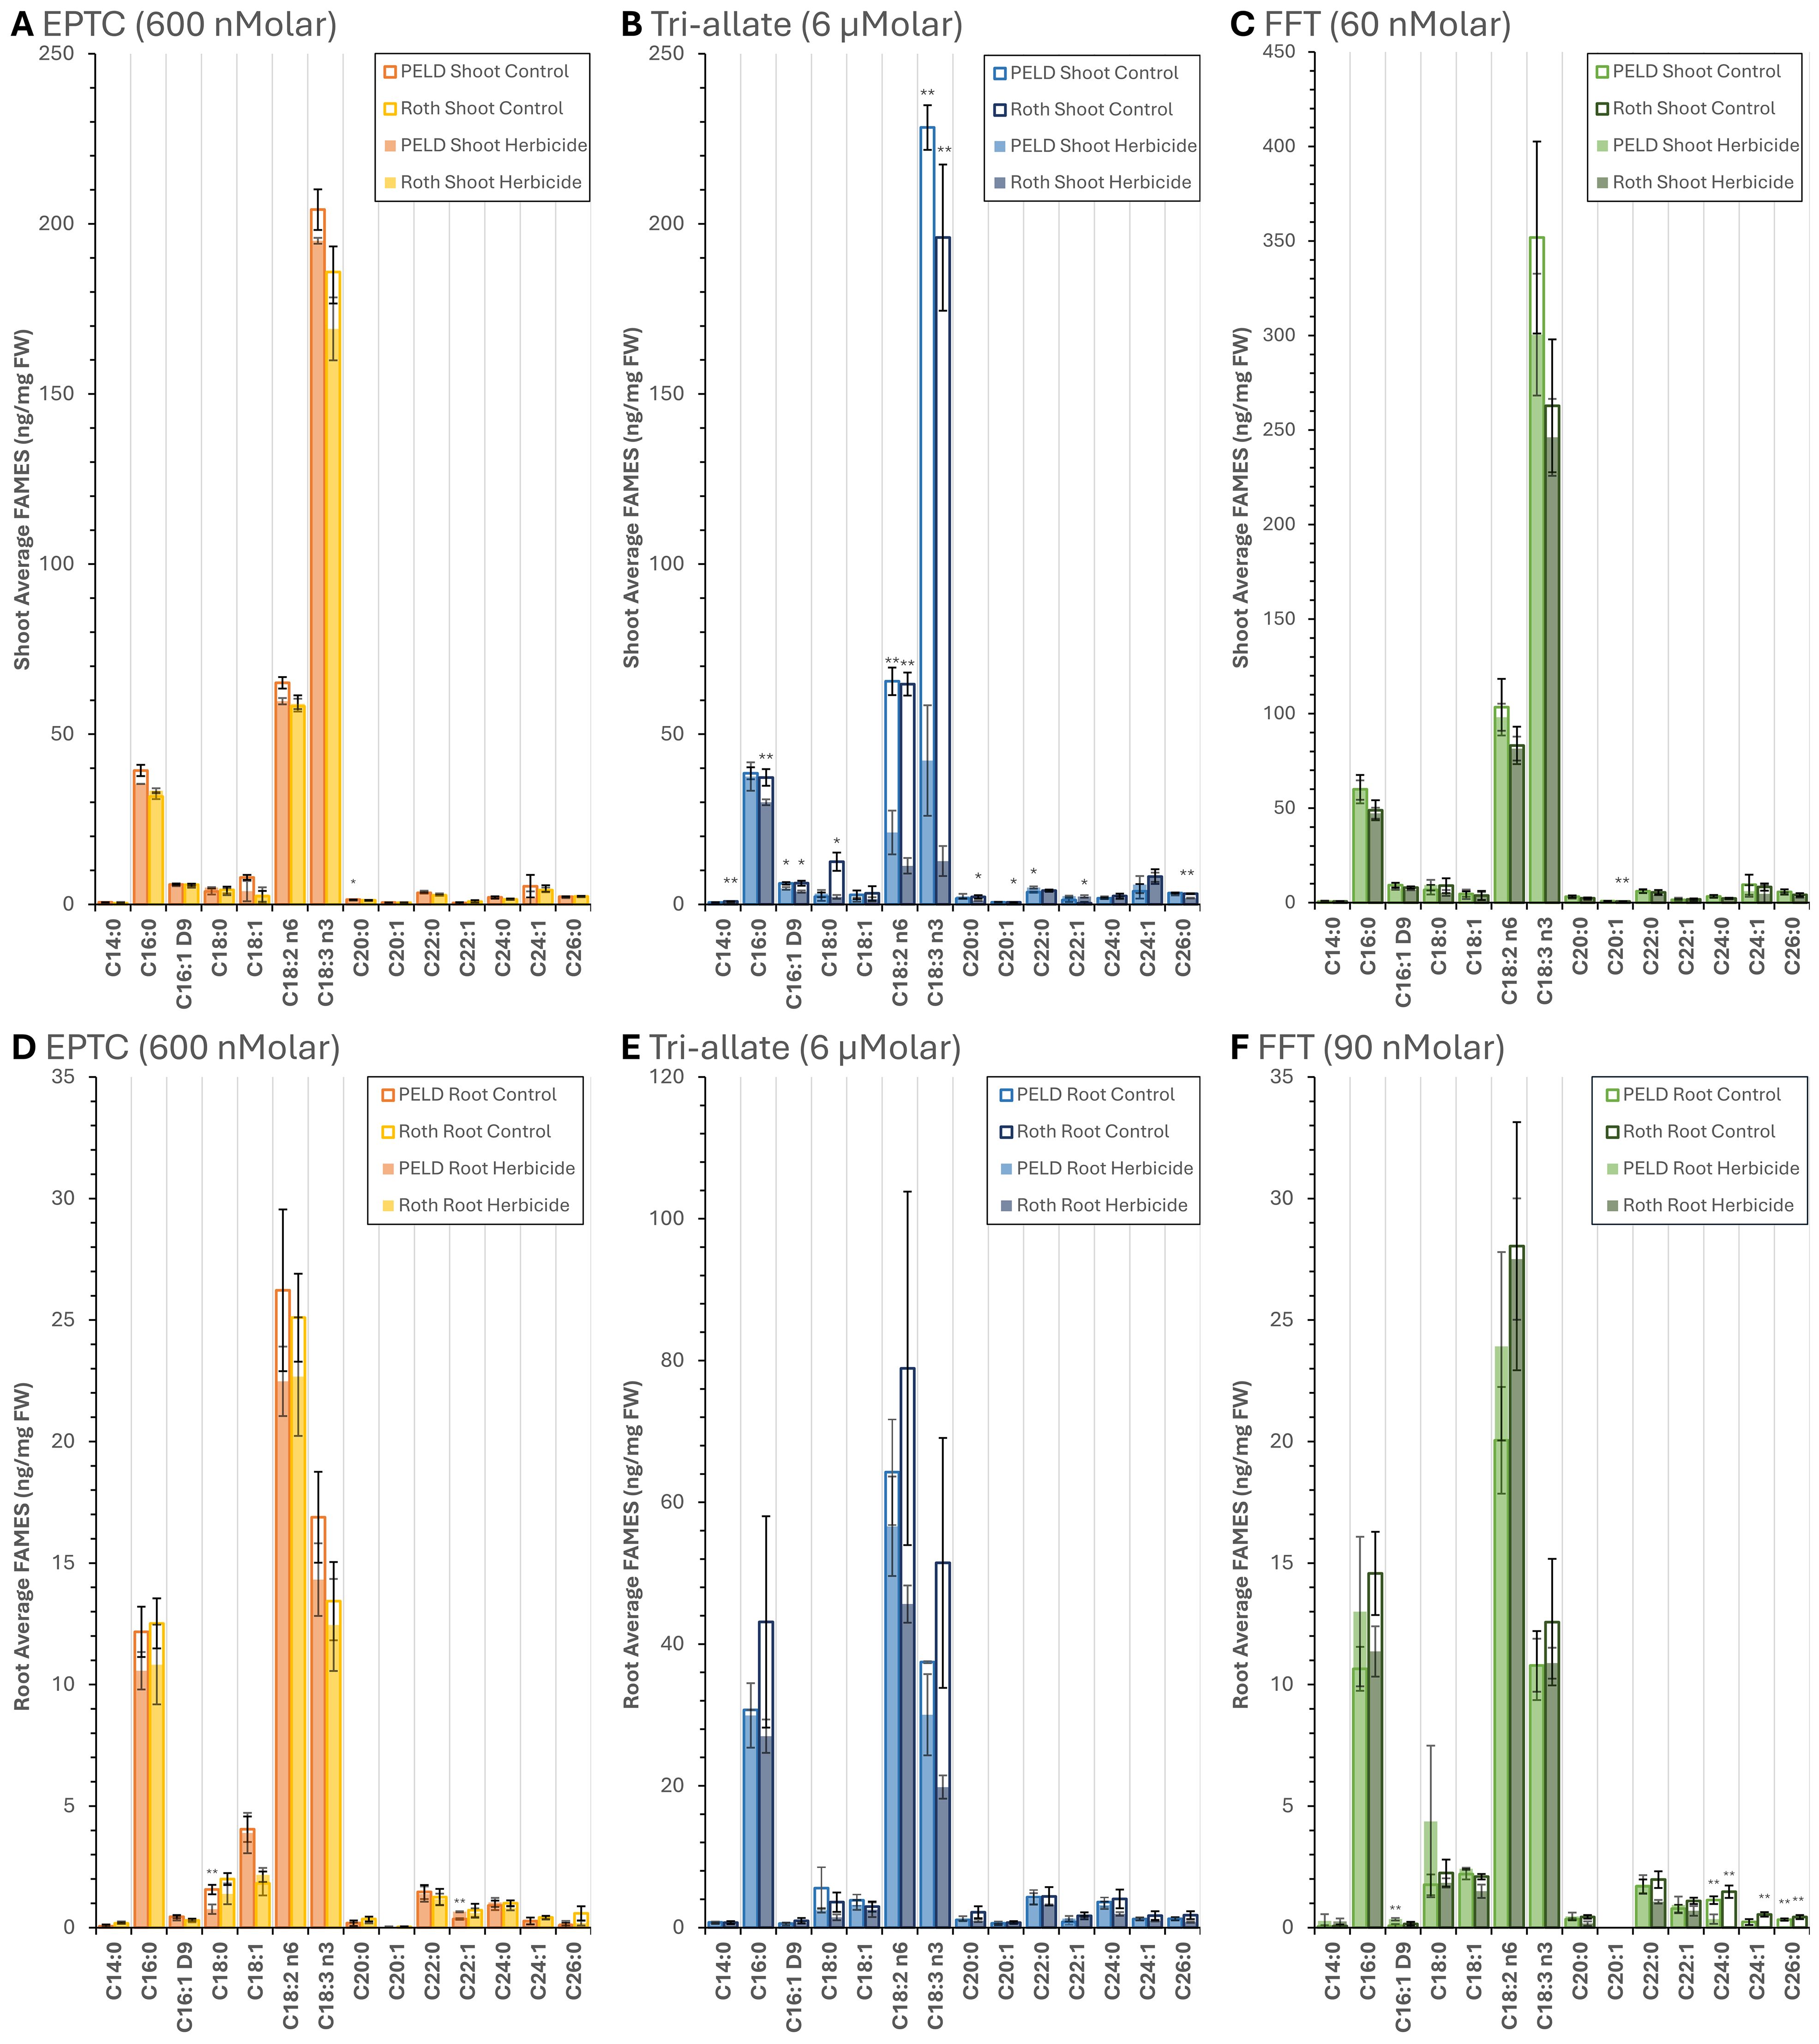
Figure 4. Quantified differential accumulation of fames in blackgrass shoot and root following herbicide treatment (A-D) EPTC, (B-E) Tri-allate, and (C-F) flufenacet (FFT). Analyzed using GC-FID. Control samples not treated with herbicide are included for baseline comparison. Each data point represents the mean of three biological replicates, except for in (A) Peldon Herbicide treated and (E) Tri-allate Control, where n=2, with error bars indicating a standard error. *P ≤ 0.05 and **P ≤ 0.01 by Student’s T-tests with a two-tailed distribution and two-sample homoscedastic variance. Peld, blackgrass biotype Pedon; Roth, blackgrass biotype Rothamsted.
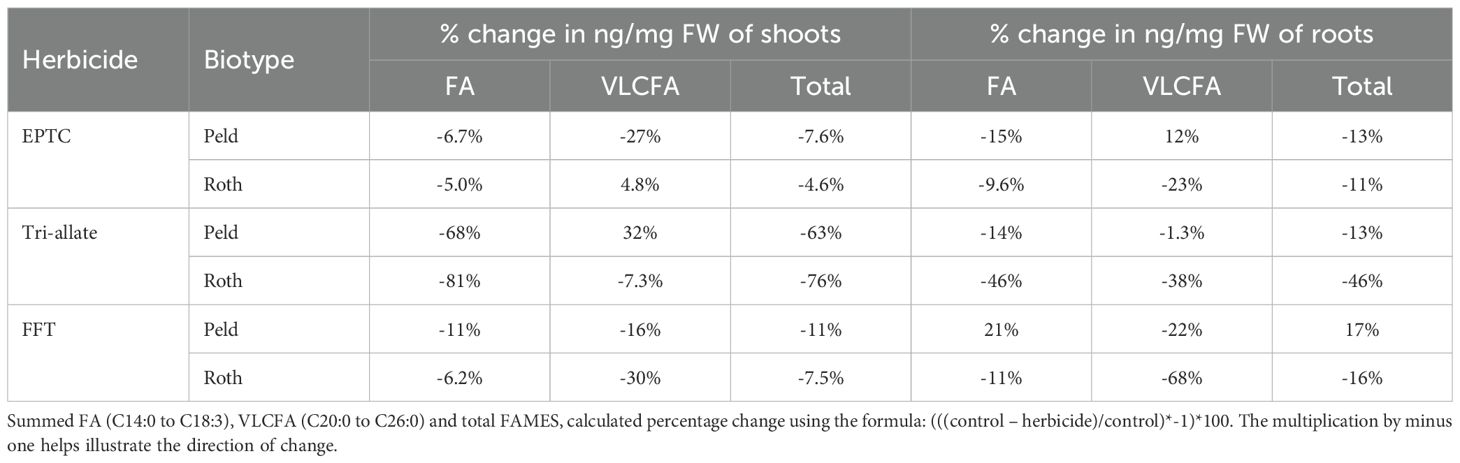
Table 2. Percentage change in FAMES split into FA and VLCFA ng/mg FW.
Tri-allate produced the largest and most consistent changes in fatty acid composition. In the FAMES analysis, tri-allate reduced total fatty acids in shoots by 63% (Peldon) and 76% (Rothamsted) (Table 2). The most significant changes were in the C18 polyunsaturated fatty acids linoleic (C18:2Δ9,12 n6) and α-linolenic (C18:3Δ9,12,15 n3) which were reduced by 68–94% across biotypes (Figure 4; Supplementary Tables 5,6). Treatment with tri-allate also significantly decreased palmitoleic acid (C16:1Δ9), palmitic acid (C16:0), and myristic acid (C14:0) in Rothamsted shoots by 39%, 20%, and 58% respectively (Figure 4; Supplementary Figure 3; Supplementary Tables 5, 6). In roots, tri-allate produced smaller but measurable decreases in total FAs (-13% in Peldon; -46% in Rothamsted) and only minor changes in VLCFAs in Peldon (-1%) but strong changes in Rothamsted (-38%) (Table 2; Supplementary Tables 7, 8). By contrast, EPTC had far smaller effects on C14–C22 species which was not statistically significant in most comparisons (Figure 4; Supplementary Figure 3; Supplementary Tables 5-8). For all species measured by FAMES, EPTC led to moderate percent changes with total changes of -7.6% and -13% in Peldon shoots and roots respectively and -4.6% and -11% in Rothamsted shoots and roots respectively (Table 2). The saturated and monounsaturated VLCFAs were decreased in Rothamsted by flufenacet treatment; shoots by -30% and roots by -68% (Table 2) with species of chain lengths of C24 or longer (C24+) significantly reduced in roots (Figure 4; Supplementary Table 7). Therefore marked differences were observed between biotypes and herbicides with regard to VLCFA content and composition.
Discussion
Our analyses of shoot and root growth in response to herbicide treatment suggest that these three pre-emergent herbicides alter root and/or shoot growth differently. The amount of active ingredient required to elicit growth inhibition differed between the herbicides; flufenacet required the lowest doses, tri-allate the highest doses, while EPTC displayed intermediate efficacy (Figure 1). Although this result aligns with field rate recommendations (Lainsbury, 2024), direct comparisons between field rates are difficult because EPTC has a much broader spectrum of activity compared to flufenacet or tri-allate. At the doses selected in this study, tri-allate and EPTC affect only shoot growth, whereas flufenacet inhibits both root and shoot growth (Figure 1). The shoot-root differences we observed could reflect differences in where in the plant the herbicides act or how they interact with the different metabolic dependencies in these tissues. For example, sugar sources for glycolysis differ between shoots and roots, and malate import can provide an additional source of pyruvate and NADPH to support fatty acid synthesis in roots and leucoplasts, the non-photosynthetic plastids in roots and other non-photosynthetic tissues. This process is mediated by the enzyme malic enzyme (ME), which catalyzes the conversion of malate to pyruvate (Sun et al., 2019; Smith et al., 1992). As expected for Group 15 herbicides, these herbicides reduced total leaf wax content (Figure 3). However, these three Group 15 pre-emergent herbicides gave distinct metabolic outcomes (Figure 4). Of note, although there was little effect on root growth, tri-allate caused a decrease in total fatty acid content, particularly the polyunsaturated fatty acids in shoots and roots. This phenotype was not observed with EPTC or flufenacet. As our data indicated that each herbicide differentially affects shoot and/or length and lipid metabolism, and that the two different blackgrass biotypes respond differently to a given treatment, these data support the conclusion by Beffa et al. (2024) that these Group 15 herbicides may operate through different MoAs and that different biotypes have evolved different responses to them.
We observed that without herbicide application, the leaf wax composition of blackgrass (Figure 3; Supplementary Figure 2,Supplementary Table 3) is somewhat unusual compared to most plants analyzed to date, including Arabidopsis or mono- and dicotyledonous crops (Lee and Suh, 2015). Blackgrass is in the BOP clade of Poaceae, along with rice, oat, wheat, and barley. Plants in this clade generally have leaf wax that contains significant proportions of fatty alcohols and large amounts of diketone and hydroxydiketone compounds; surprisingly, these were not detected in blackgrass shoots in this study. Blackgrass’s leaf wax composition was more similar to Taiwan oil millet, where the predominant wax component is a C28 primary alcohol in the leaf blade and a C28-free fatty acid in the leaf sheath (Anggarani et al., 2024).
The three herbicides tested in this study all had a quantitative effect on surface wax load (Figure 3; Supplementary Table 3), but only the two thiocarbamates had a qualitative effect on the ratio between the three main molecular species of waxes (Table 1). This is consistent with other reports in the literature (Gronwald, 1991). Tri-allate and EPTC, but not flufenacet, increased the proportion of fatty alcohols and decreased the proportions of alkanes and aldehydes (Figure 3, Table 1). This is interesting, as aldehydes and alkanes are formed via the decarbonylation (alkane) pathway, whereas fatty alcohols are synthesized via the reducing (alcohol) pathway. While C22 and C24 compounds were not greatly affected by these herbicides, surface wax molecular species with carbon chain lengths of 26 or more were altered (Figure 3). These data suggest that an elongation system that is insensitive to thiocarbamate may be responsible for synthesizing waxes with up to 24 carbons when the KCS-mediated fatty acid elongation pathway is altered.
We used two well-characterized populations herein: a herbicide-sensitive biotype used here (“Rothamsted”) that originates from the Broadbalk long-term field experiment (Moss et al., 2004) and represents a population which has never been exposed to herbicide selection and remains sensitive to all herbicides tested against it and a population of Peldon that does not contain any known target site mutations but has been well-characterized for exhibiting strong NTSR-mediated resistance to multiple herbicides across different groups and MoAs (Moss, 1990; Mellado-Sánchez et al., 2020). Our data show Rothamsted and Peldon seeds respond differently to a given treatment. For shoot and root lengths (Figures 1, 2), Rothamsted had greater sensitivity than Peldon at all doses of flufenacet and tri-allate, as expected, while Rothamsted was similar to or even less sensitive than Peldon to a given dose of EPTC. These changes in root and shoot length were matched by smaller changes in wax and VLCFA composition in EPTC-treated Rothamsted than Peldon (Figures 3, 4).
Flufenacet treatment decreased saturated and monounsaturated VLCFAs in Rothamsted, and this effect was greater in the roots than in the shoots (Figure 4). In Peldon, this reduction in VLCFA content was also generally observed in shoots and roots, but only species with chain lengths of C24 or longer (C24+) are significantly affected (Supplementary Figures 3C, F). These Rothamsted data are consistent with previous data where flufenacet inhibits the activity of all tested Arabidopsis VLCFA elongases in (Trenkamp et al., 2004) whereas the Peldon data suggest it exhibits partial resistance, allowing the formation of VLCFAs up to C22 in both shoots and roots. This could be due to an adaptation in Peldon involving a KCS like KCS1 or KCS18 that produces mainly C20 and C22 VLCFAs (Batsale et al, 2023).
Tri-allate affected the length of and the VLCFA content in the shoots (Figures 1, 2, 4). It also affected VLCFA content in Rothamsted roots without significantly altering root length (Supplementary Figures 3B-E). The decrease of C26 in both Rothamsted and Peldon shoots (Supplementary Figure 3B) is consistent with the observed decrease in C26+ wax species (Figure 3). The most noticeable and unexpected effect of tri-allate on fatty acid content and composition in both biotypes was the dramatic reduction in C18 unsaturated FAs. This initially suggested that tri-allate affects fatty acid desaturation and is consistent with previous data showing tri-allate significantly reduced fatty acid fractions (C>18) in sensitive wild oat plants (Kern et al., 1997) where tri-allate resistance was likely due to two independently segregating recessive genes (Kern et al., 2002). Treatment of blackgrass with tri-allate also decreased Palmitoleic acid (PO, C16:1Δ9) content and OA, which could also suggest that tri-allate influences the plastid-located steroyl-CoA delta-9 desaturase (SAD). Analysis of palmitic acid (PA, C16:0) and stearic acid (SA, C18:0) indicated a differential effect in the two biotypes tested. In Peldon, the content of these two saturated fatty acids is not greatly affected by tri-allate treatment in either shoots or roots (Figure 4). In Rothamsted, PA and SA content are reduced in both shoots and roots (Figure 4), suggesting the inhibition of fatty acid synthesis upstream in the prokaryotic part of the biosynthetic pathway. This would explain the greater reduction in total fatty acid content observed in this ecotype in both shoots and roots after tri-allate treatment (Figure 4). In Rothamsted, this reduction in C16 and C18 saturated FAs, as well as the general reduction in total FAs in both the shoots and the roots, indicate that tri-allate may interfere with enzymes upstream of C16:0-ACP formation, by acting on either the plastid-located FAS complex and/or enzymes upstream in the pathway. In Peldon treated with tri-allate, the FAMEs profiles show decreased C18:1 content, impacting the profiles of all desaturated C18 FAs in shoot and root tissue (Figure 4). The differential effects of tri-allate on VLCFA profiles between both biotypes in shoot and root tissues are interesting but more difficult to explain.
Our physiological data indicated EPTC’s effects on Rothamsted were similar to, or even less than, those on Peldon (Figures 1A, B; Supplementary Figures 1A, B, G, H). These differences were correlated with differential changes in wax and VLCFA composition between the biotypes, with the amount of change in Rothamsted being less than in Peldon (Figures 3, 4), and the minor decreases in VLCFAs in shoots were more pronounced in Peldon than in Rothamsted (Figures 4A, D). Our data are consistent with multiple studies that conclude S-ethyl dipropylthiocarbamate (EPTC) inhibits wax deposition and cuticle formation by affecting the conversion of fatty acids into hydrocarbons and the elongation process Gronwald (1991) (Blackshaw et al., 1996). Collectively, these data are consistent with the conclusion that these two herbicides work through different mechanisms and strengthen previous conclusions that herbicide resistance is both biotype and MoA specific (Hamidzadeh Moghadam et al., 2021; Hamidzadeh Moghadam et al., 2023; Cai et al., 2023). However, because at the dose used in this study, EPTC had such a small effect on VLCFA content in shoots and no effect on the root (Figures 4A, D, Table 2), further investigation using additional herbicide doses are needed to pinpoint where in the pathway EPTC is targeting and how targeting might differ between biotypes.
Altogether, our findings show that Group 15 herbicides exert distinct, biotype- and organ-specific effects on blackgrass shoot length and lipid metabolism, underscoring the complexity of their modes of action. The present work establishes a biochemical baseline linking herbicide treatment to lipid profile modulation in blackgrass, providing a foundation for future mechanistic exploration. To fully elucidate the mechanisms underlying herbicide selectivity and resistance, future metabolic pathway mapping work is required to validate the molecular target(s), of these and other Group 15 herbicides.
Data availability statement
The original contributions presented in the study are included in the article/Supplementary Material. Further inquiries can be directed to the corresponding author.
Author contributions
HB: Conceptualization, Formal analysis, Investigation, Methodology, Resources, Validation, Writing – original draft, Writing – review & editing. LC: Conceptualization, Funding acquisition, Investigation, Writing – review & editing. BH: Conceptualization, Resources, Writing – review & editing. RH: Resources, Writing – review & editing. FB: Conceptualization, Data curation, Formal analysis, Investigation, Methodology, Resources, Validation, Writing – original draft, Writing – review & editing, Supervision. DM: Conceptualization, Formal analysis, Funding acquisition, Investigation, Methodology, Project administration, Supervision, Validation, Writing – original draft, Writing – review & editing, Resources.
Funding
The author(s) declare that financial support was received for the research and/or publication of this article. Rothamsted Research receives strategic funding from the Biotechnology and Biological Sciences Research Council of the United Kingdom (BBSRC). We acknowledge support from the Growing Health Institute Strategic Programme (BB/X010953/1; BBS/E/RH/230003A) and the Tailoring Plant Metabolism Institute Strategic Programme (BB/P012663/1). This research was supported by Gowan Crop Protection Limited, where authors BH and LC are currently employed. The company produces tri-allate and EPTC. Gowan Crop Protection Limited was not involved in the study design, collection, analysis, interpretation of data, the writing of this article, or the decision to submit it for publication.
Acknowledgments
The authors would like to acknowledge Christian Harrison and Margaret (Peggy) McGroary for their help in sampling the plant material from the discriminatory dose experiments as well as Sumit Sethi who helped with the wax and FAMEs extractions.
Conflict of interest
Authors HB, LC and BH were employed by the company Gowan Crop Protection Limited.
The remaining authors declare that the research was conducted in the absence of any commercial or financial relationships that could be construed as a potential conflict of interest.
The author(s) declared that they were an editorial board member of Frontiers, at the time of submission. This had no impact on the peer review process and the final decision.
Generative AI statement
The author(s) declare that Generative AI was used in the creation of this manuscript. We have used Generative AI to check spelling and grammar as part of standard Microsoft office packages, and used Microscoft CoPilot to ensure that there was a good fit between our abstract and conclusion sections and the Frontiers in Agronomy’s scope and formatting. We also used AI (e.g. https://elicit.com/) to help ensure that we had found all of the relevant literature. Generative AI was not used to write the text or to analyze or visualize any of our data.
Any alternative text (alt text) provided alongside figures in this article has been generated by Frontiers with the support of artificial intelligence and reasonable efforts have been made to ensure accuracy, including review by the authors wherever possible. If you identify any issues, please contact us.
Publisher’s note
All claims expressed in this article are solely those of the authors and do not necessarily represent those of their affiliated organizations, or those of the publisher, the editors and the reviewers. Any product that may be evaluated in this article, or claim that may be made by its manufacturer, is not guaranteed or endorsed by the publisher.
Supplementary material
The Supplementary Material for this article can be found online at: https://www.frontiersin.org/articles/10.3389/fagro.2025.1704268/full#supplementary-material
Supplementary Figure 1 | Additional dose testing curves showing the different effects of the pre-emergent herbicides on the two blackgrass biotypes on shoots (A-F) and roots (G-M). Showing average lengths relative to the biotype controls ± standard error for dose-response tests in EPTC (A-H), Tri-allate (C-J) and flufenacet (FFT) (E, F, K, L).
Supplementary Figure 2 | Shoot wax low abundance species, Rothamsted and Peldon average composition ng/mg FW sample with and without herbicide treatment with (A) EPTC, (B) Tri-allate and (C) flufenacet (FFT). Analysis of data generated through GC-FID. The outlines represent the control, while the fill represents the response to herbicide treatment n=3.
Supplementary Figure 3 | Lower abundance species blackgrass FAMES (i)shoot and (ii) root Following Herbicide Treatment (A-D) EPTC, (B-E) Tri-allate (Tri) and (C-F) flufenacet (FFT). Analyzed using GC-FID. Control samples not treated with herbicide are included for baseline comparison. Each data point represents the mean of three biological replicates, except for in (A) Peldon Herbicide treated and (E) Tri-allate Control, where n=2, with error bars indicating a standard error.
References
Allison R. (2024). Advice on managing blackgrass with wetter, milder winters (Farmers Weekly). Available online at: https://www.fwi.co.uk/arable/crop-management/weed-management/tips-on-managing-blackgrass-with-wetter-milder-winters (Accessed May 08, 2024).
Anggarani M., Lin Y.-Y., Fang S.-A., Wu H.-P., Wu C.-C., Jane W.-N., et al. (2024). Morphology and chemical composition of Taiwan oil millet (Eccoilopus formosanus) epicuticular wax. Planta 259, 89. doi: 10.1007/s00425-024-04352-y
Bach L. and Faure J.-D. (2010). Role of very-long-chain fatty acids in plant development, when chain length does matter. Comptes Rendus. Biologies 333, 361–370. doi: 10.1016/j.crvi.2010.01.014
Bach L., Gissot L., Marion J., Tellier F., Moreau P., Satiat-Jeunemaître B., et al. (2011). Very-long-chain fatty acids are required for cell plate formation during cytokinesis in Arabidopsis thaliana. J. Cell Sci. 124, 3223–3234. doi: 10.1242/jcs.074575
Batsale M., Alonso M., Pascal S., Thoraval D., Haslam R. P., Beaudoin F., et al. (2023). Tackling functional redundancy of Arabidopsis fatty acid elongase complexes. Front. Plant Sci. 14, 1107333–1107333. doi: 10.3389/fpls.2023.1107333
Batsale M., Bahammou D., Fouillen L., Mongrand S., Joubès J., and Domergue F. (2021). Biosynthesis and functions of very-long-chain fatty acids in the responses of plants to abiotic and biotic stresses. Cells 10, 1284. doi: 10.3390/cells10061284
Beffa R., Cornette L., Goupil G. L., Rossi C. V. S., and Sievernich B. (2024). Global HRAC supports combination or sequence of active ingredients belonging to former Groups N and K3 (new Group 15) (Herbicide Resistance Action Committee). Available online at: https://hracglobal.com/prevention-management/working-groups/group-15-vlcfa-inhibitors-resistance (Accessed February 08, 2024).
Blackshaw R. E., O'Donovan J. T., Sharma M. P., Harker K. N., and Maurice D. (1996). Response of triallate-resistant wild oat (Avena fatua) to alternative herbicides. Weed Technol. 10, 258–262. doi: 10.1017/S0890037X00039919
Cai L., Comont D., Macgregor D., Lowe C., Beffa R., Neve P., et al. (2023). The blackgrass genome reveals patterns of non-parallel evolution of polygenic herbicide resistance. New Phytol. 237, 1891–1907. doi: 10.1111/nph.18655
Comont D., Hicks H., Crook L., Hull R., Cocciantelli E., Hadfield J., et al. (2019). Evolutionary epidemiology predicts the emergence of glyphosate resistance in a major agricultural weed. New Phytol. 223, 1584–1594. doi: 10.1111/nph.15800
Comont D., Lowe C., Hull R., Crook L., Hicks H. L., Onkokesung N., et al. (2020). Evolution of generalist resistance to herbicide mixtures reveals a trade-off in resistance management. Nat. Commun. 11, 3086. doi: 10.1038/s41467-020-16896-0
Comont D., Macgregor D. R., Crook L., Hull R., Nguyen L., Freckleton R. P., et al. (2022). Dissecting weed adaptation: Fitness and trait correlations in herbicide-resistant Alopecurus myosuroides. Pest Manage. Sci. 78, 3039–3050. doi: 10.1002/ps.6930
Dücker R., Parcharidou E., and Beffa R. (2020). Flufenacet activity is affected by GST inhibitors in blackgrass (Alopecurus myosuroides) populations with reduced flufenacet sensitivity and higher expression levels of GSTs. Weed Sci. 68, 451–459. doi: 10.1017/wsc.2020.54
Dücker R., Zöllner P., Parcharidou E., Ries S., Lorentz L., and Beffa R. (2019). Enhanced metabolism causes reduced flufenacet sensitivity in black-grass (Alopecurus myosuroides Huds.) field populations. Pest Manage. Sci. 75, 2996–3004. doi: 10.1002/ps.5425
Fryer J. D. and Makepeace R. J. (1978). Weed Control Handbook Vol II: Recommendations (Oxford: Blackwell Scientific Publications Ltd).
Fu W., Macgregor D. R., Comont D., and Saski C. A. (2023). Sequence characterization of extra-chromosomal circular DNA content in multiple blackgrass (Alopecurus myosuroides) populations. Genes (Basel) 14, 1905. doi: 10.3390/genes14101905
Gentner W. A. (1966). The influence of EPTC on external foliage wax deposition. Weeds 14, 27–31. doi: 10.2307/4041117
Gronwald J. W. (1991). Lipid biosynthesis inhibitors. Weed Sci. 39, 435–449. doi: 10.1017/S0043174500073203
Günenc A. N., Graf B., Stark H., and Chari A. (2022). Macromolecular Protein Complexes IV (Springer, Cham.: Springer International Publishing).
Hamidzadeh Moghadam S., Alebrahim M. T., Tobeh A., Mohebodini M., Werck-Reichhart D., Macgregor D. R., et al. (2021). Redroot Pigweed (Amaranthus retroflexus L.) and Lamb’s Quarters (Chenopodium album L.) Populations Exhibit a High Degree of Morphological and Biochemical Diversity. Frontiers in Plant Science 12, 593037.
Hamidzadeh Moghadam S., Alebrahim M. T., Mohebodini M., and Macgregor D. R.. (2023). Genetic variation of Amaranthus retroflexus L. and Chenopodium album L. (Amaranthaceae) suggests multiple independent introductions into Iran. Frontiers in Plant Science 13, 1024555.
Harrison C., Noleto-Dias C., Ruvo G., Hughes D. J., Smith D. P., Mead A., et al. (2024). The mechanisms behind the contrasting responses to waterlogging in black-grass (Alopecurus myosuroides) and wheat (Triticum aestivum). Funct. Plant Biol. 51, FP23193. doi: 10.1071/FP23193
Harwood J. L. (2005). “Fatty acid biosynthesis,” in Plant Lipids: Biology, Utilisation and Manipulation. Ed. Murphy D. J. (Blackwell Publishing, Oxford).
Haslam T. M. and Kunst L. (2013). Extending the story of very-long-chain fatty acid elongation. Plant Sci. 210, 93–107. doi: 10.1016/j.plantsci.2013.05.008
Heap I. (2024). The international survey of herbicide resistant weeds. Available online at: www.weedscience.org. (Accessed February 13, 2024)
Hicks H. L., Comont D., Coutts S. R., Crook L., Hull R., Norris K., et al. (2018). The factors driving evolved herbicide resistance at a national scale. Nat. Ecol. Evol. 2, 529–536. doi: 10.1038/s41559-018-0470-1
HRAC (2010). Global Herbicide Resistance Action Committee classification of mode of action 2010. Available online at: https://hracglobal.com/files/moaposter.pdfhttps://hracglobal.com/files/moaposter.pdf (Accessed November 18, 2025).
HRAC (2024). 2024 HRAC Global Herbicide MoA Classification. Available online at: https://hracglobal.com/tools/2024-hrac-global-herbicide-moa-classification (Accessed November 18, 2025).
Jhala A. J., Singh M., Shergill L., Singh R., Jugulam M., Riechers D. E., et al. (2024). Very long chain fatty acid–inhibiting herbicides: Current uses, site of action, herbicide-resistant weeds, and future. Weed Technol. 38, e1. doi: 10.1017/wet.2023.90
Kern A. J., Jackson L. L., and Dyer W. E. (1997). Fatty acid and wax biosynthesis in susceptible and triallate-resistant Avena fatua L. Pesticide Sci. 51, 21–26. doi: 10.1002/(SICI)1096-9063(199709)51:1<21::AID-PS591>3.0.CO;2-9
Kern A. J., Myers T. M., Jasieniuk M., Murray B. G., Maxwell B. D., and Dyer W. E. (2002). Two recessive gene inheritance for triallate resistance in Avena fatua L. J. Hered 93, 48–50. doi: 10.1093/jhered/93.1.48
Kunst L. and Samuels L. (2009). Plant cuticles shine: advances in wax biosynthesis and export. Curr. Opin. Plant Biol. 12, 721–727. doi: 10.1016/j.pbi.2009.09.009
Lechelt-Kunze C., Meissner R. C., Drewes M., and Tietjen K. (2003). Flufenacet herbicide treatment phenocopies the fiddlehead mutant in Arabidopsis thaliana. Pest Manag Sci. 59, 847–856. doi: 10.1002/ps.714
Lee S. B. and Suh M. C. (2015). Advances in the understanding of cuticular waxes in Arabidopsis thaliana and crop species. Plant Cell Rep. 34, 557–572. doi: 10.1007/s00299-015-1772-2
Lerchl J., Witschel M., Menne H., Laber B., Frackenpohl J., Rossi C., et al. (2024). “Hrac Global Herbicide Moa Classification Working Group Report,” in (HRAC) (Global Herbicide Resistance Action Committee (HRAC). Available online at: https://hracglobal.com/tools/2024-hrac-global-herbicide-moa-classification. G. H. R. A. C. (ed.). (Accessed August 05, 2024)
Le Ruyet C., Pascal S., Usunow G., Van Delft P., Thoraval D., Doignon F., et al. (2025). Structurally diverse herbicides inhibit β-keto-acyl-CoA synthases from monocotyledonous and dicotyledonous plant species. Biochimie. doi: 10.1016/j.biochi.2025.07.007
Li-Beisson Y., Shorrosh B., Beisson F., Andersson M. X., Arondel V., Bates P. D., et al. (2013). Acyl-lipid metabolism. Arabidopsis Book 11, e0161–e0161. doi: 10.1199/tab.0161
Liebl R., Epp J., Menne H., Laber B., Morris J., and Witschel M. (2020). “Global HRAC MOA Classification Working Group Report,” HRAC(Global Herbicide Resistance Action Committee (HRAC). Available online at: https://hracglobal.com/tools/2020-review-of-the-herbicide-moa-classification. G. H. R. A. C. (ed.). (Accessed September 18, 2025)
Mellado-Sánchez M., Mcdiarmid F., Cardoso V., Kanyuka K., and Macgregor D. R. (2020). Virus-mediated transient expression techniques enable gene function studies in black-grass. Plant Physiol. 183, 455–459. doi: 10.1104/pp.20.00205
Moss S. (1990). Herbicide cross-resistance in slender foxtail (Alopecurus myosuroides). Weed Sci. 38, 492–496. doi: 10.1017/S0043174500051365
Moss S. R., Storkey J., Cussans J. W., Perryman S. A. M., and Hewitt M. V. (2004). The Broadbalk long-term experiment at Rothamsted: what has it told us about weeds? Weed Sci. 52, 864–873. doi: 10.1614/WS-04-012R1
Ohlrogge J. B. and Jaworski J. G. (1997). Regulation of fatty acid synthesis. Annu. Rev. Plant Biol. 48, 109–136. doi: 10.1146/annurev.arplant.48.1.109
Rashid A., Ian Johnson C., Aziz Khan A., and O'Donovan J. T. (1997). Effects of triallate and difenzoquat on fatty acid composition in young shoots of susceptible and resistantavena fatuaPopulations. Pesticide Biochem. Physiol. 57, 79–85. doi: 10.1006/pest.1997.2257
Schuphan I. and Casida J. E. (1979). S-Chloroallyl thiocarbamate herbicides: chemical and biological formation and rearrangement of diallate and triallate sulfoxides. J. Agric. Food Chem. 27, 1060–1067. doi: 10.1021/jf60225a016
Smith R. G., Gauthier D. A., Dennis D. T., and Turpin D. H. (1992). Malate- and pyruvate-dependent Fatty Acid synthesis in leucoplasts from developing castor endosperm. Plant Physiol. 98, 1233–1238. doi: 10.1104/pp.98.4.1233
Speakman J. B. and Krüger W. (1983). A comparison of methods to surface sterilize wheat seeds. Trans. Br. Mycological Soc. 80, 374–376. doi: 10.1016/S0007-1536(83)80031-X
Sun X., Han G., Meng Z., Lin L., and Sui N. (2019). Roles of Malic enzymes in plant development and stress responses. Plant Signaling Behav. 14, e1644596. doi: 10.1080/15592324.2019.1644596
Trenkamp S., Martin W., and Tietjen K. (2004). Specific and differential inhibition of very-long-chain fatty acid elongases from Arabidopsis thaliana by different herbicides. Proc. Natl. Acad. Sci. U.S.A 101, 11903–11908. doi: 10.1073/pnas.0404600101
Varah A., Ahodo K., Coutts S. R., Hicks H. L., Comont D., Crook L., et al. (2020). The costs of human-induced evolution in an agricultural system. Nat. Sustainability 3, 63–71. doi: 10.1038/s41893-019-0450-8
Keywords: pre-emergent herbicides, blackgrass (Alopecurus myosuroides), group 15 herbicides, fatty acid metabolism, cuticular wax composition
Citation: Blyth HR, Cornette L, Hunt B, Haslam RP, Beaudoin F and MacGregor DR (2025) Group 15 pre-emergent herbicides differentially affect plant growth, cuticular wax composition, and fatty acid metabolism in blackgrass. Front. Agron. 7:1704268. doi: 10.3389/fagro.2025.1704268
Received: 12 September 2025; Accepted: 19 November 2025; Revised: 19 November 2025;
Published: 11 December 2025.
Edited by:
Ricardo Alcántara-de la Cruz, Universidade Federal de Viçosa, BrazilReviewed by:
Amar S. Godar, University of Arkansas, United StatesPamela Carvalho-Moore, University of Arkansas, United States
Copyright © 2025 Blyth, Cornette, Hunt, Haslam, Beaudoin and MacGregor. This is an open-access article distributed under the terms of the Creative Commons Attribution License (CC BY). The use, distribution or reproduction in other forums is permitted, provided the original author(s) and the copyright owner(s) are credited and that the original publication in this journal is cited, in accordance with accepted academic practice. No use, distribution or reproduction is permitted which does not comply with these terms.
*Correspondence: Dana R. MacGregor, ZGFuYS5tYWNncmVnb3JAcm90aGFtc3RlZC5hYy51aw==