 Pablo Sierra-Figueredo
 Angel Sol-Sánchez
 Carlos Alberto Zúniga-González
- 1Institute of Geophysics and Astronomy, Havana, Cuba
- 2Colegio de Postgraduados, Campus Tabasco, Cárdenas, Tabasco, Mexico
- 3Research Unit in Bioeconomics and Climate Change, Research Center of Agrarian and Veterinary Sciences, National Autonomous University of Nicaragua, Leon, Nicaragua
Background: Over the past decades, extensive research has examined the interactions between space weather, solar activity, and the biosphere, particularly their implications for agricultural productivity. However, the specific mechanisms linking solar activity to agricultural performance remain underexplored, particularly in the context of bioeconomic efficiency. Understanding these connections is crucial for mitigating adverse environmental impacts and optimizing agricultural productivity. Research has highlighted the synchronization between multi-year solar activity cycles, particularly the 11-year solar cycles, and agricultural performance. Forecasting these cycles holds the potential to anticipate fluctuations in agricultural productivity, thus enabling more effective resource planning and enhancing profitability within the agri-food industry.
Methodology: This study employs Fast Fourier Transform (FFT) and advanced statistical tools from Microcal Origin 6.0 to analyze time-series data for 10 key agricultural products in Germany over a 61-year period. The study integrates solar radiation data, meteorological variables, and regional agricultural production data to investigate the relationship between solar activity and crop yields.
Results: The analysis reveals significant temporal associations between solar activity cycles and agricultural yields, identified through both cross-correlation and spectral analysis. These findings indicate that solar activity, particularly during the 11-year solar cycle, plays a notable role in shaping agricultural productivity.
Conclusion: The results confirm the synchronization between solar activity and agricultural performance. These insights have significant implications for the agri-food sector, suggesting that incorporating solar activity forecasts into agricultural management strategies could enhance resource allocation, improve crop yield predictions, and promote sustainable agricultural practices.
1 Introduction
Agricultural productivity, typically measured as yield per unit area (e.g., tons per hectare), is influenced by a multitude of factors, including genetics, weather, soil conditions, and biological agents. While many of these influences operate at local or regional levels, larger-scale environmental cycles, such as solar activity, have been increasingly recognized as potential drivers of long-term agricultural trends. Previous studies [e.g (Muthanna et al., 2016; Lin et al., 2021)] have identified long-term trends in agricultural yields linked to solar activity cycles.
This study explores the temporal relationship between solar activities, particularly the 11-year cycles of sunspot activity, and agricultural yields in Germany (Mawad et al., 2022a). Utilizing an extensive dataset spanning 61 years, we aim to determine the extent to which solar fluctuations influence long-term agricultural performance and whether these interactions could inform future agricultural forecasting models and policy decisions.
This investigation bridges two critical disciplines: Space Weather and agricultural productivity. Unlike previous studies, which often rely on short-term datasets or focus on local weather variations, our research leverages a multi-decade dataset to examine long-term trends, providing a broader perspective on how solar cycles may influence agricultural outputs. The significance of this work lies in its ability to reveal whether solar activity serves as a key environmental factor in shaping agricultural productivity, with potential implications for long-term food security planning. What sets this study apart is not only the novel analysis of the effects of cosmic physical agents on crop yields but also its broader implications for global food security strategies. By uncovering the temporal synchronization between solar activity and agricultural performance, this research aims to deepen our understanding of this relationship and offer insights that could inform future agricultural policies. These findings are crucial for optimizing resource allocation and fostering sustainable agricultural practices, thereby contributing to the timely and pressing issue of global food security.
1.1 Theoretical framework
The relationship between solar activity and agricultural productivity has been a subject of increasing scientific inquiry over the past decades. The most widely accepted theory posits that solar activity influences key climatic factors—such as temperature, precipitation, and cloud cover— through mechanisms like solar-driven changes in atmospheric circulation and cosmic ray modulation (Mawad et al., 2022a; Sierra-Figueredo et al., 2022; Zuniga-Gonzalez et al., 2024). These climatic variations directly affect photosynthesis, transpiration, and other vital biological processes in crops, thus influencing agricultural productivity across different regions.
The periodic nature of solar activity, notably the 11-year sunspot cycles, has been associated with fluctuations in crop yields, with previous studies identifying correlations linked to fluctuations in crops yields in multiple studies. Research has identified correlations between solar cycles and the production of mayor crops (Sierra-Figueredo et al., 2021; Pellegrini et al., 2022). However, despite these correlations, methodological inconsistencies and regional differences in agricultural practices have led to discrepancies in findings (Hathaway David, 2010). The need for refined models integrating econometric and bioeconomic approaches remains critical to accurately assessing the long-term effects of solar variability on agriculture (Zuniga-Gonzalez et al., 2024).
Beyond its climatic effects, solar activity has been suggested to impact plant metabolic cycles through alterations in radiation intensity. Studies indicate that variations in solar radiation can modify key hormonal and physiological processes, including flowering, fruit, and growth cycles. Experimental research has demonstrated that changes in UV and cosmic ray exposure influence gene expression related to stress resistance and photosynthetic efficiency, thereby affecting overall crop performance (Hathaway David, 2010). Understanding these mechanisms is essential for improving agricultural forecasting models and adaptive farming strategies in response to solar variability.
Although theoretical foundations for the solar-agriculture relationship exist, most previous research has been constrained by short-term or region-specific datasets, limiting the ability to draw generalized conclusions. Furthermore, few studies have integrated long-term, multi-decade datasets with econometric modeling to assess how solar cycles influence agricultural output. This research aims to bridge this gap by these gaps by analyzing 61 years of data from Germany, a country with a climate representative of Central Europe. By incorporating a bioeconomic perspective, this study provides a comprehensive framework to evaluate the sustainability and economic implications of solar-driven agricultural variability, offering insights relevant for climate-adaptive agricultural policies and food security strategies (Zuniga-Gonzalez et al., 2024).
2 Materials and method
To represent solar activity, we used the Wolf Number (also known as the International Sunspot Number or Zurich Number), which characterizes the annual average of sunspot counts and their grouped structures observed on the solar disk (Rybanský et al., 2001; Usoskin, 2017). This index was selected due to its extensive historical record and its recognized reliability in capturing long-term solar cycle variations (Clette et al., 2007; Clette et al., 2014).
Solar activity was represented by the Wolf Number, derived from daily sunspot observations from standardized global observatories (e.g., Solar Influences Data Analysis Center). The Wolf Number reflects the annual average of sunspot counts and groupings, calculated using the Equation 1:
where R is the relative sunspot number, s is the number of individual sunspots, g is the number of sunspot groups, and k is the observatory-specific correction factor.
Agricultural yield data for 10 key products, including cereals, potatoes, and livestock-, were obtained from German agricultural databases. These crops were selected based on their economic significance and their long-term availability in historical records. The dataset span 61 years, except for bean production, which covers 31 years. Yields are expressed in hectare (hg/ha), except for cattle counts (heads/year) and beef yield (hg/animal).
Data organization and preliminary statistical analysis were performed using Excel (Table 1). For advanced analysis, we applied cross-correlation and spectral analysis using Microcal Origin 6.0, which provides robust tools for detecting periodicities in time-series data. These methods were selected to identify potential synchronization patterns between solar activity (Wolf Number) and agricultural yields over multiple decades.
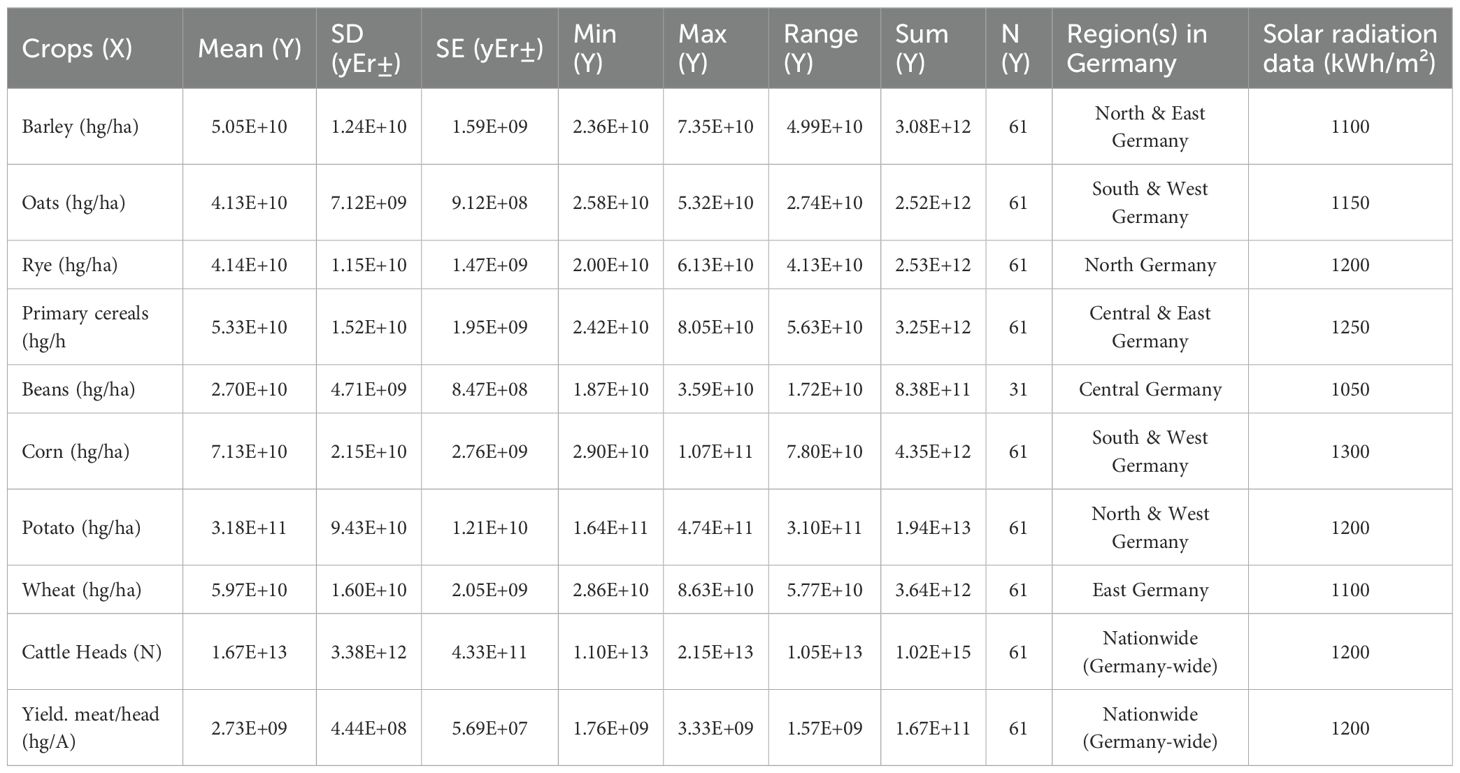
Table 1. Encompasses general statistical data from the original dataset utilized (annual yield).
A representative sample of 10 productive categories was chosen from the available 19, portraying the German agro-industry over the past 61 years, except for bean production, where data is available only for the last 31 years (Table 1). All yields are expressed in hg/ha, except for Cattle Heads, which is expressed as the number of heads per year, and beef yield, expressed in hg/Animal (Zúniga-Gonzalez et al., 2023).
2.1 Justification for including livestock performance
While core crops (cereals, fruits, etc.) are directly linked to climate variability modulated by the solar cycle, we have included livestock performance metrics (meat, milk, and population) as an indirect, but essential, proxy for the final link in the agricultural bioeconomic chain. Livestock productivity is heavily dependent on the quantity and quality of the underlying plant biomass, such as grazing pastures, green grass, and forage crops. These feed sources are directly influenced by solar-driven variations in climate factors like precipitation and temperature. Therefore, analyzing livestock performance provides a holistic indicator that reflects the aggregate response of the entire agricultural ecosystem—from plant production to animal output—to solar activity. The accurate assessment of crop yield potential requires careful consideration of environmental factors and physiological limits (Reddy, 1998). This approach ensures a comprehensive view of the synchronization effect across the German agricultural sector.
Excel was utilized for data organization and basic statistical computations. Subsequently, the data was exported to the statistical package Microcal Origin 6.0 (Deschenes and David, 2000; Mitchell, 2000; Li et al., 2011) for cross-correlation and spectral analysis of the constructed time series. To assess the robustness of our findings, confidence intervals were computed for the spectral peaks detected in the Fourier Transform analysis. Statistical significance of the correlations was evaluated using Monte Carlo simulations with 1,000 iterations. The 95% confidence intervals for the cross-correlation function were obtained using the Fisher transformation, ensuring that the detected periodicities are not due to random fluctuations (Shumway et al., 2017). This package facilitated the visualization of synchrony between the Wolf Number time series, representing Solar Activity, and the Yield time series (Ormes, 2018). All datasets were normalized to maximum values, trend components were removed from the time series, and a 5-year sliding mean was obtained. This approach aimed to highlight variability, filter data by suppressing shorter-term variations, focusing on analyzing multi-year fluctuations spanning approximately 10 to 25 years.
2.2 Fourier transform
To analyze periodic components in the dataset, we employed Fourier Transform analysis. This method allows the decomposition of time-series data into frequency components, helping to identify dominant cycles within the observed agricultural yields. The Fourier Transform is mathematically defined as follows (Equation 2) (Mac Manus et al., 2017):
Where s is the independent variable of the temporal or spatial domain and the variable ∅ independent of the frequency domain.
Now, the sequence of N real numbers ,……………., (the original time-domain signal) is transformed into the sequence of N complex numbers ,……………. (the frequency-domain representation) by means of the Discrete Fourier Transform (DFT) using the following Equation 3:
where denote the amplitude of the signal in the time domain at the index k, and represents the corresponding complex amplitude in the frequency domain at the frequency index n.
To perform the FFT, we use the Microcal Origin 6.0 software. The squared module of the FFT of the series to be analyzed stands out, where the resulting graph is called the power spectrum or power spectral density (SP). The distribution of power values is measured as a function of SP frequency (Equation 4).
2.2.1 Correlation function
In this study, we applied cross-covariance analysis to measure the similarity between two time-series signals: solar activity (Wolf Number) and agricultural yields. This method helps identify whether variations in agricultural productivity exhibit a lagged or synchronized response to changes in solar activity, allowing for the detection of underlying periodic relationships. Equation 4 is the function of the relative time between the signals (Muñoz, 2009).
Given two discrete functions or signals fi and gi with i=1……N, the cross-correlation is Equation 5:
With L≤N where the summation is performed over integer values of J; and the asterisk indicates the complex conjugate. L is the so-called lag or lag time.
2.3 data sources
The agricultural yield data were obtained from the German Federal Statistical Office (Destatis), covering the period 1960–2021. Solar activity data (Wolf Number) were retrieved from the Solar Influences Data Analysis Center (SIDC) of the Royal Observatory of Belgium.
3 Results
Figure 1 illustrates the Wolf Number (W) time series of for the analyzed period, which span 11 completed solar cycles. The figure also highlights the average durations of maximum and minimum phases, as well as the overall period cycle. This representation of the evolution of solar activity provides a temporal reference for examining its potential influence on agricultural yields over time. Figure 2 presents the spectral analysis of the W index using the Fast Fourier Transform (FFT). Figure 2 shows the spectral analysis of the W index, performed using Fast Fourier Transform (FFT). The analysis reveals a dominant spectral peak at 10.67 years (95% CI: 10.1–11.2 years), suggesting strong synchronization with the 11-year solar cycle. Furthermore, secondary harmonics at 21.33 years and 5.33 years are also statistically significant (p < 0.05), further reinforcing the cyclical effect of solar activity on agricultural yields. These secondary peaks point to additional periodic influences that might affect the agricultural systems studied.
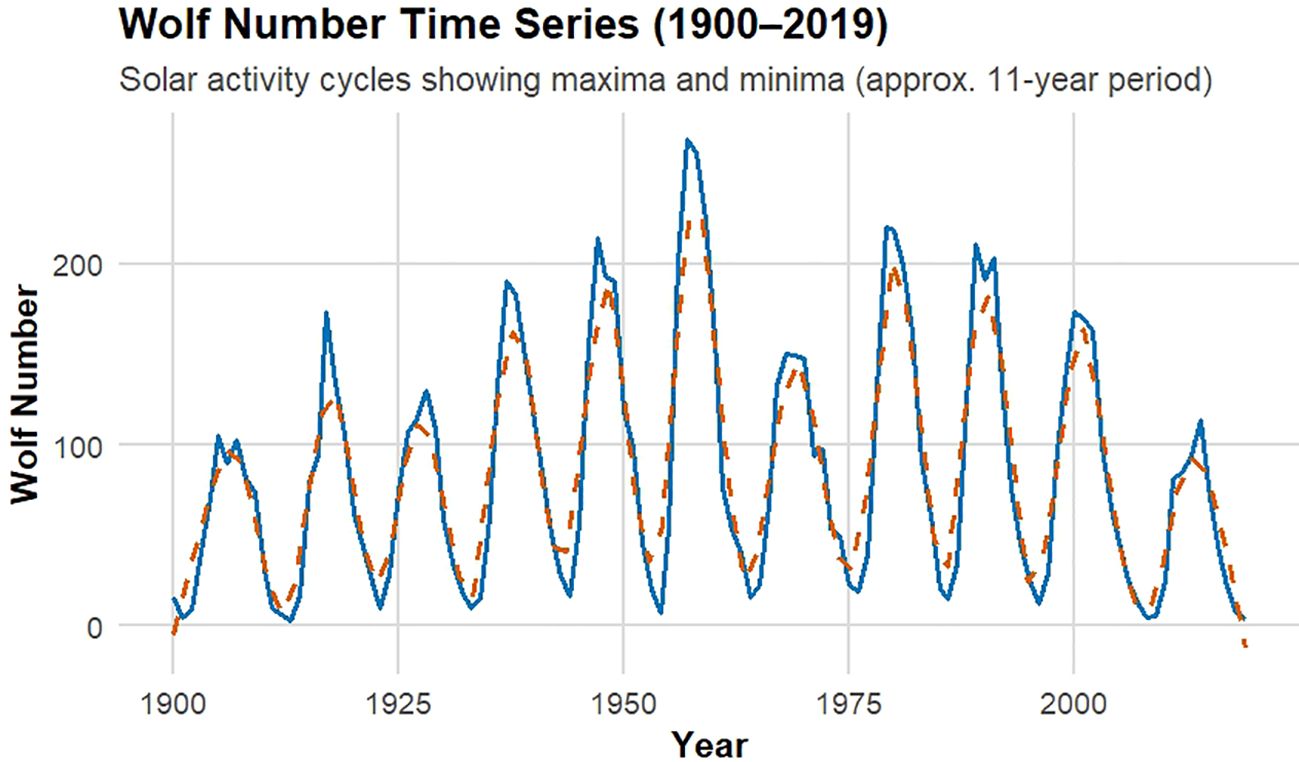
Figure 1. Wolf Number Time Series (1900–2019). The blue solid line represents the observed monthly Wolf sunspot numbers, while the orange dashed line shows the smoothed trend using an 11-year moving average to highlight the solar activity cycles (maximum and minimum).
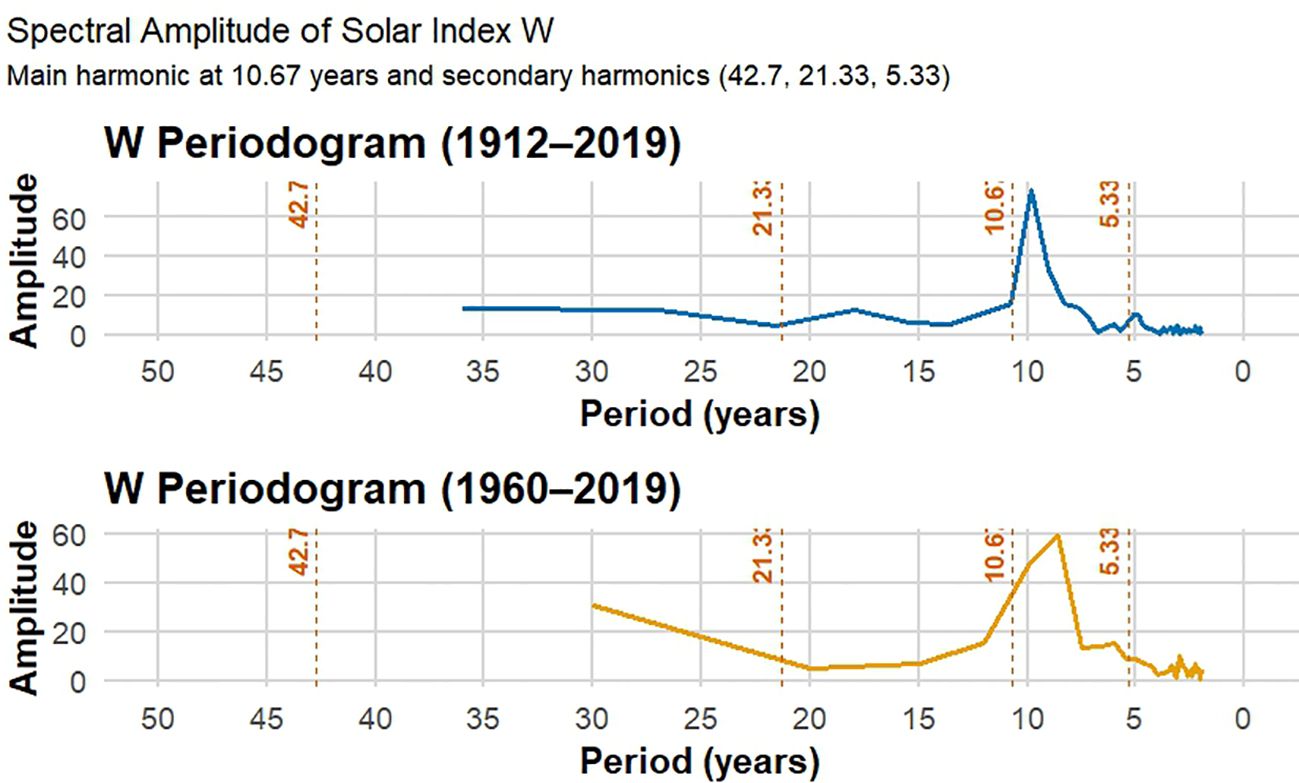
Figure 2. Spectral amplitude of the solar index W for the period from 1900 to 2019 and that obtained for the interval considered in the research (1960 to 2020), obtained through FFT. The main harmonic at 10.67 years is highlighted, along with other secondary harmonics (42.7, 21.33, and 5.33 years).
The graph shows the length of each cycle, both for the highs and lows. On the right edge, the corresponding averages are indicated by red numbers (10.8 and 10.9, respectively). The exact values for the periods may vary slightly depending on the calculation method, but they consistently remain within the range of 11 ± 1 years.
The following panel (Figure 3) presents multiple elements in a comprehensive analysis of the 10 agricultural categories studied:
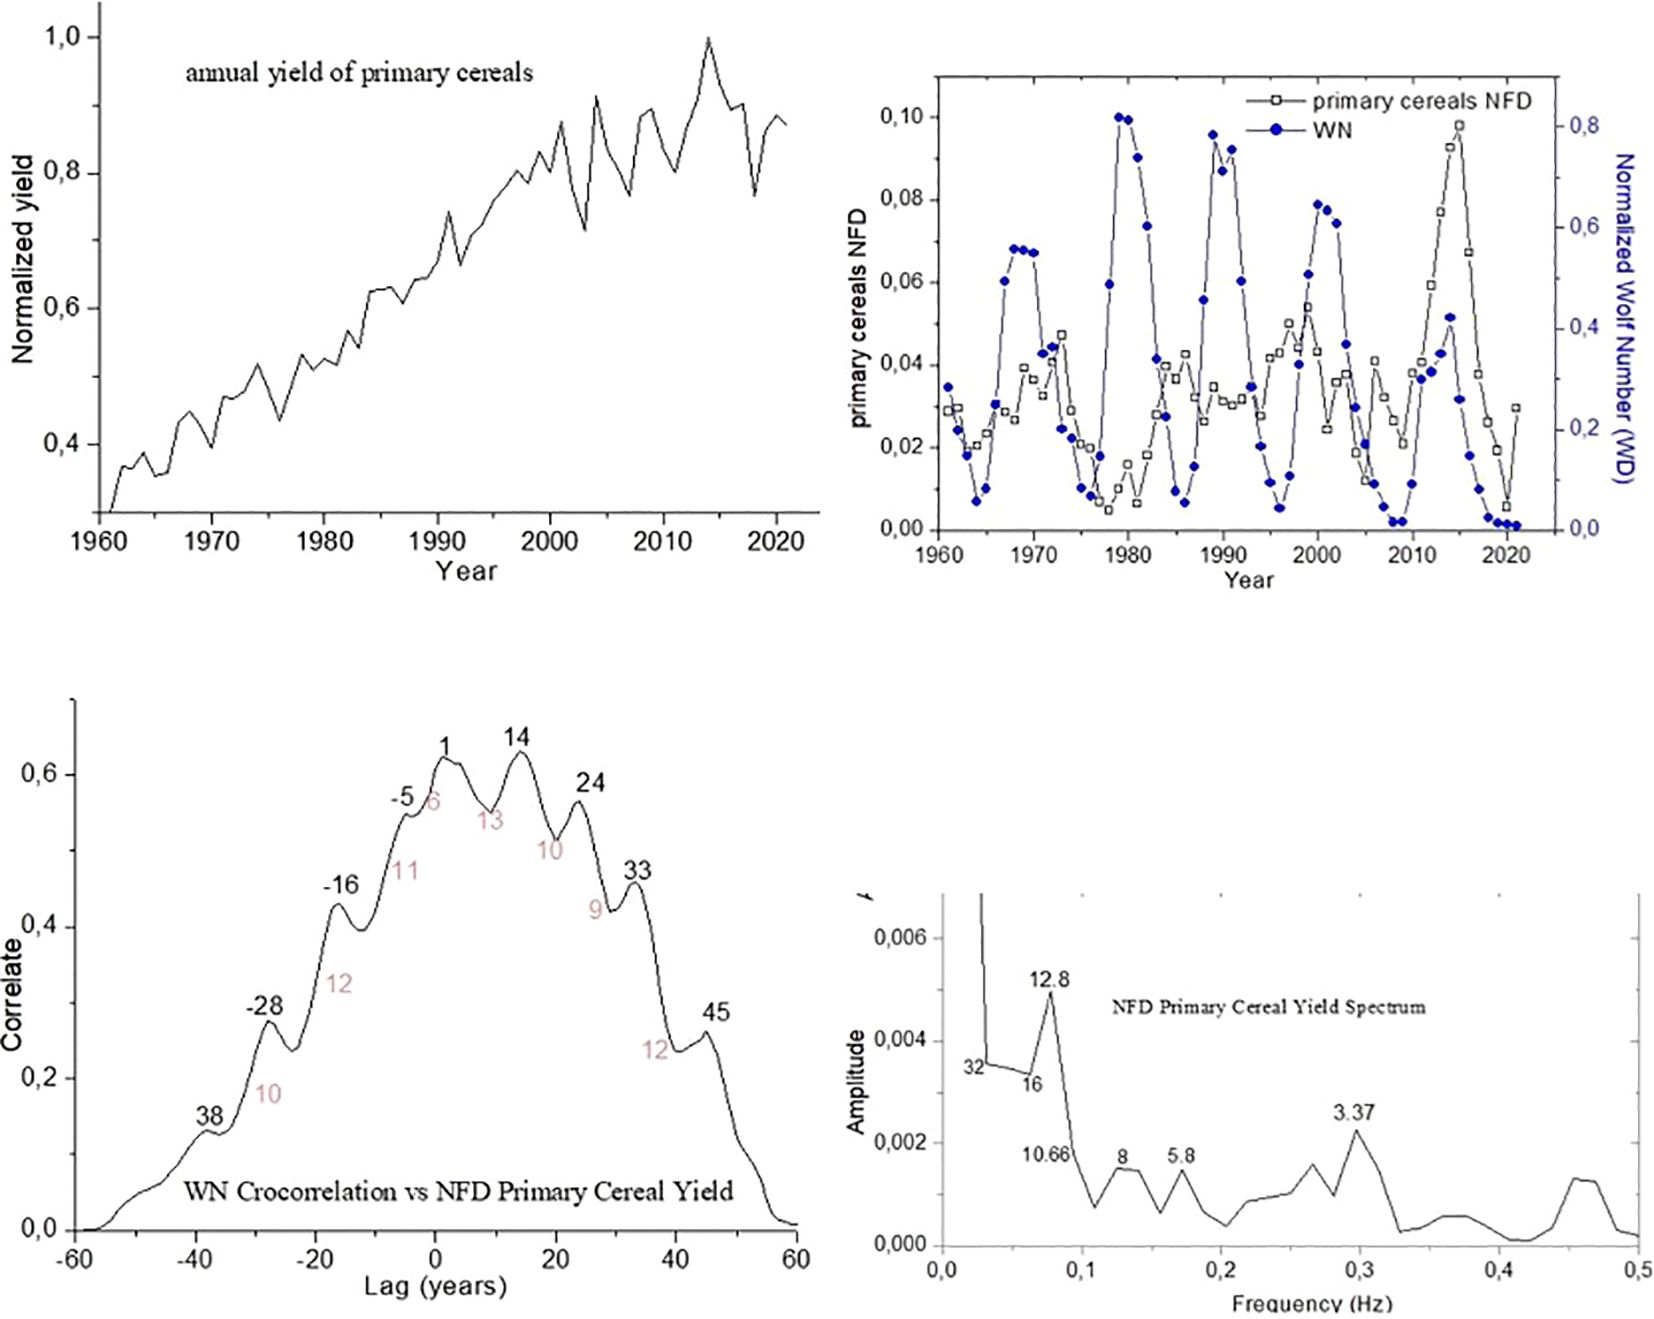
Figure 3. Cross-correlation plot between the yield variable and the solar index WN. Spectral amplitude plot of the normalized, filtered, and detrended yield time series (NFsT) for Corn.
These graphs show the normalized time series for each of the 10 agricultural categories, providing a clear view of how each crop or livestock group performed over the study period.
These graphs show the yield time series after normalization, filtering, and detrending, allowing for a clearer view of underlying trends without long-term bias. These are overlaid with the Normalized Wolf Number (WN), which represents the synchronized behavior of solar activity.
This graph presents the cross-correlation analysis between the yield variables and the Normalized Wolf Number (WN). It identifies key synchronization peaks, highlighting the temporal relationship between solar activity cycles and agricultural yield fluctuations.
This graph shows the spectral amplitude of the normalized, filtered, and detrending (NFsT) yield time series, emphasizing significant cyclical components and their alignment with solar activity, particularly the dominant 10-12-year cycle.
Together, Figures 3–11 provide a detailed visualization of the synchronization dynamics between solar activity and agricultural productivity. This is consistent with the results of a previous study (Mawad et al., 2022b) that demonstrated a relationship between the spread of epidemics and pandemic viruses with solar activity, which also impacts plants production. The inclusion of these multiple methods allows for an in-depth understanding of the temporal and cyclical relationships observed across key study categories.
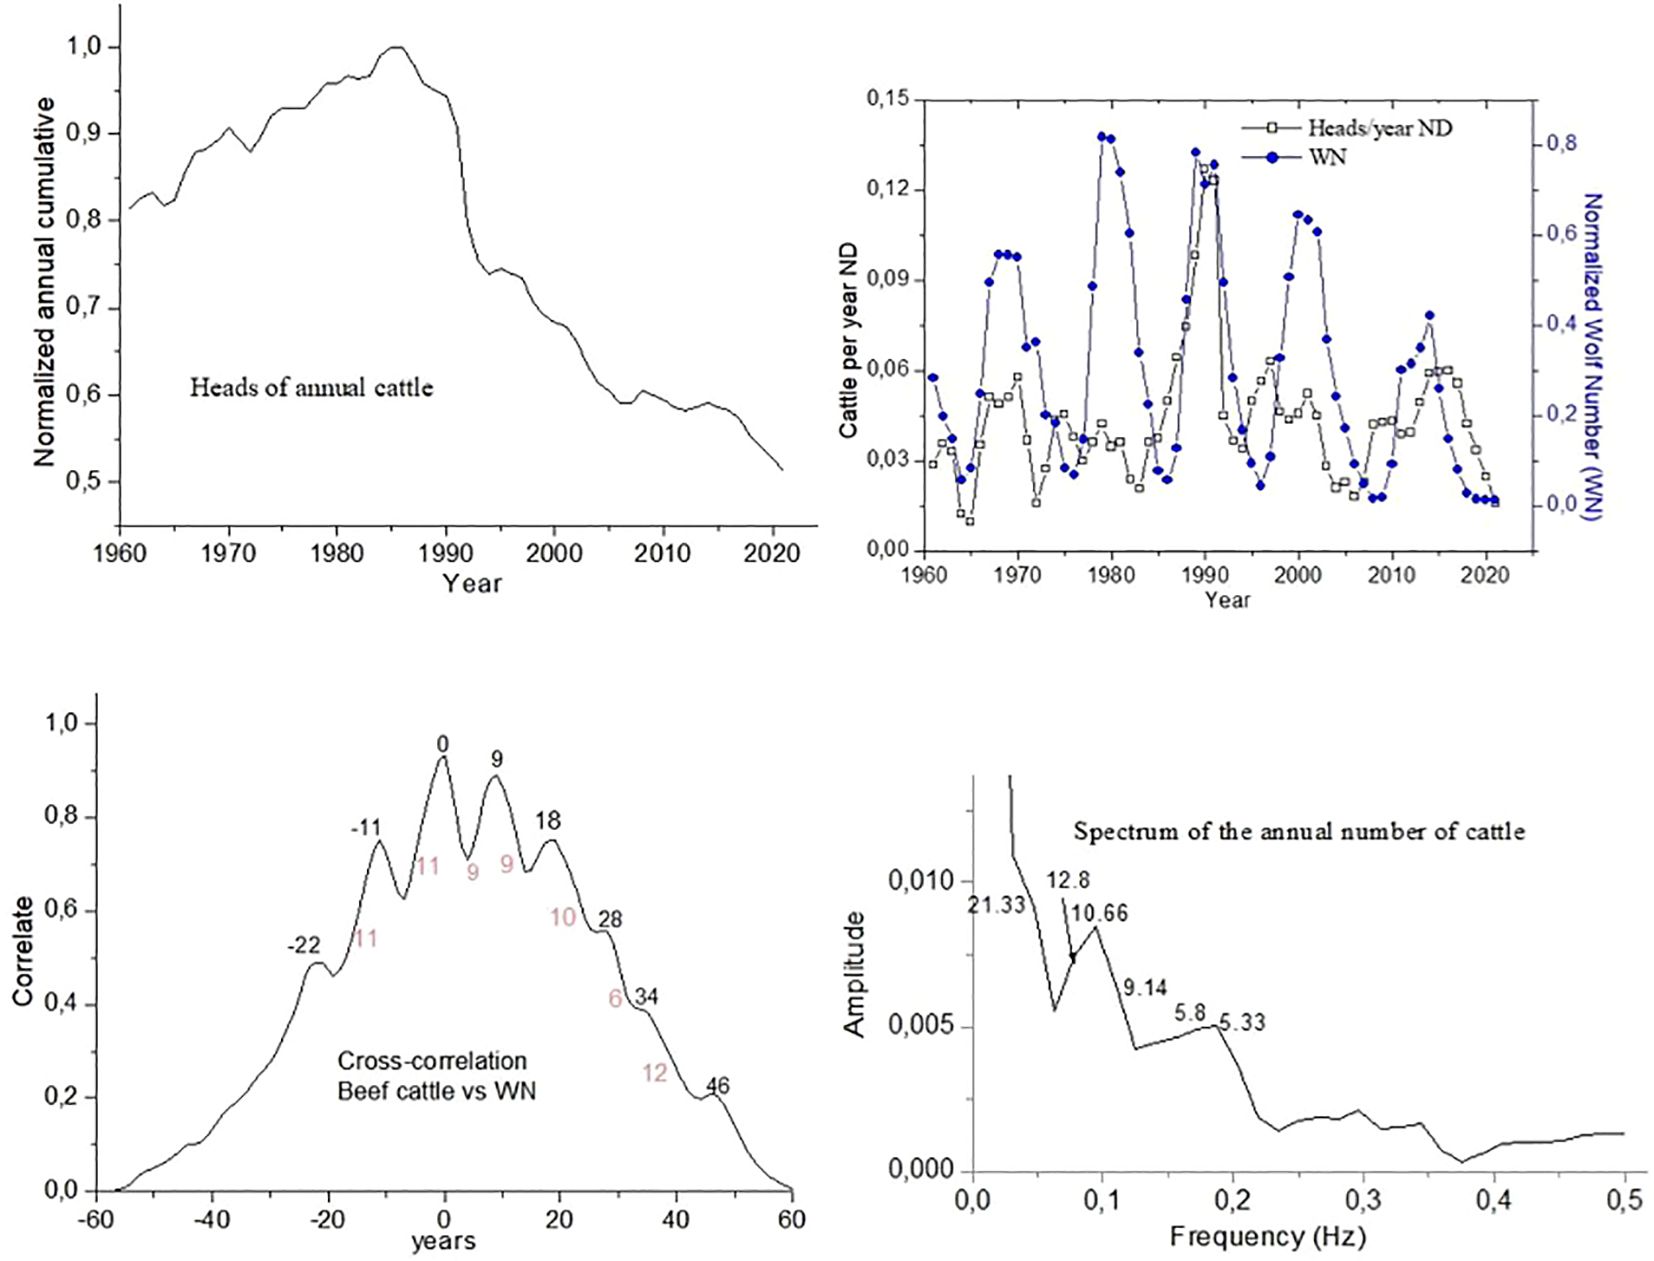
Figure 4. Cross-correlation plot between the yield variable and the solar index WN. Spectral amplitude plot of the normalized, filtered, and detrended yield time series (NFsT) for Barley.
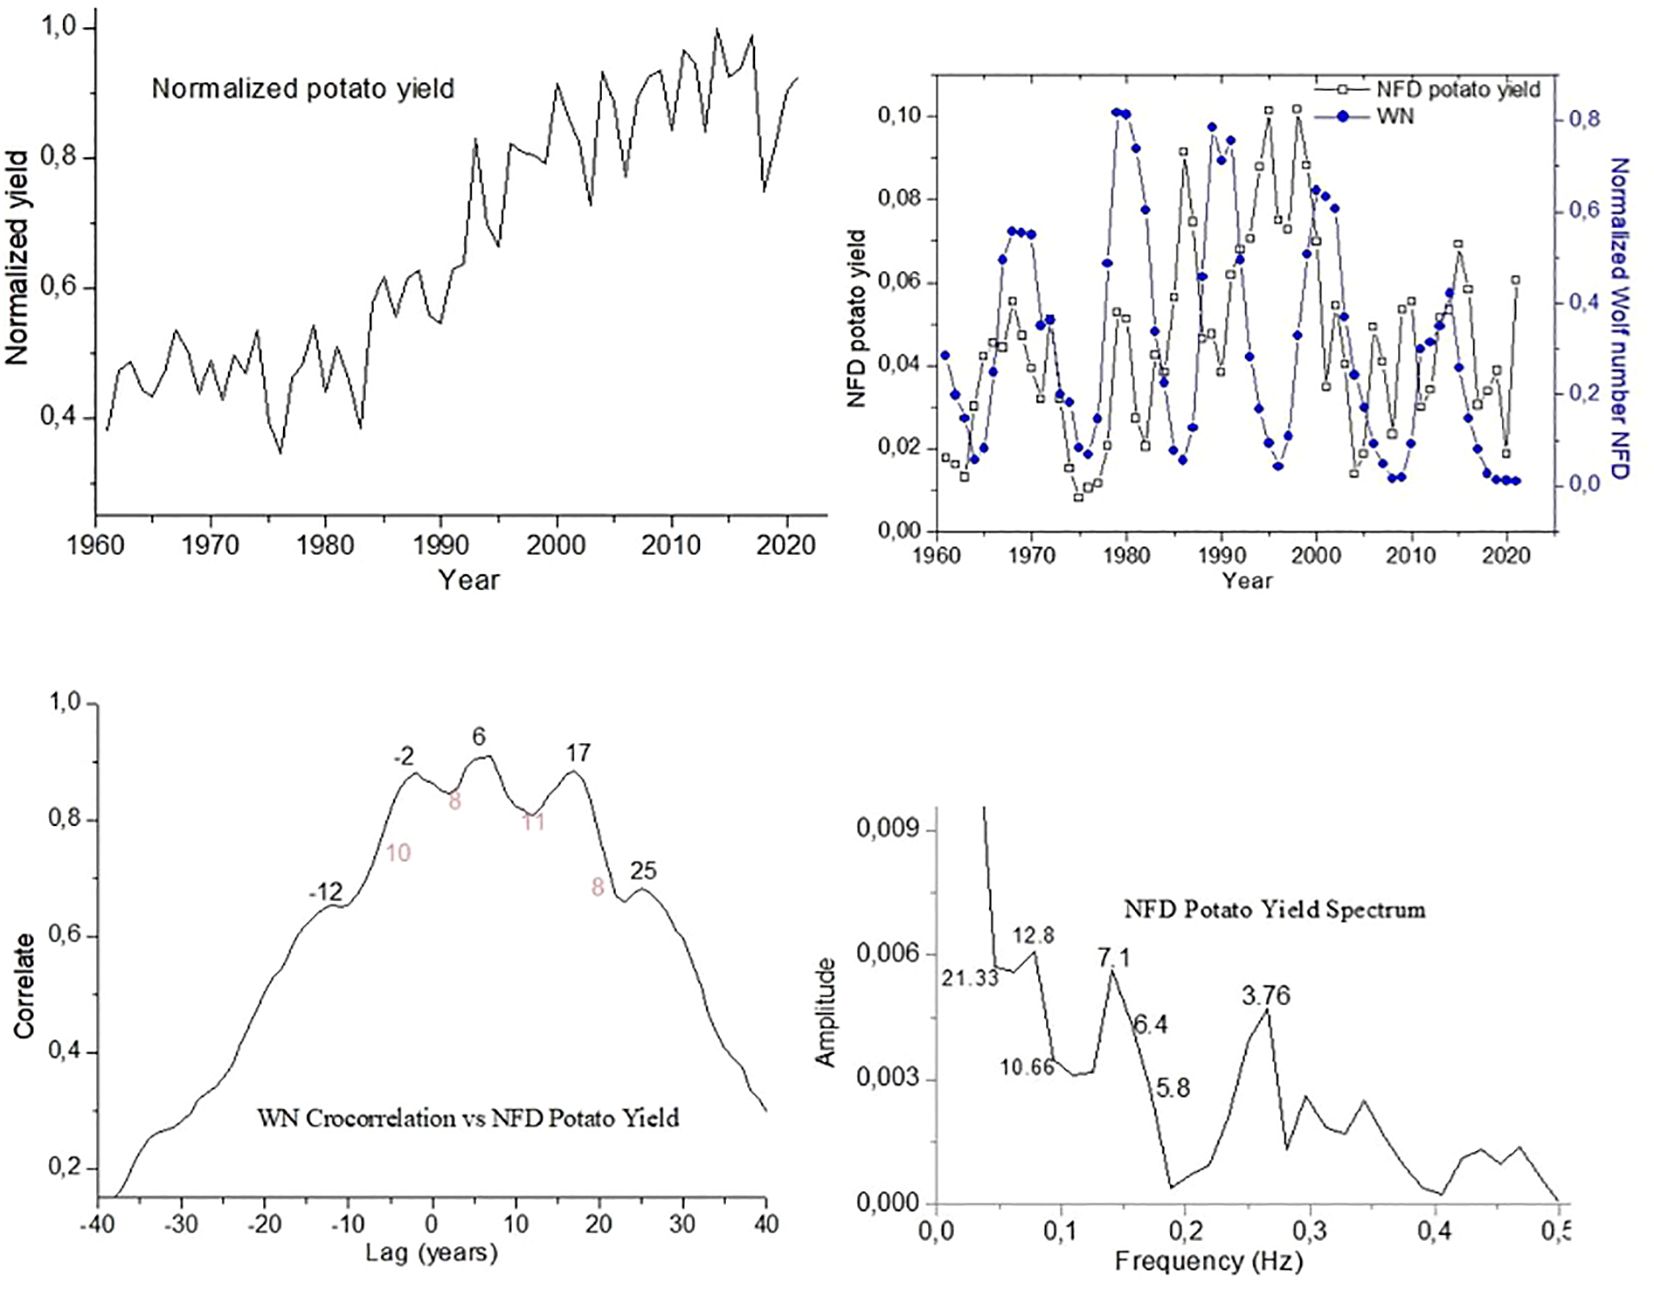
Figure 5. Cross-correlation plot between the yield variable and the solar index W N. Spectral amplitude plot of the normalized, filtered, and detrended yield time series (NFsT) for Oats.
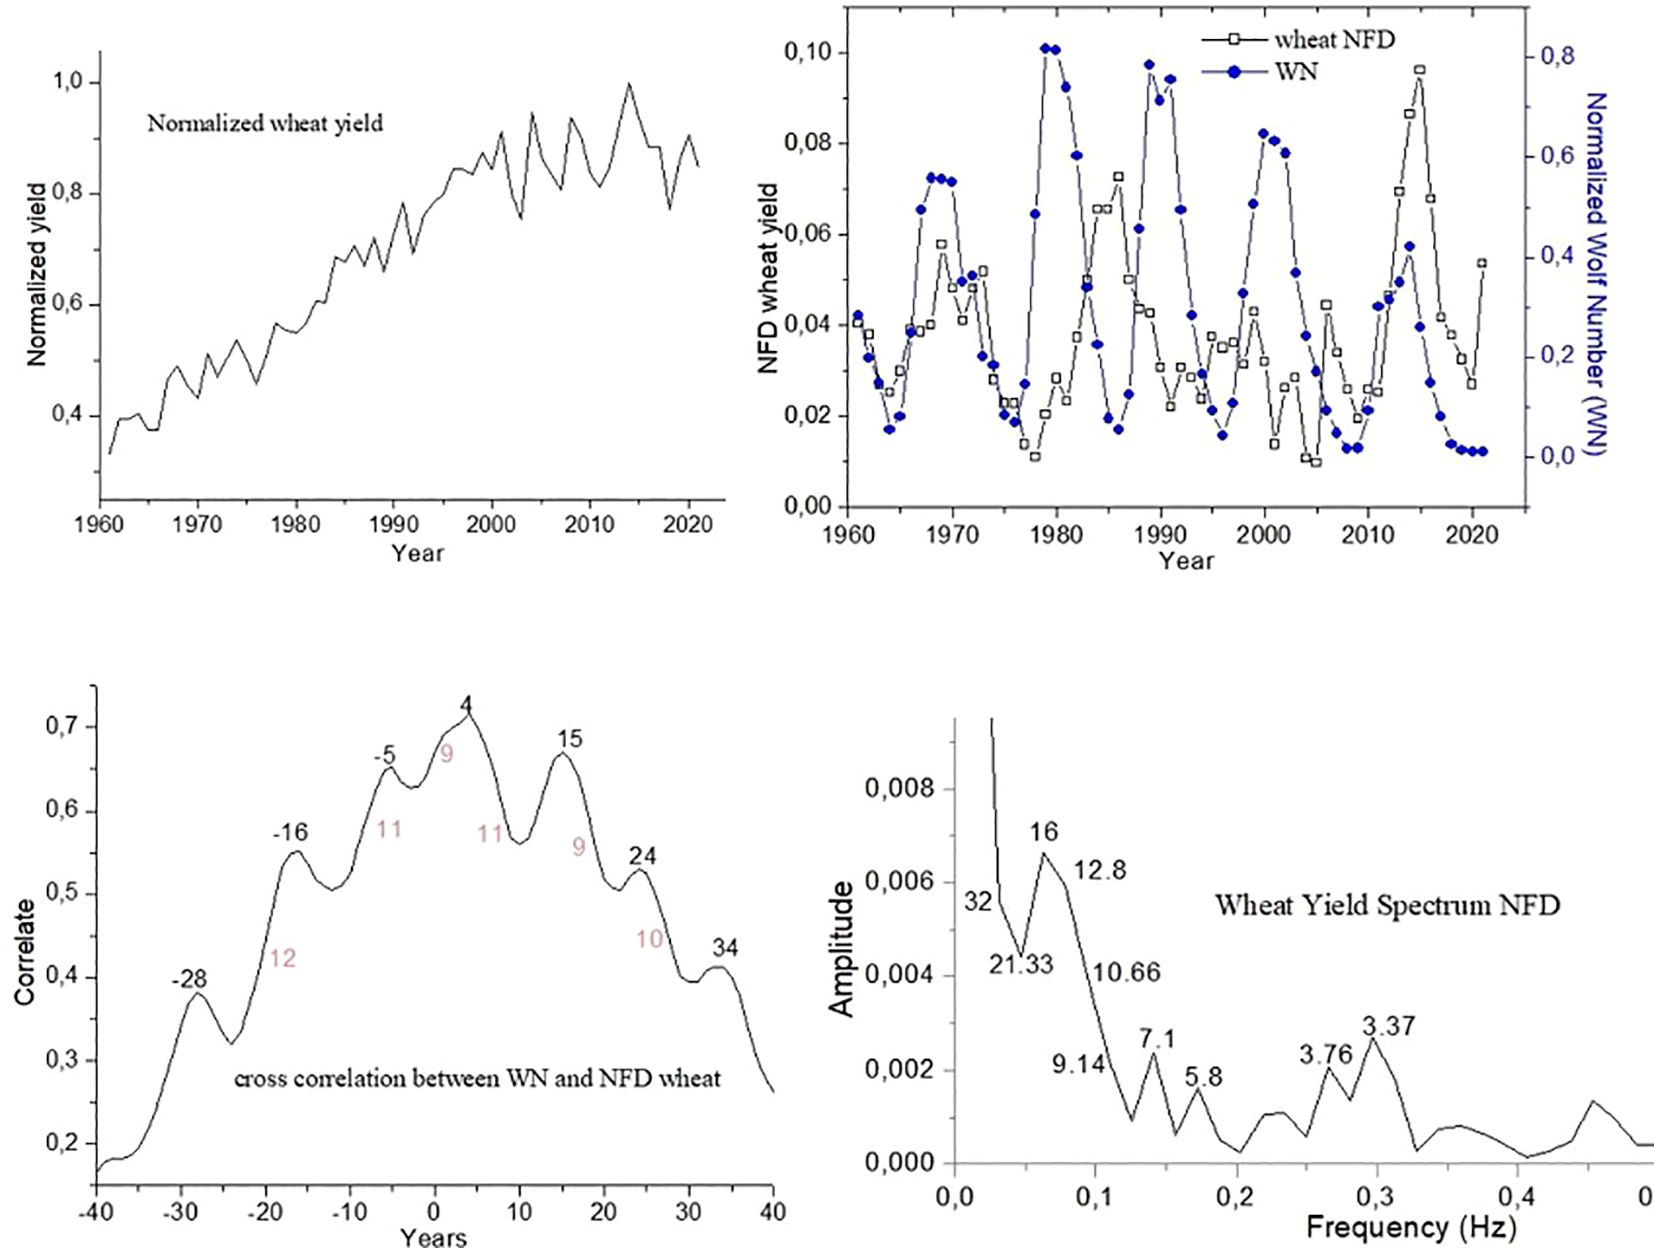
Figure 6. Cross-correlation plot between the yield variable and the solar index WN. Spectral amplitude plot of the normalized, filtered, and detrended yield time series (NFsT) for Rye.
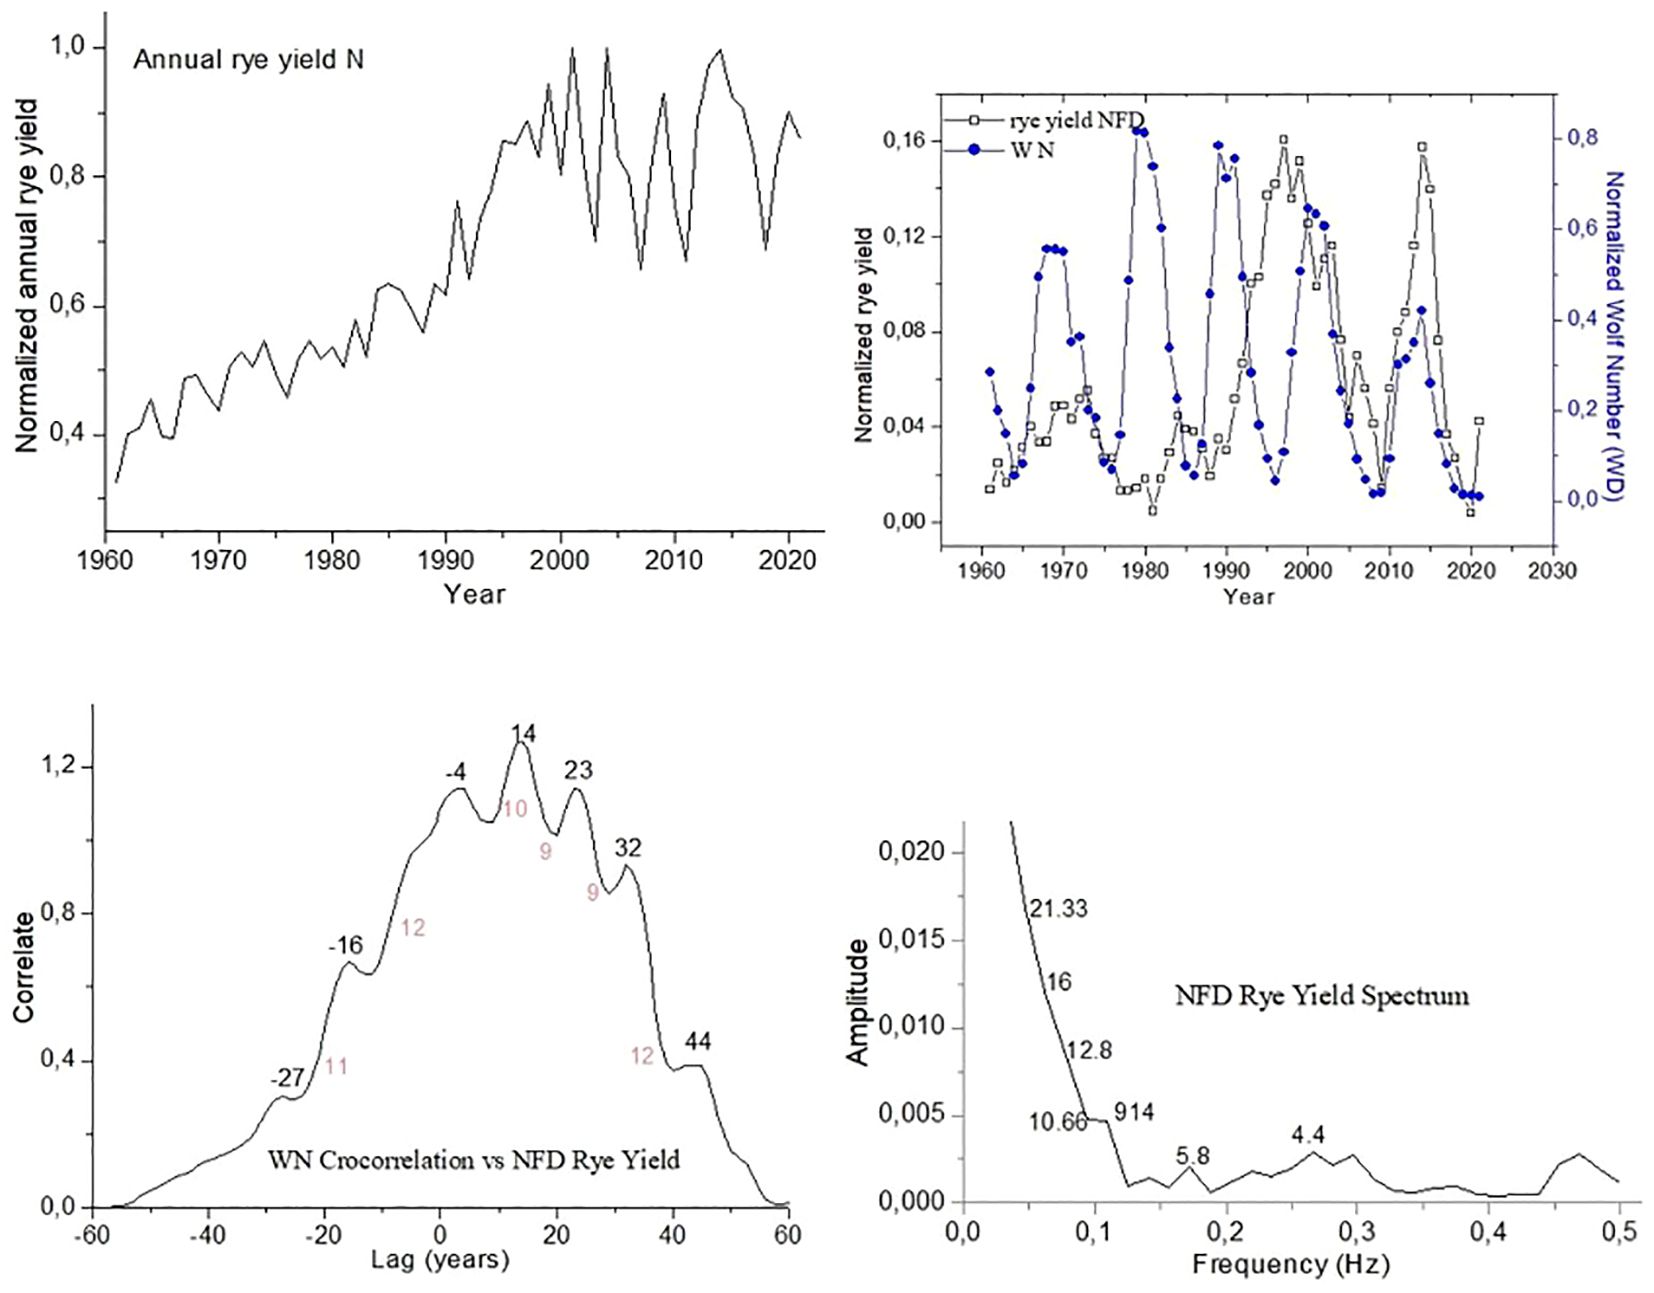
Figure 7. Cross-correlation plot between the yield variable and the solar index WN. Spectral amplitude plot of the normalized, filtered, and detrended yield time series (NFsT) for Primary cereals.
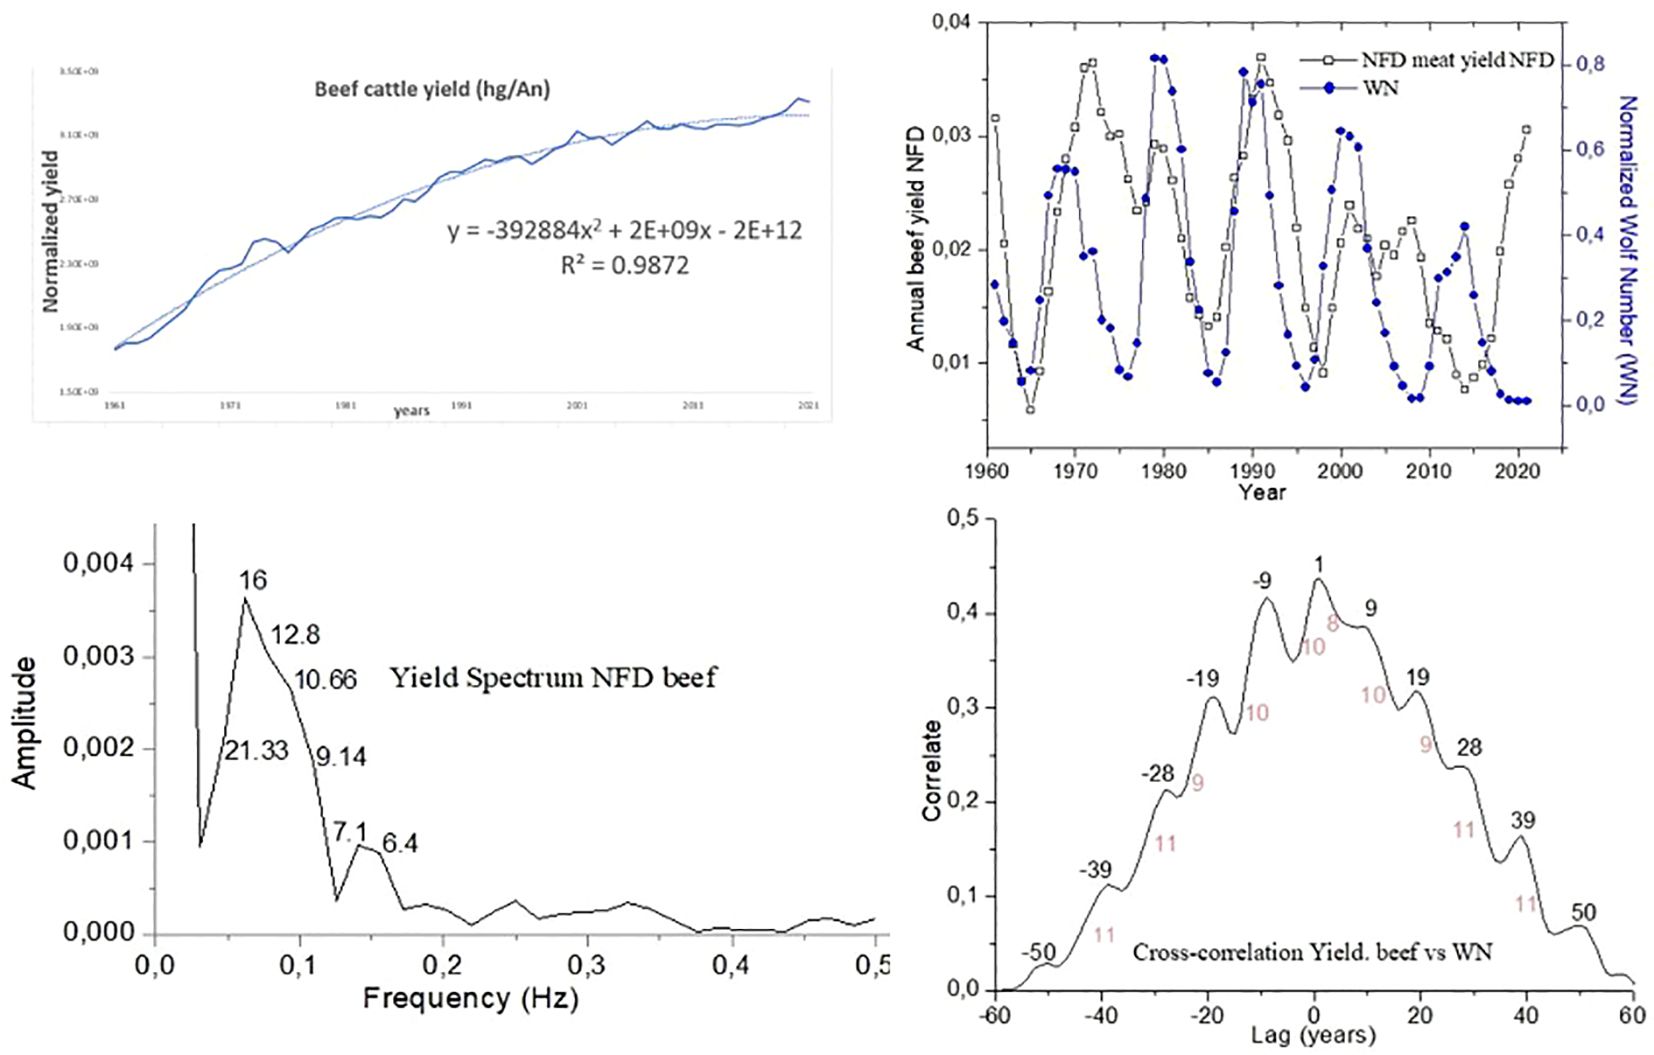
Figure 8. Cross-correlation plot between the yield variable and the solar index WN. Spectral amplitude plot of the normalized, filtered, and detrended yield time series (NFsT) for Potato.
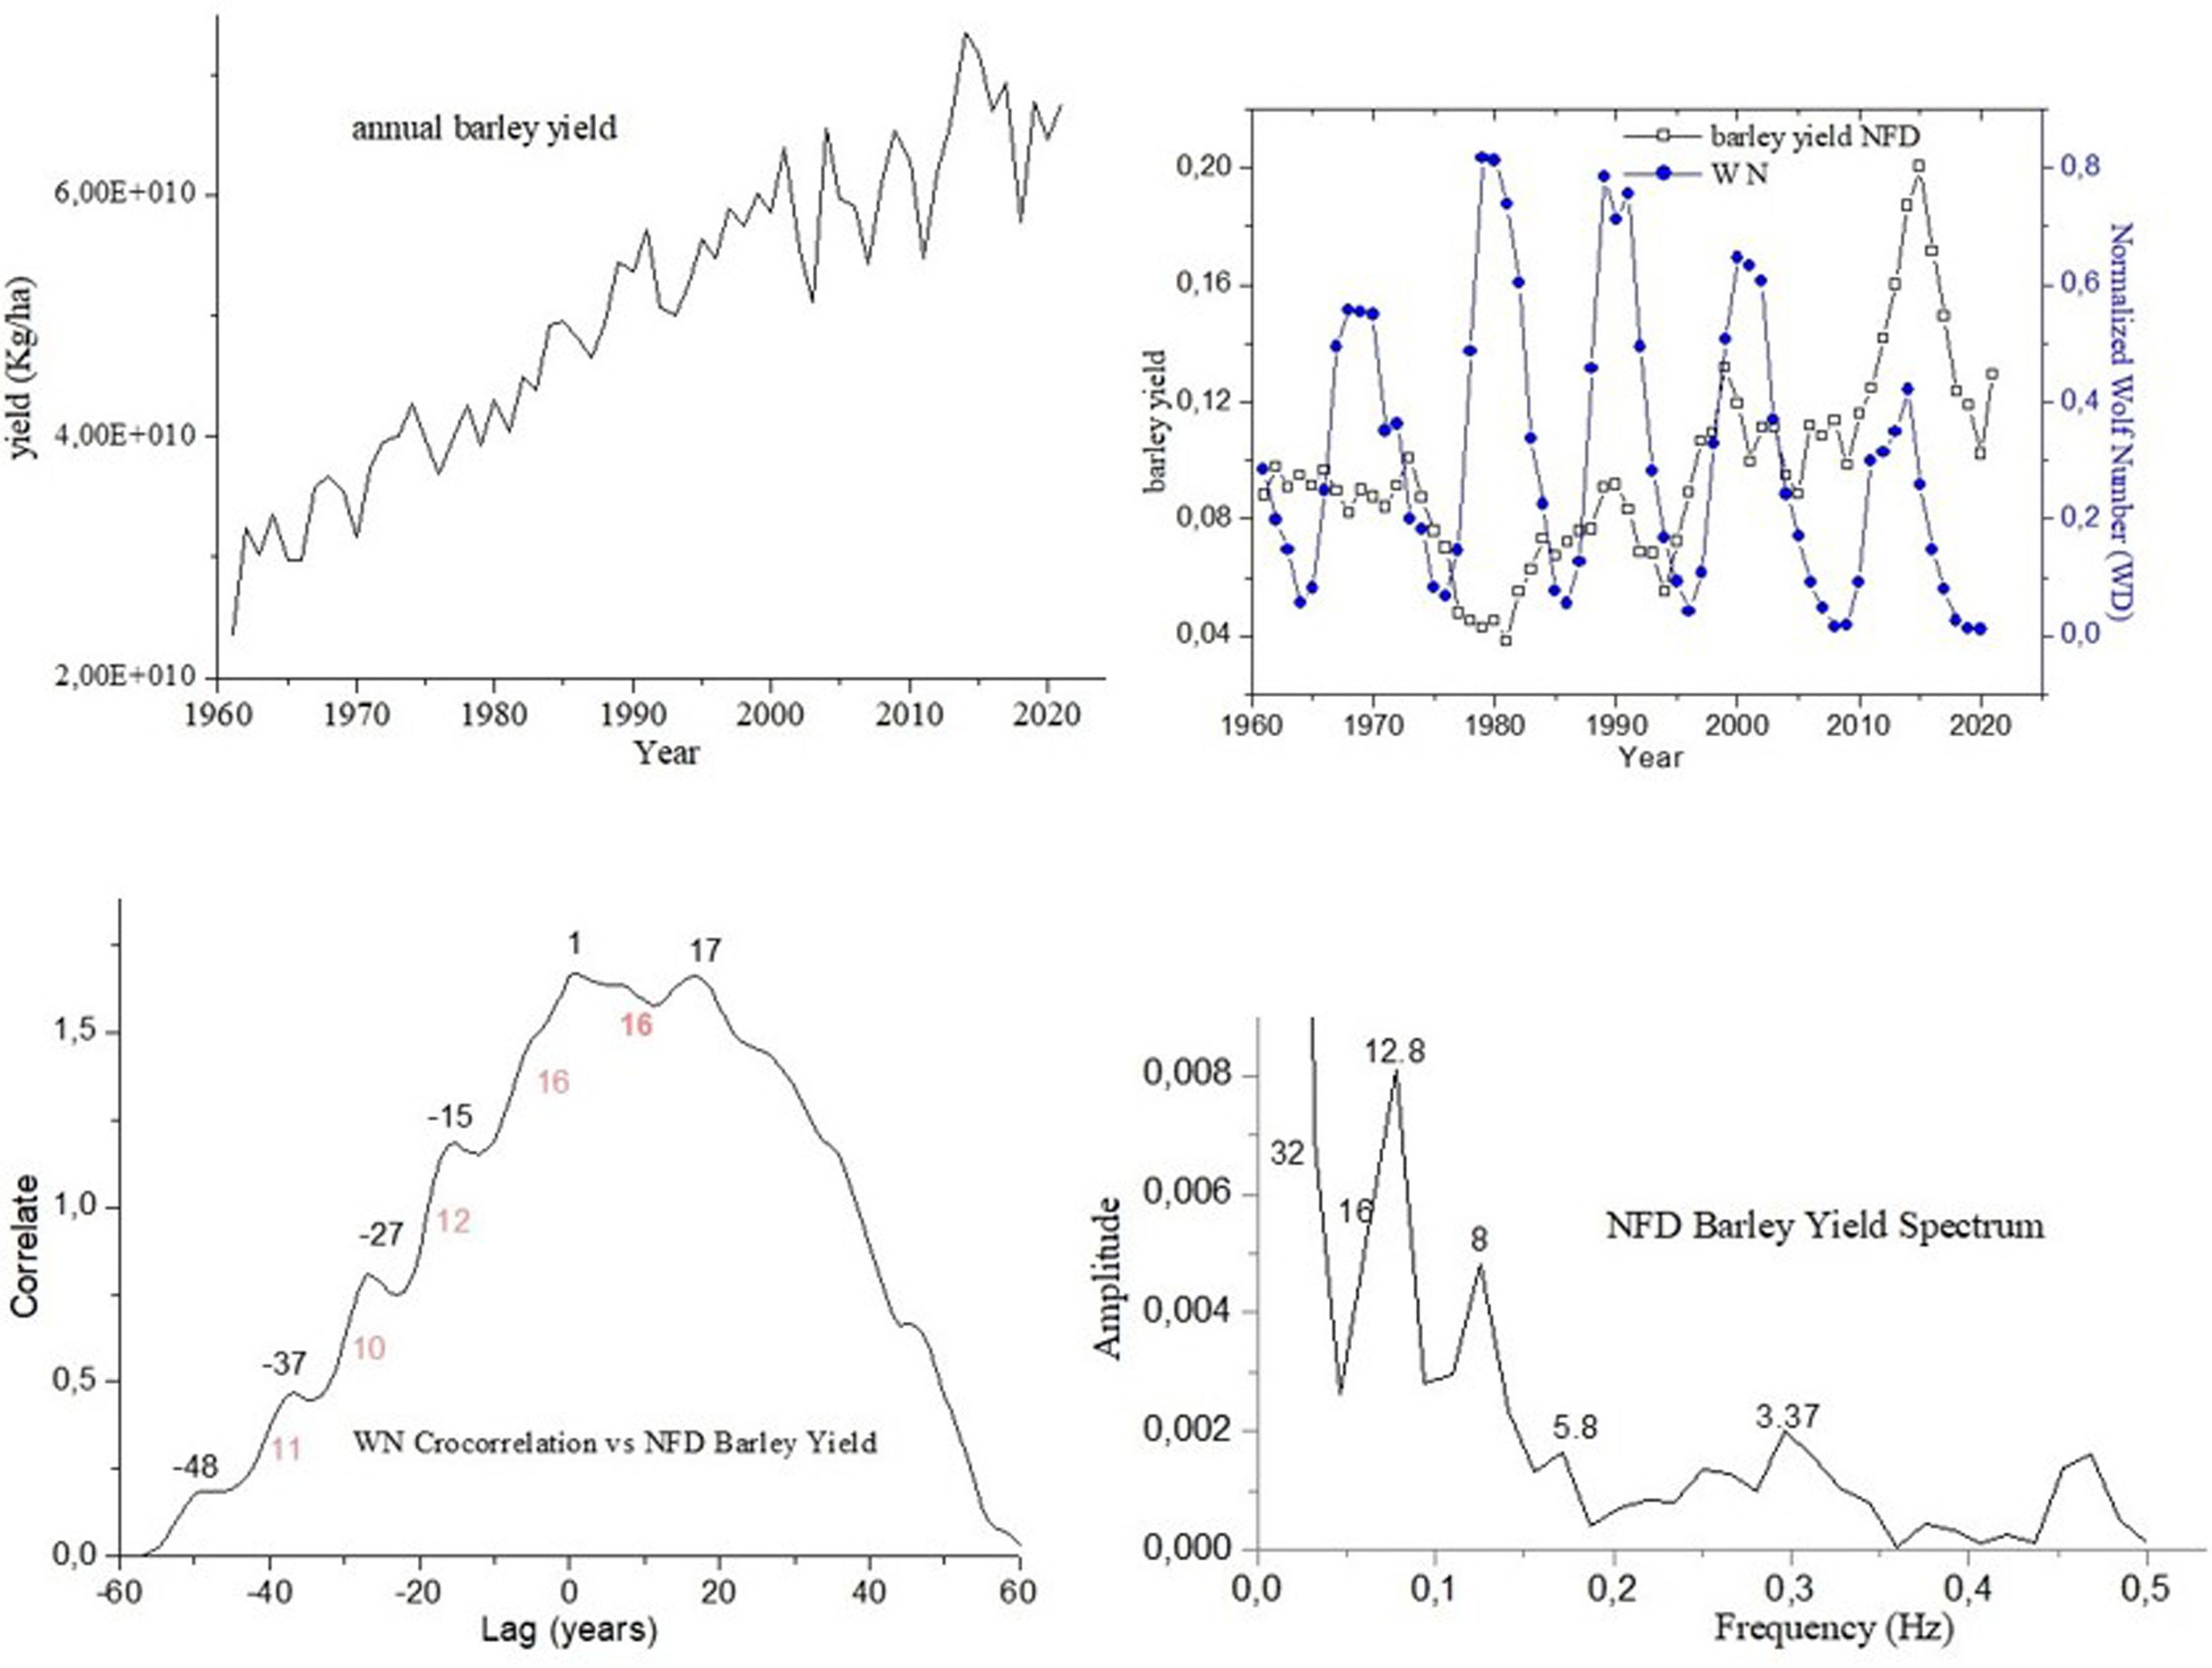
Figure 9. Cross-correlation plot between the yield variable and the solar index W N. Spectral amplitude plot of the normalized, filtered, and detrended yield time series (NFsT) for Wheat.
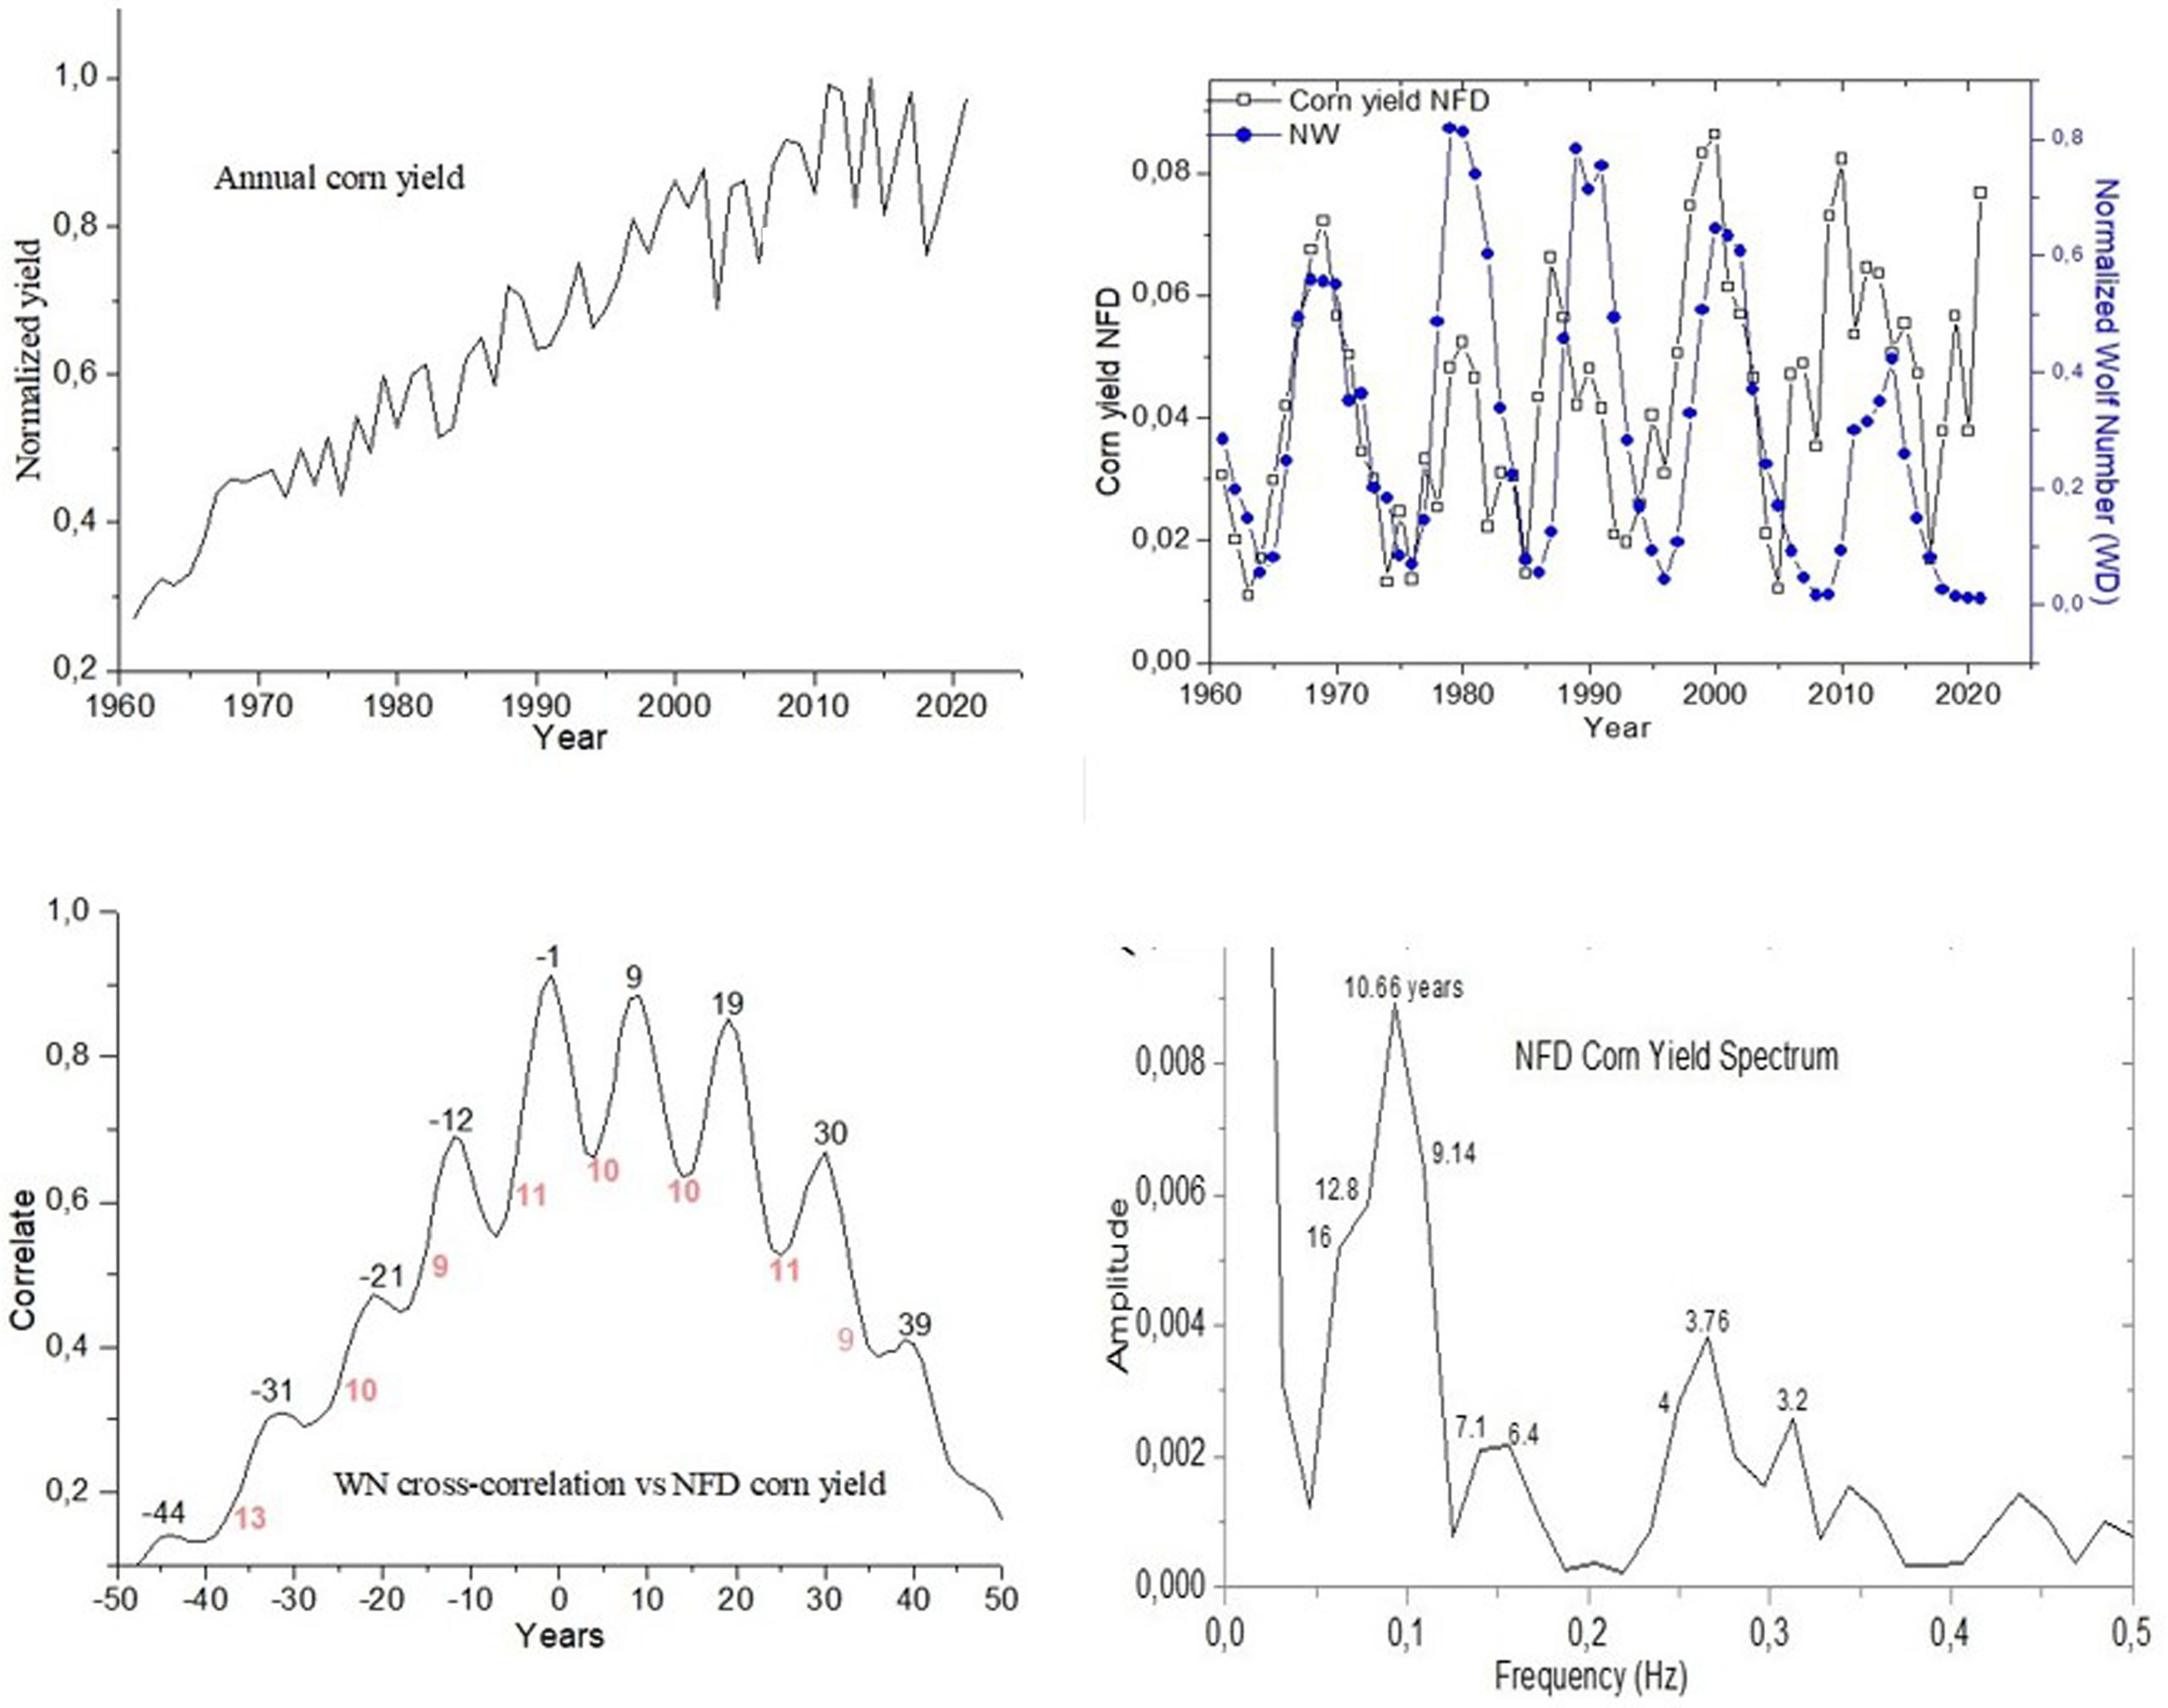
Figure 10. Cross-correlation plot between the yield variable and the solar index WN. Spectral amplitude plot of the normalized, filtered, and detrended yield time series (NFsT) for Cattle (Head).
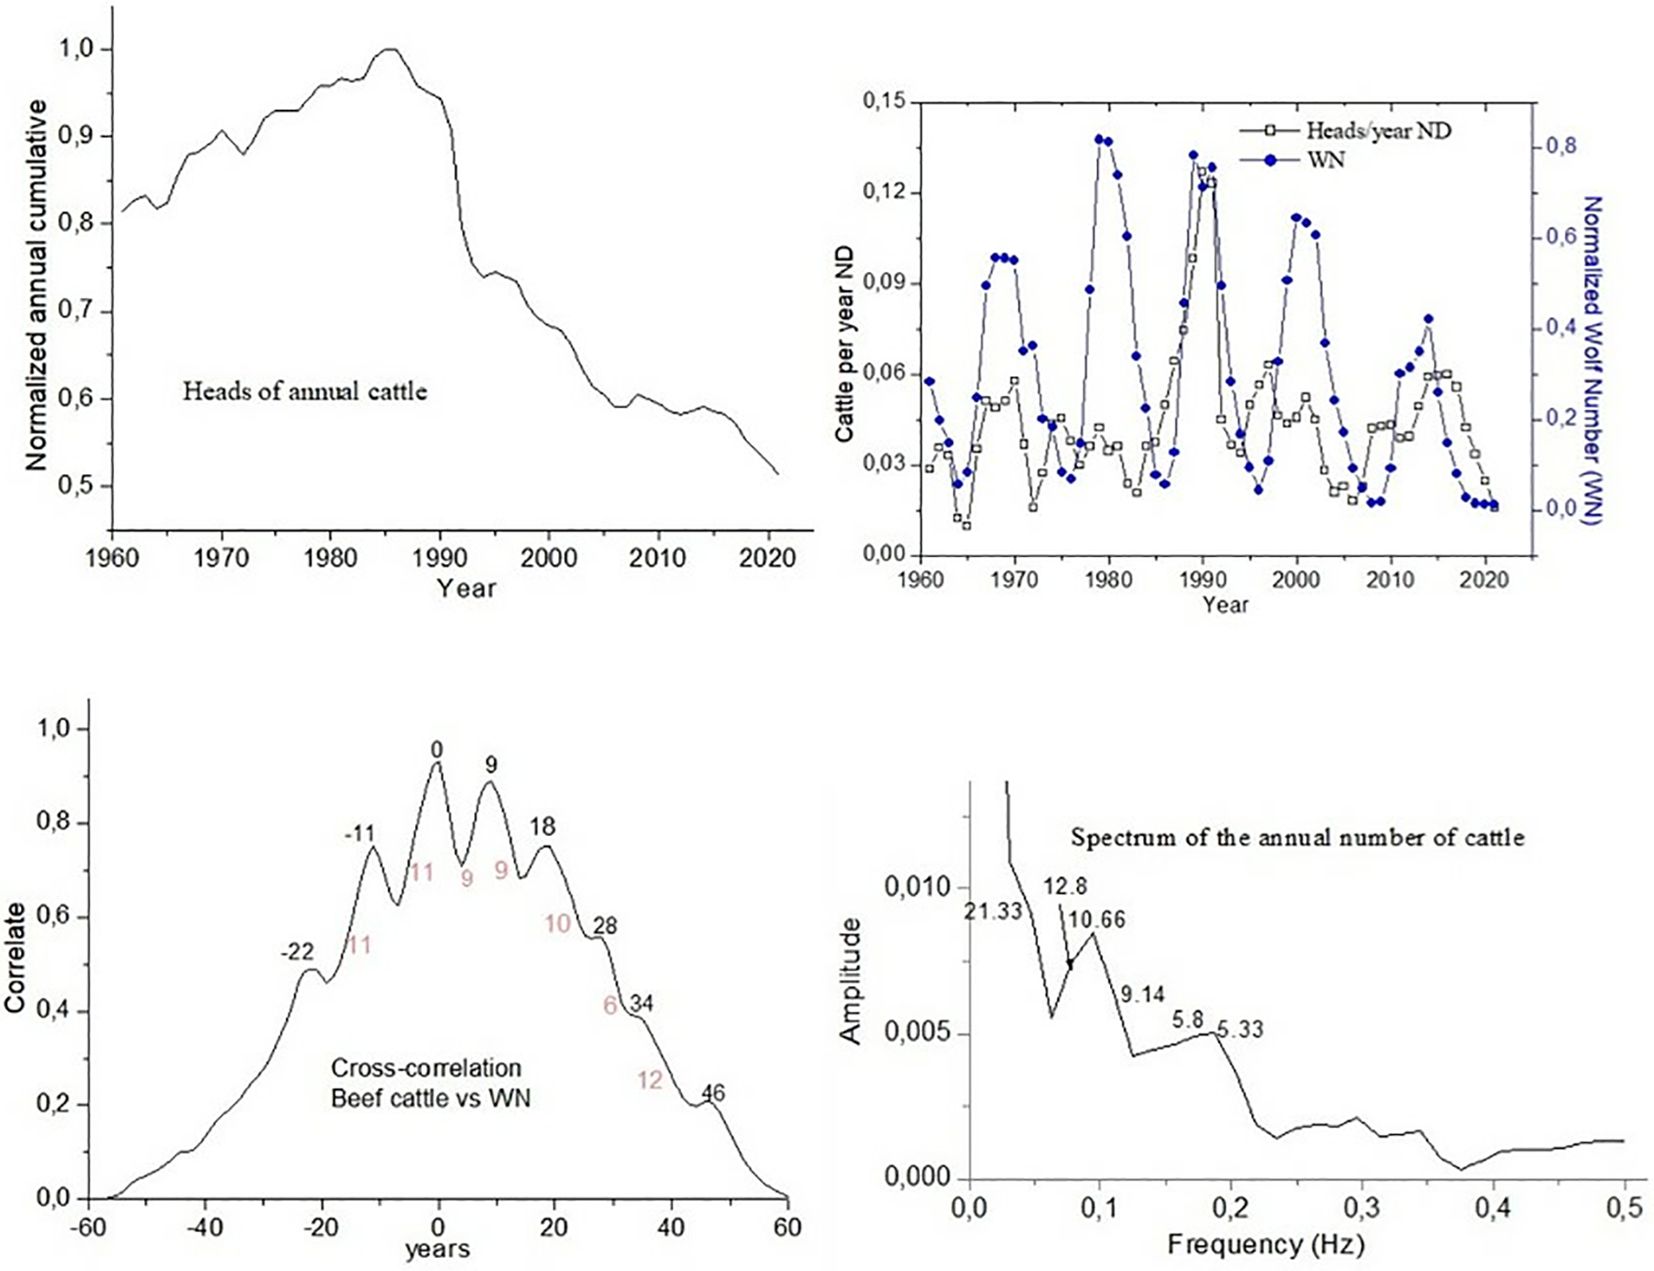
Figure 11. Cross-correlation plot between the yield variable and the solar index WN. Spectral amplitude plot of the normalized, filtered, and detrended yield time series (NFsT) for Meat.
As we can see in Figures 3-11, NFD of Com yield, burley yield, oat yield, rye yield, primary cereals yield, potato yield, wheat yield, cattle yield and annual beef yield are sometimes congruent with normalized Wolf number NFD, meaning that the peak is congruent with both. The next one is reflective, so the peak becomes congruent with the crest. This indicates that changes in agricultural yields are closely linked to perturbation in the Earth’s orbit, which results in a slight disturbance in the Earth’s gravitational pull, as found in the previous study (Mawad, 2017). This makes altitude above sea level an important factor influencing productivity, because each level has a different gravitational effect. Therefore, crops differ between tropical, subtropical, temperate and polar zones, because their levels have a different distance from the Earth’s center, which results in a difference in the amount of gravity, which affects the quantity and quality of the crop.
The correlation with solar activity also confirms that the sun has an impact on agricultural yields in the short and long term. Because the number of sunspots, which represents solar activity is merely an index, it does not affect weather and agriculture per se. However, it is evidence of changes in the amount of radiation and particles ejected from the sun, some of which reach the Earth and affect it, and which often change depending on solar activity (Mawad et al., 2022a; Mawad et al., 2022b).
Figures 3-11 provide a detailed visualization of the synchronization between solar activity and agricultural yields for the 10 key categories analyzed (Mawad, 2017). Key elements include:
-Normalized time series for each crop or livestock category.
-Filtered and detrended series compared with the normalized Wolf Number (W N).
-Cross-correlation analysis identifying peaks that align with solar activity cycles.
-Spectral analysis highlighting periods of 10–12 years, along with secondary harmonics.
Tables 2, 3 summarize the periods identified through spectral and cross-correlation analyses, emphasizing the consistent associations observed across all the products studied.
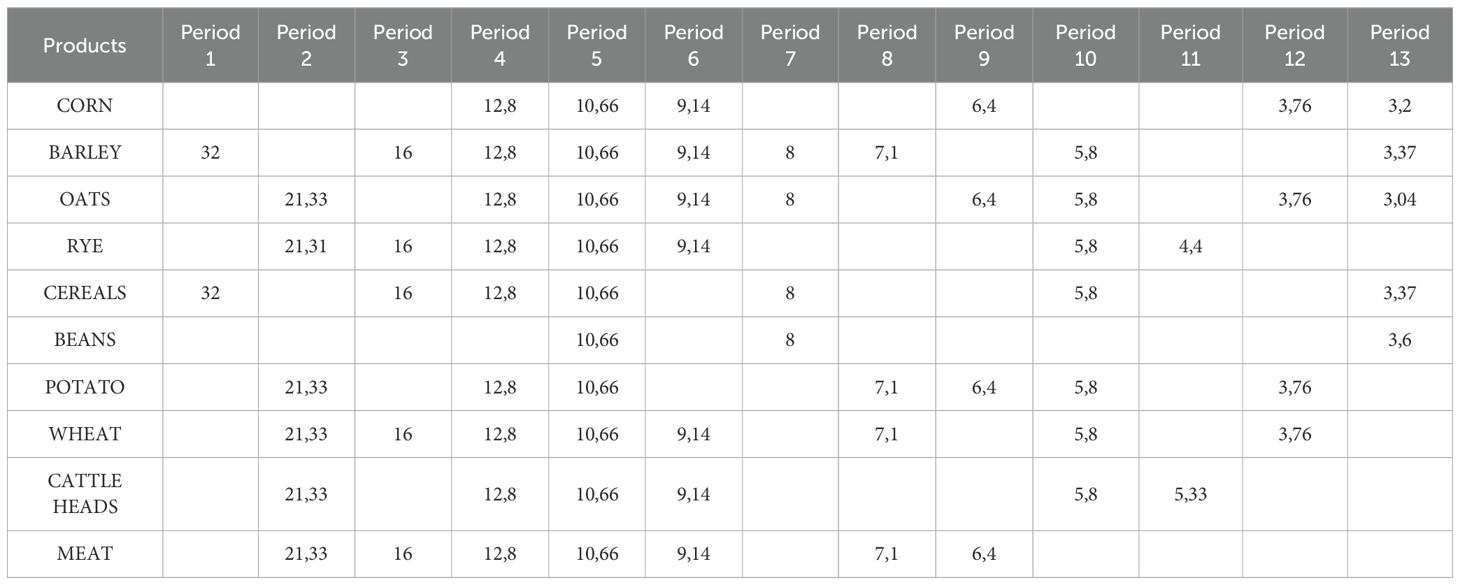
Table 2. Result of the spectral analysis (FFT).
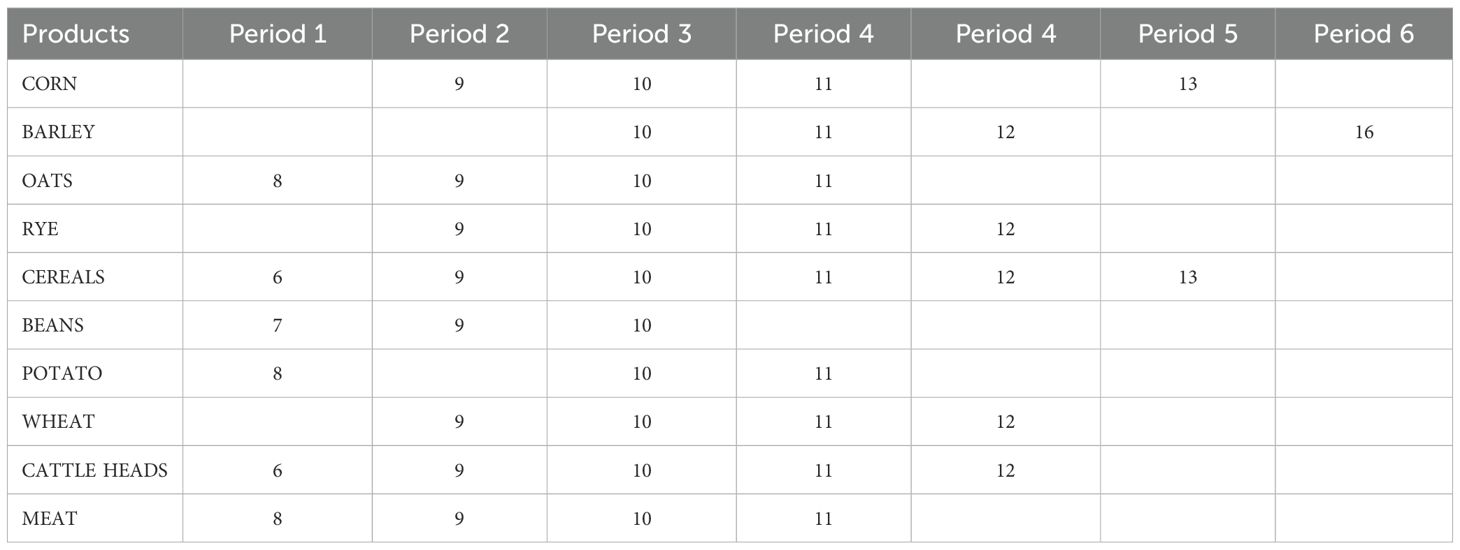
Table 3. Cross-correlation result.
Tables 2, 3 present the numerical results of the spectral analysis and cross-correlation of the data (W vs Yields). In both cases, values corresponding to periods within the range of 10 to 12 years of Solar Activity (as seen in Figure 2) are highlighted in yellow, while associated harmonics are highlighted in green.
Overall, the results indicate a statistically significant synchronization between solar activity cycles and agricultural yields in Germany. The 10.67-year periodicity aligns closely with the 11-year solar cycle, while secondary harmonics at 21.33 and 5.33 years suggest multi-scale interactions between solar activity and agricultural performance. These findings reinforce the hypothesis that solar activity can influence climate-related agricultural variables, potentially affecting long-term crop productivity trends.
4 Discussion
The identification of a clear 10.67-year periodicity in agricultural yields suggests a strong connection between solar activity cycles and crop performance. This study contributes novel empirical evidence by demonstrating that this synchronization is statistically robust and consistent across multiple agricultural categories. These results have implications for improving long-term agricultural planning, particularly in the context of climate variability and food security. Recent evidence has further supported a complex linkage between solar activity and terrestrial variables, particularly in climate-sensitive sectors like regional agriculture (Sierra, 2022).
4.1 Possible mechanisms linking solar activity and agricultural performance
The observed synchronization between solar activity and agricultural yields suggests potential mechanisms involving climatic factors. Solar cycles can influence temperature, precipitation, and cloud cover (Harrison Virden, 1976; Tripathi et al., 2022; Zuniga-Gonzalez, 2025), which are critical for plant growth and agricultural productivity. Although this study did not directly analyze climatic variables, previous research has shown that solar activity can influence atmospheric circulation and cosmic ray activity, which in turn may affect temperature, precipitation, and cloud formation (Harrison Virden, 1976; Vitali et al., 2019; Zuniga-Gonzalez, 2025). However, the precise mechanisms linking solar cycles to agricultural performance remain uncertain. Further studies should employ high-resolution climate models and region-specific data to clarify these pathways and quantify their effects on different crop types. Future research should aim to investigate these mechanisms in greater detail, considering regional variations in climate and agricultural practices (Pustilnik and Yom Din, 2013; Muthanna et al., 2016).
4.2 Comparison with previous studies
The finding of a statistically significant 10.67-year periodicity in agricultural yields, closely aligning with the 11-year solar cycle, is consistent with previous research that has reported associations between solar activity and agricultural cycles (Hathaway David, 2010; Arlt and Vaquero, 2020; Birhan and Tariku, 2021). However, the strength and consistency of this relationship have been shown to vary across different regions and crops (Makarov, 1994; Markov, 2016; Oshimagye and Eweh, 2021). Our results align with previous findings (Sierra et al., 1999; Doyle, 2012; Pustilnik and Yom Din, 2013; Melnik and Drebot, 2019), which suggest that winter crop yields exhibit fluctuations synchronized with phases of solar activity and Space Weather influences. However, our conclusions contrast with those of (Wilson, 1994; Randall, 2008; Evangelista et al., 2022; Sierra et al., 2022), which found no significant correlation. These discrepancies may arise from differences in methodological approaches, the selection of agricultural variables, or regional climate conditions. Further comparative studies are needed to understand how local environmental factors may modulate the solar-agriculture relationship. These discrepancies may be attributed to differences in methodologies, regional climatic variations, or the inclusion of different agricultural products in the analysis (Sierra et al., 2019; Shmelev et al., 2021). Furthermore, the observed time lags in the cross-correlation analysis suggest that the relationship between solar activity and agricultural yields is complex and may involve delayed responses or indirect effects (Li et al., 2009; Sierra-Figueredo et al., 2015; Sierra Figueredo et al., 2015; Sierra et al., 2017).
4.3 Limitations and future research
The findings of this study suggest that solar activity may be a factor to consider in long-term agricultural planning and resource management (Harrison Virden, 1976; Vitali et al., 2019; Sierra et al., 2022). However, it is crucial to acknowledge the limitations of this study and the need for further research before these findings can be directly applied in agricultural decision-making (Sofia, 1985). The periodic patterns and correlations identified in this study could serve as a foundation for developing predictive models of agricultural yields. However, such models must integrate regional variability, account for potential confounding factors, and address the inherent uncertainties in solar activity forecasts. Future research should explore the robustness of these relationships using machine learning techniques and multi-factor climate models to improve prediction accuracy. Additionally, the potential impacts of future climate change scenarios on the relationship between solar activity and agricultural yields should be carefully evaluated (Ormes, 2018; Muthanna et al., 2016; Sierra et al., 2017; Lin et al., 2021).
5 Conclusions
This study presents strong empirical evidence of a statistically significant synchronization between agricultural yields in Germany (1960–2021) and solar activity cycles. The observed 10.67-year periodicity closely aligns with the well-documented 11-year solar cycle, reinforcing the hypothesis that solar variability plays a role in shaping agricultural productivity.
These findings contribute to a growing body of research suggesting that external environmental drivers, beyond traditional climatic factors, can influence long-term agricultural trends. The identification of secondary harmonics suggests that the solar-agriculture relationship may function across multiple timescales, possibly through indirect climate-related mechanisms such as atmospheric circulation shifts or cosmic ray modulation. Understanding these interactions could enhance agricultural forecasting models and adaptive resource management strategies.
These findings highlight the potential value of incorporating solar cycle forecasts into long-term agricultural planning and resource management strategies. However, since this study is based on data from Germany, further research is needed to assess the global applicability of these relationships. The consistency of our results with similar analyses conducted in other regions, particularly in the Americas, strengthens the argument for a broader investigation into the role of solar activity in agricultural productivity. Future studies should explore these interactions across diverse climatic zones and agricultural systems to refine predictive models and inform sustainable agricultural policies. This underscores the importance of considering solar cycles in future agricultural research and potentially in the development of long-term agricultural strategies and policies.
Data availability statement
The datasets generated and/or analyzed during the current study are available in the Mendeley Data repository, V1, DOI https://doi.org/10.17632/pwh57sgwrw.1 (Zúniga-Gonzalez et al., 2023).
Author contributions
PS-F: Conceptualization, Data curation, Formal analysis, Supervision, Visualization, Writing – original draft, Writing – review & editing. AS-S: Formal analysis, Writing – original draft, Conceptualization, Investigation. CZ-G: Conceptualization, Formal analysis, Writing – original draft, Writing – review & editing.
Funding
The author(s) declare that no financial support was received for the research and/or publication of this article.
Conflict of interest
The authors declare that the research was conducted in the absence of any commercial or financial relationships that could be construed as a potential conflict of interest.
Generative AI statement
The author(s) declare that no Generative AI was used in the creation of this manuscript.
Any alternative text (alt text) provided alongside figures in this article has been generated by Frontiers with the support of artificial intelligence and reasonable efforts have been made to ensure accuracy, including review by the authors wherever possible. If you identify any issues, please contact us.
Publisher’s note
All claims expressed in this article are solely those of the authors and do not necessarily represent those of their affiliated organizations, or those of the publisher, the editors and the reviewers. Any product that may be evaluated in this article, or claim that may be made by its manufacturer, is not guaranteed or endorsed by the publisher.
References
Arlt R. and Vaquero J. M. (2020). Historical sunspot records. Living Rev. Sol Phys. 17, 1. doi: 10.1007/s41116-020-0023-y
Birhan M. and Tariku S. (2021). Investigating the impact of space weather on agriculture products over Chokie mountain basin in Ethiopia. Acta Geophys. 69, 1481–1491. doi: 10.1007/s11600-021-00610-9
Clette F., Berghmans D., Vanlommel P., Van der Linden R. A., Koeckelenbergh A., and Wauters L. (2007). From the Wolf number to the International Sunspot Index: 25 years of SIDC. Adv. Space Res. 40, 919–928. doi: 10.1016/j.asr.2006.12.045
Clette F., Svalgaard L., Vaquero J. M., and Cliver E. W. (2014). Revisiting the sunspot number: A 400-year perspective on the solar cycle. Space Sci Rev. 186, 35–103. doi: 10.1007/s11214-014-0074-2
Deschenes L. A. and David A. (2000). Vanden BoutUniversity of Texas, Austin. J. Am. Chem. Soc. 122, 9567–9568. doi: 10.1021/ja004761d
Doyle J. F. (2012). Wave propagation in structures: an FFT-based spectral analysis methodology (Berlin/Heidelberg, Germany: Springer Science & Business Media), p258.
Evangelista H., Echer M. P., and Echer E. (2022). Using wavelet decomposition method to retrieve the solar and the global air temperature signals from Greenland, Andes and East Antarctica δ 18 O ice core records. Anais da Academia Bras. Ciências 94, e20210797. doi: 10.1590/0001-3765202220210797
Harrison Virden L. (1976). Do sunspot cycles affect crop yields? Economic Research Service, U.S. Department of Agriculture. Agric. Economic Rep. 327, 1–17. doi: 10.22004/ag.econ.307575
Li X., Bai H., Wang X., Li L., Cao Y., Wei J., et al. (2011). Identification and validation of rice reference proteins for western blotting. J. Exp. Bot. 62, 4763–4772. doi: 10.1093/jxb/err084
Li K. J., Gao P. X., and Zhan L. S. (2009). Synchronization of hemispheric sunspot activity revisited: wavelet transform analyses. Astrophysical J. 691, 537. doi: 10.1088/0004-637X/691/1/537
Lin Z., Yanfeng L., Hongbin Z., Menggui J., and Xing L. (2021). Influence of solar activity and EI Niño-Southern Oscillation on precipitation extremes, streamflow variability and flooding events in an aridsemiarid region of China. J. ydrology 601, 126630. doi: 10.1016/j.jhydrol.2021.126630
Mac Manus D. H., Rodger C. J., Dalzell M., Thomson A. W., Clilverd M. A., Petersen T., et al. (2017). Long‐term geomagnetically induced current observations in New Zealand: Earth return corrections and geomagnetic field driver. Space Weather 15, 1020–1038. doi: 10.1002/2017SW001635
Makarov V. I. (1994). Global magnetic activity in 22-year solar cycles. Sol Phys. 150, 359–374. doi: 10.1007/BF00712897
Markov I. V. (2016). Crystal growth for beginners: fundamentals of nucleation, crystal growth and epitaxy. World Sci. 3, 85–91. doi: 10.1142/10127
Mawad R. (2017). Coherence between sea level oscillations and orbital perturbations. Earth Space Sci 4, 172–177. doi: 10.1002/2016EA000198
Mawad R., Fathy M., and Ghamry E. (2022a). The Simultaneous Influence of the Solar Wind and Earth’s Magnetic Field on the Weather. Universe 8, 424. doi: 10.3390/universe8080424
Mawad R., Madbouly H., and Mahdy E. (2022b). Solar activity cycles recur epidemic and pandemic viruses: Space weather’s alerts. Al-Azhar Bull. Sci 12), 71–83. doi: 10.21608/absb.2022.149409.1197
Melnik P. and Drebot O. (2019). Production of winter wheat in the phases of solar activity cycle. Scientific Papers Series Management. Economic Eng. Agric. Rural Dev. 19, 53–66.
Muñoz A. L. (2009). Contribución al reconocimiento de huellas dactilares mediante técnicas de correlación y arquitecturas hardware para el aumento de prestaciones (Getafe/Madrid, Spain: Universidad Carlos III de Madrid).
Muthanna A., Al-Tameemi, and Chukin V. (2016). Global weather cycle and solar activity variations. J. Atmospheric Solar-Terrestrial Phys. 142, 55–59. doi: 10.1016/j.jastp.2016.02.023
Ormes J. F. (2018). cosmic rays and climate. Adv. Space Res. 62, 288–2891. doi: 10.1016/j.asr.2017.07.028
Oshimagye I. G. and Eweh E. J. (2021). Investigation of space weather effects on agricultural produce in benue state Nigeria. Environ. Rev. Lett. 6, 1–11. doi: 10.30918/carf.41.21.002
Pellegrini P., Prado S. A., Monzon J. P., Oesterheld M., and Sadras V. O. (2022). Spatial and temporal variation in drought types for wheat in Argentina and its association with actual yield and fertilization rate. Field Crops Res. 280, 108469. doi: 10.1016/j.fcr.2022.108469
Pustilnik L. and Yom Din G. (2013). On possible influence of space weather on agricultural markets: necessary conditions and probable scenarios. Atmospheric and oceanic physics. Astrophysical Bull. 68, 1–18. doi: 10.1134/S1990341313010100
Randall R. B. (2008). “Spectral analysis and correlation,” in Handbook of signal processing in acoustics (Springer New York, New York, NY), 33–52.
Reddy V. U. (1998). On fast fourier transform: a popular tool for spectrum analysis. Resonance 3, 79–88. doi: 10.1007/BF02841425
Rybanský M., Rušin V., and Minarovjech M. (2001). Coronal index of solar activity–Solar-terrestrial research. Space Sci Rev. 95, 227–234. doi: 10.1023/A:1005213525647
Shmelev S. E., Salnikov V., Turulina G., Polyakova S., Tazhibayeva T., Schnitzler T., et al. (2021). Climate change and food security: the impact of some key variables on wheat yield in Kazakhstan. Sustainability 13, 8583. doi: 10.3390/su13158583
Shumway R. H., Stoffer D. S., Shumway R. H., and Stoffer D. S. (2017). ARIMA models. Time series analysis and its applications: with R examples 75–163. doi: 10.1007/978-3-319-52452-8
Sierra P. (2022). Cosmos, sol, biosfera. Actividad Solar, Salud y Rendimiento Agrícola. 50 años de inicio de la “Heliobiología” en Cuba (República de Moldavia: Generis Publishing), p173.
Sierra F. P., Durán S. O., and Sol S. A. (2022). Agricultural yield in Cuba and its synchronism with Space Weather variables. Rev. Iberoamericana Bioeconomía y Cambio Climático 8 (15), 1822–1832. doi: 10.5377/ribcc.v8i15.14296
Sierra P., Marinero E., and Sol S. (2017). Actividad Solar y su asociación con el régimen de lluvias en El Salvador. León, Nicaragua. Rev. iberoam bioecon cambio clim 6, 782–799. doi: 10.5377/ribcc.v3i6.5948
Sierra F. P., Marinero E., Sol A., and Zúniga-González C. (2019). Cane sugar production in El Salvador and its relationship with the variability of Solar and Geomagnetic Activity: An approach to Bioeconomic and Climate Change. Rev. iberoam bioecon cambio Clim. 5, 1209–1221. doi: 10.5377/ribcc.v5i10.8946
Sierra F. P., Sierra F. S., Rodríguez T. R., and Pérez P. A. (1999). Impacto medioambiental de las perturbaciones heliogeofísicas. Consideraciones a partir de Resultados Observacionales. Rev. Geofísica 50, 9–23. doi: 10.1023/A:1005213525647
Sierra-Figueredo P., Marinero-Orantes E. A., Sol-Sanchez A., and Zuniga-González C. A. (2021). Variabilidad de la Producción Cafetalera en El Salvador y su Posible Relación con el Clima Espacial. Rev. Iberoam Bioecon Cambio Clim 7, 1632–1643. doi: 10.5377/ribcc.v7i14.12607
Sierra Figueredo P., Pérez Piñeiro A. M., Durán Zarabozo O., Castellanos-Pontenciano B., and Zaldivar Cruz J. M. (2015). Aspectos a valorar dentro de la bioeconomía y su sendero de eco – intensificación para el buen desempeño de la actividad apícola ante la variabilidad de la Actividad Solar y Geomagnética y los cambios climáticos. Rev. Iberoam Bioecon Cambio Clim 1, 207–222. doi: 10.5377/ribcc.v1i1.2149
Sierra-Figueredo P., Pérez-Piñeiro A., Duran Zarabozo O., Marinero-Orante E. A., and Zaldivar-Cruz J. M. (2015). Análisis del impacto de la Actividad Solar y la variabilidad climática en la productividad apícola para el territorio Cubano. Rev. Iberoam Bioecon Cambio Clim 1, 156–171. doi: 10.5377/ribcc.v1i2.2481
Sierra-Figueredo P., Zúniga-González C. A., Sol-Sánchez A., Duran-Zarboso O., and Marinero-Orantes E. A. (2022). Agricultural production in the United States and its synchronism with the cycles of solar activity. doi: 10.2139/ssrn.4194204
Sofia S. (1985). From solar dynamo to terrestrial climate. Fluctuations in the Suns´s energy may affect climate. Am. Scientist 1985 73, 326. doi: 10.1086/163033
Tripathi D. K., Tripathi R. P., and Tripathi A. K. (2022). “Influences of Solar Activity on Food Grains Yield,” in Computational Advancement in Communication, Circuits and Systems. Lecture Notes in Electrical Engineering, vol. 786 . Eds. Mitra M., Nasipuri M., and Kanjilal M. R. (Springer, Singapore). doi: 10.1007/978-981-16-4035-3_13
Usoskin I. G. (2017). A history of solar activity over millennia. Living Rev. Solar Phys. 14, 3. doi: 10.1007/s41116-017-0006-9
Vitali G., Rogosin S., and Baldoni G. (2019). Climate Change and Grain Production Fluctuations. arXiv preprint arXiv:2002.07039. 11, 1264–1279. doi: 10.7717/peerj.6436
Wilson P. R. (1994). ”Solar and stellar activity cycles” (No. 24) (Cambridge, UK: Cambridge University Press), p135.
Zuniga-Gonzalez C. A. (2025). Food microbiology in the post-COVID-19 era: insights from bibliometric analysis in bioeconomics. Discov. Sustain 6, 19. doi: 10.1007/s43621-024-00659-8
Zuniga-Gonzalez C. A., Quiroga-Canaviri J. L., Brambila-Paz J. J., Ceballos-Pérez S. G., and Rojas-Rojas M. M. (2024). Formulation of an innovative model for the bioeconomy. PloS One 19, e0309358. doi: 10.1371/journal.pone.0309358
Keywords: solar activity, space weather, agricultural performance, time series analysis, FFT (fast Fourier transformation)
Citation: Sierra-Figueredo P, Sol-Sánchez A and Zúniga-González CA (2025) Evidence of synchronization between solar activity and agricultural performance in Germany. Front. Agron. 7:1704837. doi: 10.3389/fagro.2025.1704837
Received: 15 September 2025; Accepted: 20 October 2025;
Published: 14 November 2025.
Edited by:
Jiban Shrestha, Nepal Agricultural Research Council, NepalReviewed by:
Sreten Zlatoje Terzić, LoginEKO Research and Development Center, SerbiaRamy Mawad, Al Azhar University, Egypt
Copyright © 2025 Sierra-Figueredo, Sol-Sánchez and Zúniga-González. This is an open-access article distributed under the terms of the Creative Commons Attribution License (CC BY). The use, distribution or reproduction in other forums is permitted, provided the original author(s) and the copyright owner(s) are credited and that the original publication in this journal is cited, in accordance with accepted academic practice. No use, distribution or reproduction is permitted which does not comply with these terms.
*Correspondence: Carlos Alberto Zúniga-González, Y3p1bmlnYUBjdC51bmFubGVvbi5lZHUubmk=; Angel Sol-Sánchez, c29sQGNvbHBvcy5teA==
†ORCID: Pablo Sierra-Figueredo, orcid.org/0000-0003-1781-0942
Angel Sol-Sánchez, orcid.org/0000-0001-9138-641X
Carlos Alberto Zúniga-González, orcid.org/0000-0002-2545-8304