 Tianliang Li
 Pu Miao2*†
 Te Zhao
- 1College of Plant Protection, Henan Agricultural University, Zhengzhou, China
- 2Luoyang Branch of Henan Tobacco Company, Luoyang, China
- 3Xuchang Branch of Henan Tobacco Company, Xuchang, China
- 4Tobacco Research Institute, Henan Academy of Agricultural Science, Zhengzhou, China
- 5Key Laboratory of Eco-environment and Leaf Tobacco Quality, Zhengzhou Tobacco Research Institute of CNTC, Zhengzhou, China
Introduction: Unmanned aerial vehicles (UAVs) have rapidly developed as efficient plant protection machinery and are widely used for pesticide application across complex terrains. However, optimal operating parameters for UAV spraying in tobacco fields remain insufficiently defined across different growth stages.
Methods: This study assessed the spraying performance of two UAV models, T20P and T40, under multiple combinations of flight height, flight speed, and spray volume. Experiments were conducted during the rosette stage, vigorous growth stage, and maturity stage of tobacco plants. Using a multi-index weighted analysis method, the optimal combinations of operational parameters for different tobacco growth stages were evaluated.
Results and Discussion: The results indicated that variations in operational parameters significantly affected the deposition and distribution of droplets. For T20P, the optimal parameters for the rosette stage were a flight speed of 3 m•s-1, a flight height of 2 m, and a spray volume of 50 L•ha-1. During the vigorous growth stage, the optimal parameters were a flight height of 2.5 m, a flight speed of 4 m•s-1, and a spray volume of 50 L•ha-1. For the maturity stage, the parameters were a flight height of 2.5 m, a flight speed of 3 m•s-1, and a spray volume of 50 L•ha-1. For T40, the optimal parameters for the rosette stage were a flight height of 3 m, a flight speed of 3 m•s-1, and a spray volume of 50 L•ha-1. During the vigorous growth stage, the parameters were a flight height of 3.5 m, a flight speed of 4 m•s-1, and a spray volume of 50 L•ha-1. For the maturity stage, the parameters were a flight height of 3.5 m, a flight speed of 3 m•s-¹, and a spray volume of 50 L•ha-1. By applying these optimized parameters at the corresponding growth stages, a balanced spray performance can be achieved, thereby maximizing pesticide utilization. These findings provide a practical reference for improving droplet deposition and enhancing the effectiveness of UAV pesticide application in tobacco production.
1 Introduction
Tobacco is a major economic crop cultivated worldwide, contributing significantly to the economies of producing countries (Zhao, 2022). As the leading producer, China cultivates approximately 2.1 million tons of tobacco leaves annually, representing nearly one-third of global production (Li et al., 2025). However, tobacco plants are highly susceptible to various diseases and pests throughout their growth cycle, including tobacco mosaic virus, red star disease, green peach aphid (Myzus persicae), and tobacco cutworm (Spodoptera litura) (Natikar and Balikai, 2017; Miao et al., 2025; Sun et al., 2025). These diseases and pests significantly affect tobacco quality, making chemical agents essential in tobacco production. The main spraying equipment used in conventional farming is the manual air-pressure and battery-powered knapsack sprayers (Chen et al., 2021). However, these sprayers exhibit low efficiency, leading to substantial pesticide loss while demanding high labor input, which increases operator exposure risks (Rincón et al., 2017; Delavarpour et al., 2023). There is an urgent need for a new, efficient, and safe application method that minimizes harm to both humans and the environment while addressing labor shortages.
Unmanned Aerial Vehicle (UAV) sprayers have undergone rapid global advancements in recent years, particularly in China and other Asian countries (Zhu et al., 2024). Renowned for their operational safety, ease of deployment, high maneuverability, superior efficiency, and adaptability to various terrains, UAVs are increasingly replacing traditional backpack sprayers in agricultural applications (Xue et al., 2016; Wang et al., 2019a; Pandiselvam et al., 2024; Sreenivas et al., 2024). In China, both academic research and practical applications of UAVs have been advancing rapidly. By 2020, nearly 100,000 crop protection UAVs had been deployed, covering a spraying area of approximately 66 million hectares (Yan et al., 2021). However, the application of UAVs in China’s tobacco production is still in its infancy, and there is an urgent need for reliable UAV application technology for pest and disease control in the tobacco industry. At present, relatively mature UAV application systems have been developed for grain crops such as rice and wheat (Qin et al., 2016; Wang et al., 2019b). However, research on the application of UAVs in tobacco cultivation remains limited. As a high-value cash crop, tobacco exhibits distinct canopy structures compared to grain crops, necessitating systematic optimization tailored to different canopy types and growth stages.
Droplet distribution is a key parameter for evaluating the operational efficiency of UAV pesticide application. During the spraying process, inadequate attention to calibration adjustments, parameter-specific characteristics, and UAV configuration settings often diminishes the precision of droplet delivery to target areas. This oversight can result in pesticide waste and a substantial decrease in pest control effectiveness (Ribeiro et al., 2023). Critical operation parameters, including flight speed, spray volume, and flight height, significantly influence droplet deposition characteristics and pest management outcomes (Li et al., 2021, 2022; Dengeru et al., 2022). Empirical studies indicate height-dependent effects, demonstrating that coverage of the bottom layer of the rice canopy increases within specific operational ranges (0.8–1.5 m in height and 3–5 m·s-1 in speed) as elevation and velocity rise (Qin et al., 2016). Increased flight speed (5.0 and 6.7 m·s-1 for the TTA M4E and DJI Agras T30, respectively), combined with greater height (3.0 m for both UAVs), have been shown to enhance droplet distribution uniformity (Byers et al., 2024). High flight speeds (3 m·s-1) enhanced spray deposition on the canopy and reduced spray loss. However, low spray volume (53.0 L·ha-1) was insufficient to achieve adequate droplet deposition density (Biglia et al., 2022). Menechini et al. compared the effects of various spray volumes (7.5, 13.5, 20, and 30.3 L·ha-1) on maize disease control using fungicides and found that a spray volume of 30.3 L·ha-1 resulted in the highest coverage rate (Menechini et al., 2017). Shi et al. examined the influence of UAV operating parameters on droplet deposition within the tobacco canopy across different growth stages. Results indicate that flight altitude significantly affects droplet deposition at all growth stages, while spray volume significantly influences droplet coverage during the rosette stage and maturity stage (Shi et al., 2024). These findings highlight that optimizing UAV operational parameters is essential for improving application efficiency. However, existing research on UAV spraying in tobacco production lacks systematic optimization across different growth stages and UAV models.
This study aimed to examine the droplet deposition levels of two UAVs under varying operation parameters, including flight height, spray volume, and flight speed, and to elucidate their relationship with deposition performance. Flight experiments were conducted across three growth stages of tobacco (rosette, vigorous growth, and maturity) to compare droplet deposition indicators (deposition and coverage) between two types of UAV spraying. A comprehensive multi-indicator analysis was then conducted to determine the optimal operation parameters for each UAV type at each stage of tobacco growth.
2 Materials and methods
2.1 Experimental sites and crop
Field experiments were conducted at a tobacco cultivation site in Xuchang City, Henan Province, China (33°49′25″N, 113°41′38″E). The location featured flat terrain and uniform tobacco growth, making it ideal for pesticide application trials using UAVs. The experiments used Yunyan 87, a major tobacco variety in China, transplanted on April 20, 2022. The plants were spaced at 1.2 m between rows and 0.55 m within rows, resulting in a planting density of 15,500 plants per hectare. Flight experiments were conducted on May 15, June 20, and August 2, 2022, corresponding to the rosette, vigorous growth, and maturity stages of tobacco, respectively. The average tobacco heights at these stages were 28.7 ± 4.8 cm (rosette), 78.2 ± 5.6 cm (vigorous growth), and 108.6 ± 7.5 cm (maturity).
2.2 Spray equipment and chemicals
Two commercial UAVs, the T20P and T40 (DJI Technology Co., Ltd., Shenzhen, China), were utilized in this study. The T40 spraying system features two centrifugal nozzles (LX8060SZ) and a 40-liter pesticide tank, while the T20P spraying system includes two centrifugal nozzles (LX8060SZ) and a 20-liter pesticide tank. The specific parameters of both UAVs are presented in Table 1. An aqueous solution containing 0.05% Allura Red (85% purity; Beijing Boao Toda Technology Co., Ltd., Beijing, China) was employed as a tracer to assess droplet deposition in this study.

Table 1. The main parameters of T20P and T40 unmanned aerial vehicles.
2.3 Basic operational process of UAVs
To ensure the accuracy of the outdoor wind field tests, all experiments were conducted under ambient wind conditions not exceeding 1.0 m·s-1. During testing, the UAVs followed a predetermined flight path and operated autonomously within the designated test area, flying directly above the tobacco rows with a spray width of 4.0 m. A YG-BX portable meteorological station (Chenyun Technology Co., Ltd., Wuhan, China) continuously monitored meteorological parameters throughout the UAV operations. Flight data were deemed valid and recorded only when wind speed and direction along individual flight paths remained within acceptable thresholds. Meteorological sensors were positioned 1.8 m above ground level and placed 25.0 m from the experimental area to minimize airflow interference from UAV operations. For all valid flight records, temperature, relative humidity, and wind speed ranged from 26 to 30 °C, 30% to 57%, and 0.3 to 0.9 m·s-1, respectively.
2.4 Experimental design
To determine the optimal UAV operating parameters for different stages of tobacco growth, field experiments were conducted during the rosette, vigorous growth, and maturity stages. Based on the T20P and T40 characteristics, both were designed with 27 treatments (Table 2). All treatments were applied during the rosette stage of tobacco. During the vigorous growth and maturity stages, several treatments that showed poor spray performance in the earlier phase were excluded from further evaluation. All treatments were conducted within the same plot, measuring 30 m in length and 20 m in width, with a total area of approximately 600 m².

Table 2. Treatments for the effect of operation parameters of T20P and T40 on the deposition performance.
Water-sensitive paper (WSP; 26 × 76 mm; Syngenta Crop Protection AG, Basel, Switzerland) was utilized to evaluate droplet deposition. Along the vertical direction of the UAV flight path, three parallel sampling strips, each 14 meters in length and containing 15 sampling points, were established (Figure 1A). At each sampling point, sampling rods were inserted, and the WSPs, along with filter papers, were secured using double-headed clamps. The height of the clamps was adjusted to position the WSPs within the upper, middle, and lower canopy layers of tobacco plants (Figure 1B). During the rosette stage, because the plants were relatively short, droplet distribution was assessed only in the upper canopy. The sampler was positioned 30 cm above the ridge surface at the upper part of the tobacco plant. In the vigorous growth stage, samplers were placed at the upper, middle, and lower parts of the plants, corresponding to heights of 80 cm, 60 cm, and 30 cm above the ridge, respectively. During the maturity stage, the upper leaves become excessively large and dense, hindering droplet penetration into the lower canopy. Therefore, only droplet deposition in the upper canopy was assessed, with the sampler placed 120 cm above the ridge surface in the upper portion of the plant. After each flight, enough time was allowed for the droplets deposited on the WSP to dry (∼ 10 min). The WSPs were then promptly collected, sealed in self-sealing bags, and transported to the laboratory for deposition analysis.

Figure 1. Experimental setup. (A) Arrangement of sampling points; (B) Arrangement of water-sensitive paper.
2.5 Characterization of the spray deposition
2.5.1 Sampling of spray deposition
The WSPs were scanned using a G645 scanner (Shanghai Microtek Technology Co., Ltd., Shanghai, China) to produce 600 dpi grayscale images. These images were subsequently processed with DepositScan software (USDA, Wooster, OH, USA) to quantify droplet deposition parameters, including coverage, density, and size. For the analysis of filter paper, 20.0 mL of deionized water was added to each resealable bag containing the filter paper, and the samples were agitated at 200 rpm for 5 minutes using a TS-1000 orbital shaker (KylinBell Lab Instruments Co., Ltd., Haimen, China) to ensure complete dissolution of the tracers. The tracer concentration was determined by measuring absorbance at 514 nm with a Varioskan Flash multifunctional fluorescence spectrophotometer (Bio-Rad, Hercules, CA, USA). Spray deposition per unit area was then calculated based on the absorbance values using Equation 1 (Lou et al., 2018).
The βdep is the spray deposition in μL·cm-2; ρsmpl is the fluorescence meter reading of the eluent; ρblk is the fluorescence meter reading of the blank sampler; Fcal is the relationship coefficient between the fluorescence meter reading and the tracer concentration; Vdil is the volume of the diluted tracer solution from the collector in L; ρspray is the tracer concentration in the spray liquid in g·L-1; Acol is the projected area of the collector for capturing spray deposition in cm2.
2.5.2 Droplet distribution uniformity
The uniformity of droplet distribution directly influences the spatial distribution of pesticide droplets. In this study, differences in droplet deposition on the tobacco canopy were evaluated using the coefficient of variation (CV) as an indicator of droplet distribution uniformity. A smaller CV value indicates better uniformity of droplet deposition. The computational equations are Equation 2 and 3 (Li et al., 2022):
Where SD is the standard deviation; X means the average data of droplet; Xi is the data of droplet per square centimeter of WSP; n is the total number of WSP pieces in each UAV treatment.
2.5.3 Spray penetration
During the vigorous growth stage of tobacco, we evaluated mist droplet distribution across the upper, middle, and lower canopy layers. The penetration efficiency of mist droplets within different canopy layers was calculated using Equation 4 to assess the uniformity of UAV droplet distribution.
In the Equation, DP (%) represents the percentage value used to determine the penetration of UAV sprayer droplets; Ds, Dm and Db represent the upper, middle, and lower canopy droplet deposition (μL·cm-2), respectively. The higher the DP value, the better the canopy penetration effect.
2.5.4 Comparative analysis of overall spray effectiveness of sprays
A multi-index analysis method was employed to comprehensively evaluate the spraying effect. Based on the relative influence of each index, different weighting coefficients were assigned. Droplet uniformity was converted into a reciprocal form and subsequently normalized before applying weighted calculations. Each index was assigned a maximum score of 100 points, which were then weighted and summed. The calculation of the comprehensive value (Equation 5) and the allocation of indicator weights were performed following the methodology proposed by Shi et al (Shi et al., 2024):
Among these indicators, “comprehensive” denotes the overall spraying effect, “DD” represents droplet deposition, “DC” indicates coverage, “CV” reflects uniformity, and “DP” refers to penetration. The subscript “max” indicates the maximum attainable value for each indicator. During the rosette and maturity stages, droplet penetration (DP) was excluded from consideration because it has minimal influence on spray effectiveness at these growth stages. Deposition and coverage are assigned slightly higher weights than uniformity to reflect their relatively greater importance in achieving effective pesticide deposition and coverage at these stages. Therefore, the weighting coefficients w1, w2, and w3 were set to 0.35, 0.35, and 0.30, respectively. In contrast, during the vigorous growth stage of tobacco, all four indicators are considered, each assigned an equal weight of 0.25.
2.6 Statistical analysis
All statistical analyses were performed using SPSS Statistics 19 (IBM Corp., Armonk, NY, USA), and all figures were created with Origin 2022 (Origin Lab Corp., Northampton, MA, USA). The Shapiro-Wilk test was applied to evaluate whether the sedimentary data followed a normal distribution. The effects of flight height, flight speed, and spray volume on droplet deposition were analyzed using one-way analysis of variance (ANOVA). Post hoc multiple comparisons were conducted with Duncan’s test, and statistical significance was set at α = 0.05.
3 Results
3.1 Droplet distribution of T20P during the rosette stage of tobacco
Given the limited size of seedlings during the tobacco rosette stage, only the performance of upper-layer deposition was evaluated. The deposition characteristics of T20P under various parameter configurations at this stage are illustrated in Figure 2. Table 3 shows the results of the analysis of variance for each treatment. Flight height significantly affected droplet deposition and coverage on the tobacco canopy (p < 0.01). When the flight height increased from 2 m to 3 m, the average droplet deposition on the tobacco canopy decreased from 0.33 μL·cm-2 to 0.25 μL·cm-2. During the rosette stage, tobacco plants are relatively short, and their low canopy height facilitates droplet deposition. The average coverage was highest at a flight height of 2.5 m, at 8.04%. At the same time, the spray volume had a significant effect on droplet coverage (p < 0.01). When the spray volume increased from 17 L·ha-1 to 50 L·ha-1, the average droplet coverage increased from 4.03% to 9.92%. Flight height exerted the greatest influence on droplet deposition uniformity (F = 1.391). At a flight height of 2.5 m, droplet distribution was the most uniform, with an average coefficient of variation (CV) of 22.80%.
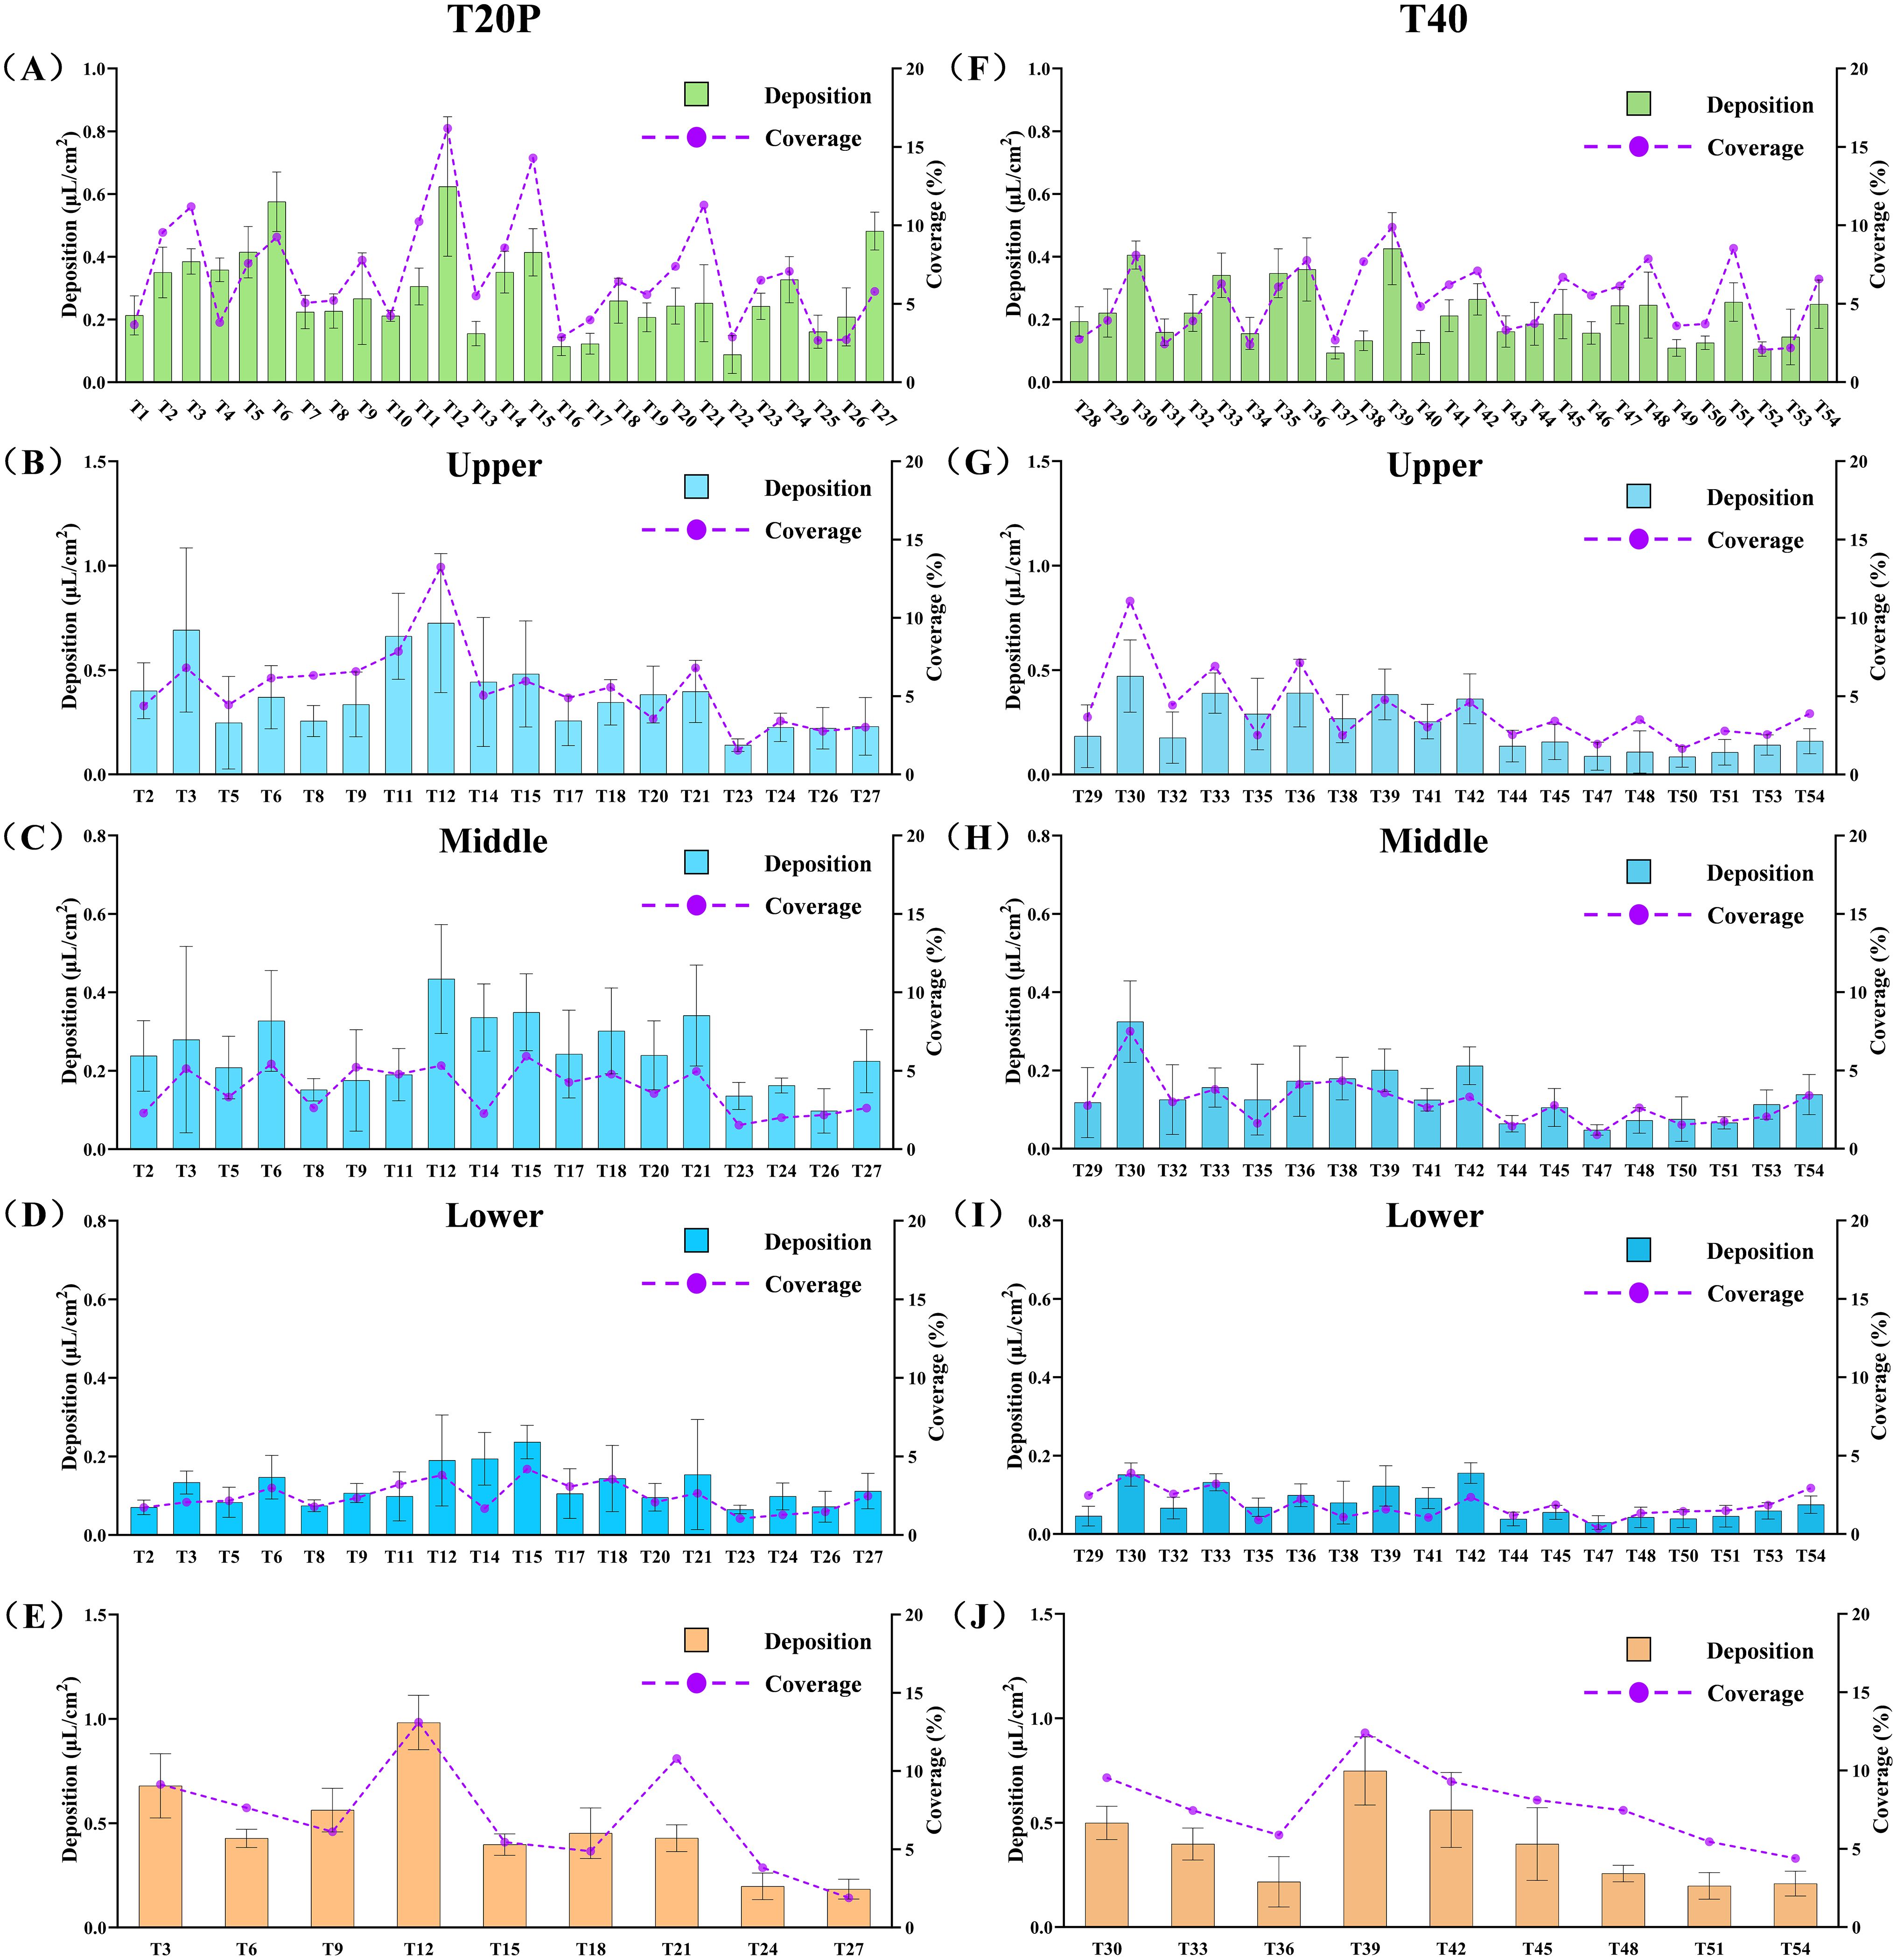
Figure 2. Deposition and coverage of droplets within the canopy of tobacco leaves under different operation parameters for the two UAVs: (A, F) rosette stage, (B–D, G–I) vigorous growth stage, (E, J) maturity stage. Data are expressed as mean ± SD.

Table 3. ANOVA results for droplet distribution characteristics in the rosette stage (T20P).
3.2 Droplet distribution of T40 during the rosette stage of tobacco
The droplet deposition on tobacco at the rosette stage under different operation parameters of the T40 is presented in (Figure 2F), while the analysis of variance results is provided in Table 4. Spray volume had a significant effect on droplet deposition and coverage on the tobacco canopy (p < 0.05). As the spray volume increased from 17 L·ha-1 to 50 L·ha-1, the average droplet deposition on the tobacco canopy rose from 0.14 μL·cm-² to 0.31 μL·cm-², and the average droplet coverage increased from 3.35% to 7.64%. Increased spray volume enhances droplet deposition and coverage. Among all operational parameters, flight speed exerts the greatest influence on droplet uniformity (F = 3.174). At a flight speed of 4 m·s⁻¹, droplet distribution is most uniform, corresponding to the lowest average CV of only 24.16%.

Table 4. ANOVA results for droplet distribution characteristics in the rosette stage (T40).
3.3 Droplet distribution of T20P during the vigorous growth stage of tobacco
We observed that, at a spray volume of 17 L·ha⁻¹ during the rosette stage, droplet deposition and coverage were relatively low. Consequently, this treatment was omitted during the vigorous growth stage. The distribution of droplets within the tobacco canopy under different operation parameters of the T20P during the vigorous growth stage is shown in (Figures 2B–D), and the results of the analysis of variance (ANOVA) are presented in Table 5. The average droplet deposition in the upper canopy ranged from 0.140 to 0.725 μL·cm-². ANOVA results indicated that flight speed significantly affected droplet deposition in the upper canopy (p < 0.01). Flight speed was negatively correlated with droplet deposition: when the flight speed was 3 m·s-1, the average deposition in the upper canopy was 0.54 μL·cm-², whereas at 5 m·s-1, the average deposition decreased to 0.27 μL·cm-². The average droplet deposition in the middle canopy ranged from 0.098 to 0.434 μL·cm-². Analysis of variance indicated that spray volume significantly affected droplet deposition in the middle canopy (p < 0.05). When the spray volume increased from 33 L·ha-1 to 50 L·ha-1, the average deposition in the middle canopy increased by 45%. In the lower canopy, average droplet deposition ranged from 0.065 to 0.237 μL·cm-². Analysis of variance showed that flight height significantly influenced droplet deposition in the lower canopy (p < 0.05), with the highest average deposition occurring at a flight height of 2 m. Spray volume also had a significant effect (p < 0.05). Increasing the spray volume from 33 L·ha-1 to 50 L·ha-1 increased the average droplet deposition in the lower canopy from 0.10 μL·cm-² to 0.15 μL·cm-².
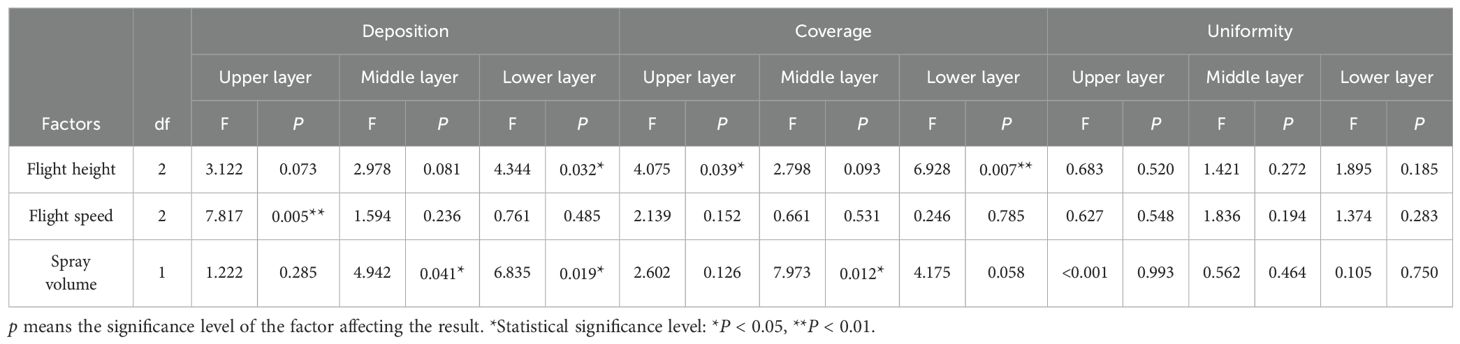
Table 5. ANOVA results for droplet distribution characteristics in the vigorous growth stage (T20P).
The results of the analysis of variance showed that flight height significantly affected the coverage of droplets in the upper and lower canopy layers (p < 0.05). At a flight height of 2.5 m, the average coverage of droplets in the upper and lower canopy layers was 7.09% and 3.26%, respectively, which was higher than the average coverage at flight heights of 2 m and 3 m. The spray volume significantly affected the coverage of droplets in the middle canopy layer (p < 0.05). When the spray volume increased from 33 L·ha-1 to 50 L·ha-1, the average coverage of droplets in the middle canopy increased from 2.98% to 4.60%. None of the operating parameters significantly affected droplet uniformity (Table 5). Flight height had the strongest influence on droplet distribution in both the upper (F = 0.683) and lower canopy (F = 1.895). At a flight height of 3 m, the upper canopy exhibited the lowest average CV, at 38.20%. In contrast, at a flight height of 2 m, the lower canopy showed the lowest average CV, at 29.02%. These results suggest that increasing flight height reduces downwash airflow intensity, thereby improving droplet uniformity in the upper canopy. Conversely, reducing height enhances downwash airflow disturbance within the lower canopy, promoting more uniform droplet deposition in the lower layer. Flight speed had the greatest influence on droplet uniformity in the middle canopy layer (F = 1.836). At a flight velocity of 4 m·s⁻¹, the average CV in the middle canopy layer was the lowest, at 32.41%.
By analyzing droplet distribution in different canopies, the impact of operational parameters on droplet penetration can be assessed. During the vigorous growth stage of tobacco, droplet penetration under different T20P parameter settings is presented in Figure 3. As shown, higher spray volumes corresponded to stronger droplet penetration. Overall, at a flight speed of 4 m·s-1, droplets exhibited relatively greater penetration. The highest penetration efficiency was observed at a flight height of 2.5 m, a flight speed of 4 m·s-1, and a spray volume of 50 L·ha-1.
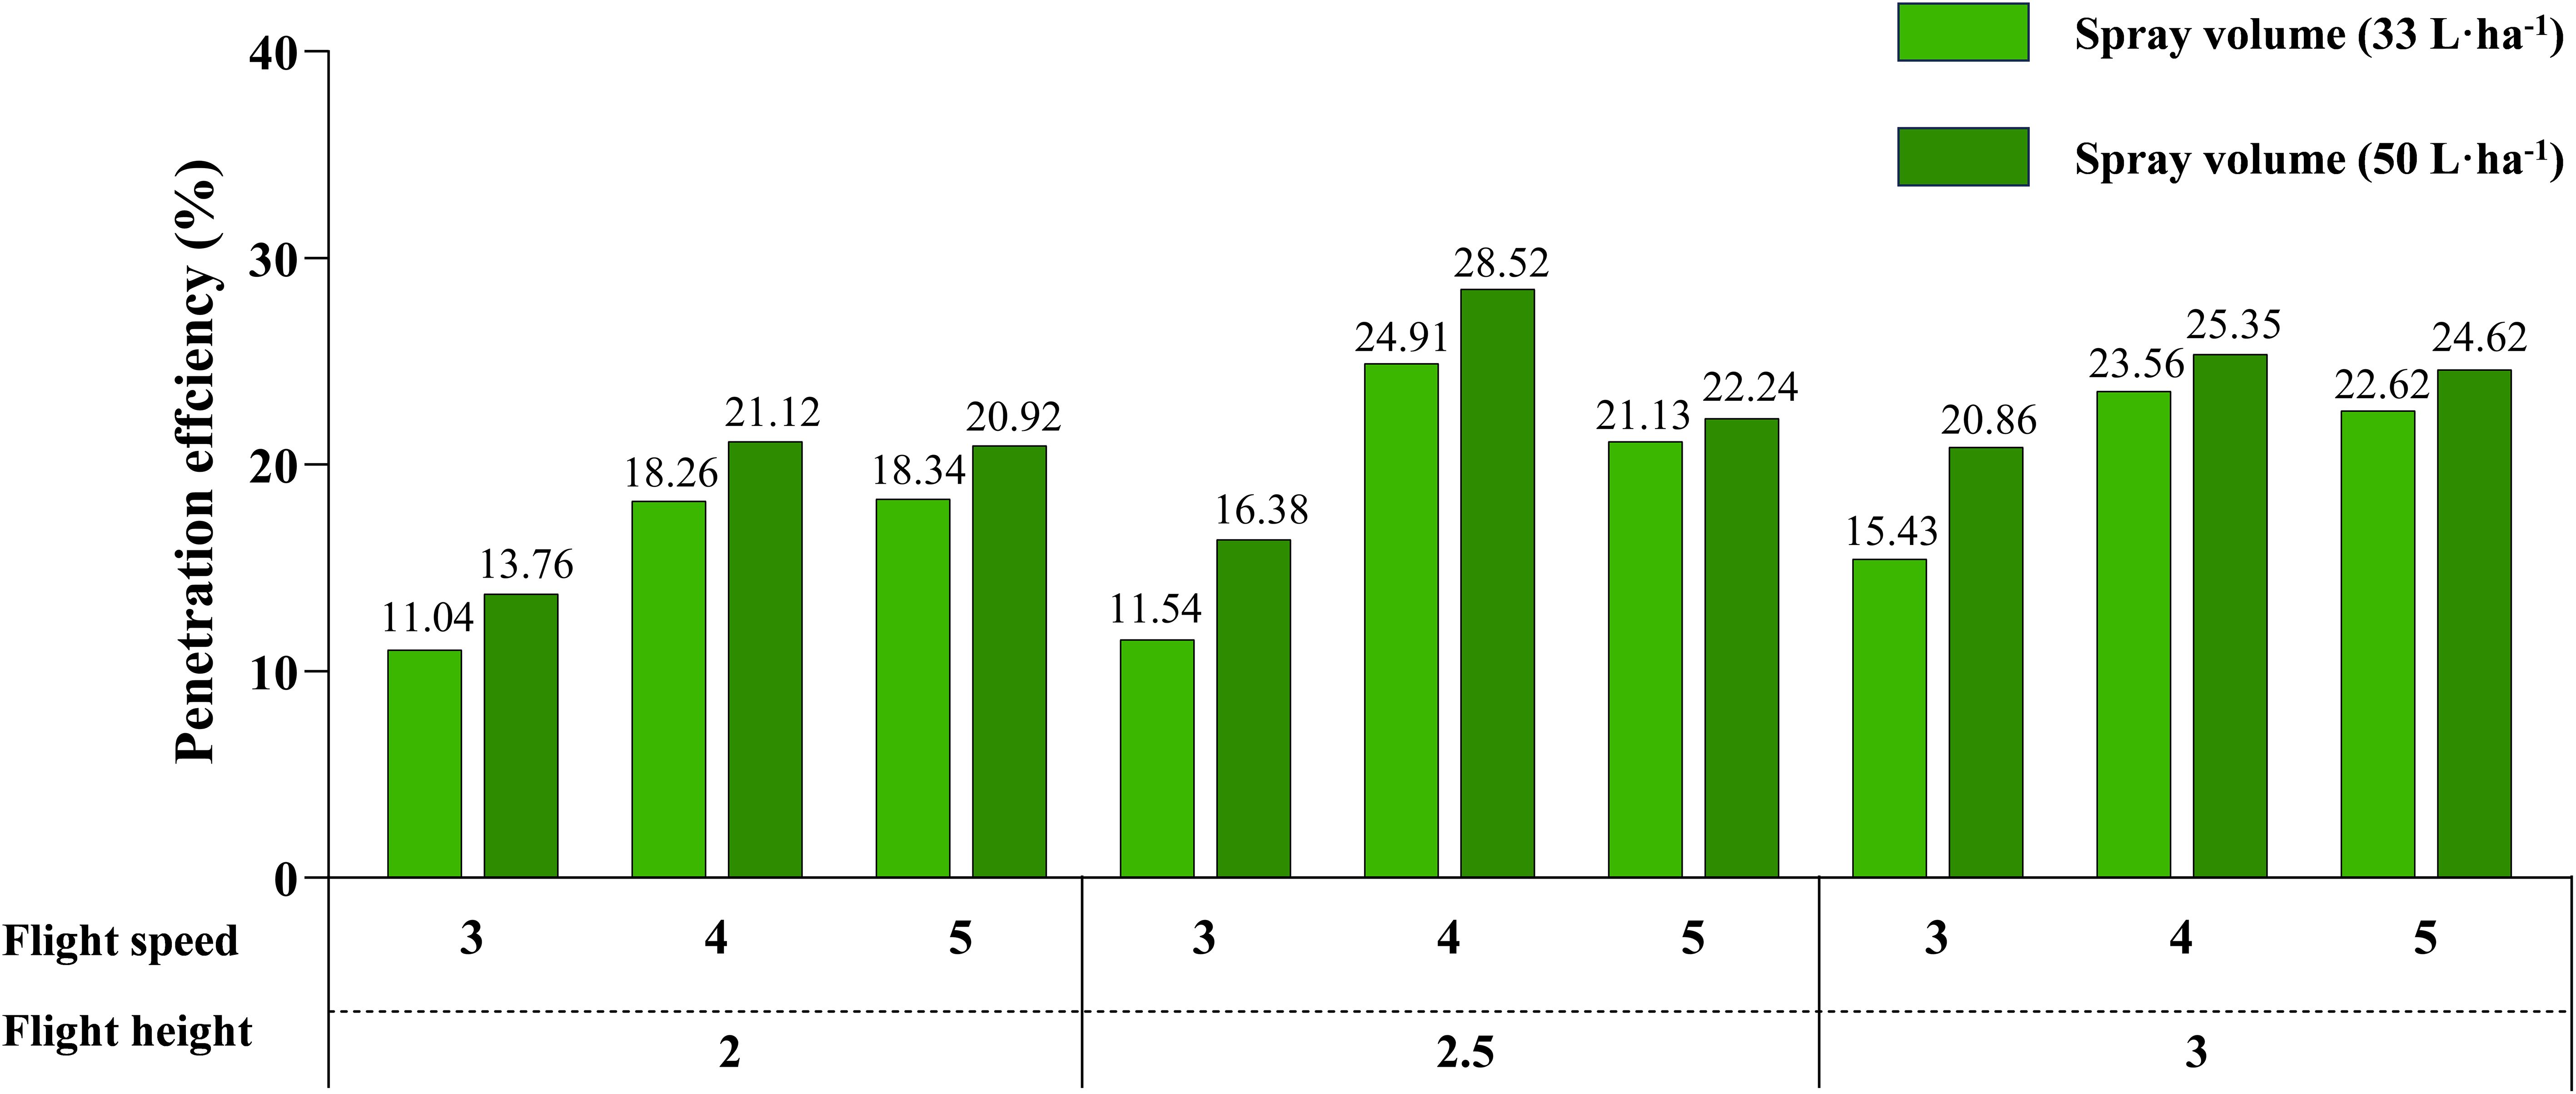
Figure 3. Penetration efficiency of tobacco canopy for different treatments (T20P).
3.4 Droplet distribution of T40 during the vigorous growth stage of tobacco
The droplet deposition in different canopy layers during the vigorous growth stage of tobacco under various operational parameters of T40 is presented in (Figures 2G–I), while the results of the ANOVA are shown in Table 6. The average droplet deposition in the upper canopy ranged from 0.086 to 0.471 μL·cm-². ANOVA results indicated that flight height significantly affected droplet deposition in the upper canopy (p < 0.01), with a negative correlation observed between flight height and deposition. At a flight height of 3 m, the average deposition in the upper canopy was 0.32 μL·cm-², whereas at 4 m, it decreased to 0.11 μL·cm-². In the middle canopy, average droplet deposition ranged from 0.048 to 0.325 μL·cm-². ANOVA results indicate that flight height has a greater effect on the average droplet deposition in the upper canopy layer (F = 3.224). A lower flight height leads to greater average deposition. The average droplet deposition in the lower canopy ranged from 0.030 to 0.156 μL·cm-². Analysis of variance indicated that spray volume had a significant effect on droplet deposition in the lower canopy (p < 0.05). When the spray volume increased from 33 L·ha-1 to 50 L·ha-1, the average droplet deposition in the tobacco canopy increased from 0.06 μL·cm-² to 0.10 μL·cm-².

Table 6. ANOVA results for droplet distribution characteristics in the vigorous growth stage (T40).
The analysis of variance indicated that flight height significantly influenced droplet coverage in the upper canopy (p < 0.05), with higher flight heights resulting in lower coverage. At a flight height of 3 m, the average droplet coverage in the upper canopy was 5.96%, which exceeded the average coverage observed at flight heights of 3.5 m and 4 m. Spray volume also had a significant effect on droplet coverage across the upper, middle, and lower canopies (p < 0.05). When the spray volume increased from 33 L·ha-1 to 50 L·ha-1, average droplet coverage in the upper canopy increased from 2.76% to 5.34%, in the middle canopy from 1.99% to 3.65%, and in the lower canopy from 1.43% to 2.32%. ANOVA results showed that spray volume had the greatest effect on droplet distribution uniformity in both the upper canopy (F = 1.526) and lower canopy (F = 3.219). At a spray volume of 50 L·ha⁻¹, the average CV values for both layers were minimal, at 45.52% and 34.22%, respectively. As the spray volume increases, droplet size becomes larger, which reduces drift and simultaneously provides greater kinetic energy to penetrate the canopy, thereby enhancing deposition coverage and uniformity in the lower canopy layers. Flight height primarily influenced droplet uniformity in the middle canopy (F = 3.581). At a flight height of 3.5m, the average CV for the middle canopy was minimal at 31.31%.
The penetration of droplets under different parameter treatments during the vigorous growth stage of tobacco is presented in Figure 4. As shown, higher spray volumes resulted in stronger droplet penetration. Overall, at a flight speed of 4 m·s-1, droplets exhibited relatively greater penetration. The highest penetration efficiency was observed at a flight height of 3.5 m, a flight speed of 4 m·s-1, and a spray volume of 50 L·ha-1.

Figure 4. Penetration efficiency of tobacco canopy for different treatments (T40).
3.5 Droplet distribution of T20P during the maturity stage of tobacco
We observed that when applying a spray volume of 33 L·ha⁻¹ during the vigorous growth stage, the droplet deposition and coverage were relatively low. Therefore, we further excluded the corresponding treatment during the maturity stage. Droplet deposition on the tobacco canopy under different operating parameters of T20P is shown in (Figure 2E). The average droplet deposition on the canopy ranged from 0.184 to 0.983 μL·cm-². The results of the analysis of variance are presented in Table 7. At this stage, flight speed exerted the greatest influence on droplet deposition within the tobacco canopy (F = 2.508). The highest average deposition was observed at a flight speed of 3 m·s-1, reaching 0.70 μL·cm-². Flight speed also significantly influenced droplet coverage on the tobacco canopy (p < 0.05). At a flight speed of 3 m·s-1, the average droplet coverage was 11.02%, whereas at 5 m·s-1, it decreased to 4.30%. Flight height has the greatest impact on droplet uniformity (F = 0.803). At a flight height of 2 m, the droplet distribution is most uniform, with an average CV of 17.12%. The low flight height may have reduced droplet drift, thereby improving uniformity.

Table 7. ANOVA results for droplet distribution characteristics in the maturity stage (T20P).
3.6 Droplet distribution of T40 during the maturity stage of tobacco
(Figure 2J) shows droplet deposition on tobacco during the maturity stage under different operating parameters of T40. The average droplet deposition on the canopy ranged from 0.197 to 0.748 μL·cm-². The results of the analysis of variance are presented in Table 8. Flight height significantly influenced droplet deposition on the tobacco canopy (p < 0.05). At a flight height of 3.5 m, the average droplet deposition was 0.57 μL·cm-², higher than the average deposition at flight heights of 3 m and 4 m. Flight height also had a greater effect on the droplet coverage of the tobacco canopy (F = 3.670). At a flight height of 3.5 m, the average droplet coverage was 9.94%, exceeding the average coverage at flight heights of 3 m and 4 m. Flight speed significantly affected droplet uniformity (p < 0.05). At a flight speed of 3 m·s⁻¹, the average CV in the middle canopy layer was the lowest, at 17.76%. Because mature tobacco leaves are larger, a lower flight speed increases the UAV’s residence time over the target area and reduces the turbulence of the downwash airflow, thereby improving droplet uniformity.

Table 8. ANOVA results for droplet distribution characteristics s in the maturity stage (T40).
3.7 Optimize operation parameters
A weighted comprehensive evaluation method was employed to assess the spraying performance under different operational parameters, using deposition, coverage, uniformity, and penetration as evaluation criteria. The comprehensive score, calculated by weighting these four indicators, reflects the overall spraying effectiveness, with higher values (0–100) indicating better performance. Figure 5 illustrates the trend of the comprehensive score with changes in each operational parameter.
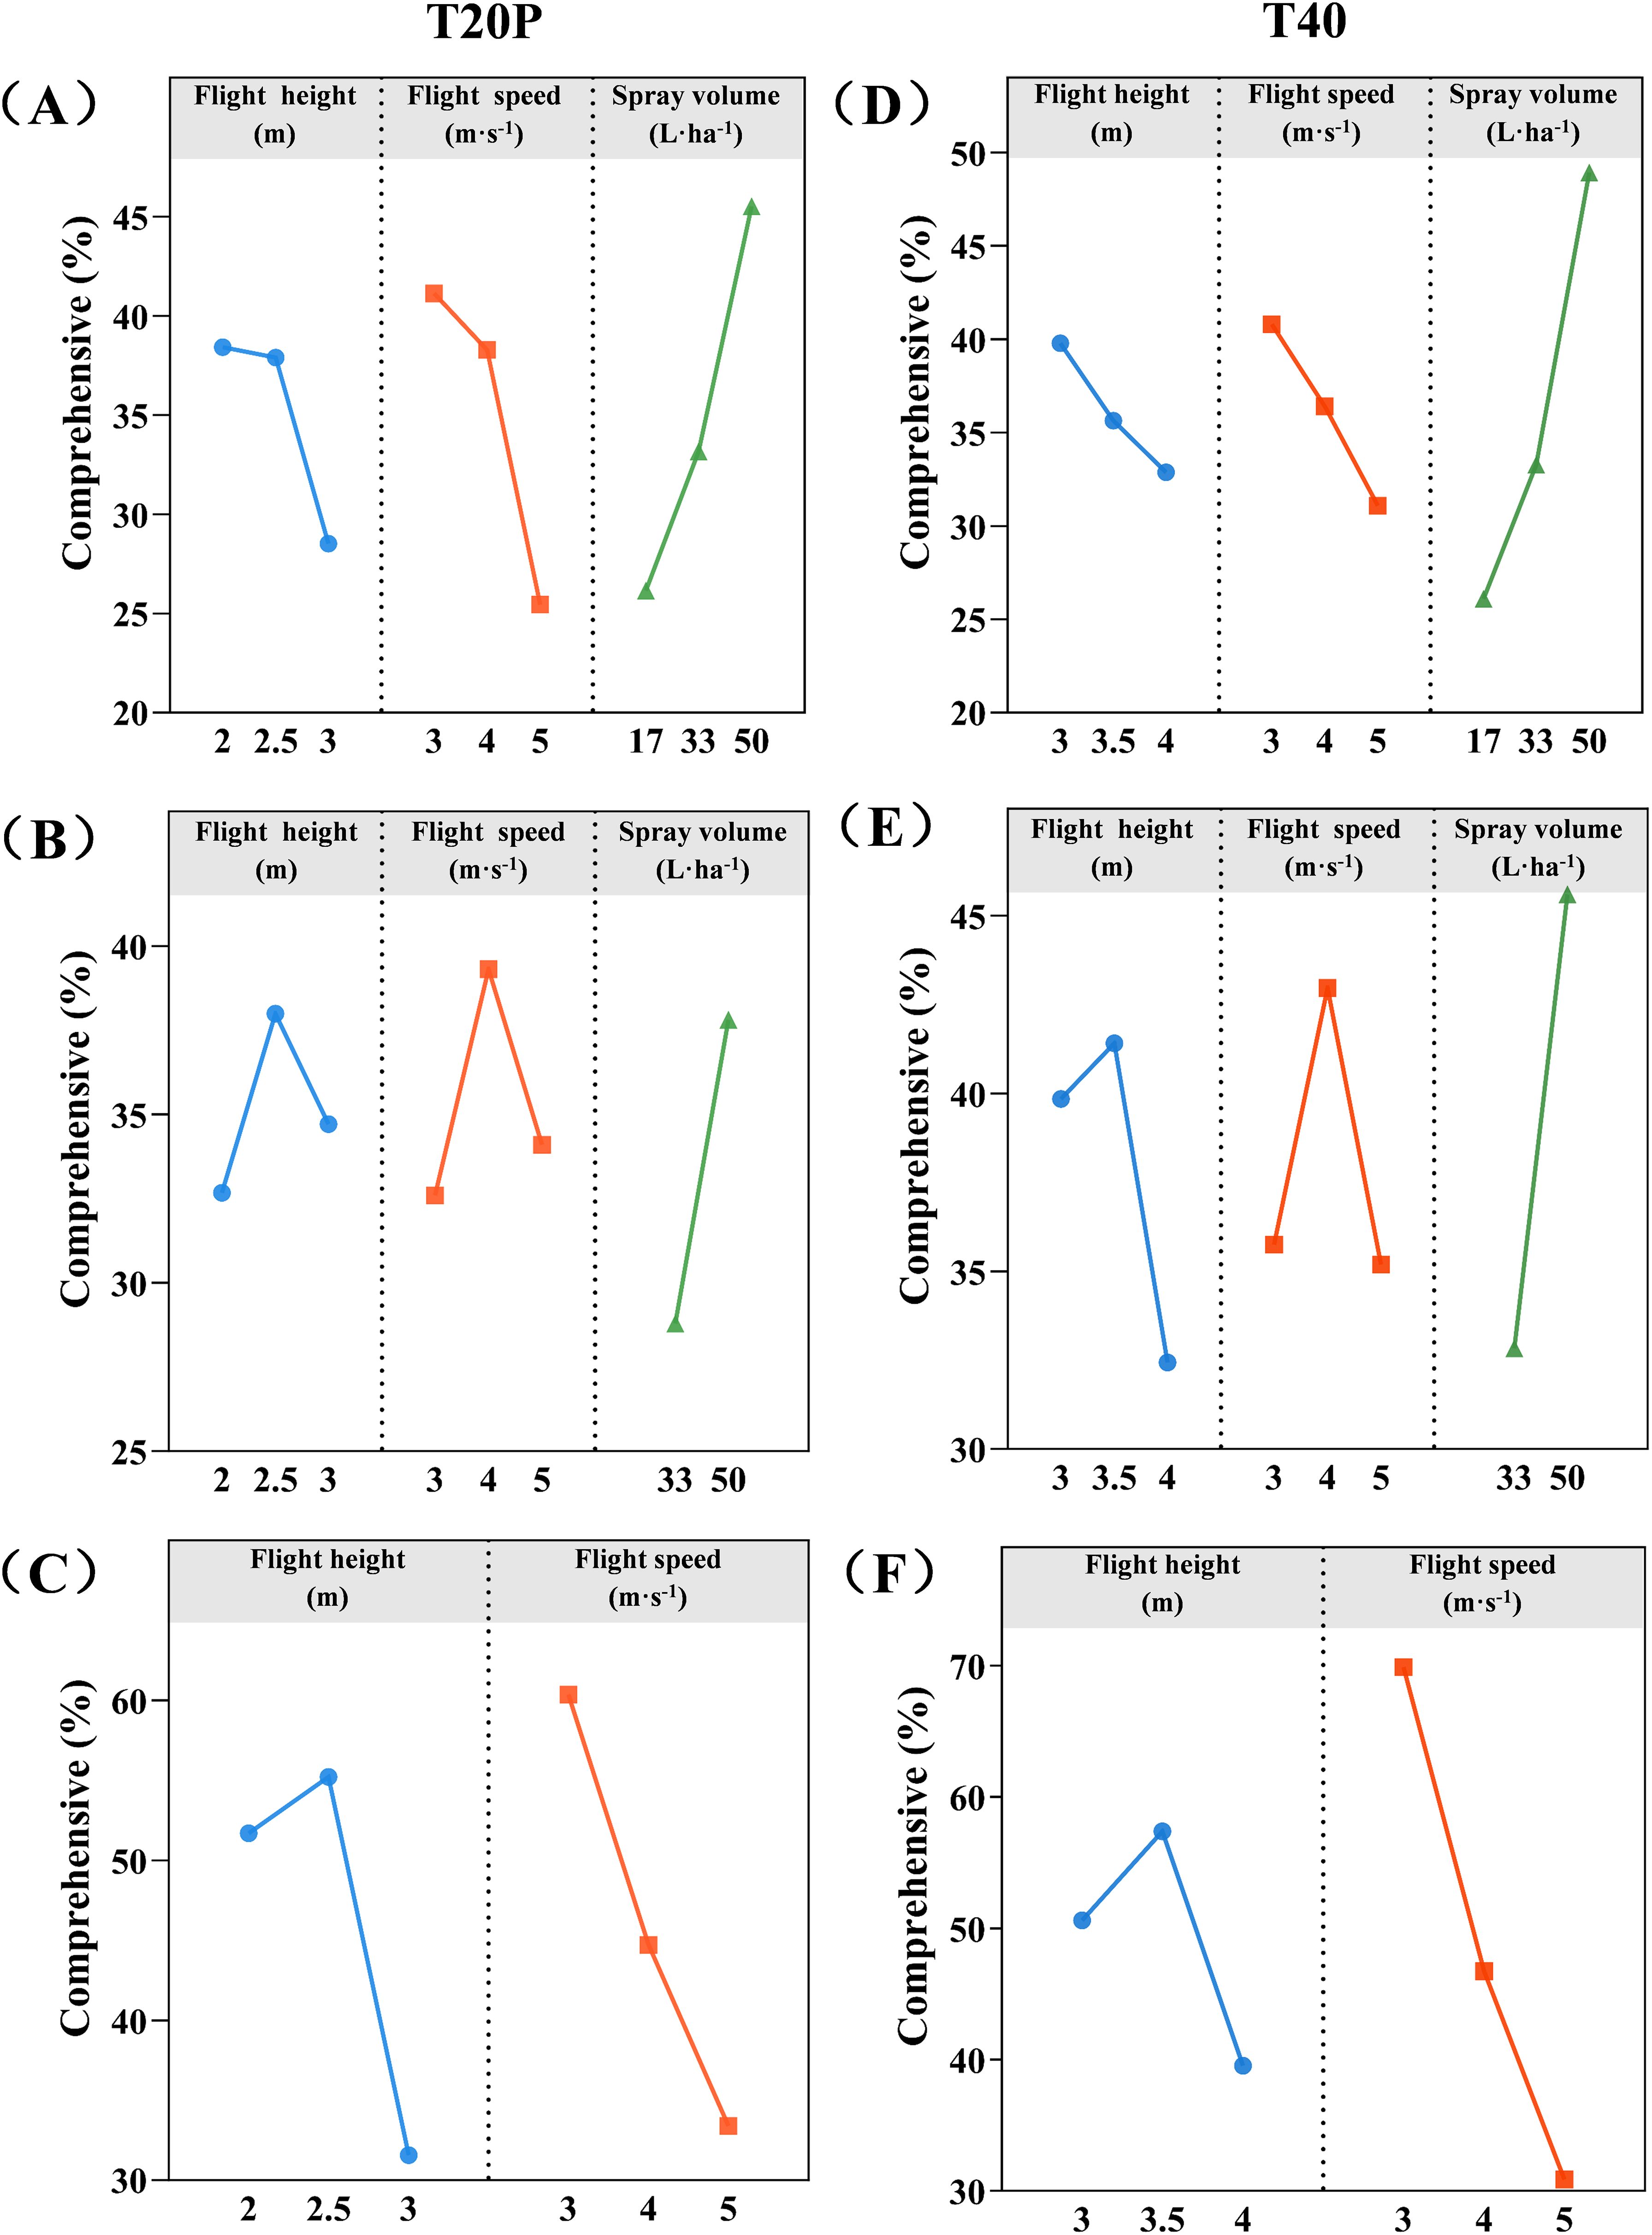
Figure 5. Range analysis of overall spray efficacy. (A, D) the rosette stage, (B, E) the vigorous growth stage, (C, F) the maturity stage.
(Figure 5A) shows the trend of the comprehensive value of T20P during the rosette stage. As flight height and flight speed increase, the comprehensive value tends to decrease, whereas higher spray volumes correspond to higher comprehensive values. Based on the analysis, the optimal combination of operational parameters for T20P during the tobacco rosette stage is a flight height of 2 m, a flight speed of 3 m·s-1, and a spray volume of 50 L·ha-1. (Figure 5B) shows the trend of the comprehensive value of T20P during the vigorous growth stage. When the flight height is 2.5 m and the flight speed is 4 m·s-1, the average comprehensive value is highest. Spray volume is positively correlated with the comprehensive value, which reaches its maximum at 50 L·ha-1. Accordingly, the optimal combination of operational parameters for T20P during the tobacco vigorous growth stage is a flight height of 2.5 m, a flight speed of 4 m·s-1, and a spray volume of 50 L·ha-1. (Figure 5C) shows the trend of the comprehensive value of T20P during the maturity stage. At a flight height of 2.5 m and a flight speed of 3 m·s-1, the average comprehensive value was highest. According to the analysis, the optimal combination of operational parameters for T20P during the vigorous growth stage of tobacco was a flight height of 2.5 m, a flight speed of 3 m·s-1, and a spray volume of 50 L·ha-1. (Figure 5D) shows the trend in the comprehensive value of T40 during the rosette stage. The average comprehensive value was highest at a flight height of 3.5 m. As flight speed decreased and spray volume increased, the comprehensive value showed an increasing trend. According to the analysis, the optimal combination of operational parameters for T40 during the rosette stage of tobacco was a flight height of 3.5 m, a flight speed of 3 m·s-1, and a spray volume of 50 L·ha-1. (Figure 5E) shows the trend of the comprehensive value of T40 during the vigorous growth stage. At a flight height of 3.5 m and a flight speed of 4 m·s-1, the average comprehensive value was the highest. Increasing the spray volume led to a corresponding increase in the comprehensive value. Based on these results, the optimal combination of operational parameters for T40 during the vigorous growth stage of tobacco was a flight height of 3.5 m, a flight speed of 4 m·s-1, and a spray volume of 50 L·ha-1. (Figure 5F) shows the trend of the comprehensive value of T40 during the maturity stage. At a flight height of 3.5 m and a flight speed of 3 m·s-1, the average comprehensive value was the highest. Based on the analysis, the optimal combination of operational parameters for T40 during the tobacco maturity stage was a flight height of 3.5 m, a flight speed of 3 m·s-1, and a spray volume of 50 L·ha-1.
4 Discussion
Currently, data on optimal operation parameters for most UAVs remain limited, and operators primarily rely on manufacturer-provided operational ranges (e.g., flight height, spray volume, and flight speed) (Byers et al., 2024). The efficiency of pesticide application via UAVs is strongly influenced by operation parameters, while crop height and leaf area index (LAI) vary across different species. Therefore, adjusting operation parameters based on specific application scenarios is crucial for improving control efficacy (Sun et al., 2022).
This study employed two types of UAVs to conduct spraying experiments in tobacco fields and systematically evaluated the effects of operational parameters on droplet deposition within the tobacco canopy. By considering four key indicators—droplet deposition, coverage, uniformity, and penetration—we identified the optimal operational parameters for UAVs at different stages of tobacco growth. The results indicate that operation parameters significantly affect droplet deposition distribution. During the vigorous growth and maturity stages, spraying performance reaches its maximum at medium flight heights (Figure 5). Excessively high flight heights can cause wide spray spans and droplet drift, resulting in fewer droplets reaching the lower or inner parts of the tobacco plants. Conversely, excessively low flight heights produce narrow spray spans; although the strong downwash airflow generated by the rotors reduces droplet drift, leaf disturbance impedes droplet adhesion, leading to a substantial reduction in deposition (Xue et al., 2014; Lou et al., 2018). During the rosette stage, the lowest flight height produces the most effective spraying effects. This is likely because tobacco plants are relatively short at this stage, allowing a lower flight height to enhance droplet distribution. Flight height also influences droplet uniformity. Lower flight heights produce strong downward rotational airflow, which induces substantial leaf movement and improves droplet deposition uniformity in the lower canopy. In contrast, higher flight heights weaken the airflow, enhancing uniformity in the upper canopy but reducing penetration (Lou et al., 2018). Flight height significantly affects droplet deposition and coverage of the T20P during the rosette stage and the upper canopy in the vigorous growth stage, as well as the T40 in the upper canopy during both the vigorous growth stage and maturity. Both UAVs exhibit optimal spraying performance at medium-to-low flight heights. The T20P, with four rotors, generates a strong, concentrated downwash airflow above the plants at medium-to-low flight heights, enhancing droplet deposition and penetration. In contrast, the T40, equipped with eight rotors, produces a more uniform downwash airflow with a wider diffusion range, resulting in higher canopy coverage and more stable droplet distribution at medium-to-low flight heights. Future research should investigate the effects of downwash on droplet penetration and canopy deposition to optimize UAV spray parameters, thereby achieving more uniform and efficient pesticide coverage.
Flight speed influences the dwell time of UAVs above the crop canopy, which in turn determines the deposition efficiency of pesticide droplets. We observed that higher flight speeds reduce droplet deposition. During the rosette and maturity stages, lower flight speeds resulted in better droplet deposition, whereas during the vigorous growth stage, medium flight speeds were optimal. Flight speed significantly affects droplet deposition on the upper canopy of T20P during the vigorous growth stage and significantly impacts coverage during the maturity stage. It also significantly affects droplet uniformity on T40 during the maturity stage. Although low flight speeds increase droplet deposition on the upper canopy of T20P, they reduce droplet deposition and uniformity on the lower canopy. In contrast, higher flight speeds increase air turbulence, which promotes more uniform droplet distribution (Xing et al., 2024). Therefore, to ensure operational efficiency, it is crucial to balance flight speed and spray effectiveness across different canopy layers. Systematic optimization of flight parameters is essential for achieving uniform droplet coverage across diverse canopy structures. At the maturity stage, tobacco leaves have relatively large surface areas, and low-flight-speed UAV spraying offers greater stability, higher accuracy, and reduced drift. During this stage, the low-speed T20P and T40 exhibit superior coverage and uniformity (Abd. Kharim et al., 2019).
Previous studies have shown that larger spray volumes enhance droplet coverage and deposition (Subramanian et al., 2021; Hu et al., 2022). In this study, a larger spray volume significantly increased droplet deposition and coverage while enhancing droplet penetration. Larger spray volumes can generate liquid flow that is not fully atomized by the nozzles and is further broken down by air resistance, producing relatively larger droplets. These larger droplets exhibit better penetration, enabling them to reach lower regions of the plants (Chen et al., 2022; Zhan et al., 2022; Wu et al., 2025). Spray volume significantly impacts the spraying performance of both UAVs across different growth stages, with higher volumes consistently yielding superior droplet deposition and coverage. The larger droplets produced by high spray volumes substantially reduce drift losses, thereby enhancing droplet deposition and coverage (Qin et al., 2016; Delavarpour et al., 2023).
5 Conclusion
In summary, this study evaluated the effects of UAV operational parameters on droplet deposition and distribution and identified the optimal parameters for different stages of tobacco growth through comprehensive multi-index analysis. For T20P, the optimal parameters during the rosette stage were a flight speed of 3 m·s-1, a flight height of 2 m, and a spray volume of 50 L·ha-1. During the vigorous growth stage, the optimal parameters were a flight height of 2.5 m, a flight speed of 4 m·s-1, and a spray volume of 50 L·ha-1. For the maturity stage, the optimal parameters were a flight height of 2.5 m, a flight speed of 3 m·s-1, and a spray volume of 50 L·ha-1. For T40, the optimal parameters during the rosette stage were a flight height of 3 m, a flight speed of 3 m·s-1, and a spray volume of 50 L·ha-1. During the vigorous growth stage, the optimal parameters were a flight height of 3.5 m, a flight speed of 4 m·s-1, and a spray volume of 50 L·ha-1. During the maturity stage, the optimal parameters were a flight height of 3.5 m, a flight speed of 3 m·s-1, and a spray volume of 50 L·ha-1. The results indicate that operational parameters significantly affect droplet deposition and coverage within the tobacco canopy. These findings provide a scientific basis for the efficient prevention and control of pests and diseases at various stages of tobacco growth using UAVs.
Data availability statement
The original contributions presented in the study are included in the article/supplementary material. Further inquiries can be directed to the corresponding author.
Author contributions
TL: Visualization, Writing – review & editing, Methodology, Investigation, Writing – original draft. PM: Writing – original draft, Data curation, Investigation, Project administration, Formal Analysis. JW: Software, Supervision, Writing – original draft. CL: Validation, Writing – original draft, Methodology. GW: Writing – original draft, Investigation, Resources. XS: Writing – original draft, Supervision, Formal Analysis. TZ: Methodology, Writing – original draft, Supervision, Conceptualization, Funding acquisition, Writing – review & editing.
Funding
The author(s) declare that financial support was received for the research and/or publication of this article. This work was supported by the key project of Henan Tobacco Company (2022410000240019). The funder was not involved in the study design, collection, analysis, interpretation of data, the writing of this article, or the decision to submit it for publication.
Conflict of interest
Authors PM and JW were employed by Henan Tobacco Company.
The remaining author(s) declare that the research was conducted in the absence of any commercial or financial relationships that could be construed as a potential conflict of interest.
Generative AI statement
The author(s) declare that no Generative AI was used in the creation of this manuscript.
Any alternative text (alt text) provided alongside figures in this article has been generated by Frontiers with the support of artificial intelligence and reasonable efforts have been made to ensure accuracy, including review by the authors wherever possible. If you identify any issues, please contact us.
Publisher’s note
All claims expressed in this article are solely those of the authors and do not necessarily represent those of their affiliated organizations, or those of the publisher, the editors and the reviewers. Any product that may be evaluated in this article, or claim that may be made by its manufacturer, is not guaranteed or endorsed by the publisher.
References
Abd. Kharim M. N., Wayayok A., Mohamed Shariff A. R., Abdullah A. F., and Husin E. M. (2019). Droplet deposition density of organic liquid fertilizer at low altitude UAV aerial spraying in rice cultivation. Comput. Electron. Agric. 167, 105045. doi: 10.1016/j.compag.2019.105045
Biglia A., Grella M., Bloise N., Comba L., Mozzanini E., Sopegno A., et al. (2022). UAV-spray application in vineyards: flight modes and spray system adjustment effects on canopy deposit, coverage, and off-target losses. Sci. Total Environ. 845, 157292. doi: 10.1016/j.scitotenv.2022.157292
Byers C., Virk S., Rains G., and Li S. (2024). Spray deposition and uniformity assessment of unmanned aerial application systems (UAAS) at varying operational parameters. Front. Agron. 6. doi: 10.3389/fagro.2024.1418623
Chen P., Douzals J. P., Lan Y., Cotteux E., Delpuech X., Pouxviel G., et al. (2022). Characteristics of unmanned aerial spraying systems and related spray drift: a review. Front. Plant Sci. 13. doi: 10.3389/fpls.2022.870956
Chen H., Lan Y., K Fritz B., Clint Hoffmann W., and Liu S. (2021). Review of agricultural spraying technologies for plant protection using unmanned aerial vehicle (UAV). Int. J. Agric. Biol. Eng. 14, 38–49. doi: 10.25165/j.ijabe.20211401.5714
Delavarpour N., Koparan C., Zhang Y., Steele D. D., Betitame K., Bajwa S. G., et al. (2023). A review of the current unmanned aerial vehicle sprayer applications in precision agriculture. J. ASABE 66, 703–721. doi: 10.13031/ja.15128
Dengeru Y., Ramasamy K., Allimuthu S., Balakrishnan S., Kumar A. P. M., Kannan B., et al. (2022). Study on spray deposition and drift characteristics of UAV agricultural sprayer for application of insecticide in redgram crop (Cajanus cajan L. Millsp.). Agronomy 12, 3196. doi: 10.3390/agronomy12123196
Hu H., Kaizu Y., Huang J., Furuhashi K., Zhang H., Li M., et al. (2022). Research on methods decreasing pesticide waste based on plant protection unmanned aerial vehicles: a review. Front. Plant Sci. 13. doi: 10.3389/fpls.2022.811256
Li J., Cheng Q., Chen L., Teng K., Zeng W., Cai H., et al. (2025). Biological traits of Spodoptera litura (Fabricius) in response to joint application of Beauveria bassiana (Balsamo) vuillemin and emamectin benzoate. J. Crop Health 77, 27. doi: 10.1007/s10343-024-01093-6
Li X., Giles D. K., Niederholzer F. J., Andaloro J. T., Lang E. B., and Watson L. J. (2021). Evaluation of an unmanned aerial vehicle as a new method of pesticide application for almond crop protection. Pest Manage. Sci. 77, 527–537. doi: 10.1002/ps.6052
Li L., Hu Z., Liu Q., Yi T., Han P., Zhang R., et al. (2022). Effect of flight velocity on droplet deposition and drift of combined pesticides sprayed using an unmanned aerial vehicle sprayer in a peach orchard. Front. Plant Sci. 13. doi: 10.3389/fpls.2022.981494
Lou Z., Xin F., Han X., Lan Y., Duan T., and Fu W. (2018). Effect of unmanned aerial vehicle flight height on droplet distribution, drift and control of cotton aphids and spider mites. Agronomy 8, 187. doi: 10.3390/agronomy8090187
Menechini W., Maggi M. F., Jadoski S. O., Leite C. D., and Camicia R. D. M. (2017). Aerial and ground application of fungicide in corn second crop on diseases control. Eng. Agríc. 37, 116–127. doi: 10.1590/1809-4430-eng.agric.v37n1p116-127/2017
Miao C., Hu Z., Liu X., Ye H., Jiang H., Tan J., et al. (2025). Transcriptome analysis of nitrate enhanced tobacco resistance to aphid infestation. Plant Physiol. Biochem. 220, 109514. doi: 10.1016/j.plaphy.2025.109514
Natikar P. K. and Balikai R. A. (2017). Present status on bio-ecology and management of tobacco caterpillar, Spodoptera litura (Fabricius) – An update. Int. J. Plant Prot. 10, 193–202. doi: 10.15740/HAS/IJPP/10.1/193-202
Pandiselvam R., Daliyamol, Imran S S., Hegde V., Sujithra M., Prathibha P. S., et al. (2024). Evaluation of unmanned aerial vehicle for effective spraying application in coconut plantations. Heliyon 10, e38569. doi: 10.1016/j.heliyon.2024.e38569
Qin W., Qiu B., Xue X., Chen C., Xu Z., and Zhou Q. (2016). Droplet deposition and control effect of insecticides sprayed with an unmanned aerial vehicle against plant hoppers. Crop Prot. 85, 79–88. doi: 10.1016/j.cropro.2016.03.018
Ribeiro L. F. O., Vitória E. L., Soprani Júnior G. G., Chen P., and Lan Y. (2023). Impact of operational parameters on droplet distribution using an unmanned aerial vehicle in a papaya orchard. Agronomy 13, 1138. doi: 10.3390/agronomy13041138
Rincón V. J., Sánchez-Hermosilla J., Páez F., Pérez-Alonso J., and Callejón >Á.J. (2017). Assessment of the influence of working pressure and application rate on pesticide spray application with a hand-held spray gun on greenhouse pepper crops. Crop Prot. 96, 7–13. doi: 10.1016/j.cropro.2017.01.006
Shi X., Du Y., Liu X., Liu C., Hou Q., Chen L., et al. (2024). Optimizing UAV spray parameters to improve precise control of tobacco pests at different growth stages. Pest Manage. Sci. 80, 5809–5819. doi: 10.1002/ps.8312
Sreenivas A. G., Ranganath, Wazid, Vijayalakshmi, and Shivayogiyappa (2024). Unmanned aerial vehicle (UAVs): a novel spraying technique for management of sucking insect pests in cotton ecosystem. J. Biosyst. Eng. 49, 103–111. doi: 10.1007/s42853-024-00219-y
Subramanian K. S., Pazhanivelan S., Srinivasan G., Santhi R., and Sathiah N. (2021). Drones in insect pest management. Front. Agron. 3. doi: 10.3389/fagro.2021.640885
Sun X., Qiu H., Qiu C., Wu Z., Xixia S., Tang L., et al. (2025). Research progress on biological prevention and control in tobacco green production. Cogent Food Agric. 11, 2448595. doi: 10.1080/23311932.2024.2448595
Sun T., Zhang S., Xue X., and Jiao Y. (2022). Comparison of droplet distribution and control effect of wheat aphids under different operation parameters of the crop protection UAV in the wheat flowering stage. Agronomy 12, 3175. doi: 10.3390/agronomy12123175
Wang G., Lan Y., Qi H., Chen P., Hewitt A., and Han Y. (2019a). Field evaluation of an unmanned aerial vehicle (UAV) sprayer: effect of spray volume on deposition and the control of pests and disease in wheat. Pest Manage. Sci. 75, 1546–1555. doi: 10.1002/ps.5321
Wang G., Lan Y., Yuan H., Qi H., Chen P., Ouyang F., et al. (2019b). Comparison of spray deposition, control efficacy on wheat aphids and working efficiency in the wheat field of the unmanned aerial vehicle with boom sprayer and two conventional knapsack sprayers. Appl. Sci. 9, 218. doi: 10.3390/app9020218
Wu M., Li Z., Yang Y., Meng X., Luo Z., Bian L., et al. (2025). Optimizing unmanned aerial vehicle operational parameters to improve pest control efficacy and decrease pesticide dosage in tea gardens. Agronomy 15, 431. doi: 10.3390/agronomy15020431
Xing W., Cui Y., Wang X., and Shen J. (2024). Optimization of operational parameters of plant protection UAV. Sens. 24, 5132. doi: 10.3390/s24165132
Xue X., Lan Y., Sun Z., Chang C., and Hoffmann W. C. (2016). Develop an unmanned aerial vehicle based automatic aerial spraying system. Comput. Electron. Agric. 128, 58–66. doi: 10.1016/j.compag.2016.07.022
Xue X., Tu K., Qin W., Lan Y., and Zhang H. (2014). Drift and deposition of ultra-low altitude and low volume application in paddy field. Int. J. Agric. Biol. Eng. 7, 23–28. doi: 10.25165/ijabe.v7i4.935
Yan X., Zhou Y., Liu X., Yang D., and Yuan H. (2021). Minimizing occupational exposure to pesticide and increasing control efficacy of pests by unmanned aerial vehicle application on cowpea. Appl. Sci. 11, 9579. doi: 10.3390/app11209579
Zhan Y., Chen P., Xu W., Chen S., Han Y., Lan Y., et al. (2022). Influence of the downwash airflow distribution characteristics of a plant protection UAV on spray deposit distribution. Biosyst. Eng. 216, 32–45. doi: 10.1016/j.biosystemseng.2022.01.016
Zhao S. (2022). A study on China’s tobacco taxation and its influencing factor on economic growth. Front. Psychol. 13. doi: 10.3389/fpsyg.2022.832040
Keywords: UAV, operation parameters, tobacco, droplet distribution, aerial spraying
Citation: Li T, Miao P, Wang J, Li C, Wang G, Sun X and Zhao T (2025) Optimizing UAV operation parameters for enhanced pesticide deposition in tobacco fields. Front. Agron. 7:1714559. doi: 10.3389/fagro.2025.1714559
Received: 27 September 2025; Accepted: 20 November 2025; Revised: 17 November 2025;
Published: 10 December 2025.
Edited by:
Miguel Ángel Pardo Picazo, University of Alicante, SpainReviewed by:
Zhao Wang, Inner Mongolia Agricultural University, ChinaJinhua Xu, Wuxi University, China
Copyright © 2025 Li, Miao, Wang, Li, Wang, Sun and Zhao. This is an open-access article distributed under the terms of the Creative Commons Attribution License (CC BY). The use, distribution or reproduction in other forums is permitted, provided the original author(s) and the copyright owner(s) are credited and that the original publication in this journal is cited, in accordance with accepted academic practice. No use, distribution or reproduction is permitted which does not comply with these terms.
*Correspondence: Pu Miao, bWlhb3B1ODg4QDE2My5jb20=; Te Zhao, emhhb3RlQGhlbmF1LmVkdS5jbg==
†These authors have contributed equally to this work