 Weynner Giraldo-Sanclemente1
 Ana Gabriela Pérez-Castillo1,2*
 Marcelo Elizondo-Barquero3Carlos Mario Rodríguez-Solís3
- 1Laboratory of Greenhouse Gases and Carbon Capture, Environmental Pollution Research Center, Universidad de Costa Rica, San José, Costa Rica
- 2School of Agronomy, Universidad de Costa Rica, San José, Costa Rica
- 3Research Department, Starbucks Coffee Agronomy Company SRL, Alajuela, Costa Rica
In recent years, Costa Rican coffee farms have increased nitrogen (N) inputs to maximize yields, using different rates, timings, and sources. N is often applied in complete fertilizers that include phosphorus (P), a limiting nutrient in Andisols due to their physical and chemical properties. However, excessive N use raises concerns about greenhouse gas (GHG) emissions and soil acidification. In 2024, a field trial was conducted for eight months at the Alsacia Coffee Farm (Starbucks Company) in Alajuela, Costa Rica, to evaluate coffee yield and quantify nitrous oxide (N2O) and methane (CH4) emissions under three N fertilization strategies, considering soil interactions. The experiment used 15 × 16 m plots in six randomized complete blocks across two sectors (A and B) with contrasting microtopography. Treatments included: urea (U; 414 kg N ha-¹, split into two applications), urea + urease inhibitor NBPT (F; 346 kg N ha-¹), and ammonium nitrate (Y; 346 kg N ha-¹), the last two split into three applications. No significant yield differences were observed during one crop cycle among treatments; however, yield was strongly affected by soil properties. Sector A, with 50% more clay and higher P, doubled the yield compared to Sector B. N2O cumulative emissions were similar for F and Y but higher in U due to greater N input. Soils acted as a CH4 sink. Although treatment F had lower yield-scaled emissions (74 ± 20 g CO2e kgcoffee-¹) than U (146 ± 47 g CO2e kgcoffee-¹), the environmental impact was limited. Results highlight the importance of site-specific nutrient and soil management to improve sustainability in coffee production. Under the experimental conditions, soil texture and phosphorus content were key factors influencing coffee productivity.
1 Introduction
Coffea arabica is the most widely cultivated and consumed coffee species worldwide, with major producing regions concentrated in South America (Freitas et al., 2024). For the 2023–2024 period, global production is projected to increase by 5.8%, reaching approximately 102.2 million 60-kg bags (ICO, 2023; ICAFE, 2024). In Costa Rica, C. arabica is both economically and culturally significant, with around 26 725 producers and an estimated output of 1.5 million bags, representing approximately 0.77% of global production during the same period (ICAFE, 2024).
Andisols cover approximately 15% of Costa Rica’s territory, representing a significant portion of the country’s agricultural land, particularly in volcanic regions (Rosales and Sandoval, 2016). These soils are known for their unique physical and chemical properties, including a high capacity to fix phosphorus (P), which limits its availability to plants. Soil properties, such as pH and mineral composition, strongly modulate nutrient availability and, consequently, crop productivity. In coffee cultivation, P is essential for optimal growth and yield, and its deficiency can reduce productivity by 30–40% (Nurcholis et al., 2024). Optimal nutrient availability is typically achieved at slightly acidic pH levels (5.6–6.0). However, in more acidic soils (pH< 5.5), inorganic phosphorus tends to precipitate with iron (Fe) and aluminum (Al), or adsorb onto clay and oxide surfaces, significantly reducing its uptake by plants (Msimbira and Smith, 2020; Nurcholis et al., 2024; Quispe et al., 2025).
Soil physical and chemical heterogeneity within coffee plantations can lead to significant spatial variability in yield, even under uniform management practices. Variations in texture, bulk density, and organic matter content influence root growth, water availability, and nutrient cycling, thereby conditioning plant performance. Such differences highlight the importance of considering soil properties at both farm and landscape scales when designing fertilization strategies and assessing productivity.
In addition to productivity, soil properties play a decisive role in regulating greenhouse gas (GHG) emissions. Parameters such as soil pH, texture, and aeration modulate microbial processes like nitrification and denitrification, which are the primary biological pathways of N2O production in agricultural systems (Sahrawat, 2008; Wang et al., 2023). In Andisols, the combination of high organic matter content, low bulk density, and strong phosphorus fixation capacity, creates unique nutrient dynamics that may alter both crop responses to fertilization and the magnitude of soil–atmosphere gas exchanges (Arifin et al., 2022).
Nitrogen (N) is a key macronutrient for coffee, directly affecting vegetative growth, yield, and bean quality (Berhanu et al., 2023; Freitas et al., 2022). Yield reductions of up to 60% have been reported when N is not supplied during the reproductive stage (Salamanca-Jiménez et al., 2017; Sarkis et al., 2023), which often drives over-application. However, 15N tracer studies have further demonstrated that coffee plants typically absorb less than 25% of the N applied as urea (Freitas et al., 2022), raising concerns about the environmental sustainability of coffee production systems (Maina et al., 2015; ICO, 2023). A proportion of the unused N can be converted into nitrous oxide (N2O), a GHG with a high global warming potential (Sarkis et al., 2023) and coffee production accounts for approximately 10% of Costa Rican agricultural sectoral total N2O emissions (Bentzon-Tarp et al., 2023).
In coffee-producing regions worldwide, urea and ammonium nitrate are the most widely used N fertilizers. Despite their differences in chemical properties and behavior in the soil, field studies have shown little to no variation in crop yield or nitrogen use efficiency (NUE) under conventional management practices (Chagas et al., 2019). Costa Rica is among the countries with the highest N fertilizer use in coffee, frequently exceeding recommended rates (100–125 g urea plant-¹ per application) (Castro-Tanzi et al., 2012; Salamanca-Jiménez et al., 2017; Sarkis et al., 2023). The average seasonal N input is 264 kg N ha-¹ yr-¹, ranging from 150 to 350 kg N ha-¹ yr-¹, usually band-applied in three to four splits (Salamanca-Jiménez et al., 2017; San Martin Ruiz et al., 2021; ICAFE, 2024; Bentzon-Tarp et al., 2023). This level of N use is comparable to other major producers such as Brazil and Colombia, where average application rates are 400 and 300 kg N ha-¹ yr-¹, respectively (Ramírez-Builes et al., 2024).
Various N fertilization strategies are currently employed in coffee cultivation in Costa Rica, although many have not yet been evaluated through scientific studies. N fertilizers applied under soil conditions favorable to nitrification and denitrification can result in significant N2O emissions, which are closely linked to the type and rate of N applied (Wang et al., 2016; San Martin Ruiz et al., 2021). In addition to common sources such as urea and ammonium nitrate, coffee producers in Costa Rica also use multi-nutrient “complete formulas” containing at least 15% N, along with P, potassium (K), magnesium (Mg), and boron (B), typically applied at the end of the rainy season. Fertilization practices vary among producers, reflecting a wide range of management approaches (San Martin Ruiz et al., 2021). More recently, enhanced-efficiency fertilizers, such as urea treated with urease inhibitors like N-(n-butyl) thiophosphoric triamide (NBPT), have shown promise in improving NUE in coffee systems (De Souza et al., 2023). However, their application in Costa Rican coffee production has not yet been documented.
The objective of this study was to evaluate the interaction between soil properties and N fertilization strategies in a Costa Rican Andisol, by comparing the effects of conventional urea, urea with NBPT, and ammonium nitrate-based formulations on coffee yield and soil–atmosphere greenhouse gas fluxes (CO2, CH4, and N2O). This approach emphasizes how inherent soil characteristics, rather than fertilization strategy alone, can drive differences in crop performance and environmental outcomes.
2 Materials and methods
2.1 Study site
The study was conducted from June 10, 2024, to January 27, 2025, at The Starbucks Coffee Company’s Alsacia Farm in Alajuela, Costa Rica (10°06’01.3” N, 84°11’41.8” W). The soil at the experimental plot, was classified as an Andisol with an ustic moisture regime, characterized by high organic matter content (> 5%) and low fertility (CEC< 952 mg kg-1).
Over the crop cycle, temperatures ranged from 13°C to 19°C, with a mean of 16.8°C, and total accumulated precipitation reached 3900 mm. Meteorological data were recorded by an automatic weather station located in Laguna Fraijanes, 17 km from the experimental site, and provided by the National Meteorological Institute under contract IMN-DIM-CM-179-2025. Between August 16, 2024, and January 27, 2025, measurements of Water-Filled Pore Space (WFPS) in the soil were taken using an MP406 sensor connected to an ICT Bluetooth interface around the gas sampling chamber, during each gas flux sampling day. The WFPS ranged from 35% to 55%, with no significant differences in mean values observed among the three fertilization treatments or sectors (Supplementary Table 1).
To characterize the physical and chemical properties of the soil, samples were sent to the Soil Laboratory of the Agronomic Research Center (CIA), University of Costa Rica. Soil texture was determined using the Bouyoucos hydrometer method. Bulk soil density was measured from undisturbed samples collected at a depth of 10 cm, using 250 cm³ soil cores at six locations (one per block).
A composite soil sample from the 20 cm topsoil was collected for fertility analysis from Sector A and Sector B (Figure 1A). Samples were taken from 45 points per sector on July 13, 2024, and at the end of the experiment on January 27, 2025. The Total carbon (C) and nitrogen (N) contents were analyzed through dry combustion, while soil pH was determined in a 1:2.5 soil-to-water suspension. The concentrations of calcium (Ca), magnesium (Mg), potassium (K), and total phosphorus (P) were obtained using a modified KCl-Olsen extraction method. Trace elements including zinc (Zn), copper (Cu), iron (Fe), and manganese (Mn) were measured by atomic absorption spectroscopy (novAA 400p, Analytik Jena, Germany).

Figure 1. (A) Experimental layout consisting of six randomized blocks with three fertilization strategies: urea (U), urea plus urease inhibitor (F) and ammonium nitrate (Y) and distributed across Sectors A and B at Alsacia Farm, Alajuela, Costa Rica. (B) Coffee yield under the three fertilization strategies (U, F, Y), during the crop cycle from June 2024 to January 2025. Lines represent mean yield ± standard error. Series identified with different letters differ significantly according to the Tukey test (p< 0.05).
2.2 Experimental design and treatments
The experiment was conducted using a randomized block design with three treatments and six repetitions. The blocks were distributed into two sectors based on topography (Sector A and Sector B) (Figure 1A), each with distinct soil textural class (Table 1). A total of 18 plots, each measuring 15 m × 16 m, were established. The plots were planted with the “Caturra” coffee variety at a spacing of 0.90 m between plants and 1.80 m between rows, resulting in a planting density of 6, 216 plants ha-1. Adjacent plots were separated by four coffee rows to minimize edge effects. Additionally, the initial foliar chemical status was assessed using composite samples consisting of 90 leaves per sector, collected on July 20, 2024 (Supplementary Table 2), to evaluate the nutritional status of the plants in both sectors and to ensure comparable baseline conditions.
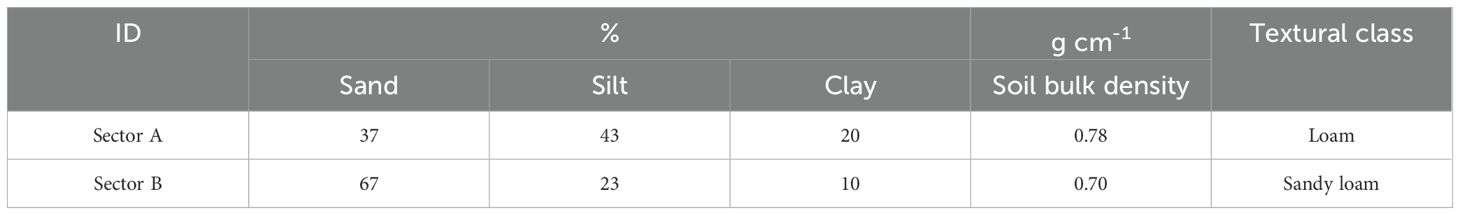
Table 1. Soil texture from composite samples collected in Sectors A and B, and bulk density measured on July 13, 2024, at Alsacia Farm, Alajuela, Costa Rica.
Details of the experimental treatments, the total N applied in each fertilization strategy, and the corresponding application schedule are presented in Table 2. The total N rate for F and Y treatments (346 kg N ha-1) was divided as follows: flowering stage (100 g plant-1), grain filling (115 g plant-1) and ripening (112 g plant-1). In the case of U treatment, 414 kg ha-1 were divided into two stages floral differentiation (100 g plant-1) and grain filling (115 g plant-1).
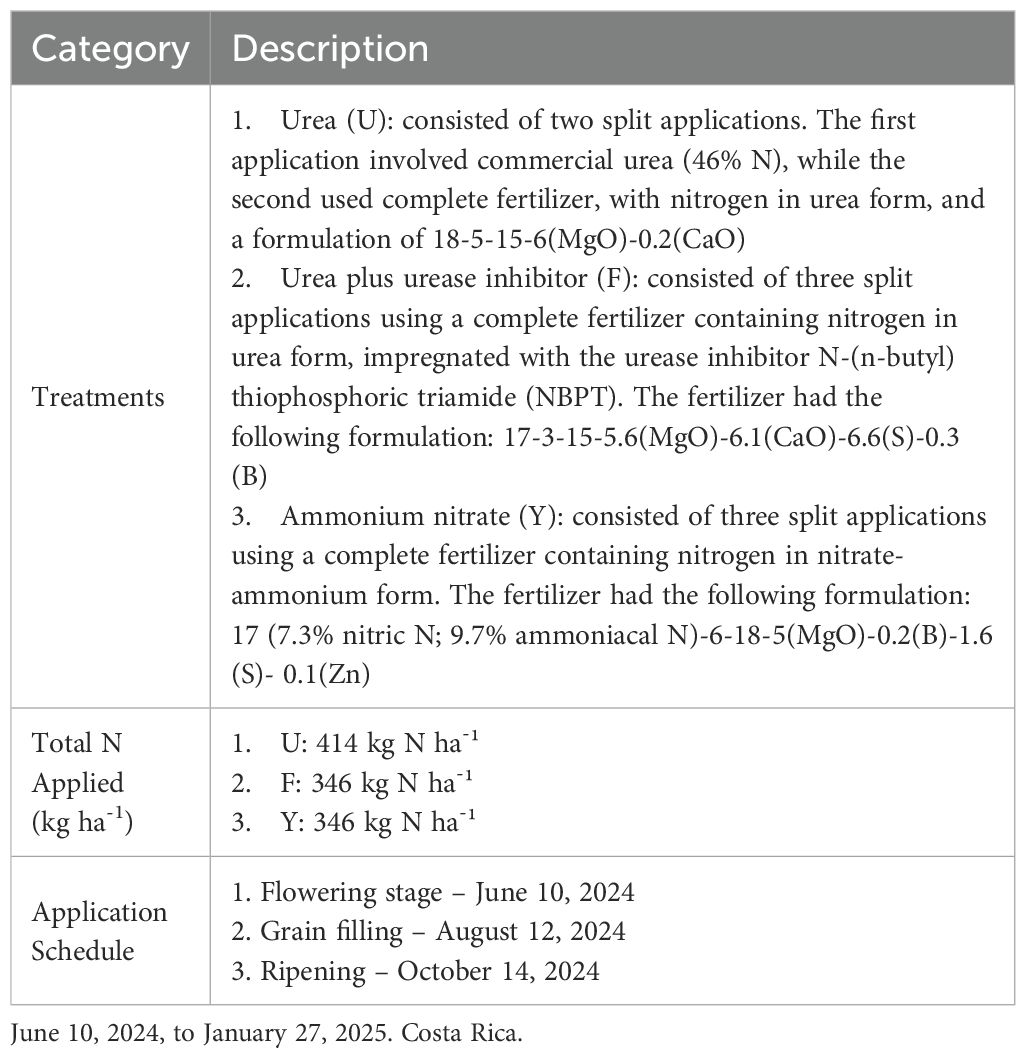
Table 2. Fertilization treatments description for Coffea arabica plantation.
2.3 Coffee yield and agronomic management
Coffee yield was evaluated across four harvest dates (November 19, December 6, December 26, 2024; and January 28, 2025) within the 100 m² productive plot of each block. On each date, only ripe cherries were harvested. Bean classification was performed according to Starbucks quality standards, excluding green beans, floaters, dried beans, and those damaged by the coffee berry borer. For each experimental unit, the total fresh weight of harvested coffee cherries was recorded and normalized by the number of productive plants.
Insect pests and disease control were carried out through regular field monitoring. To support floral differentiation and improve plant health, boric acid, magnesium sulfate, potassium nitrate, and a phytoprotectant containing calcium, silicon, and copper were applied.
Weed management was conducted using chemical control, complemented by the application of a selective systemic herbicide for both pre- and post-emergence control (a.i. clomazone). Areas infested with weeds that were not chemically treated were managed mechanically using a brushcutter, while climbing plants were removed manually.
Management of coffee leaf rust (Hemileia vastatrix Berk. & Br.) involved the application of fungicides with different modes of action to prevent resistance development. These included quinone outside inhibitors (a.i. strobilurins), ergosterol biosynthesis inhibitors (a.i. triazoles), spore germination inhibitors (a.i. pyraclostrobin), fungicides that disrupt neurotransmitter synthesis (a.i. dithiocarbamates), and copper-based compounds. Control of the coffee berry borer (Hypothenemus hampei) was carried out using pyrethroids, including the active ingredient dimethoate, which inhibits acetylcholinesterase.
2.4 Daily fluxes of CO2, CH4 and N2O
Emissions of CO2, CH4, and N2O were monitored using the non-steady-state chamber method. Frames were set 15 cm below the soil surface, two weeks prior to the start of the sampling period. Two bases were installed in each experimental unit to allow alternating chamber placement across sampling dates. Each chamber, with a surface area of 0.16 m² and a height of 0.1 m, was covered with insulating material to minimize temperature fluctuations. A small internal fan ensured gas homogenization throughout the measurement period. A flexible gas bag was connected to each chamber to maintain equilibrium between the inside and outside pressure.
A total of 33 sampling rounds were conducted. Sampling was performed on day 0 (prior to fertilizer application) and on days 1, 2, 4, 7, 8, 11, and 15 after each fertilization. Thereafter, sampling was carried out every two weeks until the next fertilization event or harvest. Gas samples were collected at 0, 20, and 40 min after chamber closure and injected into vacuum vials, for a total of 54 samples per day. In addition, two air samples, two recovery controls, and one blank were analyzed on each sampling day for quality data control.
Gas samples were analyzed using a gas chromatograph (Agilent 7890A, USA) equipped with a methanizer, a flame ionization detector (FID), and an electron capture detector (ECD), coupled to an autosampler (Agilent 7697A, USA). The instrument was calibrated for each target analyte using a four-point calibration curve, performed at the start of the analysis, after every 24 h of continuous operation, and upon completion of the injection sequence. Standard gases prepared with air as the balance exhibited an uncertainty of approximately 5%. To verify equipment performance, a certified gas mixture containing CO2, CH4, and N2O was analyzed after every set of 14 vials. The observed deviations from the certified concentrations did not exceed 20%.
The hourly concentration changes for CH4 and CO2 fluxes was obtained from a linear regression while a quadratic regression was used for N2O. The flux of each GHG (fi) was determined according to Equation 1.
where atmospheric pressure (P, in Pa) and headspace temperature (T, in °C) were recorded during each measurement round using a Kestrel 4000 weather meters (Loftopia LLC., MI, USA). The molar mass (MMi) was set at 12 μg C μmol-¹ for CO2 and CH4, and 28 μg N μmol-¹ for N2O. The ideal gas constant (R) was taken as 8.314 J K-¹ mol-¹ (Dawar et al., 2021). Chamber height (h, in meters) was adjusted by accounting for the distance between the frame and the soil surface.
Data analysis of fluxes was conducted under the following criteria: CO2, CH4 and N2O fluxes were rejected if the coefficient of determination (r2) of the linear regression for the change in CO2 concentration was less than 0.88, values below this threshold were considered indicative of potential leakage. For N2O and CH4, the r2 acceptance thresholds were 0.85 and 0.70, respectively. To ensure data quality, 4% of the CO2 and 9% of the N2O flux readings were removed from the dataset, while 26% of the CH4 fluxes were excluded due to low r² values. To estimate the missing values, the average slope of the replicates for each treatment was used according to the corresponding measurement day.
2.5 Cumulative emissions
Cumulative CH4 and N2O emissions were calculated using the trapezoidal method (Pérez-Castillo et al., 2021), applying the median flux for each specific treatment and sampling day when a flux value was excluded based on the criteria described in the previous section.
Nevertheless, since fluxes could not be measured for an entire year, the cumulative emissions of N2O (g N2O kg of Napplied-1 ha-1) were normalized by total amount of N applied for each fertilization strategy for comparative purposes. The yield-scaled emissions (g CO2e kgcoffee-¹) were estimated by converting cumulative CH4 and N2O fluxes into CO2 equivalents, using conversion factors of 27 for CH4 and 273 for N2O, according to IPCC guidelines (IPCC, 2021). These values were then divided by the total kilograms of coffee produced per hectare and per treatment.
2.6 Statistical analysis
Normality and homogeneity of variances were assessed using the Shapiro–Wilk test and Bartlett’s test, respectively. A one-way ANOVA was conducted, considering blocks A and B as an experimental error factor, to identify significant differences among treatments. When significant differences were detected by ANOVA, Tukey’s Honest Significant Difference (HSD) test was applied for multiple comparisons of treatment means. Statistical significance was set at p < 0.05. All statistical analyses were performed using RStudio software, version 4.5.1. To identify the variables most strongly associated with coffee productivity, we applied an information-theoretic model selection approach based on the Akaike Information Criterion (AIC). The drivers of yield variation were constructed using key soil properties and gas fluxes and management factors. For each model, AIC and Akaike weights were used to assess the relative likelihood of each model. Full model comparisons are provided in Supplementary Table 3.
3 Results
3.1 Coffee yield, N fertilization strategies and soil properties
Coffee yield did not show statistically significant differences between the evaluated N fertilization strategies. In contrast, significant differences in productivity were observed between sectors (p = 0.0026). Sector A exhibited higher mean yields, ranging from 5, 060 to 7, 337 kg ha-¹, while in Sector B yields ranged from 2, 530 to 3, 036 kg ha-¹ (Figure 1B).
Soil texture in Sector A contained 50% more clay and 47% more silt than in Sector B, resulting in a different textural class between the two sectors. The mean soil bulk density across sectors was 0.74 g cm-³ (Table 1). The initial soil chemical conditions were similar between sectors, except for iron (Fe), element with higher content in Sector A (993 ± 23 mg kg-¹) than in Sector B (883 ± 40 mg kg-¹) (Table 3). At the end of the crop cycle, available phosphorus (P) in Sector A increased significantly by nearly threefold compared to its initial value (p = 0.026), whereas P levels in Sector B remained unchanged. Final Fe content decreased in Sector B compared to its initial condition (p = 0.022), whereas in Sector A it remained unchanged.

Table 3. Initial chemical soil properties of the surface soil layer (0–25 cm depth), based on composite samples collected from 45 sampling points per sector on July 13, 2024, at Alsacia Farm, Alajuela, Costa Rica.
3.2 Daily fluxes of CO2, CH4 and N2O
Daily fluxes of CO2 and N2O increased following the three N fertilization events (June 10, August 12, and October 14) and their associated management strategies (Figures 2A–C). Daily CO2 fluxes ranged from 42 to 123 mg CO2 m-² h-¹. CO2 fluxes were influenced by the phenological development of the coffee crop (Figure 2A), they were highest during the flowering stage of the coffee plants and decrease during the grain filling and ripening stages. CH4 fluxes consistently show negative values, regardless of the N fertilization strategy applied (Figure 2B).
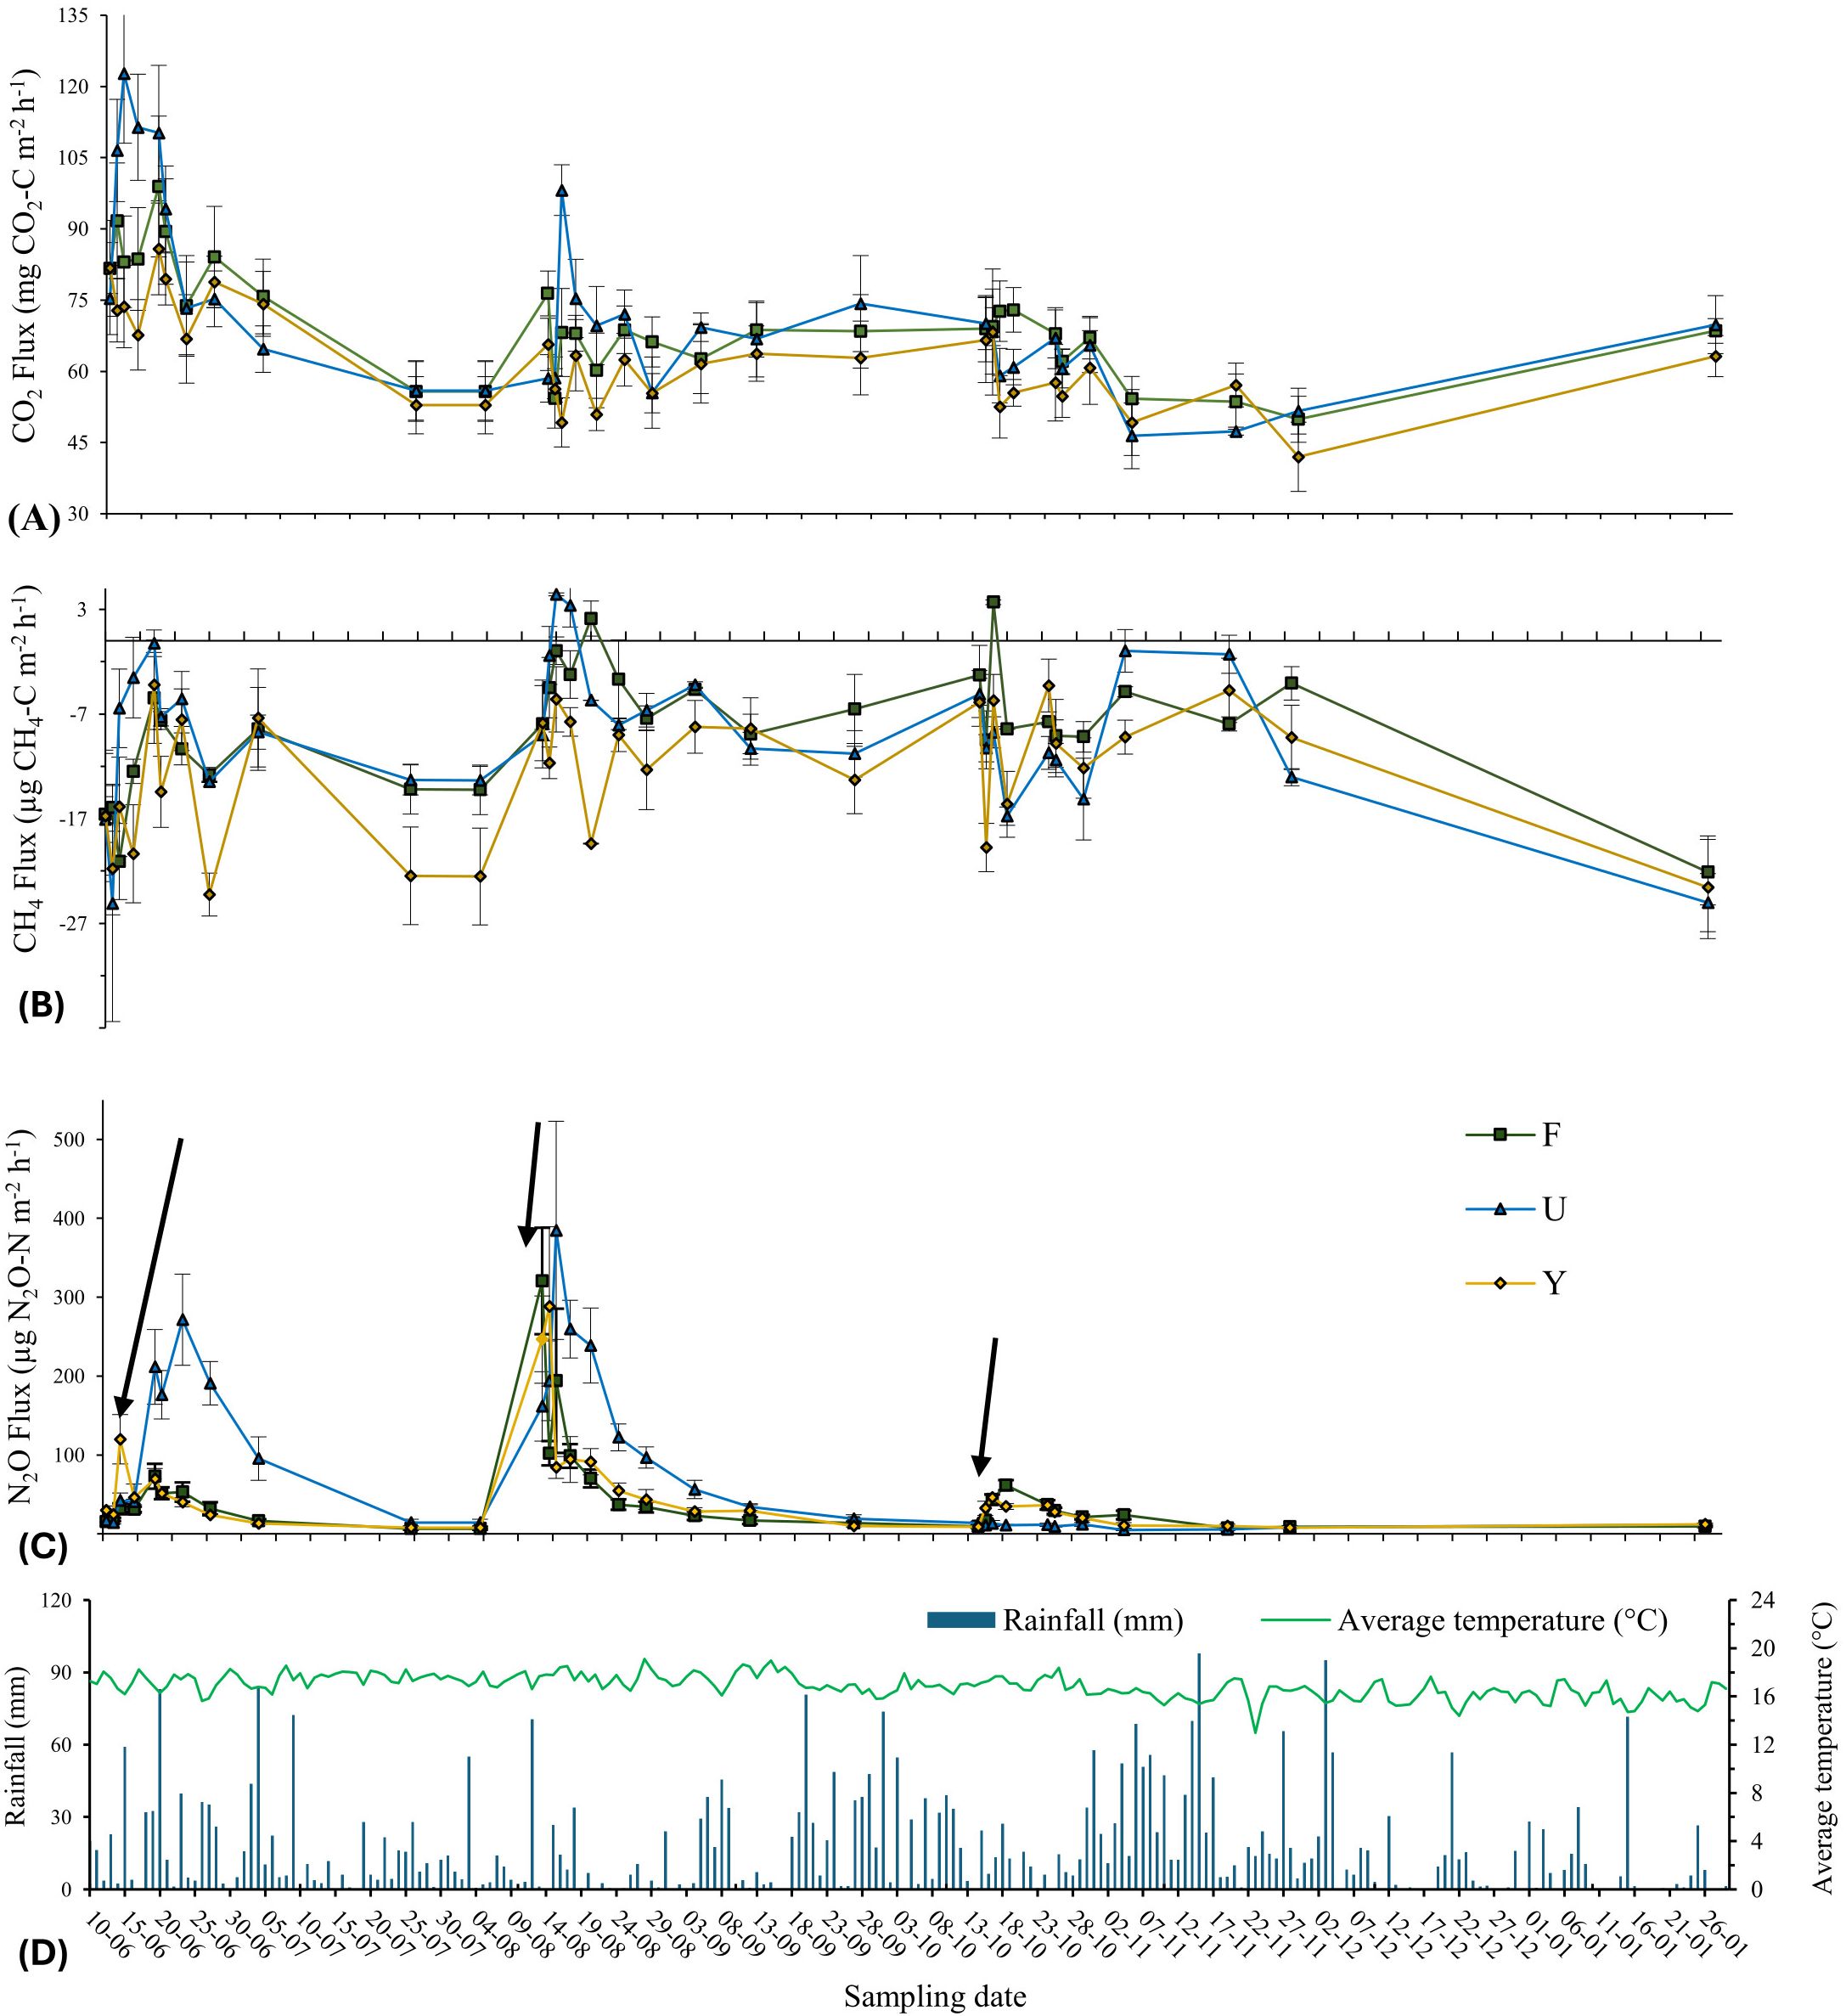
Figure 2. Daily fluxes of (A) CO2, (B) CH4, and (C) N2O under three fertilization strategies: urea (U), urea plus urease inhibitor (F), and ammonium nitrate (Y), during a coffee crop cycle between June 10, 2024, and January 27, 2025, at Alsacia Farm, Alajuela, Costa Rica. Lines represent daily mean fluxes ± standard error. (D) Daily cumulative precipitation (mm) and average temperature (°C) on the sampling days. In (C) arrows indicate the three fertilization events.
Daily N2O emissions showed similar temporal patterns throughout the entire measurement period for treatments F and Y, with no significant differences between the two strategies. Several notable N2O emission peaks were observed following both the first and second fertilization events, closely associated with episodes of intense rainfall followed by short drying periods (Figures 2C–D, Supplementary Table 4). The highest N2O emission peak across all treatments occurred after the second fertilization on August 12, coinciding with two substantial rainfall events on August 3 (55 mm) and August 12 (71 mm). A secondary emission peak was recorded on August 14, two days after fertilization, aligning with a short dry spell (August 14: 0.22 mm).
3.3 Cumulative emissions
Cumulative CO2 fluxes showed no significant differences among fertilization events or across N fertilization strategies. In the case of CH4, all treatments displayed negative cumulative fluxes (Figure 3B), which became more pronounced on January 26.

Figure 3. Cumulative fluxes of (A) CO2, (B) CH4, and (C) N2O under three fertilization strategies: urea (U), urea plus urease inhibitor (F), and ammonium nitrate (Y), during a coffee crop cycle between June 10, 2024, and January 27, 2025. Alsacia Farm, Alajuela, Costa Rica. Lines represent cumulative mean fluxes ± standard error. Series identified with different letters differ significantly according to the Tukey test (p < 0.05).
Cumulative N2O fluxes differed among fertilization treatments. When urea was applied (first and second fertilization events), it generated the highest emissions (Figure 3C). During the first event, Y produced N2O fluxes 3.8 times higher than those of F, whereas during the second and third events, emissions were 2.3 and 1.8 times higher in F than in Y, respectively. After the second fertilization, when all treatments received 122 kg N ha-1, N2O emissions from Y and F were 38% and 42% lower than those from U over the period August 12–September 26. Overall, cumulative N2O emissions were significantly higher in treatment U than in F and Y, with no significant differences between the latter two (Figure 3C).
The comparison of N2O cumulative emission was carried out between treatments F and Y, since both received the same total N rate over the entire crop cycle. No statistically significant differences in the N2O emission were observed between F and Y (Table 4). Statistically significant differences were found in the yield-scaled emissions for treatment F compared to treatment U at p = 0.007. The yield-scaled GEI emissions expressed as total kg CO2e per kg of coffee, was lower under fertilization strategy F compared to the conventional urea treatment, although not significantly different from strategy Y.
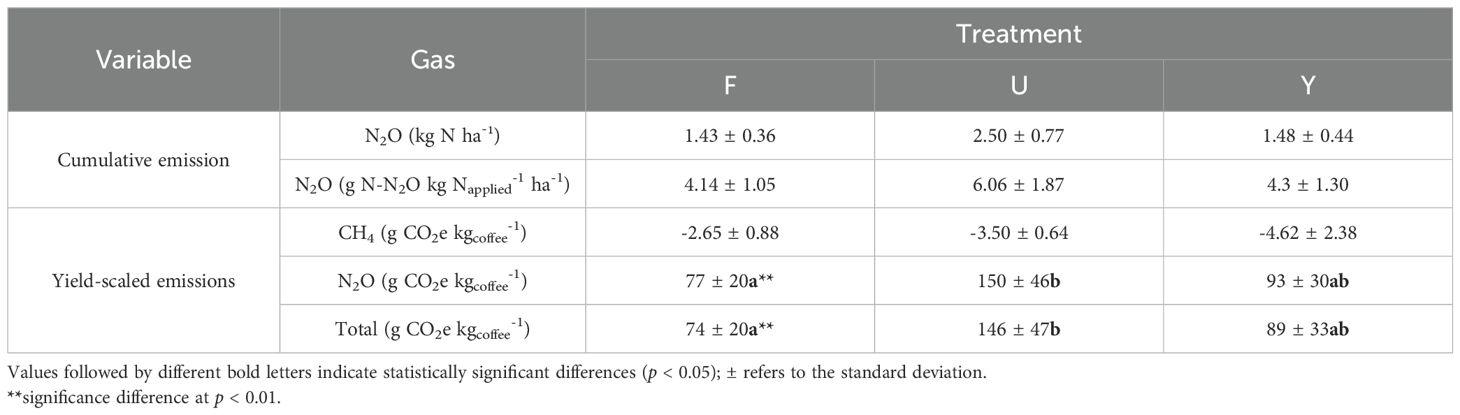
Table 4. Cumulative emission of N2O and Yield-scaled emissions of N2O and CH4 under nitrogen fertilization strategies (U, F, and Y) during a coffee crop cycle in the field experiment at Alsacia Farm, between June 10, 2024, and January 27, 2025.
4 Discussion
4.1 Coffee yield, N fertilization strategies and soil properties
The yields obtained from treatments F, U, and Y in Sector A were comparable to the national average projected for the 2024–2025 period (5, 591 kg ha-¹) (ICAFE, 2024). In contrast, yields in Sector B were about 50% lower (Figure 1B). Either among treatments or between field sectors, the N fertilization strategies evaluated in this study did not result in significant differences in coffee yield, similar to findings reported in Brazil, where the use of urea, urea + NBPT, and ammonium nitrate, did not affect short-term coffee productivity (Sarkis et al., 2023). The absence of yield differences does not necessarily imply that these fertilization strategies have equivalent effects on soil N dynamics, or that N gains and losses are comparable across treatments (Sadeghian-Khalajabadi et al., 2022), as additional factors (particularly soil properties) should be considered, as significant variability can occur even at the microtopographic scale within the same farm in Andisol soils (Francisco et al., 2023).
The sharp contrast between Sectors A and B could be influenced by differences in soil properties, primarily soil texture and extractable P levels (Tables 1, 3). Higher clay and silt content may affect key factors such as nutrient retention and availability (Le et al., 2023). The lower coffee yield observed in Sector B may be associated with its sandier texture (sandy loam), which likely reduced nutrient retention compared to the medium-textured Andisols considered optimal for coffee cultivation in Costa Rica (ICAFE, 2008), as observed in sector A (Supplementary Table 3). Despite the relevance of soil texture for coffee productivity, diagnostic analyses of this parameter are not commonly practiced by local producers. Moreover, the proportion of Andisols with sandy loam texture in Costa Rica is not reported in the national datasets published by the Costa Rican Coffee Institute (ICAFE). Also, typical characteristics of Andisols were observed, such as low bulk density and a high phosphorus (P) fixation capacity, the last one evidenced by extractable P levels below a critical threshold of 100 mg kg-¹ in both sectors (Cabalceta and Cordero, 1994; Hifnalisa et al., 2020). Andisols are known to contain minerals such as allophane, imogolite, and halloysite, which contribute to P fixation. The higher total iron (Fe) content observed in Sector A may be attributed to a greater abundance of alumino-ferrous minerals, which could also explain the lower initial levels of extractable Fe in Sector B, likely related to its lower clay content (Table 1) (Knabner and Amelung, 2014; Hifnalisa et al., 2020).
Phosphorus plays a key role in supporting the growth and yield of coffee plants, as it not only contributes directly to plant development but also enhances the uptake of other essential nutrients. P deficiency has been reported to reduce crop productivity by 30–40% (Tang and Riley, 2021; Hifnalisa et al., 2020; Nurcholis et al., 2024). In this study, the final P content in Sector B confirmed its status as the most limiting nutrient affecting productivity (Table 3). Additionally, both the initial and final soil pH values in the two sectors were within the “very strongly acid” to “strongly acidic” range, conditions under which inorganic phosphorus tends to precipitate with Fe and aluminum (Al) or becomes adsorbed onto clay minerals and oxide surfaces, thereby reducing its availability to plants. This effect was more pronounced in Sector B, which exhibited a lower buffering capacity (Msimbira and Smith, 2020; Quispe et al., 2025).
Following the implementation of N fertilization strategies, available P levels increased in Sector A (Table 3), whereas no significant changes were observed in Sector B. Notably, available P in Sector A closely tripled relative to its initial value, suggesting that improvements in soil fertility may partly explain the higher coffee yields recorded in this sector. These findings are consistent with those of Le et al. (2023), who reported that increases in available soil P were positively and proportionally correlated with coffee yield. Furthermore, their study indicated that a higher proportion of fine soil fractions (clay and silt) was associated with enhanced coffee productivity, supporting the previously noted textural differences between the two sectors.
4.2 Daily fluxes of CO2, CH4 and N2O
Daily CO2 fluxes during the evaluated phenological stages are comparable to the average daily fluxes reported for coffee cultivation in Brazil, which ranged from 82.1 to 206.7 mg CO2 m-² h-¹ (Vitória et al., 2019).
In this study, CO2 emissions increased consistently after each fertilization event, reflecting a rapid stimulation of soil microbial activity in response to nutrient inputs. The rise in mineral N likely enhanced microbial N cycling, which is tightly linked to carbon metabolism, thereby intensifying soil respiration. These findings suggest that fertilization acts as a short-term driver of CO2 fluxes, underscoring the importance of nutrient management strategies that minimize unintended carbon losses (Sosulski et al., 2020).
During the maturation stage, coffee plants undergo root senescence and a reduction in vegetative growth, while up to 70% of the annual dry matter is allocated to fruit development. At this stage, nutrient partitioning toward reproductive organs can reach levels four times greater than those directed to new vegetative tissues, with fruits immobilizing up to 95% of the absorbed K, P, and N. This shift in nutrient allocation likely reduces nutrient availability in the rhizosphere, which may partly explain the lower CO2 fluxes observed after the third fertilization event, corresponding to the late fruit development phase (Burgos et al., 2024; Magalhães et al., 2025).
The observed negative CH4 fluxes indicate that the coffee production system acted as a methane sink, regardless of the nitrogen fertilization strategy applied. This behavior is consistent with previous findings showing that agroforestry coffee systems often capture CH4 emissions compared to open-field systems, mainly due to differences in microclimate, soil organic matter dynamics, and carbon availability (Berhanu et al., 2023). The low bulk density of Andisols also promotes a high proportion of air-filled pore space, creating aerobic conditions that inhibit the activity of methanogenic microorganisms (Filho et al., 2025).
The processes of organic matter formation in Andisols generate carbon forms that are not readily available or mineralizable by soil microbes. These soils typically contain large amounts of humus, high concentrations of active aluminum complexed with organic matter, and low pH, which together enhance the microbial stability of organo–metallic associations (Aran et al., 2001). The resulting slow mineralization rates may favor methanotrophic bacteria capable of oxidizing methane diffusing from the atmosphere, further contributing to the negative CH4 fluxes observed. Consequently, methane production is likely suppressed in these soils, contrasting with the low but positive emissions often reported for other soil orders under coffee cultivation (Berhanu et al., 2023; Le Mer and Roger, 2001).
Increment of daily fluxes of N2O was likely more pronounced after the two first fertilization due to the stimulation of soil microbial activity driven by greater N availability under favorable soil moisture and temperature conditions (Montenegro, 2020; Nurcholis et al., 2024; Filho et al., 2025). However, these responses are inherently complex and may also be influenced by additional factors, including interactions between autotrophic root respiration, heterotrophic microbial activity, and various soil properties such as texture, pH, temperature, moisture content and organic matter levels (Chinchilla-Soto et al., 2021; Quiñones-Huatangari et al., 2022).
Daily fluxes of N2O patterns suggest that the combination of N addition, heavy rainfall, and brief drying periods plays a key role in triggering N2O emissions. Distinct peaks in N2O emissions were observed following the first and second fertilizer applications, coinciding with periods of heavy rainfall and subsequent brief drying phases (Figures 2C–D; Supplementary Table 4). The post-rainfall emission patterns are well documented in agricultural soils and reflect the dynamic response of nitrification and denitrification processes to changing moisture conditions (San Martin Ruiz et al., 2021), whose activity is influenced by rainfall through its effect on soil moisture. In this study, soil moisture remained within the 40–60% WFPS range (Supplementary Table 1), likely supporting the coexistence of oxic and anoxic microsites and enabling both processes to occur simultaneously (Quiñones-Huatangari et al., 2022; Sarkis et al., 2023). When heavy rains occur, waterlogged conditions drive high N2O productions by denitrification which remains dissolved in topsoil layer until it is likely released of N2O when soil dries (Giraldo-Sanclemente et al., 2025).
4.3 Cumulative emissions
In this study, the soil water-filled pore space (WFPS) remained within the 40–60% range, which does not promote anaerobic conditions and therefore limits CH4 production (Filho et al., 2025). The negative cumulative CH4 fluxes observed are consistent with previous findings in Costa Rican coffee systems on Andisol soils, which also showed net soil methane sequestration that was not associated with nitrogen fertilization (Hergoualc’h et al., 2008). Although the exclusion rate of CH4 data appears relatively high, it did not influence the overall patterns of CH4 flux. To confirm this, comparative analyses were performed both including and excluding the omitted data. In both cases, the coffee soil system consistently functioned as a CH4 sink, independent of soil sector or N fertilization treatment. The excluded data often showed negative fluxes with small and inconsistent slopes, suggesting that they likely resulted from ambient air fluctuations rather than actual CH4 uptake by the soil. Considering that each treatment included six replicates, this adjustment was implemented as part of our quality-control procedure without compromising the robustness of the dataset. Additionally, the reported exclusion rate includes the 4% of CO2 data initially removed under the first-tier gas quality criterion; thus, the CH4-specific exclusion rate was 22%.
The N2O emissions observed across the treatments, encompassing the three main fertilization periods of the coffee crop, fell within the range reported by Quiñones-Huatangari et al. (2022) (0.2–12.8 kg N ha-¹ yr-¹) in their review of fertilization-related N2O emissions from coffee cultivation in Costa Rica, Nicaragua, and Ecuador. Cumulative N2O fluxes did not differ significantly between treatments F and Y, mainly due to the temporal variability of daily emission peaks observed during the first four days following each of the three fertilization events (Figures 2C, 3C). These fluctuations were closely associated with rainfall events followed by short drying periods. This alternating emission pattern reflects the dynamic response of nitrification and denitrification processes to changing soil conditions, ultimately resulting in similar cumulative emissions between both treatments by the end of the cycle. In contrast, the highest cumulative N2O emissions were observed in treatment U, where a higher nitrogen rate was applied as conventional urea during the first fertilization event (285 kg N ha-¹ in treatment U vs. 106 kg N ha-¹ in treatments F and Y, respectively) (Figures 2C, 3C). Finally, in the second fertilization event, when all treatments received the same N rate, the reduction of N2O emissions from treatments Y and F compared to treatment U aligns with findings observed in coffee systems in Brazil, where the use of urea treated with NBPT and ammonium nitrate reduced N2O emissions by 50.6% and 78.5%, respectively, relative to conventional urea (Sarkis et al., 2023).
4.4 Refining data interpretation
Under the experimental conditions at the Alsacia farm in the Central Region of Costa Rica, the three fertilization strategies implemented by producers did not result in statistically significant differences in coffee yield. Nevertheless, at least biannual monitoring is necessary to generate robust evidence on the long-term effects of these strategies on crop productivity.
The findings of this study emphasize the pivotal role of soil properties in regulating coffee yield, highlighting the need for site-specific nutrient management to simultaneously support productivity and environmental sustainability. In Andisols, soil texture and P availability represent key determinants that can guide more efficient fertilization practices as enhancement of the P application could maximize the use of N (Zhang et al., 2017).
In addition, the selection of N fertilization strategies should integrate agrometeorological forecasts. In tropical regions such as Costa Rica, where the onset of the rainy season can lead to rapid and pronounced increases in N2O emissions, the timing of N application emerges as a critical management variable.
Collectively, these results reinforce the importance of adapting nutrient management strategies to local soil and climatic conditions to foster productive, resilient, and climate-smart coffee agroecosystems.
Data availability statement
The raw data supporting the conclusions of this article will be made available by the authors, without undue reservation.
Author contributions
WG-S: Conceptualization, Data curation, Formal Analysis, Investigation, Methodology, Writing – original draft, Writing – review & editing, Visualization. AP-C: Conceptualization, Data curation, Formal Analysis, Funding acquisition, Investigation, Methodology, Project administration, Supervision, Writing – original draft, Writing – review & editing. ME-B: Conceptualization, Funding acquisition, Project administration, Resources, Supervision, Writing – review & editing. CR-S: Conceptualization, Funding acquisition, Project administration, Resources, Supervision, Writing – review & editing.
Funding
The author(s) declare that financial support was received for the research and/or publication of this article. This work was funded by the Research Department of Starbucks Coffee Agronomy Company SRL and the Vice Presidency for Research of the University of Costa Rica through Project No. 802-C4-514. The funders were not involved in the study design, collection, analysis, interpretation of data, the writing of this article, or the decision to submit it for publication.
Conflict of interest
Authors ME-B and CR-S were employed by Starbucks Coffee Agronomy Company SRL.
The remaining author(s) declare that their work was conducted in the absence of any commercial or financial relationships that could be construed as a potential conflict of interest.
Generative AI statement
The author(s) declare that no Generative AI was used in the creation of this manuscript.
Any alternative text (alt text) provided alongside figures in this article has been generated by Frontiers with the support of artificial intelligence and reasonable efforts have been made to ensure accuracy, including review by the authors wherever possible. If you identify any issues, please contact us.
Publisher’s note
All claims expressed in this article are solely those of the authors and do not necessarily represent those of their affiliated organizations, or those of the publisher, the editors and the reviewers. Any product that may be evaluated in this article, or claim that may be made by its manufacturer, is not guaranteed or endorsed by the publisher.
Supplementary material
The Supplementary Material for this article can be found online at: https://www.frontiersin.org/articles/10.3389/fagro.2025.1729122/full#supplementary-material
References
Aran D., Gury M., and Jeanroy E. (2001). Organo-metallic complexes in an Andosol: A comparative study with a Cambisol and Podzol. Geoderma 99, 65–79. doi: 10.1016/S0016-7061(00)00064-1
Arifin M., Anda M., Rosyidin R., and Hamayun M. W. (2022). Characteristics of Andisols developed from andesitic and basaltic volcanic ash in different agro-climatic zones. Soils 6, 78. doi: 10.3390/soils6040078
Bentzon-Tarp A., Helgadóttir D., van den Meersche K., Gay F., Priemé A., Roupsard O., et al. (2023). Spatial-temporal variations of nitrous oxide emissions in coffee agroforestry systems in Costa Rica. Agriculture Ecosyst. Environ. 343, 108257. doi: 10.1016/J.AGEE.2022.108257
Berhanu Y., Nigussie A., Jifar A. A., Ahmed M., Biresaw A., Mamuye M., et al. (2023). Nitrous oxide and methane emissions from coffee agroforestry systems with different intensities of canopy closure. Sci. Total Environ. 876, 162821. doi: 10.1016/J.SCITOTENV.2023.162821
Burgos A., Rendón J., Quinchua L., and Herrera M. (2024). Increased fruit load influences vegetative growth, dry mass partitioning, and bean quality attributes in full-sun coffee cultivation. Front. Sustain. Food Syst. 8. doi: 10.3389/fsufs.2024.1379207
Cabalceta G. and Cordero A. (1994). Niveles críticos de fósforo en Ultisoles, Inceptisoles, Vertisoles y Andisoles de Costa Rica. Agronomía Costarricense 18, 147–161.
Castro-Tanzi S., Dietsch T., Urena N., Vindas L., and Chandler M. (2012). Analysis of management and site factors to improve the sustainability of smallholder coffee production in Tarrazú, Costa Rica. Agriculture Ecosyst. Environ. 155, 172–181. doi: 10.1016/J.AGEE.2012.04.013
Chagas W., Guelfi D., Lacerda J., and Pinto L. (2019). Coffee science. Available online at: https://coffeescience.ufla.br/index.php/Coffeescience/article/view/1528 (Accessed October 10, 2025).
Chinchilla-Soto C., Durán-Quesada A., Monge-Muñoz M., and Gutiérrez-Soto M. (2021). Quantifying the annual cycle of water use efficiency, energy and CO2 fluxes using micrometeorological and physiological techniques for a coffee field in Costa Rica. Forests 12, 889. doi: 10.3390/f12070889
Dawar K., Sardar K., Zaman M., Müller C., Sanz A., Khan A., et al. (2021). Effects of the nitrification inhibitor nitrapyrin and the plant growth regulator gibberellic acid on yield-scale nitrous oxide emission in maize fields under hot climatic conditions. Pedosphere 31, 323–331. doi: 10.1016/S1002-0160(20)60076-5
De Souza T. L., de Oliveira D. P., Santos C. F., Reis T. H. P., Cabral J. P. C., da Silva Resende É.R., et al. (2023). Nitrogen fertilizer technologies: Opportunities to improve nutrient use efficiency towards sustainable coffee production systems. Agriculture Ecosyst. Environ. 345, 108317. doi: 10.1016/J.AGEE.2022.108317
Filho J., Cavalcante V., Silva B., Teixera R., Silva I., and Soarez E. (2025). Greenhouse gas emissions in coffee plantations on a bauxite-mined soil undergoing reclamation: Management fertilizer and cover crop. Ecol. Eng. 219, 107704. doi: 10.1016/j.ecoleng.2025.107704
Francisco E. A., Kinoshita R., Sourideth V., Shimada H., Kishimoto A., Higashi Y., et al. (2023). Effects of microtopography on within-field spatial variation of inherent soil properties in Andosols of Tokachi district, Hokkaido. Soil Sci. Plant Nutr. 70, 53–64. doi: 10.1080/00380768.2023.2270640
Freitas T., Bartelega L., Santos C., Dutra M., Sarkis L., Guimarães R., et al. (2022). Technologies for fertilizers and management strategies of N-fertilization in coffee cropping systems to reduce ammonia losses by volatilization. Plants 11, 3323. doi: 10.3390/plants11233323
Freitas V., Borges L., Vidigal M., dos Santos M., and Stringueta P. (2024). Coffee: A comprehensive overview of origin, market, and the quality process. Trends Food Sci. Technol. 146, 104411. doi: 10.1016/j.tifs.2024.104411
Giraldo-Sanclemente W., Pérez-Castillo A. G., Monge-Muñoz M., Chinchilla-Soto C., Chavarría L., Alpízar-Marín M., et al. (2025). Impact of urease inhibitor on greenhouse gas emissions and rice yield in a rainfed transplanting rice system in Costa Rica. Front. Agron. 7). doi: 10.3389/fagro.2025.1518802
Hergoualc’h K., Skiba U., Harmand M., and Hénault C. (2008). Fluxes of greenhouse gases from Andosols under coffee in monoculture or shaded by Inga densiflora in Costa Rica. Biogeochemistry. 89, 329–345. doi: 10.1007/s10533-008-9222-7
Hifnalisa H., Karim A., Manfarizah M., and Syakur S. (2020). P status of Andisol and its correlation with P content of Arabica coffee leaves in Bener Meriah District. IOP Conf. Series: Earth Environ. Sci. 425, 12064. doi: 10.1088/1755-1315/425/1/012064
Instituto del Café de Costa Rica (ICAFE) (2008). Indicación Geográfica “Café de Costa Rica”. Available online at: https://www.icafe.cr/wpcontent/uploads/indicacion_geografica/Pliego%20de%20Condiciones.pdf (Accessed November 10, 2024).
Instituto del Café de Costa Rica (ICAFE) (2024). Informe sobre la actividad cafetalera de Costa Rica. (Heredia, Costa Rica). Available online at: https://www.icafe.cr/wp-content/uploads/informacion_mercado/informes_actividad/actual/Informe%20Actividad%20Cafetalera.pdf (Accessed October 10, 2025).
Intergovernmental Panel on Climate Change (IPCC) (2021). “Climate change 2021: the physical science basis,” in Contribution of working group I to the sixth assessment report of the intergovernmental panel on climate change. Eds. MassonDelmotte V., Zhai P., Pirani A., Connors S. L., Péan C., Berger S., Caud N., Chen Y., Goldfarb L., Gomis M. I., Huang M., Leitzell K., Lonnoy E., Matthews J. B. R., Maycock T. K., Waterfield T., Yelekçi O., Yu R., and Zhou B. (Cambridge, UK; New York, NY, USA: Cambridge University Press). doi: 10.1017/9781009157896IPCC
International Coffee Organization (ICO) (2023). “Beyond coffee,” in Coffee development report (London, United Kingdom: International Coffee Organization), 1–118.
Knabner I. and Amelung W. (2014). Dynamics, chemistry, and preservation of organic matter in soils. Treatise Geochemistry 12, 157–215.
Le V. H., Truong C. T., Le A. H., and Nguyen B. T. (2023). A combination of shade trees and soil characteristics may determine robusta coffee (Coffea canephora) yield in a tropical monsoon environment. Agronomy 13, 1–15. doi: 10.3390/agronomy13010065
Le Mer J. and Roger P. (2001). Production, oxidation, emission and consumption of methane by soils: A review. Eur. J. Soil Biol. 37, 25–50. doi: 10.1016/S1164-5563(01)01067-6
Magalhães W., Araujó S., Cecon P., Nogueira M., and Martinez H. (2025). Root growth, leaf and root chemical composition along coffee fruit development. J. Soil Sci. Plant Nutr. 25, 1968–1981. doi: 10.1007/s42729-025-02249-7
Maina J., Nutwiwa U., Kituu G., and Githiru M. (2015). Evaluation of greenhouse gas emissions along the small-holder coffee supply chain in Kenya. J. Sustain. Res. Eng. 2, 111–120.
Montenegro J. (2020). Efecto de diferentes fuentes de nitrógeno en la emisión de óxido nitroso en plantaciones de café en Costa Rica. Rev. Cienc. Ambientales 54, 111–130. doi: 10.15359/rca.54-2.6
Msimbira L. and Smith D. (2020). The roles of plant growth promoting microbes in enhancing planta tolerance to acidity and alkalinity stresses. Front. Sustain. Food Syst. 4. doi: 10.3389/fsufs.2020.00106
Nurcholis O., Nugroho A., Nugroho R., Prayogo C., and Kurniawan S. (2024). Trees and soil management impacts on soil nutrient and coffee production in coffee-based agroforestry. Earth Environ. Science. 1299, 12003. doi: 10.1088/1755-1315/1299/1/012003
Pérez-Castillo A. G., Arrieta-Méndez J., Elizondo-Salazar J., Monge-Muñoz M., and Sanz-Cobena A. (2021). Using the nitrification inhibitor Nitrapyrin in dairy farm effluents does not improve yield-scaled nitrous oxide and ammonia emissions but reduces methane flux. Front. Sustain. Food Syst. 5. doi: 10.3389/fsufs.2021.620846
Quiñones-Huatangari F., Zarate. F., and Huaccha-Castillo H. (2022). Nitrous oxide emmisions generated in coffee cultivation: A systematic review. Nat. Environ. pollut. Technology. 21, 1697–1703. doi: 10.46488/NEPT.2022.v21i04.023
Quispe K., Hermoza N., Mejia S., Chavez L., Ottos E., Arce A., et al. (2025). Spatial analysis of soil acidity and available phosphorus in coffee-growing areas of Pichanaqui: Implications for liming and site-specific fertilization. Agriculture 15, 1632. doi: 10.3390/agriculture15151632
Ramírez-Builes V. H., Küsters J., Thiele E., and Lopez-Ruiz J. C. (2024). Physiological and agronomical response of coffee to different nitrogen forms with and without water stress. Plants (Basel) 13, 1387. doi: 10.3390/plants13101387
Rosales M. and Sandoval D. (2016). Mapa digital órdenes de suelo de Costa Rica (San José, Costa Rica: Centro de Investigaciones Agronómicas, Universidad de Costa Rica).
Sadeghian-Khalajabadi S., Acuña-Zornosa J., Gutiérrez-Salazar L., and Rey-Sandoval J. (2022). Determinants of nitrogen use efficiency in coffee crops. A review. Rev. Cienc. Agrícolas 39, 198–219. doi: 10.22267/rcia.223902.183
Sahrawat K. L. (2008). Factors affecting nitrification in soils. Commun. Soil Sci. Plant Anal. 39, 1436–1446. doi: 10.1080/00103620802004235
Salamanca-Jimenez A., Doane T. A., and Horwath W. R. (2017). Nitrogen use efficiency of coffee at the vegetative stage as influenced by fertilizer application method. Front. Plant Sci. 8. doi: 10.3389/fpls.2017.00223
San Martin Ruiz M., Reiser M., and Kranert M. (2021). Nitrous oxide emission fluxes in coffee plantations during fertilization: A case study in Costa Rica. Atmosphere 12, 1656. doi: 10.3390/atmos12121656
Sarkis L. F., Dutra M. P., dos Santos C. A., Rodrigues B. J., Urquiaga S., and Guelfi D. (2023). Nitrogen fertilizers technologies as a smart strategy to mitigate nitrous oxide emissions and preserve carbon and nitrogen soil stocks in a coffee crop system. Atmospheric Environment: X 20, 100224. doi: 10.1016/j.aeaoa.2023.100224
Sosulski T., Szara E., Szymanska M., Stepniewska Z., and Stepniewski W. (2020). N2O and CO2 emissions from bare soil: effect of fertilizer management. Agriculture 10, 602. doi: 10.3390/agriculture10120602
Tang J. and Riley W. (2021). Finding Liebig´s law of the minimum. Ecol. Appl. 31, e02458. doi: 10.1002/eap.2458
Vitória Y., Leite C., Delgado R., Moreira G., Evandro O., Quartezani W., et al. (2019). Soil carbon dioxide efflux in conilon coffee (Coffea canephora Pierre ex A. Froehner) plantations in different phenological phases in tropical climate in Brazil. Chilean J. Agric. Res. 79, 366–375. doi: 10.4067/S0718-58392019000300366
Wang F., Chen S., Zhang K., Shen S., and Zhu-Barker X. (2016). Impact of nitrogen fertilizer source on nitrous oxide (N2O) emissions from three different agricultural soils during freezing conditions. Toxicogical Environ. Chem. 98, 551–560. doi: 10.1080/02772248.2015.1133374
Wang H., Yan Z., Ju X., Song X., Zhang J., Li S., et al. (2023). Quantifying nitrous oxide production rates from nitrification and denitrification under various moisture conditions in agricultural soils: Laboratory study and literature synthesis. Front. Microbiol. 13. doi: 10.3389/fmicb.2022.1110151
Keywords: ammonium nitrate, coffee, phosphorous, site-specific nutrient, soil fertility, urea
Citation: Giraldo-Sanclemente W, Pérez-Castillo AG, Elizondo-Barquero M and Rodríguez-Solís CM (2025) Coffee yield is influenced by soil properties, not by nitrogen fertilization strategies, under greenhouse gas monitoring in a Costa Rican Andisol. Front. Agron. 7:1729122. doi: 10.3389/fagro.2025.1729122
Received: 20 October 2025; Accepted: 17 November 2025; Revised: 12 November 2025;
Published: 09 December 2025.
Edited by:
Ioanna Kakabouki, Agricultural University of Athens, GreeceReviewed by:
Arnold Mashingaidze, Chinhoyi University of Technology, ZimbabweLenin Quiñones Huatangari, Universidad Nacional Toribio RodrÃguez de Mendoza de Amazonas, Peru
Copyright © 2025 Giraldo-Sanclemente, Pérez-Castillo, Elizondo-Barquero and Rodríguez-Solís. This is an open-access article distributed under the terms of the Creative Commons Attribution License (CC BY). The use, distribution or reproduction in other forums is permitted, provided the original author(s) and the copyright owner(s) are credited and that the original publication in this journal is cited, in accordance with accepted academic practice. No use, distribution or reproduction is permitted which does not comply with these terms.
*Correspondence: Ana Gabriela Pérez-Castillo, YW5hLnBlcmV6Y2FzdGlsbG9AdWNyLmFjLmNy