 Zhibang Hu1,2
 Chunhui Wang1Jianrong Xue1Shiyu Yang1Yongzheng Bao1Yunhui Wu2Xiaoju Hou2Yishake Kaiseer2Jing Ma1*
- 1Department of Otorhinolaryngology, Changzhou Third People’s Hospital, Changzhou Medical Center, Nanjing Medical University, Changzhou, China
- 2Department of Eye and ENT, The People’s Hospital of Wuqia, Kezhou, China
Background: Allergen exposure plays a critical role in the onset of allergic disease, and the distribution of allergens varies by geographic location, climate, and lifestyle.
Methods: A retrospective analysis was conducted on the data of 4,149 patients with clinically suspected allergic diseases who sought medical care at Changzhou Third People's Hospital. The total IgE and specific IgE (sIgE) levels for 19 inhaled and food allergen sources were assessed using the Mediwiss AllergyScreen system. The sensitization patterns to various allergen sources were delineated based on sex and age categories.
Results: A total of 2,491 (60.04%) patients were positive for sIgE to at least one allergen source. Specifically, 997 (40.02%) patients were positive for one allergen source, while 1,494 (59.98%) were positive for two or more allergen sources. The sensitization rate for inhaled allergen sources was 49.41% (2,050), which was significantly higher than that for food allergen sources at 36.61% (1,519) (p < 0.05). The most commonly inhaled allergen source was D. pteronyssinus (37.58%, 1,559/4,149), followed by mold mix (13.11%, 544/4,149) and house dust (9.11%, 378/4,149). Among food allergen sources, the most prevalent reactions were cashew nut (15.57%, 646/4,149), cow's milk (10.99%, 456/4,149), and egg (9.33%, 387/4,149). The majority of sIgE levels were concentrated in the lower grades (grade I to III), while eight cases of crab and six cases of shrimp allergen sources presented at the highest responses (grade IV). Males exhibited significantly higher sIgE-positive rates for both inhaled and food allergen sources than females (p < 0.05). Additionally, the sIgE-positive rates for most inhaled and food allergen sources displayed significant variations across different age groups (p < 0.05). The highest sIgE-positive rate for inhaled allergen sources was observed in the 11–15 years group, and the positive rates of sIgE for food allergen sources decreased with advancing age. The levels of total serum IgE also varied among different age groups, with 2,631 (63.41%) individuals belonging to the high-concentration group. Total serum IgE exhibited an upward trend until the age of 11–15 years, which was then followed by a steady decrease.
Conclusion: The results revealed the sensitization characteristics of allergen sources in eastern China, providing valuable insights into the prevention, diagnosis, and management of allergic diseases in this region.
1 Introduction
Allergic diseases are a group of chronic inflammatory disorders that occur after exposure to allergens, including allergic rhinitis (AR), asthma, atopic dermatitis, and drug and food allergy. In some severe cases, patients may even progress to anaphylaxis (1). The symptoms of allergic diseases are diverse, mainly including nasal itching, sneezing, runny nose, red or itchy eyes, tearing, skin itching, coughing, shortness of breath or breathlessness, abdominal pain, diarrhea, and vomiting. These symptoms significantly impair patients’ quality of life and can even threaten their lives (2–4). Over the past few decades, industrial development and lifestyle changes have led to varying rates of increase in the prevalence of allergic diseases (5, 6). Indeed, it is estimated that approximately 30%–40% of the global population suffers from one or more allergic conditions, thereby imposing a significant medical and economic burden on those affected (7, 8).
The pathogenesis of allergic diseases remains unclear, with both genetic and environmental factors playing critical roles in their occurrence and progression (9). The primary trigger for allergic diseases is exposure to allergens, and existing research has demonstrated a dose–response relationship between the prevalence of allergic diseases and allergen specific IgE (sIgE) levels (10). This emphasizes the significance of recognizing various allergen types and their distribution patterns for effective prevention, diagnosis, and treatment. In clinical practice, the most prevalent allergen source testing methods are the skin prick test (SPT) and serum-sIgE assessments. Notably, serum sIgE testing stands out due to its characteristic of being unaffected by antihistamine drugs and avoidance of SPT-related discomfort, solidifying its reputation as a dependable approach for allergen source identification (11). The distribution of allergen sources is influenced by various factors, including ethnicity, climate, seasonal variations, and lifestyle (12–14). However, large-scale studies on allergen sources in patients with allergic diseases are scarce in Changzhou, eastern China. Therefore, in this study, we retrospectively analyzed the serum sIgE and total IgE results from patients with allergic diseases who were treated at Changzhou Third People's Hospital between January 2018 and December 2019, aiming to provide a basis for the precise diagnosis and treatment of allergic diseases in the eastern region of China.
2 Materials and methods
2.1 Study design
In this retrospective study, a total of 4,149 patients with suspected allergic diseases, including 2,229 males (53.72%) and 1,920 females (46.28%), were enrolled from January 2018 to December 2019 in Changzhou Third People's Hospital, Jiangsu Province, eastern China. All patients presented with allergic symptoms, such as nasal itching, sneezing, rhinorrhea, red or itchy eyes, skin itching, eczema, urticaria, coughing and shortness of breath. The age of the subjects ranged from 8 months to 91 years, and the subjects were categorized into nine groups: 1–5, 6–10, 11–15, 16–20, 21–30, 31–40, 41–50, 51–60, and >60 years. This stratification encompassed populations from childhood to the elderly. All participants were screened for serum sIgE and total IgE using the Mediwiss AllergyScreen system.
2.2 Allergyscreen test
Nineteen sIgE levels for inhaled and food allergen sources and total IgE levels were assessed in serum samples using the AllergyScreen test by Mediwiss Analytic GmbH, Moers, Germany, following the manufacturer's instructions. The inhaled allergen sources tested were D. pteronyssinus, house dust, mulberry, cat dander, dog hair, cockroache, amaranth, mold mix, grass mix, and tree pollen mix. Food allergen sources included egg, cow's milk, shrimp, beef, shellfish, crab, mango, cashew nut, and pineapple. The results were semi-quantitative and categorized based on the following scale: grade 0 (<0.35 IU/ml); grade I (0.35–0.70 IU/ml); grade II (0.71–3.5 IU/ml); grade III (3.6–17.5 IU/ml); grade IV (17.6–50 IU/ml); grade V (51–100 IU/ml); and grade VI (>100 IU/ml). A positive sIgE concentration was defined as ≥0.35 IU/ml. The total serum IgE levels were categorized into three groups: low-concentration group (<100 IU/ml); medium-concentration group (100–200 IU/ml); and high-concentration group (>200 IU/ml).
2.3 Sample size
The study was performed at the foremost allergic disease diagnosis and treatment center in Changzhou, where the sample size was set based on the number of patients who visited during the study period.
2.4 Statistical analysis
Data analysis was conducted using IBM SPSS Statistics for Windows, Version 27.0. The rates of sIgE positivity were compared using either the chi-square test or Fisher's exact probability method, whereas total IgE levels were compared using the Kruskal–Wallis test. Statistical significance was defined as p < 0.05.
3 Results
3.1 Characteristics of the study population
A total of 4,149 participants were enrolled in this retrospective study: 2,229 (53.72%) males and 1,920 (46.28%) females. The median age was 23 years (range: 8 months to 91 years). A total of 2,491 (60.04%) patients were positive for sIgE to at least one allergen source. A total of 997 participants (40.02%) were positive for one source and 1,494 (59.98%) were positive for two or more sources. The positive sIgE rate of inhaled allergen sources was 49.41% (2,050), significantly higher than that of food allergen sources 36.61% (1,519) (χ2 = 138.63, p < 0.001) (Table 1).
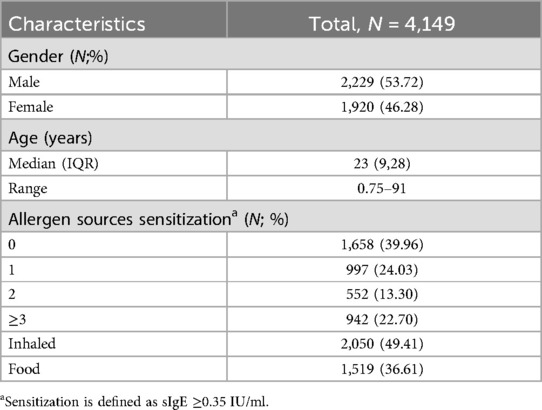
Table 1. Clinical characteristics of the patients.
3.2 Prevalence of allergen source sensitization among patients
The most common inhaled allergen source was D. pteronyssinus (37.58%, 1,559/4,149), followed by mold mix (13.11%, 544/4,149) and house dust (9.11%, 378/4,149). The most common food allergen sources were cashew nut (15.57%, 646/4,149), cow's milk (10.99%, 456/4,149), and egg (9.33%, 387/4,149) (Table 2). As is shown in Figure 1, The majority of positive sIgE results were concentrated in the lower levels (grades I to III). D. pteronyssinus exhibited the most potent allergenicity, with 10.45% (163) of cases reaching grade VI, which was notably elevated compared with other allergens. Additionally, crab and shrimp were the only food allergen sources that elicited high-grade reactions, with eight and six cases of grade VI, respectively.
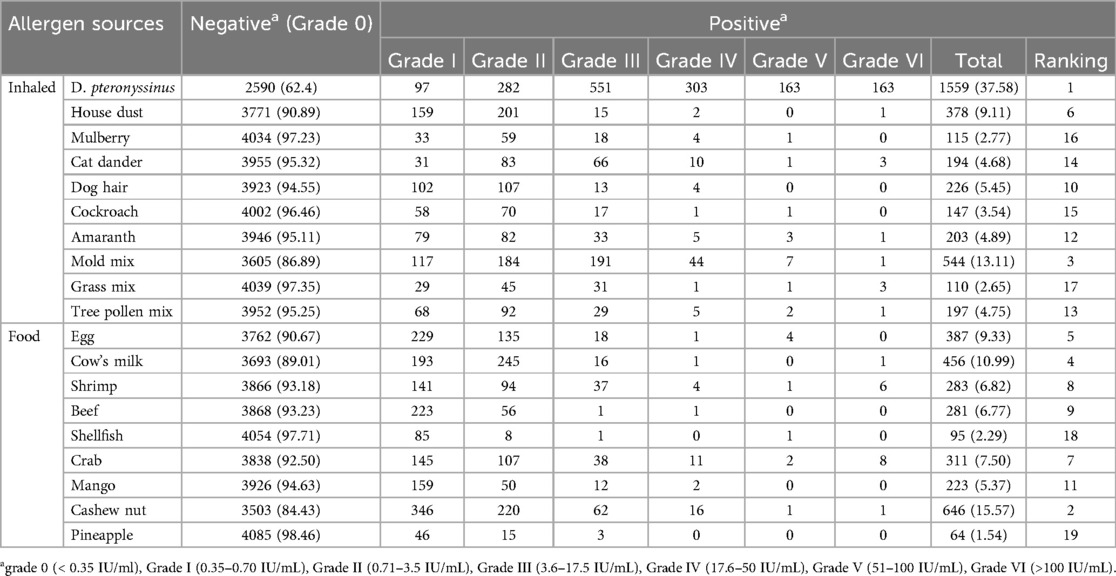
Table 2. Sensitization rates of 19 common allergen sources, n (%).
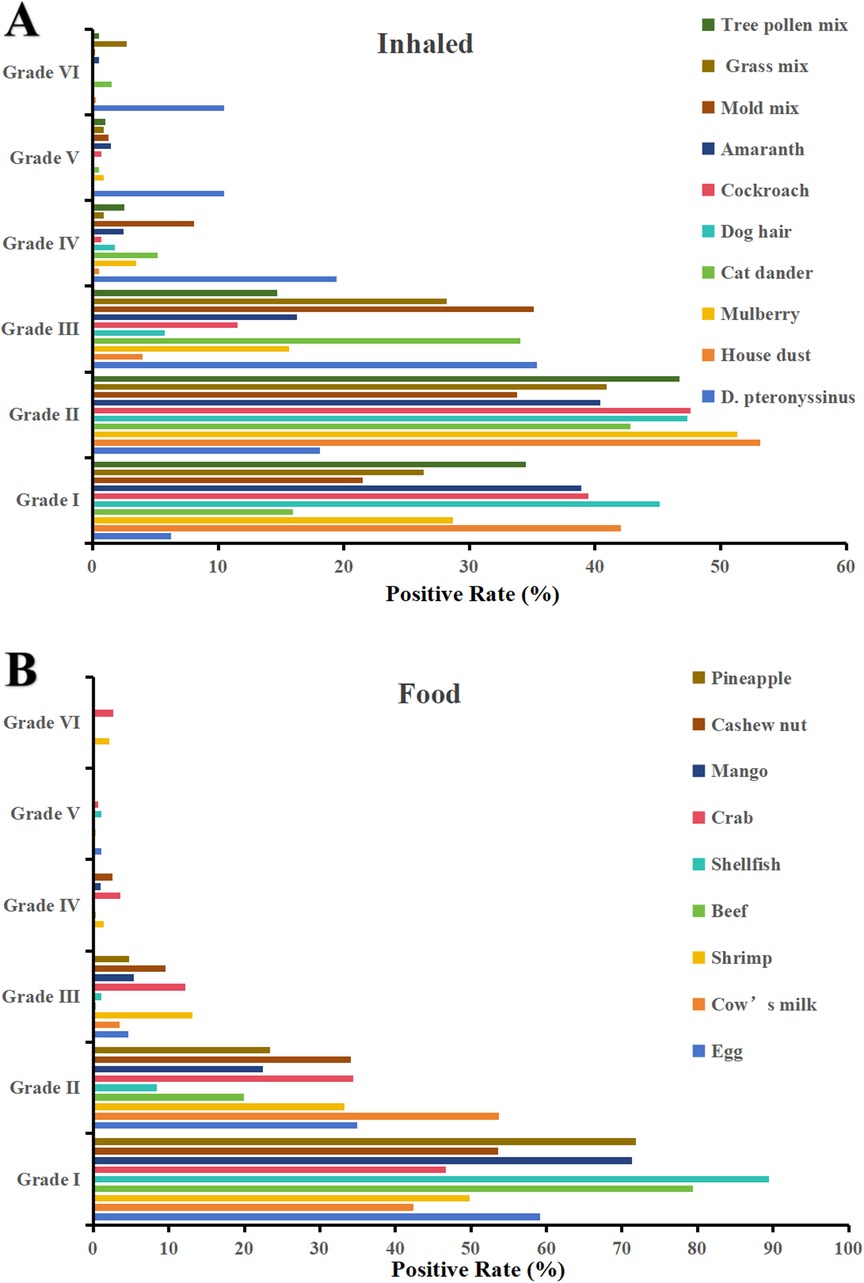
Figure 1. Distribution of sIgE grades for (A) inhaled and (B) food allergen sources (grade 0 excluded).
3.3 Allergen source sensitization in different sex groups
The positive rates of sIgE in overall allergen sources (63.44% vs. 56.09%), inhaled allergen sources (53.30% vs. 44.90%), and food allergen sources (39.12% vs. 33.70%) in male patients were significantly higher than those in female patients (χ2 = 23.18; 29.13; 13.07, p < 0.001) (Table 3). Further analysis revealed that D. pteronyssinus (χ2 = 11.81, p < 0.001), house dust (χ2 = 6.70, p = 0.01), cat dander (χ2 = 16.78, p < 0.001), dog hair (χ2 = 31.00, p < 0.001), mold mix (χ2 = 11.49, p < 0.001), cow's milk (χ2 = 28.92, p < 0.001), shrimp (χ2 = 6.70, p = 0.01), beef (χ2 = 8.87, p = 0.003), crab (χ2 = 10.13, p = 0.001), and cashew nut (χ2 = 11.19, p < 0.001) showed the same trend (Table 4).
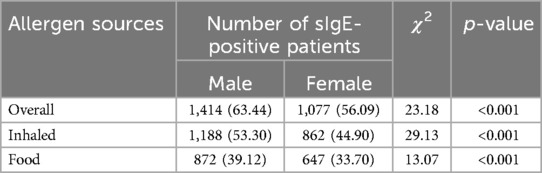
Table 3. Sensitization rates of overall allergen sources in different sex groups, n (%).
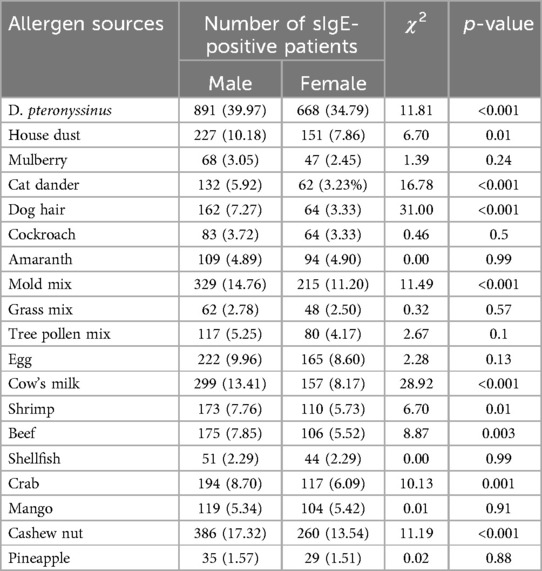
Table 4. Sensitization rates of 19 allergen sources compared by sex, n (%).
3.4 Allergen source sensitization in different age groups
The sIgE-positive rates of inhaled allergen sources were significantly higher than those of food allergen sources ranged from 6 to 10 years to 41–45 years(χ2 = 47.61; 73.39; 20.55; 35.81; 13.72; 5.94, p < 0.05) (Table 5). As illustrated in Figure 2, the sensitization rate of inhaled allergen sources increased with age in the young age group, peaked at 11–15 years, and then declined. The sIgE-positive rates of food allergen sources decreased with increasing age. Table 6 shows that, except for mulberry, cockroach, tree pollen mix, shellfish, mango, and pineapple, the prevalence of sIgE for other inhalant and food allergen sources showed significant differences in different age groups (p < 0.05).
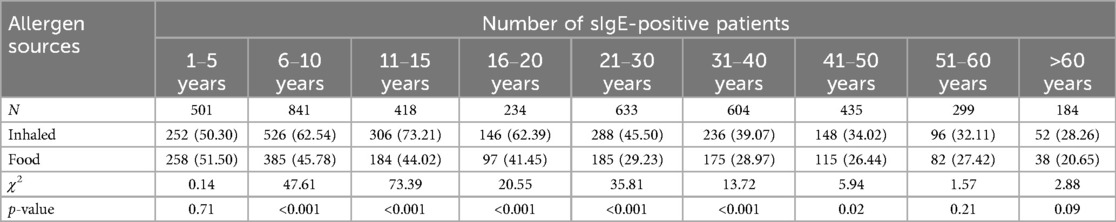
Table 5. Sensitization rates to inhaled and food allergen sources across nine age groups, n (%).
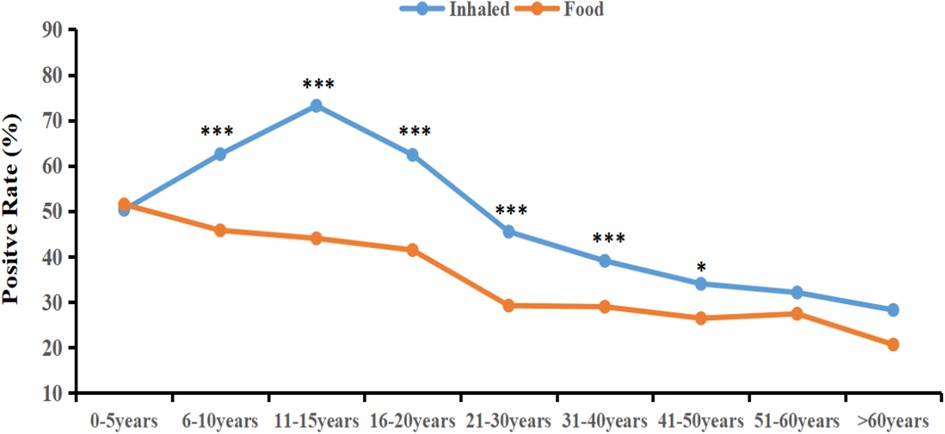
Figure 2. The sIgE-positive rates of inhaled and food allergen sources in differenr age groups. *P < 0.05; ***P < 0.001.
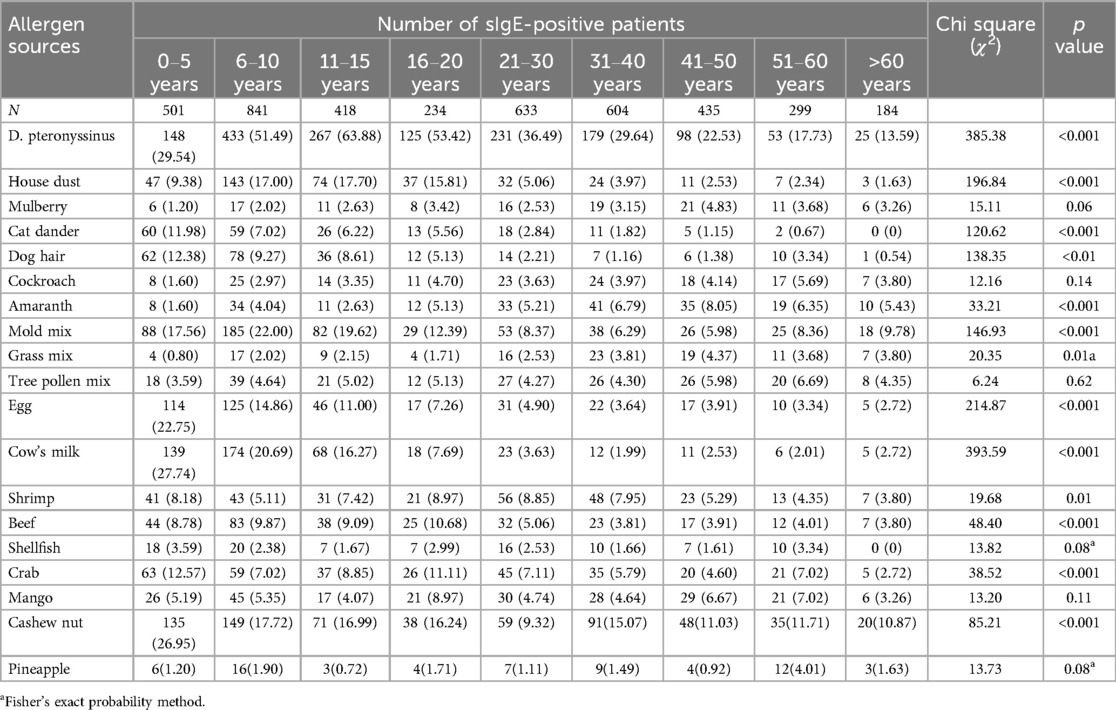
Table 6. Positive rates of sIgE to individual allergen sources in different age groups, n (%).
As shown in Table 7, 1,157 patients (27.89%) were in the low-concentration group, 361 (8.70%) were in the medium-concentration group, and 2,631 (63.41%) were in the high-concentration group. The levels of total serum IgE varied across different age groups (H = 100.56; p < 0.001). The high-concentration group generally showed an increasing trend up to the age of 11–15 years, followed by a gradual decline.
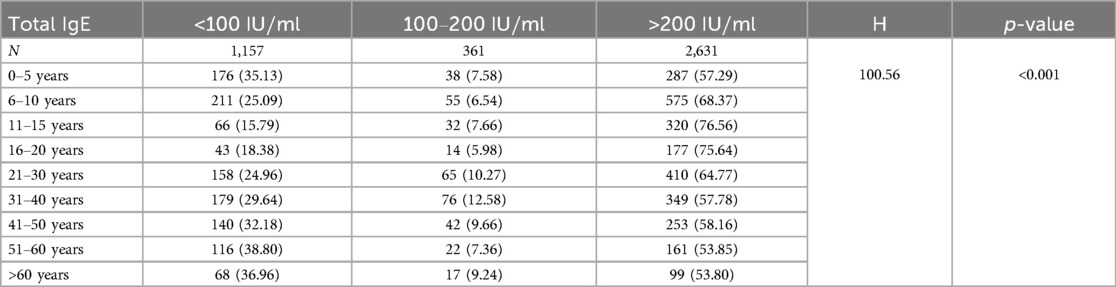
Table 7. Total Serum IgE level in different age groups, n (%).
4 Discussion
Over the past few decades, the prevalence of allergic diseases has significantly increased worldwide, particularly in industrialized nations (15). A comprehensive study spanning 18 Chinese cities revealed that the self-reported prevalence of AR among adults was 17.6%, with asthma and atopic dermatitis affecting 4.2% and 2.42% of the adult population, respectively (16–18). It is worth noting that the incidence rates are even more pronounced among children and adolescents. Specifically, in Wuhan, China, 28.6% of children aged 6–12 years suffered from AR (19). Moreover, in 2020, the prevalence of asthma among 4-year-old urban boys in China escalated to 10.27%, and atopic dermatitis affected 12.94% of children aged 1–7 years (20, 21).
Previous research has highlighted substantial regional variations in allergen source distribution. In Europe and the Americas, common inhaled allergen sources include pollen, house dust mites, and pet dander, whereas food allergen sources predominantly consist of peanuts, milk, and eggs during childhood (22–25). Conversely, in Asia, sensitization to house dust mites is generally the most prevalent, but the spectrum of food allergies is more diverse (26–29). Notably, sensitization rates to shellfish and seafood in Southeast Asia are significantly higher than those in other regions (30). Furthermore, climatic conditions play a pivotal role in allergen source distribution. In tropical and subtropical regions, sensitization to house dust mites is often positively correlated with the annual average humidity, whereas in temperate regions, seasonal pollen allergies are more prevalent (31, 32).
Our study included 4,149 patients and revealed that 60.04% of the participants tested positive for sIgE from at least one allergen source. Among them, 59.98% were positive for two or more allergen sources. Identifying the primary causative allergen source is essential among polysensitized individuals, as allergen avoidance is a key therapeutic approach for allergic diseases. Therefore, it is vital to combine clinical data, patient history, and allergen challenge tests to precisely identify the main culpable allergen source, thereby guiding future medical practices. We found the sIgE-positive rate of inhaled allergen sources (49.41%) to be significantly higher than that of food allergen sources (36.61%, P < 0.05), which is similar to the findings of previous studies (33, 34). Among the inhaled allergen sources, D. pteronyssinus emerged as the most prevalent (37.58%), echoing broader trends in Asia (35, 36). Notably, mold mix (13.11%) and house dust (9.11%) also exhibited relatively high positive rates of sIgE. This could be linked to Changzhou's subtropical maritime climate, which is characterized by persistent high humidity and rainfall, especially during the plum rain season, creating an ideal habitat for mold and mite growth. Simultaneously, owing to the relatively developed economy of Changzhou and the escalating trend of pet ownership among households, we noted substantial positive sIgE rates of 5.45% for dog hair and 4.68% for cat dander. These findings indicate the necessity for heightened vigilance toward pet allergen prevention in the future. In terms of food allergen sources, cashew nut was the predominant source (15.57%), followed by cow's milk (10.99%). This result is similar to Sun's findings (37), potentially attributed to regional dietary disparities. For instance, the prevalent consumption of snacks made from nuts and the increased intake of dairy products could influence these patterns (38, 39). In this study, D. pteronyssinus not only topped the allergen source-positive rate but also exhibited a significantly higher proportion of high-grade sensitization compared with other allergen sources. This may stem from prolonged exposure coupled with intense immune responses. Clinicians should remain vigilant regarding severe allergic reactions, which can escalate rapidly and pose fatal risks. A previous study indicated that sIgE activity can affect the severity of allergic reactions (40). It is well known that dust mites and shrimp share cross-allergenic reactions via tropomyosin (41). Furthermore, due to the coastal geographical location and abundant seafood supply, seafood has become a primary food allergen source in China, Thailand, Singapore, and other Asian countries (30). Our findings highlighted eight crab and six shrimp cases with sIgE levels equivalent to grade VI, suggesting that individuals who are allergic to crab or shrimp should be particularly cautious about severe allergic reactions.
Previous research has revealed sex differences in allergen source sensitization rates, with some studies indicating higher rates among males and others reporting the opposite among females (42, 43). We found that male patients exhibited elevated sensitization rates for overall allergen sources (63.44% compared to 56.09% in females), inhaled allergen sources (53.30% vs. 44.90%), and food allergen sources (39.12% vs. 33.70%) (P < 0.001). This observed sex disparity could be attributed to factors such as increased outdoor activity or occupational exposure among males, or the influence of male hormones on immune system responses, as suggested by previous studies (44). However, there is currently a dearth of direct evidence to corroborate these theories. Future investigations should explore sex-specific sensitization pathways through cohort studies or by examining molecular mechanisms.
The distribution of allergen sources among patients with allergic diseases varies according to age. Epidemiological studies have revealed that infants mostly react positively to food allergen sources, whereas school-aged children are more sensitive to inhaled allergen sources (45–47). Our study indicates that the highest positive rate of sIgE for inhaled allergen sources was observed during adolescence (11–15 years), reaching 73.21%, and then decreased with advancing age. Conversely, the positive rate of food allergen sources decreased steadily with age. Notably, from age 6–50 years, the positive rate for inhaled allergen sources surpassed that of food allergen sources, which is consistent with the aforementioned trend. This trend could be attributed to factors such as increased indoor activity and the immune system's maturation. Infants aged 0–5 years exhibited significantly higher positive rates for milk, eggs, and cashews than other age groups. This may be explained by their underdeveloped intestinal barrier and incomplete immune tolerance. Furthermore, the sensitization rates to cat and dog dander were significantly higher in this age group, reaching 11.98% and 12.38%, respectively. This could be due to their immature immune systems and possibly greater exposure to pets in households in the studied region. Moreover, Zhu et al. found that among children sensitized to cat or dog allergen sources, the sensitization rate was significantly higher in patients with a parental allergy history than in those without a family history of allergic diseases (48). Therefore, parents are advised to minimize close contact between infants and pets.
The distribution of total serum IgE levels showed that the high-concentration IgE group (>200 IU/ml) accounted for the largest proportion (63.41%), peaking at 76.56% in the 11–15 years group. This finding is consistent with active hormonal changes and immune responses during adolescence (49). With increasing age, the proportion of patients in the high-concentration IgE group gradually decreased, possibly due to immunosenescence or changes in chronic inflammatory states (50).
This study has several limitations. First, due to its retrospective cross-sectional design, we were unable to ascertain causal connections between allergen source exposure and sensitization, thereby necessitating longitudinal studies for further verification. Second, the insufficient examination of the molecular mechanisms underlying sex disparities and the elevated rate of allergen source sensitization requires additional experimental research. Third, the lack of environmental data, including D. pteronyssinus concentrations and dietary habits, may lead to biases in the interpretation of the results. Fourth, multiple studies have revealed that the positive rate of SPT is higher than that of sIgE detection (51, 52). However, in the current investigation, SPT outcomes were not considered. Forthcoming research could greatly benefit from an integrative examination that merges both sIgE and SPT information, ultimately improving the precision of allergen source diagnosis. Lastly, the AllergyScreen panel used in this study did not include some predefined allergen sources such as fish. In future studies, we will make sure to incorporate fish allergens into the testing panel to provide a more comprehensive evaluation of seafood-related sensitization patterns.
5 Conclusion
In this study, we comprehensively determined the allergen source sensitization profiles of patients with allergic diseases in Changzhou. We elucidated the central role of D. pteronyssinus and the influence of age and sex on allergy patterns. Notably, adolescents (11–15 years) exhibited the highest sensitization rates to inhaled allergen sources, potentially due to immune system maturity and increased environmental exposure. Conversely, the prevalence of food allergen sources decreased with age, possibly indicating the development of oral tolerance. These findings provide a scientific basis for crafting tailored regional and age-tailored strategies for allergy prevention and management, such as mite control in educational institutions and early dietary guidance for infants.
Data availability statement
The raw data supporting the conclusions of this article will be made available by the authors, without undue reservation.
Ethics statement
The studies involving humans were approved by the ethics committee of Changzhou Third People's Hospital (Ethic number:02A-A20220017). The studies were conducted in accordance with the local legislation and institutional requirements. The ethics committee/institutional review board waived the requirement of written informed consent for participation from the participants or the participants’ legal guardians/next of kin because Informed consent was waived due to the retrospective nature of this study.
Author contributions
ZH: Data curation, Visualization, Methodology, Conceptualization, Writing – original draft, Formal analysis, Writing – review & editing, Investigation. CW: Investigation, Writing – original draft, Methodology, Writing – review & editing, Data curation. JX: Conceptualization, Methodology, Writing – review & editing. SY: Methodology, Writing – review & editing, Data curation. YB: Investigation, Writing – review & editing, Data curation. YW: Writing – review & editing, Formal analysis, Methodology, Data curation. XH: Formal analysis, Methodology, Data curation, Writing – review & editing. YK: Writing – review & editing, Supervision, Conceptualization, Methodology. JM: Writing – review & editing, Project administration, Supervision, Resources, Funding acquisition, Formal analysis, Visualization.
Funding
The author(s) declare that financial support was received for the research and/or publication of this article. This work was supported by Changzhou Medical Center, Nanjing Medical University (CMCB202410).
Acknowledgments
The authors wish to thank all of the participants who took part in this study. We thank LetPub (www.letpub.com.cn) for its linguistic assistance during the preparation of this manuscript.
Conflict of interest
The authors declare that the research was conducted in the absence of any commercial or financial relationships that could be construed as a potential conflict of interest.
Generative AI statement
The author(s) declare that no Generative AI was used in the creation of this manuscript.
Any alternative text (alt text) provided alongside figures in this article has been generated by Frontiers with the support of artificial intelligence and reasonable efforts have been made to ensure accuracy, including review by the authors wherever possible. If you identify any issues, please contact us.
Publisher's note
All claims expressed in this article are solely those of the authors and do not necessarily represent those of their affiliated organizations, or those of the publisher, the editors and the reviewers. Any product that may be evaluated in this article, or claim that may be made by its manufacturer, is not guaranteed or endorsed by the publisher.
References
1. Shaker MS. Anaphylaxis: definition and criteria. J Food Allergy. (2024) 6(1):26–31. doi: 10.2500/jfa.2024.6.240002
2. Linneberg A, Dam Petersen K, Hahn-Pedersen J, Hammerby E, Serup-Hansen N, Boxall N. Burden of allergic respiratory disease: a systematic review. Clin Mol Allergy. (2016) 14:12. doi: 10.1186/s12948-016-0049-9
3. Golding MA, Batac ALR, Gunnarsson NV, Ahlstedt S, Middelveld R, Protudjer JLP. The burden of food allergy on children and teens: a systematic review. Pediatr Allergy Immunol. (2022) 33(3):e13743. doi: 10.1111/pai.13743
4. Höfer V, Martini M, Dölle-Bierke S, Worm M, Bilò MB. Health-related quality of life in food and venom induced anaphylaxis and role of influencing factors. Clin Exp Allergy. (2023) 53(3):295–306. doi: 10.1111/cea.14268
5. O'Toole J, Mikulic L, Kaminsky DA. Epidemiology and pulmonary physiology of severe asthma. Immunol Allergy Clin North Am. (2016) 36(3):425–38. doi: 10.1016/j.iac.2016.03.001
6. Xu X, Zhang Y, Cheng L, Fan Y, Han Y, Jie Y, et al. Chinese expert consensus on the impact of ambient air pollution on allergic rhinitis and recommendations for mitigation strategies. Allergy Asthma Immunol Res. (2025) 17(2):149–64. doi: 10.4168/aair.2025.17.2.149
7. Pawankar R, Canonica GW, Holgate ST, Lockey RF, Organization WA. World Allergy Organization (WAO) White Book on Allergy. Milwaukee (WI): World Allergy Organization (2011).
8. Stróżek J, Samoliński BK, Kłak A, Gawińska-Drużba E, Izdebski R, Krzych-Fałta E, et al. The indirect costs of allergic diseases. Int J Occup Med Environ Health. (2019) 32(3):281–90. doi: 10.13075/ijomeh.1896.01275
9. Zheng H, Zhang Y, Pan J, Liu N, Qin Y, Qiu L, et al. The role of type 2 innate lymphoid cells in allergic diseases. Front Immunol. (2021) 12:586078. doi: 10.3389/fimmu.2021.586078
10. Zhang W, Xie B, Liu M, Wang Y. Associations between sensitisation to allergens and allergic diseases: a hospital-based case-control study in China. BMJ Open. (2022) 12(2):e050047. doi: 10.1136/bmjopen-2021-050047
11. Ansotegui IJ, Melioli G, Canonica GW, Caraballo L, Villa E, Ebisawa M, et al. Ige allergy diagnostics and other relevant tests in allergy, a world allergy organization position paper. World Allergy Organ J. (2020) 13(2):100080. Erratum in: World Allergy Organ J. 2021 Jun 17;14(7):100557. doi: 10.1016/j.waojou.2021.100557. doi: 10.1016/j.waojou.2019.100080
12. Reinmuth-Selzle K, Kampf CJ, Lucas K, Lang-Yona N, Fröhlich-Nowoisky J, Shiraiwa M, et al. Air pollution and climate change effects on allergies in the anthropocene: abundance, interaction, and modification of allergens and adjuvants. Environ Sci Technol. (2017) 51(8):4119–41. doi: 10.1021/acs.est.6b04908
13. Falcon RMG, Caoili SEC. Immunologic, genetic, and ecological interplay of factors involved in allergic diseases. Front Allergy. (2023) 4:1215616. doi: 10.3389/falgy.2023.1215616
14. Schmidt F, Hose AJ, Mueller-Rompa S, Brick T, Hämäläinen AM, Peet A, et al. Development of atopic sensitization in Finnish and Estonian children: a latent class analysis in a multicenter cohort. J Allergy Clin Immunol. (2019) 143(5):1904–1913.e9. doi: 10.1016/j.jaci.2018.12.1014
15. Asher MI, Montefort S, Björkstén B, Lai CK, Strachan DP, Weiland SK, et al. Worldwide time trends in the prevalence of symptoms of asthma, allergic rhinoconjunctivitis, and eczema in childhood: ISAAC phases one and three repeat multicountry cross-sectional surveys. Lancet. (2006) 368(9537):733–43. Erratum in: Lancet. 2007 September 29;370(9593):1128. doi: 10.1016/S0140-6736(06)69283-0
16. Wang XD, Zheng M, Lou HF, Wang CS, Zhang Y, Bo MY, et al. An increased prevalence of self-reported allergic rhinitis in major Chinese cities from 2005 to 2011. Allergy. (2016) 71(8):1170–80. doi: 10.1111/all.12874
17. Huang K, Yang T, Xu J, Yang L, Zhao J, Zhang X, et al. Prevalence, risk factors, and management of asthma in China: a national cross-sectional study. Lancet. (2019) 394(10196):407–18. doi: 10.1016/S0140-6736(19)31147-X
18. Mao D, Li J, Liu S, Liu P, Tian J, Liu X, et al. Prevalence and risk factors of atopic dermatitis in Chinese adults: a nationwide population-based cross-sectional study. Chin Med J (Engl). (2023) 136(5):604–6. doi: 10.1097/CM9.0000000000002560
19. Tong H, Gao L, Deng Y, Kong Y, Xiang R, Tan L, et al. Prevalence of allergic rhinitis and associated risk factors in 6 to 12 years schoolchildren from Wuhan in central China: a cross-sectional study. Am J Rhinol Allergy. (2020) 34(5):632–41. doi: 10.1177/1945892420920499
20. Li X, Song P, Zhu Y, Lei H, Chan KY, Campbell H, et al. The disease burden of childhood asthma in China: a systematic review and meta-analysis. J Glob Health. (2020) 10(1):010801. doi: 10.7189/jogh.10.01081
21. Guo Y, Li P, Tang J, Han X, Zou X, Xu G, et al. Prevalence of atopic dermatitis in Chinese children aged 1–7 ys. Sci Rep. (2016) 6:29751. doi: 10.1038/srep29751
22. Dramburg S, Grittner U, Potapova E, Travaglini A, Tripodi S, Arasi S, et al. Heterogeneity of sensitization profiles and clinical phenotypes among patients with seasonal allergic rhinitis in southern European countries-the @IT.2020 multicenter study. Allergy. (2024) 79(4):908–23. doi: 10.1111/all.16029
23. Katial JM, Hoyte FCL, Khatiwada A, Katial RK. Allergen skin test responses in broad U.S. asthma population in those with and without rhinitis. Allergy Asthma Proc. (2024) 45(3):158–65. doi: 10.2500/aap.2024.45.240012
24. Benninger MS, Daly T, Graffmiller K. Positivity rates of in vitro inhalant/respiratory and food allergy tests in the northern midwestern United States. Ear Nose Throat J. (2018) 97(9):296–322. doi: 10.1177/014556131809700919
25. Amin MR, Khoury JC, Assa'ad AH. Food-specific serum immunoglobulin E measurements in children presenting with food allergy. Ann Allergy Asthma Immunol. (2014) 112(2):121–5. doi: 10.1016/j.anai.2013.09.027
26. Wang W, Huang X, Chen Z, Zheng R, Chen Y, Zhang G, et al. Prevalence and trends of sensitisation to aeroallergens in patients with allergic rhinitis in Guangzhou, China: a 10-year retrospective study. BMJ Open. (2016) 6(5):e011085. doi: 10.1136/bmjopen-2016-011085
27. Yun JE, Ko EB, Jung HI, Gu KM, Kim TW, Park SY, et al. Allergen sensitization and its association with allergic diseases in the Korean population: results from the 2019 Korea national health and nutrition examination survey. Allergy Asthma Immunol Res. (2024) 16(5):534–45. doi: 10.4168/aair.2024.16.5.534
28. Moghtaderi M, Farjadian S, Kashef S, Alyasin S, Afrasiabi M, Orooj M. Specific IgE to common food allergens in children with atopic dermatitis. Iran J Immunol. (2012) 9(1):32–8.22426165
29. Alduraywish SA, Lodge CJ, Vicendese D, Lowe AJ, Erbas B, Matheson MC, et al. Sensitization to milk, egg and peanut from birth to 18 years: a longitudinal study of a cohort at risk of allergic disease. Pediatr Allergy Immunol. (2016) 27(1):83–91. doi: 10.1111/pai.12480
30. Wai CYY, Leung NYH, Leung ASY, Wong GWK, Leung TF. Seafood allergy in Asia: geographical specificity and beyond. Front Allergy. (2021) 2:676903. doi: 10.3389/falgy.2021.676903
31. Al-Frayh AS, Hasnain SM, Gad-El-Rab MO, Schwartz B, Al-Mobairek K, Al-Sedairy ST. House dust mite allergens in Saudi Arabia: regional variations and immune response. Ann Saudi Med. (1997) 17(2):156–60. doi: 10.5144/0256-4947.1997.156
32. Cheng ZL, Ma TT, Gao ZS, Ming WH, Yang MR, Wang XY. Global ragweed allergy: molecular allergens and integrated control strategies. J Asthma Allergy. (2025) 18:403–16. doi: 10.2147/JAA.S506897
33. Ali AHK. Food and aeroallergen sensitization in IgE -mediated asthma in Egypt. Open Respir Med J. (2021) 15:52–8. doi: 10.2174/1874306402115010052
34. Lin H, Lin R, Li N. Sensitization rates for various allergens in children with allergic rhinitis in Qingdao, China. Int J Environ Res Public Health. (2015) 12(9):10984–94. doi: 10.3390/ijerph120910984
35. Choi IS, Lee SS, Myeong E, Lee JW, Kim WJ, Jin J. Seasonal variation in skin sensitivity to aeroallergens. Allergy Asthma Immunol Res. (2013) 5(5):301–8. doi: 10.4168/aair.2013.5.5.301
36. Pothirat C, Chaiwong W. Aeroallergen sensitization and clinical characteristics of subjects with chronic rhinitis in Chiang Mai, Thailand: a twenty-year retrospective study. J Asthma Allergy. (2021) 14:789–95. doi: 10.2147/JAA.S315081
37. Sun X, Zhao J, Wang Q, Shi G, Yang J, Ming L. Prevalence of allergen sensitization among 15,534 patients with suspected allergic diseases in Henan province, China. Asian Pac J Allergy Immunol. (2019) 37(2):57–64. doi: 10.12932/AP-160817-0137
38. Wang S, Zhang B, Wang Z, Jiang H, Wang L, Li W, Hao L, Wang H. Trend of food intake from Chinese 15 provinces (autonomous regions, municipalities) adults aged 18 to 35 in 1989–2015. Wei Sheng Yan Jiu. 2021;50 (3): 442–7. Chinese. doi: 10.19813/j.cnki.weishengyanjiu.2021.03.016
39. Zhang J, Wang Z, Du W, Huang F, Jiang H, Bai J, et al. Twenty-five-year trends in dietary patterns among Chinese adults from 1991 to 2015. Nutrients. (2021) 13(4):1327. doi: 10.3390/nu13041327
40. Arcangeli G, Traversini V, Tomasini E, Baldassarre A, Lecca LI, Galea RP, et al. Allergic anaphylactic risk in farming activities: a systematic review. Int J Environ Res Public Health. (2020) 17(14):4921. doi: 10.3390/ijerph17144921
41. Asero R, Pravettoni V, Scala E, Villalta D. House dust mite-shrimp allergen interrelationships. Curr Allergy Asthma Rep. (2020) 20(4):9. doi: 10.1007/s11882-020-0902-2
42. Liu Y, Yang S, Zeng Y, Yang C, Li X, Zong X, et al. Influence of the COVID-19 pandemic on the prevalence pattern of allergens. Int Arch Allergy Immunol. (2023) 184(1):43–53. doi: 10.1159/000526892
43. Kerkhof M, Droste JH, de Monchy JG, Schouten JP, Rijcken B. Distribution of total serum IgE and specific IgE to common aeroallergens by sex and age, and their relationship to each other in a random sample of the Dutch general population aged 20–70 years. Dutch ECRHS group, European community respiratory health study. Allergy. (1996) 51(11):770–6. doi: 10.1111/j.1398-9995.1996.tb00021.x
44. Dai L, Liu J, Zhao Q, Li M, Zhou Y, Chen Z, et al. Investigation of allergic sensitizations in children with allergic rhinitis and/or asthma. Front Pediatr. (2022) 10:842293. doi: 10.3389/fped.2022.842293
45. Chiu CY, Huang YL, Tsai MH, Tu YL, Hua MC, Yao TC, et al. Sensitization to food and inhalant allergens in relation to atopic diseases in early childhood: a birth cohort study. PLoS One. (2014) 9(7):e102809. doi: 10.1371/journal.pone.0102809
46. Ying X, Qi X, Yin Y, Wang H, Zhang H, Jiang H, et al. Allergens sensitization among children with allergic diseases in Shanghai, China: age and sex difference. Respir Res. (2022) 23(1):95. doi: 10.1186/s12931-022-02008-7
47. Stefanovic N, Flohr C, Irvine AD. The exposome in atopic dermatitis. Allergy. (2020) 75(1):63–74. doi: 10.1111/all.13946
48. Zhu H, Huang Z, Liu T, An N, Gan H, Huang D, et al. Sensitization to furry animals in patients with suspected allergic disease in China: a multicenter study. J Asthma Allergy. (2022) 15:1701–12. doi: 10.2147/JAA.S390473
49. Holladay SD, Smialowicz RJ. Development of the murine and human immune system: differential effects of immunotoxicants depend on time of exposure. Environ Health Perspect. (2000) 108(Suppl 3):463–73. doi: 10.1289/ehp.00108s3463
50. Merrill T, Kanaan A. Managing chronic rhinosinusitis with nasal polyps in the elderly: challenges and solutions. Clin Interv Aging. (2022) 17:685–98. doi: 10.2147/CIA.S279765
51. Testera-Montes A, Jurado R, Salas M, Eguiluz-Gracia I, Mayorga C. Diagnostic tools in allergic rhinitis. Front Allergy. (2021) 2:721851. doi: 10.3389/falgy.2021.721851
Keywords: allergen sources, inhaled, food, allergic diseases, specific IgE, Eastern China
Citation: Hu Z, Wang C, Xue J, Yang S, Bao Y, Wu Y, Hou X, Kaiseer Y and Ma J (2025) Sensitization to inhaled and food allergen sources in patients with allergic diseases in Eastern China. Front. Allergy 6:1616730. doi: 10.3389/falgy.2025.1616730
Received: 23 April 2025; Accepted: 5 August 2025;
Published: 20 August 2025.
Edited by:
Ting Fan Leung, The Chinese University of Hong Kong, ChinaReviewed by:
María Fernández González, University of Vigo, SpainHontian Wang, Capital Medical University, China
Copyright: © 2025 Hu, Wang, Xue, Yang, Bao, Wu, Hou, Kaiseer and Ma. This is an open-access article distributed under the terms of the Creative Commons Attribution License (CC BY). The use, distribution or reproduction in other forums is permitted, provided the original author(s) and the copyright owner(s) are credited and that the original publication in this journal is cited, in accordance with accepted academic practice. No use, distribution or reproduction is permitted which does not comply with these terms.
*Correspondence: Jing Ma, bWFqaW5nNjQxMEBhbGl5dW4uY29t