 Arian Amirvaresi
 Hadi Parastar*
- Department of Chemistry, Sharif University of Technology, Tehran, Iran
Over the years, technology has allowed more accurate, more effective, and prompt food integrity assessments to assure the quality and authenticity of food material. Thanks to the development of portable and hand-held near infrared (NIR) as a rapid, reliable, non-destructive, and user-friendly instrument, on-site food analysis is provided with more feasibility. However, miniaturized NIR devices have some significant challenges due to the presence of varying noise resources which can lead to misinterpretation. In this context, chemometric methods with the capability of resolution, identification, classification, and calibration play a pivotal role in achieving precise and in-depth comprehension of the data. In the present mini-review, we will discuss miniaturized NIR instrumentation, some chemometric concepts, and introduce the most popular algorithm in food authentication problem. The main feature of this review is avoiding mathematical details as much as possible to make the material accessible to a broad audience but highlighting the key features of chemometric methods with some simple illustrative examples in the scope of food authenticity.
Introduction
Growing concerns about food quality and authenticity, as well as the complexity of food fraud problems, have substantially raised the need for appropriate analytical techniques to assess the authenticity of food materials (McVey et al., 2021). Over the last decades, near-infrared (NIR) instrumentation has advanced dramatically, resulting in their wide application in food industry. The introduction of miniaturized (portable and handheld) NIR instruments with very small size, commercial engines that a variety of companies can build into products, and low-cost devices selling directly to the public have made it possible for both expert and non-expert users to do fast, easy, reliable and on-site food analysis (Müller-Maatsch and van Ruth, 2021; Beć et al., 2022). In spite of their many advantages, miniaturized NIR instruments have several limitations that make direct interpretation of the spectrum challenging. In many cases, the generated response requires spectral processing as well as statistical data analysis in order to find the spectral differences that are most useful for sample differentiation. Chemometric and machine learning methods, which are a subset of artificial intelligence (AI) have been proposed for dealing with these problems and improving the low resolution of miniaturized NIR measurements (Houhou and Bocklitz, 2021). A large part of the development and application of the miniaturized NIR instrument in the food industry owes to the ability of various chemometric tools to improve the generated signal and thus enhance the interpretation. Existing literature has investigated the application of miniaturized NIR spectroscopy in the food industries with the focus on device technologies and various food scopes (Teixeira Dos Santos et al., 2013; Ellis et al., 2015; Jafari et al., 2021; McVey et al., 2021; Beć et al., 2022), but the necessitates, important concepts, and the role of various chemometric methods have not been discussed.
The presented mini-review provides an overview of miniaturized NIR instrumentation and represents a simple explanation of chemometric concepts and methods that a user should know when using a portable NIR instrument in the food study.
Miniaturized NIR instrument
NIR spectroscopy collects data by observing overtones and combination transitions in the 12.500–4,000 cm–1 or 800–2,500 nm spectral region where molecular vibrational excitations occur. These transitions are substantially less probable to occur than fundamental ones (IR and Raman), which result in a lower absorption index of a sample in the NIR area. A high number of overlapping bands in NIR spectra causes the lineshape to become broader, resulting in a reduction in resolution and making direct interpretation of spectra more challenging. A miniaturized NIR instrument has the same main parts as any other device that uses optical absorption spectroscopy: A light source, a wavelength selector, and a detector.
One of the most prevalent miniaturized NIR light sources is a tungsten halogen bulb. Even though heat sources are low-cost and reliable, their thermal stability is a major concern for handheld NIR devices as they employ in-field analysis where temperatures vary widely. The easiest way suggested by vendors is performing regular reference scans to keep the latest background signal. The second common NIR radiation sources are light-emitting diodes (LEDs) which have specefic features make them very sutible for miniaturezed NIR design. They are very small, cheap, durable with low voltage and power required. Nevertheless, LEDs have some limitations in spectroscopy. The radiation band’s narrowness is one of these limitation. For example, a gallium arsenide (GaAs) LED has a peak emission of 870 nm and a bandwidth of just 50 nm. In addition, there is still a severe lack of available LEDs in NIR region.
Miniaturized NIRs wavelength selector are varies in compared to benchtop ones, which is more besed on Michelson interferometer. Using micro electromechanical systems (MEMS), it would be possible to miniaturize a number of wavelength selectors; or micro-opto-electromechanical systems (MOEMS) if micro-optics is also included. Generally, they can be based on the more suitable and feasible machanism such as the Fabry–Perot interferometer, Hadamard mask, linear variable filter (LVF), or digital micromirror array.
Regarding to the miniaturized NIR detector, photovoltaic Si diodes present an appropriate level of sensitivity within the range of 14,285–9,100 cm-1 (700–1,100 nm), and so, ideal only for more miniature, low-cost spectrometers. On the other hand, the S/N ratio achieved by this approach is poor and needs some cut-off filter to decrease the sensitivity of the detector to sunlight. In the range of 9,500–400 cm-1 (1,050–2,500 nm), InGaAs photodetectors perform well and are the most commonly used detectors which allows for fast scanning with high signal-to-noise ratios. InGaAs detectors are faster in response and have high quantum performance along with the low dark current for a given sensor surface, allowing for fast scanning with high signal-to-noise ratios.
Another important feature in miniaturized NIR is optical material. To a vast extent, optical materials which do not absorb light in the visible range are also transparent over a significant region of the infrared light spectrum. Notably, this means that glass optics may be employed for; however, for optimal performance in the long-wave (LW-NIR) range, high-quality fused silica (also known as fused quartz) optic material may be needed. Because there are no of alkali halides in fused quartz, the cost of miniaturized NIRs is reduced, their operability in humid conditions is enhanced, and their performance for on-site and monitoring analysis is highly improved. When operating in contact mode and rugged analysis, it is preferable to have a scratch-resistant optical window at the sample interface for reliable functioning. This function is often performed by sapphire, although owning to high refractive index of sapphire, they undergo some optical loss and can only have a proper function in multi-channel spectrometers (Crocombe, 2018; Bwambok et al., 2020; Grabska et al., 2021; Grüger, 2021; Beć et al., 2022).
Why we should use chemometrics?
Modern miniaturized NIR instruments provide multivariate information describing the composition, state, or evolution of a specific chemical process. However, NIR instruments have significant challenges due to various issues in their spectroscopic data. On the other hand, a portable NIR spectrometer compared to its laboratory counterpart that is strictly evaluated based on conventional laboratory parameters for analytical performance, would typically perform less effectively in terms of resolution, signal throughput, and signal-to-noise ratio (SNR). Moreover, fixed or predetermined spectral range and resolution of portable NIR instruments as well as the fit-for-purpose operational requirements, such as deployment potential must also be considered. Besides the complex nature of the data structure, portable systems may provide answers requiring complex data interpretation or assessment on the part of the operator. Thus, data pretreatment and chemometric tools are required for qualitative and quantitative analysis with the aim of improving signal quality, enhancing SNR, solving peak shifting/overlapping problems, and handling imperfect and variable input data. Herein, some of the basic chemometric tools for the analysis of NIR data will be discussed.
Preprocessing
The NIR data preprocessing step has evolved into an integral part of chemometric modeling. The primary objective of preprocessing is to eliminate artifacts of spectra to enhance capability of exploration, calibration, and classification. The source of variation depends on various factors in a NIR measurement in both reflectance and transmittance modes. For instance, in solid food samples with different particle sizes or heterogeneous shape, the main reasons for data variation that may lead to shifts in the baseline are differences in effective route length and dispersion of the light source (scattering). For liquid samples like oil, scattering is dependent not only on the path but also on the liquid concentration. The commonly utilized pre-processing approaches in NIR spectral data can be categorized into two groups: Scatter correction techniques and spectral derivatives.
The scatter-correction preprocessing techniques consists of multiplicative scatter correction (MSC), inverse MSC (IMSC), extended MSC (EMSC), extended inverse MSC (EIMSC), de-trending, standard normal variate (SNV) and normalization. These methods are implemented with the goal of decreasing the physical scatter variability.
Norris-Williams (NW) derivatives and Savitzky-Golay (SG) polynomial derivative filters are categorized in the spectral derivatives methods. The aim of this appraoch is to eliminate or reduce the effect of both additive and multiplicative effects in the spectra. Both strategies include a spectrum smoothing step before computing the derivative (1st order, 2nd order, … ) to reduce the negative effect on the signal-to-noise ratio that would occur with a conventional finite difference derivative (Rinnan et al., 2009; Mishra et al., 2020; Schoot et al., 2020).
Pattern recognition
Regarding food authentication, it is crucial to determine whether the sample/object meets the expected criteria (standards) or belongs to the interest group or class. Simply put, we usually seek to categorize samples based on their individual and distinct features or, more particularly, classifying them. From the perspective of chemometrics, this notion is included in pattern recognition methods which are defined as a primarily classification to assign samples into classes or groups. Classification methods can be categorized in a variety of ways based on which of their features is of most concern. As one of the main attributes, classification methods can be divided into supervised and unsupervised approaches. Supervised methods try to classify objects based on their features by using a training set, which consists of samples that are assigned to predetermined classes. In unsupervised methods, there are no labeled (predefined) classes and samples are distributed in different parts of the dataspace based on the similarity and dissimilarity among the variables. Generally, in a supervised technique, as opposed to an unsupervised one, there is typically some prior knowledge about the sample and its characteristics (Magrı et al., 2013; Brereton, 2015).
Unsupervised data exploration methods as the first step of data analysis
Data exploration methods assist in extracting buried information from the data and visualizing it in a manner that is simple to comprehend and interpret. One of the most popular and widely-used exploration methods is the principal component analysis (PCA), which analyzes data regarding all variables (multivariate approach). PCA is a bilinear decomposition/projection method that reduces data dimensions to a small number of factors known as principal components (PCs) or latent variables (LVs), which are linear combinations of original variables. In addition, there are non-linear exploratory methods such as self-organizing maps (SOMs), Kohonen networks, projection pursuit and curvilinear component analysis (CCA) that are not yet widely used in the food industry, whose potential can be investigated in future studies.
Clustering techniques are the other well-known exploratory multivariate data analysis. The prime objective of cluster analysis is discovering groups in a data set. This is achieved by using the concept that objects with more similarity and less distance in the variable space form a cluster. A popular and widely-used technique in clustering is hierarchical clustering analysis (HCA) which operates based on the calculation of different distances among samples like Euclidean, Mahalanobis, and Manhattan distance. In HCA, two samples with the most similarity are identified and joined in a cluster. The similarity index of the new cluster in comparison to all other objects is computed based on the employed method (Vigni et al., 2013).
Class modeling vs discrimination approach
The other classification characteristic is defined using the terms discrimination and class modeling. Class modeling and discrimination methods are two types of supervised classification techniques. Despite the fact that both methods have the same aim, there are major differences in the implications of their usage.
In the discrimination strategy, the classification model is built based on the differences among samples/objects from various classes, resulting in hypersurfaces (multidimensional surfaces) that divide the whole variable space into the number of classes. Therefore, each individual (prediction) sample belongs to one of the model classes, regardless of whether it relates to them. Supplementary Figure S1A illustrates a discrimination analysis in which the entire space is comprised of two sub space according to two classes (solid circles and stars). As is evident from prediction samples (hollow shapes), triangle and square objects that are irrelevant to primary classes are classified as one of them.
Class modeling approaches, on the other hand, concentrate on the similarities among samples belonging to the same category (target class) instead of the differences among classes. By taking this approach, each class is modeled independently and positioned in its own isolated area in the feature space of the model (red dashed and dots in Supplementary Figure S1B). Supplementary Figure S1B shows that there are three possible outcomes for a prediction sample: i) Belonging to one of the two classes represented by the hollow circle and star, ii) belonging to both classes represented by the hollow square, or iii) neither class (hollow triangle).
In summary, the discriminating models always classify a new object into one of the predefined classes, while in the class modeling, a new object can belong to predefined classes or not. Therefore, to avoid misunderstandings, users should be attentive when using discrimination strategies. Discrimination techniques are often used when the number of classes is small and there is the guarantee that the tested samples exclusively belong to the predefined classes. As a result, it can be concluded that class modeling approaches are preferable for addressing food authentication (Rantalainen et al., 2007; Pomerantsev, 2018; Małyjurek et al., 2020).
Linear and non-linear classification
Another differentiation factor between the classification strategies is based on the mathematical form of the functional relationship, referring to the geometric shape used to separate variables in multidimensional (feature) space. Within this frame, the main categorization is between linear and non-linear approaches, which in the case of non-linearity, there are some subdivisions like quadratic and polynomial. When using linear approaches, decision boundaries are represented as linear functions of the initial variables. This decision boundary can be a line, a plane, or a hyperplane to separate, respectively, two, three, or more than three dimensions. On the contrary, in the non-linear approach, a more complicated hypersurface is responsible for splitting data space according to existing classes. For example, in the quadratic approach, the decision boundaries can be hyperellipsoids, hyperparaboloids or hyperspheres (Supplementary Figure S2) (Magrı et al., 2013; Bona et al., 2018; Rocha et al., 2020).
Multivariate calibration
Calibration techniques provide quantitative information by establishing a relationship between instrumental measurements to analytes of interest. In the basic case, calibration model represents a relationship between a single response or predictor of a device, such as a single wavelength absorbance in spectroscopy, to a concentration of an object/sample which is called univariate calibration. However, currently, the employed approaches are multivariate calibrations in which multiple measurements are taken rather than just one (i.e., multiple wavelengths or spectrum of samples); consequently, for a single measurement, a vector generates. In the both univariate and multivariate calibration, there are two main roles and steps i) calibration for model construction and ii) prediction of new samples. In general, calibration methods can be divided into linear and non-linear models. Examples of more frequently used linear models are multiple linear regression (MLR), principal component regression (PCR), partial least squares (PLS) and multivariate curve resolution-alternating least squares (MCR-ALS). In other words, non-linear models include a vast range of machine learning techniques like as support vector machine (SVM), artificial neural network (ANN) (Westad et al., 2013; Saeys et al., 2019). Figure 1A shows a general view of the classification of chemometric methods.
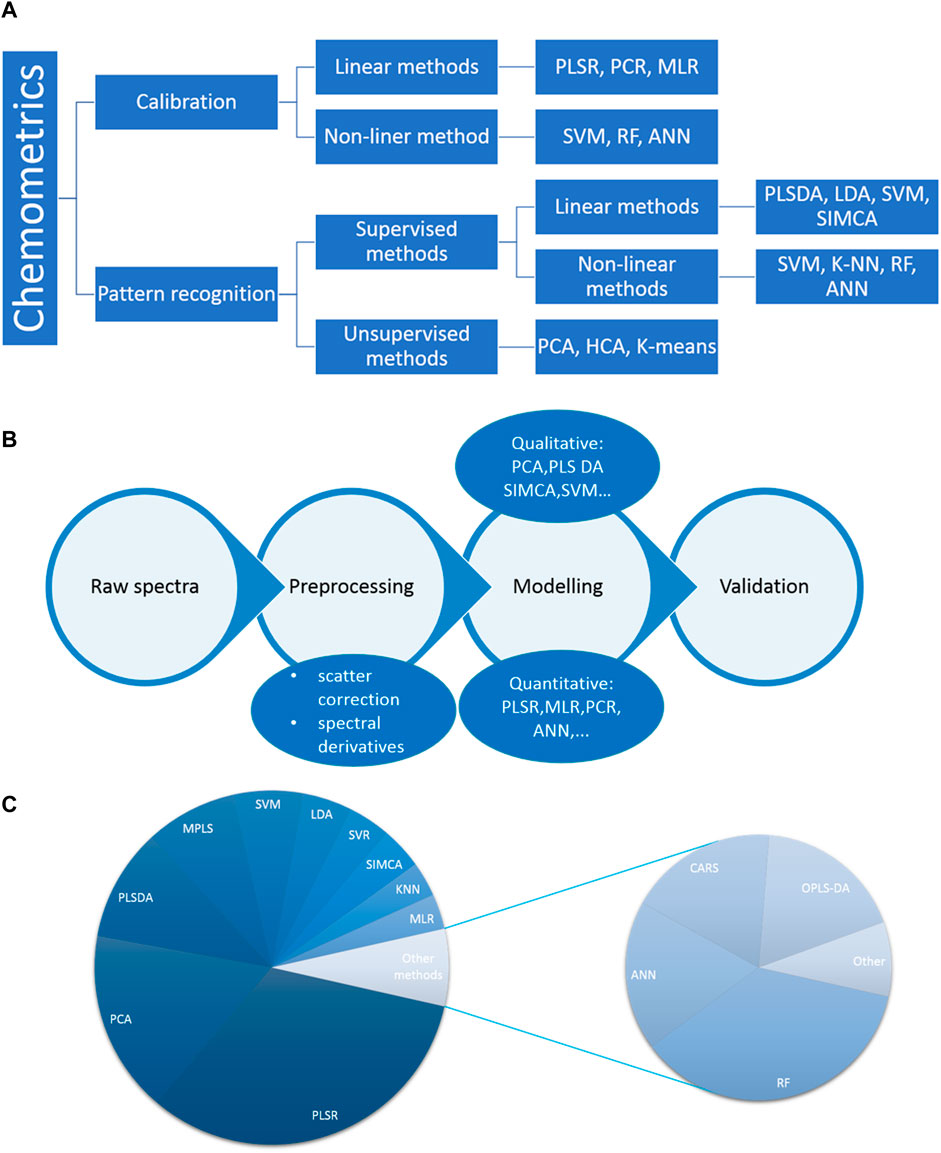
FIGURE 1. (A) A scheme of the classification of chemometric methods based on calibration and classification approches. (B) Chemometrics procedure of raw NIR spectra and (C) The frequency of chemometric methods used in the NIR study of food.
Model validation
The development of a model is not complete without validation of its performance. Model validation is crucial in the context of food authentication in order to prevent misinterpretation of classification, and quantification of unknown/prediction sample. The best way to evaluate the validity of a model is by using representative independent test samples. In the case where the number of samples is sufficient, the data set is usually divided into a ratio of 70% training and 30% testing. On the other hand, cross-validation methods are used for internal validation of the developed models. Depending on the type of data and the algorithm used, one/a group of data set is excluded and the model is built with the remaining samples. Then the excluded samples are evaluated in the developed model and the prediction residuals are calculated. This cycle continues until the evaluation of all samples and finally using the prediction residuals, validation residual variance and root mean square error in prediction (RMSEP) are computed (Westad et al., 2013; Westad and Marini, 2015).
Application of miniaturized NIR spectroscopy and chemometrics in food industry
The practical application of state-of-the-art miniaturized NIR spectroscopy has provided solutions to various food industry challenges (i.e., quality, authenticity, traceability etc.,). On-site checking of food quality, monitoring products at various stages of production, and assessing food ingredients without opening food packaging are among the significant benefits of miniaturized NIR. The low resolution of these instruments, however, necessitates that they be coupled with data analysis tools such as chemometrics. Figure 1B shows the steps of chemometric data analysis methods that are commonly applied to NIR spectra. In addition, the pie chart in Figure 1C represents a scheme of the frequency of chemometric methods used in food studies regard to miniaturized NIR instruments. As it is evident, PCA in exploration, PLS-DA in classification, and PLSR in calibration are the most widely-used chemometric techniques. Another noteworthy fact is that SIMCA has been only used in a few studies, although it is a high-potential method in the context of food authenticity. Various studies have investigated the capability of miniaturized NIR in the field of food authentication (Ellis et al., 2015; Müller-Maatsch and van Ruth, 2021; Beć et al., 2022). However, the application of miniaturized NIR is increasing considerably. Table 1 shows some of the applications of miniaturized NIR coupled with chemometrics for food analysis. One research compares a portable NIR device to a benchtop FT-NIR spectrometer for identifying Atlantic cod fillets and patties from haddock. LDA and SIMCA, pre-treating spectral data with various techniques and model validation both internally and externally, was employed. Best LDA models predicted 100% correctly. Best SIMCA models predicted with sensitivity >65% and specificity >74%. McNemar test indicated no significant differences (p > 0.05) across the instruments (Grassi et al., 2018). Three portable NIR devices were used to test almond flour authenticity with a benchtop FT-NIR. 54 almond flours were contaminated with cheap flours in Brazil. SIMCA, DD-SIMCA, and OCPLS for classification and PLSR used for predicting sample purity. Classification findings obtained 100% sensitivity and more than 95% specificity for samples with adulterant amounts over 5% (w/w). PLS models revealed R2 values over 0.90 and RMSEP between 3.2% and 4.8% for purity. According to multivariate models, portable NIR equipment can identify and quantify contaminated almond flour (Marcelino et al., 2023). Portable NIR spectroscopy coupled with multivariate supervised classification was suggested to identify peanuts, Brazil nuts, macadamia nuts, and pecan nuts in cashew nut samples, covering a broad concentration range (10%–0.1% w/w). Algorithms were established to estimate cashews pure and adulterated with peanuts, Brazil nuts, macadamia nuts, and pecan nuts. Interval partial-least-squares regression (iPLS), genetic algorithm (GA), and iPLS-GA were explored as variable selection procedures. PLS-DA paired with iPLS-GA offered the best results, with sensitivity between 81% and 93% and selectivity between 94% and 100%. (Sheng et al., 2022). We will summarized some of previous studies based on the variety of chemometrics method and according to (Beć et al., 2022).
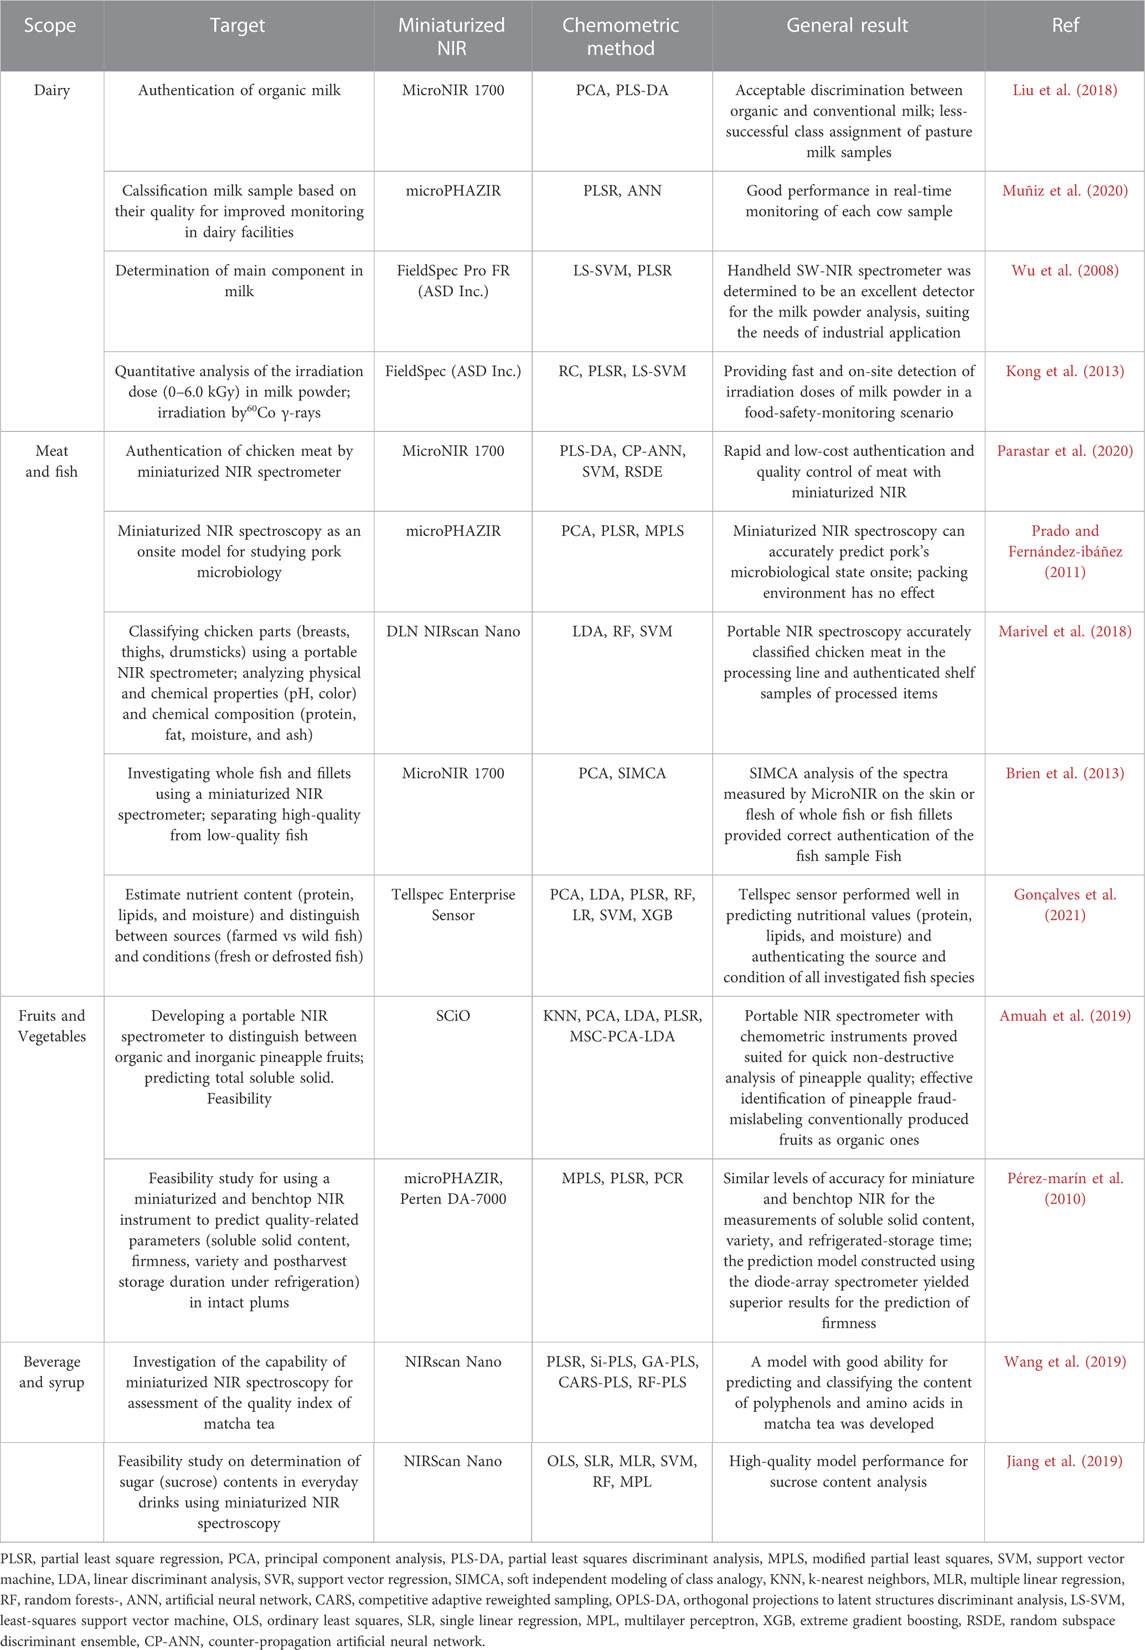
TABLE 1. Some of the applications of miniaturized NIR coupled with chemometrics for food analysis.
Conclusion
The dramatic advancement of miniaturized NIR spectrometers (i.e., handheld and portable) has revolutionized rapid, facile, on-site and non-destructive analysis of samples in food chemistry. However, these instruments have significant challenges due to various issues in their spectroscopic data, like baseline contribution, noise, lack of repeatability, peak overlap, and low resolution. In this context, chemometric/machnine learning techniques attempt to extract the required information from spectra and explore this spectral information for qualitative or quantitative purposes through mathematical resolution, pattern recognition, and calibration.
We believe this mini-review article is of general interest to the whole food chemistry community as everybody hears these buzzwords daily, but the real ideas and potential behind the miniaturized spectroscopy and chemometrics are not widely known and understood yet. We hope this review will promote further research on miniaturized spectroscopy in food to solve different problems.
Author contributions
AA: Formal analysis, investigation, methodology, writing—original draft. HP: Concenptualization, Funding and Writing-editing.
Funding
The current work was performed as a part of grant no. G960613.
Acknowledgments
The authors would like to thank Sharif University of Technology for support of this project.
Conflict of interest
The authors declare that the research was conducted in the absence of any commercial or financial relationships that could be construed as a potential conflict of interest.
Publisher’s note
All claims expressed in this article are solely those of the authors and do not necessarily represent those of their affiliated organizations, or those of the publisher, the editors and the reviewers. Any product that may be evaluated in this article, or claim that may be made by its manufacturer, is not guaranteed or endorsed by the publisher.
Supplementary material
The Supplementary Material for this article can be found online at: https://www.frontiersin.org/articles/10.3389/frans.2023.1118590/full#supplementary-material
Abbreviations
ANN, artificial neural network; CARS, competitive adaptive reweighted sampling; KNN, k-nearest neighbors; LDA, linear discriminant analysis; MLR, multiple linear regression; MPLS, modified partial least squares; OPLS-DA, orthogonal projections to latent structures discriminant analysis; PCA, principal component analysis; PLS-DA, partial least squares discriminant analysis,; PLSR, partial least square regression; RF, random forests; SIMCA, soft independent modeling of class analogy; SVM, support vector machine; SVR, support vector regression.
References
Amuah, C. L. Y., Teye, E., Lamptey, F. P., Nyandey, K., Opoku-Ansah, J., and Adueming, P. O-V. Feasibility study of the use of handheld NIR spectrometer for simultaneous authentication and quantification of quality parameters in intact pineapple fruits. J. Spectrosc. (2019) 2019(2):1–9. doi:10.1155/2019/5975461
Beć, K. B., Grabska, J., and Huck, C. W. Miniaturized NIR spectroscopy in food analysis and quality control: Promises, challenges, and perspectives. Foods (2022) 11(10):1465. doi:10.3390/foods11101465
Bona, E., Março, P. H., and Valderrama, P. Chemometrics applied to food control, food control and biosecurity. London: Elsevier (2018).
Brereton, R. G. Pattern recognition in chemometrics. Chemom. Intelligent Laboratory Syst. (2015) 149:90–96. doi:10.1016/j.chemolab.2015.06.012
Brien, N. O., Hulse, C. A., and Siesler, H. W. Near infrared spectroscopic authentication of seafood. J. Near Infrared Spectrosc. (2013) 305:299–305. doi:10.1255/jnirs.1063
Bwambok, D. K., Siraj, N., Macchi, S., Larm, N. E., Baker, G. A., Perez, R. L., et al. Qcm sensor arrays, electroanalytical techniques and nir spectroscopy coupled to multivariate analysis for quality assessment of food products, raw materials, ingredients and foodborne pathogen detection: Challenges and breakthroughs. Sensors (Basel) (2020) 20(23):6982–7042. doi:10.3390/s20236982
Crocombe, R. A. Portable SpectroscopyPortable spectroscopy. Appl. Spectrosc. (2018) 72(12):1701–1751. doi:10.1177/0003702818809719
Ellis, D. I., Muhamadali, H., Haughey, S. A., Elliott, C. T., and Goodacre, R. Point-and-shoot: Rapid quantitative detection methods for on-site food fraud analysis-moving out of the laboratory and into the food supply chain. Anal. Methods (2015) 7(22):9401–9414. doi:10.1039/c5ay02048d
Gonçalves, D. B., Santos, C. S. P., Pinho, T., Queirós, R., Vaz, P. D., Bloore, M., et al. Near infrared reflectance spectroscopy coupled to chemometrics as a cost-effective, rapid, and non-destructive tool for fish fraud control: Monitoring source, condition, and nutritional value of five common whitefish species. J. AOAC Int. (2021) 104:53–60. doi:10.1093/jaoacint/qsaa114
Grabska, J., Huck, C. W., and Bec, K. B. Principles and applications of miniaturized near-infrared (NIR) spectrometers. Chemistry (2021) 27(5):1514–1532. doi:10.1002/chem.202002838
Grassi, S., Casiraghi, E., and Alamprese, C. Handheld NIR device: A non-targeted approach to assess authenticity of fish fillets and patties. A non-targeted approach assess Authent. fi sh fi llets patties (2018) 243:382–388. doi:10.1016/j.foodchem.2017.09.145
Grüger, H. MOEMS and MEMS - technology, benefits and uses. New York, United States: Wiley Online Library (2021). p. 89–113.
Houhou, R., and Bocklitz, T. Trends in artificial intelligence, machine learning, and chemometrics applied to chemical data. Deep Learn. Methods Enhanc. (2021) 2:128–141. doi:10.1002/ansa.202000162
Jafari, S., Guercetti, J., Geballa-Koukoula, A., Tsagkaris, A. S., Nelis, J. L. D., Marco, M. P., et al. Assured point-of-need food safety screening: A critical assessment of portable food analyzers. Foods (2021) 10(6):1399. doi:10.3390/foods10061399
Jiang, W., Marini, G., van Berkel, N., Sarsenbayeva, Z., Tan, Z., Luo, C., et al. Probing sucrose contents in everyday drinks using miniaturized near-infrared spectroscopy scanners. Proc. ACM Interact. Mob. Wearable Ubiquitous Technol. (2019) 3(4):1–25. doi:10.1145/3369834
Kong, W. W., Zhang, C., Liu, F., Gong, A. P., and He, Y. Irradiation dose detection of irradiated milk powder using visible and near-infrared spectroscopy and chemometrics. J. Dairy Sci. (2013) 96(8):4921–4927. doi:10.3168/jds.2013-6659
Liu, N., Parra, H. A., Pustjens, A., Hettinga, K., Mongondry, P., and van Ruth, S. M. Evaluation of portable near-infrared spectroscopy for organic milk authentication. Talanta (2018) 184:128–135. doi:10.1016/j.talanta.2018.02.097
Magrı, A. L., Bevilacqua, M., Bucci, R., Magrì, A. D., Nescatelli, R., and Marini, F. Chapter 5 - classification and class-ModellingAvailable at. Data Handl. Sci. Technol. (2013) 28:171–233. doi:10.1016/B978-0-444-59528-7.00005-3
Małyjurek, Z., Vitale, R., and Walczak, B. Different strategies for class model optimization. A comparative study. Talanta (2020) 215:120912. doi:10.1016/j.talanta.2020.120912
Marcelino, J., Honorato, F. A., Celso, P. G., and Pimentel, M. F. Authenticity of almond flour using handheld near infrared instruments and one class classifiers. J. Food Compos. Analysis (2023) 115:104981. doi:10.1016/j.jfca.2022.104981
Marivel, I., Badaró, A. T., Barbon, S., Barbon, A. P. A., Pollonio, M. A. R., and Barbin, D. F. Classification of chicken parts using a portable near-infrared (NIR) spectrophotometer and machine learning. Appl. Spectrosc. (2018) 72(12):1774–1780. doi:10.1177/0003702818788878
McVey, C., Elliott, C. T., Cannavan, A., Kelly, S. D., Petchkongkaew, A., and Haughey, S. A. ‘Portable spectroscopy for high throughput food authenticity screening: Advancements in technology and integration into digital traceability systems’. Trends Food Sci. Technol. (2021) 118(PB):777–790. doi:10.1016/j.tifs.2021.11.003
Mishra, P., Roger, J. M., Rutledge, D. N., and Woltering, E. SPORT pre-processing can improve near-infrared quality prediction models for fresh fruits and agro-materials. Postharvest Biol. Technol. (2020) 168:111271. doi:10.1016/j.postharvbio.2020.111271
Müller-Maatsch, J., and van Ruth, S. M. ‘Handheld devices for food authentication and their applications: A review’,. Foods (2021) 10(12):2901–2922. doi:10.3390/foods10122901
Muñiz, R., Cuevas-valdés, M., and Roza-delgado, B. D. Milk quality control requirement evaluation using a handheld near infrared reflectance spectrophotometer and a bespoke mobile application. J. Food Compos. Analysis (2020) 86:103388. doi:10.1016/j.jfca.2019.103388
Parastar, H., van Kollenburg, G., Weesepoel, Y., van den Doel, A., Buydens, L., and Jansen, J. Integration of handheld NIR and machine learning to “Measure and Monitor” chicken meat authenticity’. Food control. (2020) 112:107149. doi:10.1016/j.foodcont.2020.107149
Pérez-marín, D., Paz, P., Guerrero, J. E., Garrido-Varo, A., and Sanchez, M. T. Miniature handheld NIR sensor for the on-site non-destructive assessment of post-harvest quality and refrigerated storage behavior in plums. J. Food Eng. (2010) 99(3):294–302. doi:10.1016/j.jfoodeng.2010.03.002Available at
Pomerantsev, A. L. Multiclass partial least squares discriminant analysis: Taking the right way — a critical tutorial. Chemometrics (2018) 32(8):1–16. doi:10.1002/cem.3030
Prado, N., and Fernández-ibáñez, V. On-site NIR spectroscopy to control the shelf life of pork meat. Food Anal. Methods (2011) 4:582–589. doi:10.1007/s12161-011-9208-2
Rantalainen, M., Bylesjö, M., Cloarec, O., Nicholson, J. K., Holmes, E., and Trygg, J. OPLS discriminant analysis: Combining the strengths of PLS-DA and SIMCA classification y. Chemometrics (2007) 20(8-10):341–351. doi:10.1002/cem.1006
Rinnan, Å., Berg, F., and Engelsen, S. B. Review of the most common pre-processing techniques for near-infrared spectra. TrAC - Trends Anal. Chem. (2009) 28(10):1201–1222. doi:10.1016/j.trac.2009.07.007
Rocha, W. F., Prado, C. B. D., and Blonder, N. Comparison of chemometric problems in food analysis using non-linear methods. Molecules (2020) 25(13):3025. doi:10.3390/molecules25133025
Saeys, W., Nguyen Do Trong, N., Van Beers, R., and Nicolai, B. M. Multivariate calibration of spectroscopic sensors for postharvest quality evaluation: A review. Postharvest Biol. Technol. (2019) 158:110981. doi:10.1016/j.postharvbio.2019.110981
Schoot, M., Kapper, C., van Kollenburg, G. H., Postma, G. J., van Kessel, G., Buydens, L. M. C., et al. Investigating the need for preprocessing of near-infrared spectroscopic data as a function of sample size,. Chemom. Intelligent Laboratory Syst. (2020) 204:104105. doi:10.1016/j.chemolab.2020.104105
Sheng, C., Martins, M. L. C., Sena, M. M., and de Souza, S. V. C. Screening method for the detection of other allergenic nuts in cashew nuts using chemometrics and a portable near - infrared spectrophotometer. Food Anal. Methods (2022) 15(4):1074–1084. doi:10.1007/s12161-021-02184-0
Teixeira Dos Santos, C. A., Lopo, M., Pascoa, R. N. M. J., and Lopes, J. A. ‘A review on the applications of portable near-infrared spectrometers in the agro-food industry’. Appl. Spectrosc. (2013) 67(11):1215–1233. doi:10.1366/13-07228
Vigni, M. L., Durante, C., and Cocchi, M. Chapter 3 - exploratory data analysis. Data Handl. Sci. Technol. (2013) 28:55–126. doi:10.1016/B978-0-444-59528-7.00003-X
Wang, J., Zareef, M., He, P., Sun, H., Chen, Q., Li, H., et al. ‘Evaluation of matcha tea quality index using portable NIR spectroscopy coupled with chemometric algorithms’. J. Sci. Food Agric. (2019) 99(11):5019–5027. doi:10.1002/jsfa.9743
Westad, F., Bevilacqua, M., and Marini, F. Chapter 4 - regression. Data Handl. Sci. Technol. (2013) 28:127–170. doi:10.1016/B978-0-444-59528-7.00004-1
Westad, F., and Marini, F. Validation of chemometric models - a tutorial. Anal. Chim. Acta (2015) 893:14–24. doi:10.1016/j.aca.2015.06.056
Keywords: chemometrics, miniaturized NIR spectroscopy, food authentication, classification, calibration
Citation: Amirvaresi A and Parastar H (2023) Miniaturized NIR spectroscopy and chemometrics: A smart combination to solve food authentication challenges. Front. Anal. Sci. 3:1118590. doi: 10.3389/frans.2023.1118590
Received: 07 December 2022; Accepted: 13 February 2023;
Published: 03 March 2023.
Edited by:
Stefano Fornasaro, University of Trieste, ItalyReviewed by:
Mohammed Kamruzzaman, University of Illinois at Urbana-Champaign, United StatesCopyright © 2023 Amirvaresi and Parastar. This is an open-access article distributed under the terms of the Creative Commons Attribution License (CC BY). The use, distribution or reproduction in other forums is permitted, provided the original author(s) and the copyright owner(s) are credited and that the original publication in this journal is cited, in accordance with accepted academic practice. No use, distribution or reproduction is permitted which does not comply with these terms.
*Correspondence: Hadi Parastar, aC5wYXJhc3RhckBzaGFyaWYuZWR1