 Jonathan Schulte
 Jan-Niklas Tants2†
 Julian von Ehr
 Andreas Schlundt
 Nina Morgner
- 1Institute of Physical and Theoretical Chemistry, Johann Wolfgang Goethe University, Frankfurt, Germany
- 2Center for Biomolecular Magnetic Resonance (BMRZ), Institute for Molecular Biosciences, Johann Wolfgang Goethe University, Frankfurt, Germany
- 3IMPRS on Cellular Biophysics, Frankfurt, Germany
The interplay of biomolecules governs all cellular processes. Qualitative analysis of such interactions between biomolecules as well as the quantitative assessment of their binding affinities are essential for the understanding of biochemical mechanisms. As scientific interest therefore moves beyond pure structural investigation, methods that allow for the investigation of such interactions become increasingly relevant. In this perspective we outline classical methods that are applicable for the determination of binding constants and highlight specifically mass spectrometry based methods. The use of mass spectrometry to gain quantitative information about binding affinities however is a still developing field. Here, we discuss different approaches, which emerged over the last years to determine dissociation constants (KD) with mass spectrometry based methods. Specifically, we highlight the recent development of quantitative Laser Induced Liquid Bead Ion Desorption (qLILBID) mass spectrometry for the example of double stranded deoxyribonucleic acids as well as for different RNA—RNA binding protein systems. We show that quantitative laser induced liquid bead ion desorption can successfully be used for the top down investigation of complexes and their dissociation constants values ranging from low nM to low µM affinities.
Introduction
Association and dissociation of non-covalently interacting species are fundamental to numerous biological processes, ranging from the formation of deoxyribonucleic acid (DNA) double helices to the self-assembly and functional interplay of molecular machines. To understand the pathways of such reactions it is important to determine the interacting partners as well as their stoichiometry and to further characterize their interactions, e.g. in terms of binding affinities or kinetics. For such interactions, a broad range of methods has been developed which offer different advantages and disadvantages.
Especially the field of affinity assessment has drawn particular interest due to its importance in not only the investigation of biological mechanisms but also its significance for determining the effectiveness of drugs and other bioactive compounds (Kairys et al., 2019). The “gold standard” and most commonly used method to study affinities is isothermal titration calorimetry (ITC). It operates based on the thermal energy that is released or absorbed upon binding. By stepwise titration of one binding partner to the other, the energy needed to keep the temperature constant is monitored and the thermodynamic equilibrium can be determined. Another common group of affinity measurements are fluorescence based approaches. Dissociation constants can be determined by titration experiments and readout of changes in fluorescence e.g. in förster resonance energy transfer experiments (Guo et al., 2016; Liao et al., 2021) or by quenching of the fluorophore. (Budhadev et al., 2020). Other well-established methods are surface plasmon resonance (SPR) and electrophoretic mobility shift assay (EMSA). During a SPR experiment, a binding partner is added onto a surface on which the target molecule is immobilized. Binding of the mobile ligand to the immobilized target molecule changes the refractive index of the surface, which can be tracked and analyzed for their affinity and kinetics (Karlsson et al., 1991; Stenberg et al., 1991). EMSAs provide a robust method for quantitative analysis of mostly protein-oligonucleotide interactions (Hellman and Fried, 2007), albeit other combinations of biomolecules can be tested as well. A protein concentration series is combined with a usually 32P-labeled oligonucleotide, e.g. an RNA, and subjected to electrophoresis. In non-denaturing agarose or polyacrylamide gels, complexes migrate slower than free RNA. The separated RNA and complex bands can then be quantified by autoradiography. The dissociation constant can be assessed from the protein concentration in which the amount of bound and unbound oligonucleotide is equal, i.e. half-stoichiometric saturation (Hellman and Fried, 2007).
The determination of binding affinities with these methods usually requires knowledge of all binding partners as well as their stoichiometry. Therefore, generally an additional step is needed prior to these measurements. Information about the composition of complexes can be gained by several methods, based on the size and mass of these complexes and their subunits (Walport et al., 2021). Examples of commonly used methods are size exclusion chromatography coupled with multiangle light scattering (SEC-MALS) or native mass spectrometry (native-MS). SEC-MALS chromatographically separates molecules and complexes by their hydrodynamic volume and determines the radius by illumination and analysis of the scattering (Wyatt, 1993; Wen et al., 1996). Prior calibration enables a good estimate of the molecular mass and therefore the stoichiometry and composition of the studied complex. (Folta-Stogniew and Williams, 1999). However the methods come with challenges in case of missing prior knowledge of complex stoichiometries, most of all between proteins and RNAs.
Mass spectrometry (MS) is standardly used to analyze molecular masses, if greater accuracy in mass is required. Specifically, native MS allows to analyze the mass of entire complexes as well. This requires a soft ionization or desorption process, during which ions from the sample of interest are transferred into the gas phase and can then be analyzed by their behavior in an electric field. During the ionization or desorption of the sample molecules non-covalent bonds can be preserved which allows the analysis of not only the identity of constituting molecules but also their stoichiometry and can thus provide insight into structural characteristics (Leney and Heck, 2017).
The conventional approach to determine binding affinities, depending on identification of binding partners and the complex stoichiometry prior to the quantitative investigation of the interactions is often time and sample consuming as well as reliant on access to these different analytical methods. To simplify the procedure and ideally minimize the amount of sample and time needed in the process, methods that provide qualitative as well as quantitative information with one experiment are of interest. In our opinion (native) mass spectrometry methods are specifically well suitable to be pushed further to answer questions regarding the interplay of increasingly complicated and often heterogeneous systems, as it allows precise compositional studies and a mass spectrum’s signal intensities relate to the abundance of the correlating species. In the following we will give a brief overview over MS based methods for affinity determination. For a more in-depth discussion of the capabilities of native MS and the challenges posed by different applications the reader is referred to a review by Hopper and Robinson (Hopper and Robinson, 2014).
There are by now several approaches to determine the thermodynamic equilibrium of non-covalent interactions by native mass spectrometry. Most of these are based on Electrospray Ionization (ESI). ESI requires application of a voltage to a capillary containing the sample of interest, which generates an aerosol of charged droplets, which shrink due to evaporation. Repulsion of the accumulating charges in these droplets lead to a break down into smaller, lower charged droplets. During that process the analyte is ionized and transferred into the gas phase. For the analysis of complexes, the non-covalent interactions between binding partners may be preserved. Standardly investigation of biomolecular complexes aims at qualitative assessment of the complex composition. Assessment of binding affinities additionally requires quantitative determination of the present complexes and subunits to allow a statement about their ratio. Challenges for the quantitative assessment by native MS, which should be taken into account, can include differing response factors of different substances (Kitova et al., 2012; Root et al., 2017). The response factor is defined by the correlation factor between signal intensity in the mass spectrum and concentration of a substance, which depends on the substances’ ionization efficiency, its ion transportation efficiency, and the detector sensitivity for the respective mass/charge ratio (m/z). Additionally dissociation and association during the ionization/desorption process as well as such processes in the gas phase must be considered (Kitova et al., 2012). Generally challenging for MS based methods are low affinity interactions, such as the mM KDs which are often found with glycan binding (Dülfer et al., 2021). These however place challenges for other analytical methods as well (Peters et al., 2021).
The most common methods for affinity assessment with native MS are based on titrations. After multiple publications showed that it is possible to qualitatively study non-covalent interactions by ionspray mass spectrometry, Lim et al., (1995) presented a quantitative analysis of the solution equilibrium between a peptide ligand and vancomycin/ristocetin. The fundamental procedure used is still the basic principle of native MS titrations. During these experiments, the two binding partners are incubated with a varying concentration of one of them (Jecklin et al., 2009; Báez Bolivar et al., 2021) (Figures 1A–D). This can be done either by preparation of a titration series or with a continuous ESI source, which allows the gradual combination of the two components (Fryčák and Schug, 2007; Bui et al., 2022). The latter is for example used in the “gap sampler” by the Zenobi group for bioaffinity screening with high-throughput and low sample consumption (Neu et al., 2013; Kaeslin et al., 2021). Additionally, the comparison of peak intensities of the complexes vs. the unbound molecule as a function of the varied concentration allows a determination of the thermodynamic equilibrium as well as the ratio of the response factors of the bound and the unbound species (Gabelica et al., 2003). This has further been improved by the recent establishment of the Slow Mixing Mode (SLOMO) in the Klassen group. It enables the gradual combination of the components while reliably determining their relative response factors and affinity (Bui et al., 2022) (Figure 1E). The hyphenation of capillary electrophoresis with mass spectrometry to add the investigated ligand in increasing concentrations has allowed the investigation of stoichiometry and binding characteristics of oligonucleotides to cyclodextrin (Przybylski et al., 2018).
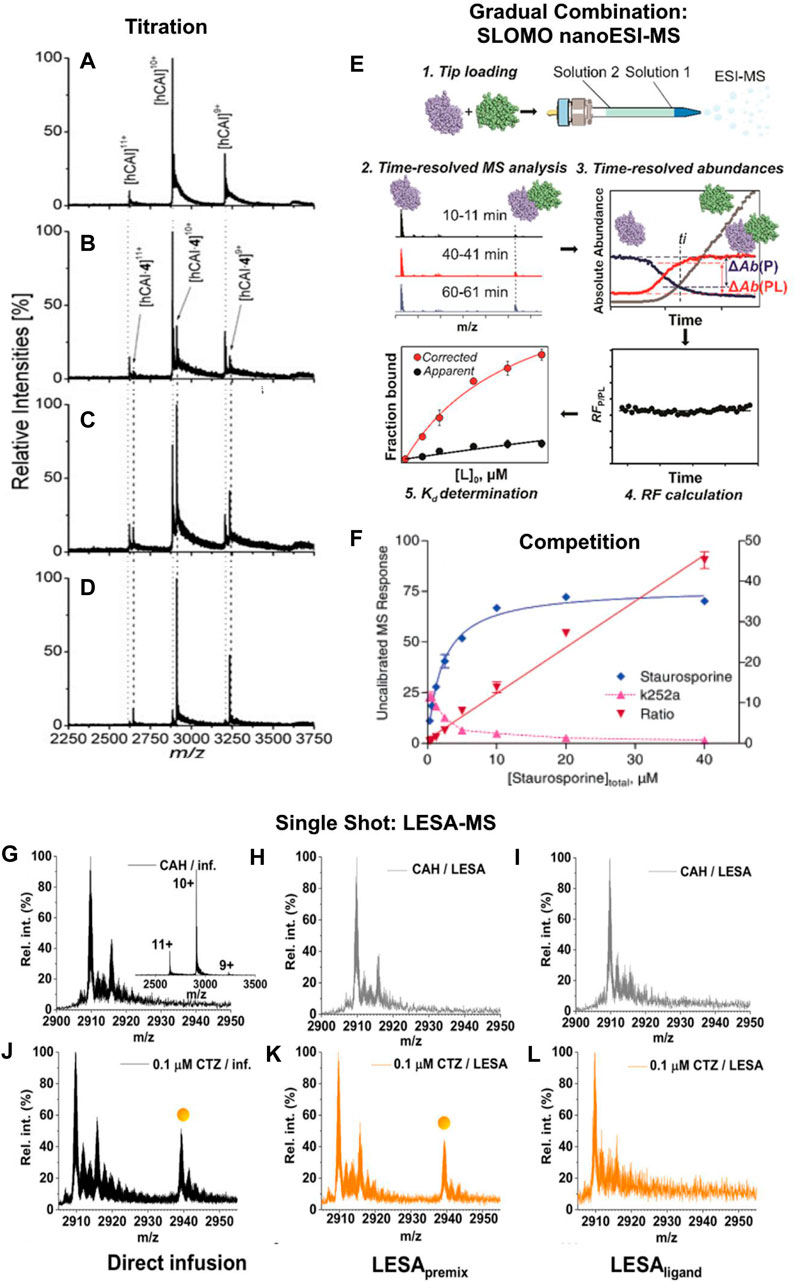
FIGURE 1. (A–D) Mass spectra of 5 µM human carbonic anhydrase I with different concentrations of ethoxzolamide: (A) 0 μM, (B) 1 μM, (C) 2 μM, and (D) 5 µM for affinity assessment. Unbound protein is marked with a dotted, the complex with a dashed line. A significant shift from free protein to nearly solely complex is observable with increasing ethoxzolamide concentration. Reproduced with permission from (Jecklin et al., 2009). Copyright 2009 John Wiley & Sons. (E) Example of an in-source gradual combination of interacting species. The workflow of a SLOMO experiment for measuring the KDs of biomolecular interactions is displayed. Step 1. Tip loading (with solution 1 and solution 2). Step 2. Time-resolved ESI-MS analysis. Step 3. Extraction of time-resolved abundances. Step 4. Calculation of the time-dependent relative RF. Step 5. Calculation of KD from RF and Rapp. Reproduced under CC-BY-4.0, (Bui et al., 2022). (F) Example graph of competition measurements with affinity ranking and determination of the mode of binding competition for a Zap-70−ligand complex with 20 µM K252a against staurosporine. The linear titrant to ligand response ratio plot indicates direct competition between staurosporine and K252a, the decrease of MS response belonging to the K252a complex below 50% of its starting concentration at 20 µM staurosporine shows the higher binding affinity of the latter. Adapted with permission from (Annis et al., 2004). Copyright 2004 American Chemical Society. (G–L) Comparison of spectra resulting from direct ESI-MS and LESA-MS measurements. For LESApremix measurements the substances are mixed prior to being dried and LESAligand measurements are performed by adding the ligand to the dried protein. Spectra shown regard to bovine carbonic anhydrase (CAH) alone (G–I) and in the presence of 0.1 μM chlorothiazide (J–L) following direct infusion, LESApremix, and LESAligand sampling respectively. (Inset) charge state distribution of CAH in its Zn2+-bound form with the 10+ ion being the most abundant. Reproduced under CC-BY-4.0, (Illes-Toth et al., 2022).
Another common group of methods for the analysis of binding affinities that has first been used by Jørgensen et al. (Jørgensen et al., 1998) and was later described as a general method by Kempen et al. (Kempen and Brodbelt, 2000) bases on the competition between different ligands that bind to the same binding site of a molecule. Here, the molecule is preincubated with a ligand with a known KD as reference system. By inserting another binding molecule into the solution, the equilibrium of the reference ligand with the target molecule is shifted (Annis et al., 2004) (Figure 1F). Given the assumption, that the ionization efficiency of the reference system is constant, this shift is solely dependent on the dissociation constant and concentration of the added ligand. Therefore, a measurement of the changing peak intensities of the reference system upon addition of different concentrations of the ligand of interest allows a direct affinity analysis. Additionally, this allows to investigate complexes otherwise not accessible by the used MS method, either due to their ionization efficiency, their mass or due to dissociation during ionization (Wortmann et al., 2008; El-Hawiet et al., 2010). Kopicki et al. were recently able to even make use of a contaminant binding to the Major Histocompatibility Complex (MHC) that is displaced by binding peptides for affinity screening (Kopicki et al., 2022). The use of a well-defined reference system can furthermore be utilized for affinity screening, as shown by Kitov et al. with their competitive universal proxy receptor assay (CUPRA) (Kitov et al., 2019).
MS based methods less reliant on particularly soft ionization are surface exposure approaches. While not necessarily coupled to native mass spectrometry ion sources, they allow the study of non-covalent binding affinities in native environments. An early example is a method called stability of unpurified proteins from rates of H/D exchange (SUPREX) (Ghaemmaghami et al., 2000; Powell and Fitzgerald, 2003). The method relies on the replacement of surface exposed protons in proteins with deuterium after adding deuterated buffer to the sample. If addition of a ligand promotes the unfolding of the protein, the amount of surface exposed protons will be affected, resulting in a mass shift. This shift can be determined via MALDI-MS in a ligand concentration dependent manner, allowing to determine the dissociation constant. A variation of that method is Protein–ligand interactions by mass spectrometry, titration, and H/D exchange (PLIMSTEX) (Zhu et al., 2005). In a similar manner it monitors H/D exchange, but making use of all solvent exposure changes upon ligand binding, either due to conformational changes or due to blocking of the binding site itself. This adds the possibility to monitor binding of large ligands and interactions not interfering with the native structure of the protein. Additionally, conformational information is provided by the amount of deuteration upon binding. A similar approach named LITPOMS (ligand titration, fast photochemical oxidation of proteins and mass spectrometry) uses fast photochemical oxidation of proteins by UV-irradiation of a sample containing hydrogen peroxide (Liu et al., 2019). The irradiation leads to a sub-milliseconds oxidation of solvent exposed molecular surfaces, which can be monitored and evaluated by MS.
The fastest and simplest way to use mass spectrometry for quantitative binding analysis are single point measurements. These methods directly link the relative peak intensities of intact and dissociated complexes with their affinity and have first reportedly been used by Loo and co-workers (Loo et al., 1993). A limiting factor for application of such approaches is the usually restricted knowledge of the response factor of a non-covalent complex. Therefore, mainly systems of a large molecule and a smaller ligand are accessible based on the experience, that the response factor of the complex and the larger molecule alone are identical. Another limitation of single point measurements is the unknown amount of dissociation during the ionization. This requires especially soft ionization techniques (Kitova et al., 2012). Therefore it is also a valuable approach to determine the softness of an ionization technique, as recently shown with Liquid extraction surface analysis (LESA). LESA is an ion source that is easy to automate and by deducing apparent KDs when using different preparations Illes-Toth et al. were able to determine the most native approach (Illes-Toth et al., 2022) (Figure 1G-L). Garcia-Alai et al. were able to determine macroscopic dissociation constants of proteins containing an epsin N-terminal homology domain with phosphatidylinositol 4,5-bisphosphate by single point measurements. Cytochrome C was added to the samples to detect and correct for unspecific clustering during ionization (Garcia-Alai et al., 2018). An alternative approach uses intentional complex dissociation by collision-induced dissociation to characterize complex stability (Yefremova et al., 2017).
An ion source which has been used for single point measurements in the past is laser-induced liquid bead ion desorption mass spectrometry (LILBID-MS). The basic method, utilizing a liquid sample beam was established by Kleinekofort et al. (Kleinekofort et al., 1996) in 1996 and has been further developed by Morgner, making it suitable for the analysis of a broad range of biological systems, using sample droplets (beads) (Henrich et al., 2017; Lieblein et al., 2020; Vu Huu et al., 2022). The method has shown to be tolerant regarding the sample environment e.g. in terms of salts, detergents or pH and is hence able to investigate samples in a particularly native state. This is underlined by the lowly charged ions that are generated by LILBID-MS and the range of non-covalent interactions detectable (Hellwig et al., 2022).
In the LILBID ion source, a piezo driven droplet generator produces aqueous droplets with a diameter of 50 μm–70 μm at a rate of 10 Hz containing the sample of interest. These droplets are transferred into a vacuum chamber and irradiated by a 6 ns IR-pulse. Its wavelength of 2.8 µm corresponds to the asymmetric OH-vibration of water and leads subsequently to an excitation of the irradiated volume into a supercritical state. During the following explosive expansion of the droplet, contained ions are desorbed from the solvent and transferred into the gas phase for mass analysis (Figure 2A).
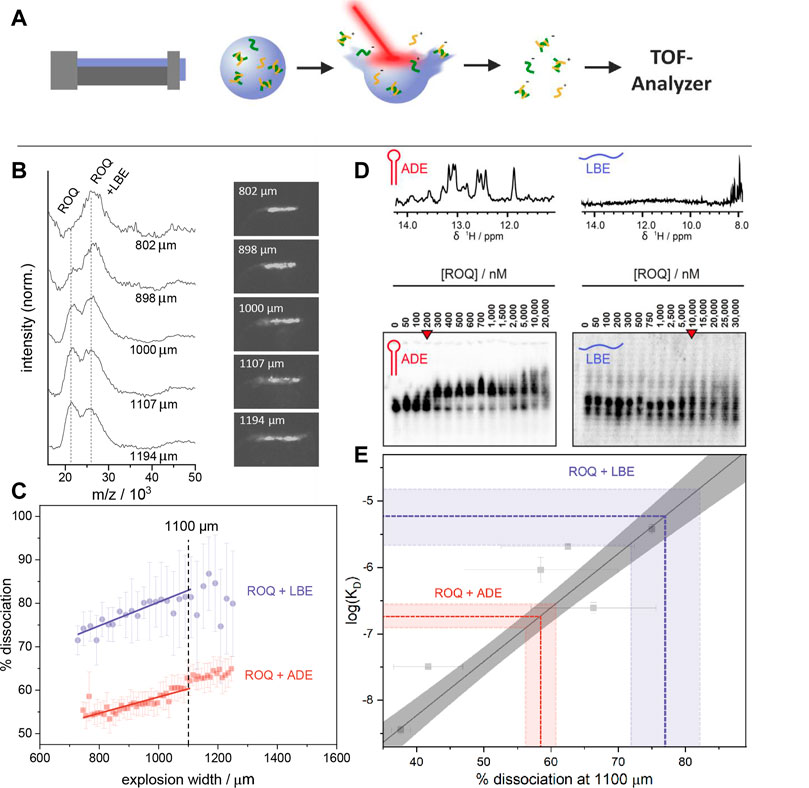
FIGURE 2. (A) Schematic depiction of the LILBID process. A microdroplet of the sample solution is irradiated with a laser pulse leading to the release of sample ions in their native charge state from the solvent into the gas phase. Dependent on the energy transfer of the laser to the sample, dissociation of non-covalent interactions may happen. The resulting ions are analysed by a time of flight detector. (B) LILBID spectra and pictures of the corresponding droplet explosions at different explosion widths. Right: Images of the droplets taken 5 µs after IR irradiation. Image contrast was enhanced for better visualization. Left: Spectra showing increasing dissociation of the ROQ and LBE sample with increasing explosion width. The concentration of protein and RNA were 20 μM and 30 µM respectively. Spectra are normalized to the peak height of the complex peak. (C) Laser dissociation curves with linear fits between 800 and 1,100 µm explosion width. This allows the determination of dissociated complex for a specific energy transfer. The dashed line indicates this point at 1,100 μm. The concentration for these measurements were each 10 µM for protein and RNA. (D) Top: 1D 1H imino proton spectra of ADE (left) and LBE (right). Bottom: EMSA of ROQ with ADE (left) and with LBE (right). Red arrow indicates KD points. E) The percentage of ssDNA at an explosion width of 1,100 μm for six different DNA systems as well as their log (KD) (Young et al., 2020) are used for a linear calibration curve. The calibration points are shown in grey. The grey area surrounding the calibration line represent the area covered by a confidence interval of 95%. The colored lines illustrate the KD retrieved by the calibration for the percentage of dissociated complex at an explosion width of 1,100 μm for 10 μM ROQ in the presence of 10 μM LBE (blue) and 10 μM ADE (purple). Error bars and the colored area are calculated as a standard deviation of duplicates or triplicates.
At elevated desorption laser energies an energy transfer from the water to the analyte molecules may take place and lead to a partial dissociation of non-covalent bonds. This effect is mainly correlated to the strength of the interaction and the absorbed energy during the irradiation. Hence, stronger bonds need higher laser energy for dissociation and weaker bonds are already broken at low laser intensities. Controlling the laser energy transferred into the sample is however not trivial due to e.g. fluctuations in the laser pulse power or variations in positions of each droplet relative to the laser focus. Young was able to show, that the transferred energy correlates to the size of the plume created during the explosive expansion of the droplet. (Young et al., 2020). Illuminating and recording a picture of the plume 5 µs after the IR-irradiation allows monitoring the diameter of the visible droplet dispersion (explosion width) as a proxy for the transferred laser energy (Figure 2B). Young was accordingly able to associate larger explosion widths with more dissociation of the bonds of a non-covalent complex (Young et al., 2020).
These findings enable the examination of different non-covalent interactions for the same laser energy transfer. To minimize the error and maximize the number of spectra usable for the analysis, dissociation is monitored in dependence of increased laser energies (laser ramping). This is done by plotting the percentage of dissociated complex against the explosion width of each droplet irradiation. For explosion widths between 600 μm and 1,100 µm a linear relation between dissociation and explosion width can be seen. With a linear fit, these relations can be interpolated for a specific explosion width (e.g. 1100 µm) and hence a specific laser energy transfer. By keeping the influence of the laser constant for each system, Young showed that it is possible to determine the thermodynamic equilibrium for the dissociation of double stranded DNAs by single point measurements after prior calibration. The reference affinity values for the calibration as well as for the evaluation have been done by ITC and UV melting curves and show a good correlation to the results gained by Young with quantitative LILBID (qLILBID).
To enable a generally applicable top down method for composition and affinity studies this approach has to be suitable not only for DNA but for other substance classes and combinations as well. For an overview of mass spectrometric analysis of nucleic acid complexes, the reader is referred to this excellent review and references within (Largy et al., 2022).
Here we show as a proof of concept that the above mentioned laser ramping approach can be widened to complexes of RNA and RNA-binding proteins (RBPs). As a model system, we use the immune-regulatory protein Roquin and RNA fragments of previously described targets, e.g. found in the Ox40 3′-UTR. Roquin recognizes stem-loop structures (termed CDE and ADE, constitutive and alternative decay elements, respectively) and recruits degradation machineries to initiate mRNA decay, both via deadenylation and decapping (Glasmacher et al., 2010; Leppek et al., 2013; Janowski et al., 2016). As many Roquin targets encode for key players in the immune system, Roquin function is crucial for immune responses in form of immune system homeostasis and T cell differentiation (Heissmeyer and Vogel, 2013). As we and others have recently shown, Roquin binds the Ox40 ADE with nanomolar affinity through its unique ROQ domain (Tants et al., 2022). Roquin also recognizes specific unstructured RNAs, termed linear binding elements (LBE), to which it binds with low micromolar affinities via the very same ROQ domain (Essig et al., 2018). We wondered whether this versatile RNA-binding capability can -in its full range-be quantitatively represented in LILBID and thus proves the method’s applicability to challenging RNA-protein complex systems.
As described above, the percentage of dissociated ROQ-RNA is plotted against the explosion width and interpolated to an explosion width of 1,100 µm (Figure 2C). A prior affinity calibration of the qLILBID measurements with oligonucleotides allowed for a good KD evaluation of the investigated systems. Figure 2E shows the obtained KD values correlate well with reference affinity values, obtained by EMSA measurements as previously described. The resulting percentage of dissociated protein at an explosion width of 1,100 µm were (58 ± 3) % for ROQ and ADE and (78 ± 6) % for ROQ and LBE. With the oligonucleotide calibration these correspond to dissociation constants of KD = (180 ± 40) nM in the case of ADE and KD = (6 ± 3) µM for LBE. These are in good agreement with the results obtained by EMSA and literature results of approximated KD,EMSA = 200 nM, and KD,Lit. = (170 ± 20) nM for ADE (Tants et al., 2022) and KD,EMSA = 5 µM and KD,Lit. = (3.6 ± 0.4) µM for LBE with a shorter ROQ version (Essig et al., 2018). These findings confirm the utilizability of LILBID-MS in these quantitative affinity investigations, covering a broad range of affinities (low nM to low µM) and both structured and unstructured RNAs.
The use of 20 mM NaCl in the sample buffer exemplifies the tolerance of LILBID regarding buffer conditions which can be challenging for other ion sources. With only about 50 pmol of substance required per measurement and only little method dependent preparation needed, it has furthermore proven to be highly time and sample efficient. A principle advantage of this method is that measurements do not rely on prior separation of the binding partners, as it is generally the case for established KD assessment methods, i.e. to mix samples at different concentrations to do titration experiments. This provides the opportunity of investigating volatile complexes.
In particular for RNA-protein complexes, our approach provides advantages over classical methods to determine binding affinities. First, LILBID does not require fluorescence- or radioactive isotope-labeling of RNAs, which is a clear gain in time and financial burden. Especially fluorescence tags may further interfere with the natural interaction and yield a different apparent affinity. The minimum amount of RNA needed is a clear benefit seeing the comparably high costs for commercial RNAs (relative to DNA) as well as for nucleotides used for in-house in vitro transcription.
As shown for the example of Roquin interacting with two completely different types of RNAs, LILBID allows in general to address the full spectrum of RNA-protein complexes. Clearly, the Roquin ROQ domain uses an induced-fit/conformational selection processes to shape-specifically engage with folded RNAs (Schlundt et al., 2014), i.e. driven by entropy and with very low complex off-rates. Differently, it uses charge-charge interactions to engage with linear RNAs, supposedly driven by on-rates. Thus, we suggest that our approach is able to cover quantitative analyses on RNPs based on very different types of complex formation, also seeing the constant increase in identification of so-far unknown RNA-binding proteins and their target sequences (Hentze et al., 2018)). LILBID comes with an additional mentionable advantage in future applications. In fact, for many RNA-protein complexes the type of interaction and its affinity is difficult to anticipate and predict (Schlundt et al., 2017) and the process of examining an initial order of magnitude for their binding constant is usually not desired to consume excessive amounts of sample. LILBID might become a valuable tool for the initial screening of affinity ranges for those.
In future the method will be widened to include other bio-molecular complexes. This might require specific calibration for the interaction type of interest (soluble or membrane proteins might require a different calibration curve than oligonucleotides) or a correction for the relation between explosion width and dissociated complex. As well the parallel determination of KD values for complexes with more than one binding partner will be established.
Discussion
With growing interest not only in biomolecular structures but in biological reaction pathways and mechanistic understanding of cellular processes, the further development of methods that allow a precise analysis of the partaking interactions is still of high relevance. As presented, there is a broad spectrum of mass spectrometry based methods that allow for qualitative as well as quantitative insights into non-covalent interactions. These combine the ability to identify binding partners and compositions and to determine their affinity for effective top-down investigation of biomolecular interactions. We expect further developments in instrumentation and adaptation of current methods in the following years to broaden the applicability towards larger, heterogeneous systems with more than two interacting species or with higher order stoichiometries.
Data availability statement
Publicly available datasets were analyzed in this study. This data can be found here: https://zenodo.org/record/4088567#.Y-5RFXbP1dg
Author contributions
NM and JS: conception and design; draft manuscript preparation, JS, J-NT and JE data collection, analysis and interpretation of results, J-NT and AS review of the manuscript; all authors approved the final version of the manuscript.
Funding
We gratefully acknowledge funding from the research training group 1986 (CLiC) at the Goethe University Frankfurt for JS NM is funded by the Deutsche Forschungsgemeinschaft (DFG, German Research Foundation)—Project-ID 426191805. For this work, AS is funded by the DFG grant number SCHL 2062/2-1 and by the Johanna Quandt Young Academy at Goethe (stipend number 2019/AS01).
Conflict of interest
The authors declare that the research was conducted in the absence of any commercial or financial relationships that could be construed as a potential conflict of interest.
Publisher’s note
All claims expressed in this article are solely those of the authors and do not necessarily represent those of their affiliated organizations, or those of the publisher, the editors and the reviewers. Any product that may be evaluated in this article, or claim that may be made by its manufacturer, is not guaranteed or endorsed by the publisher.
Supplementary material
The Supplementary Material for this article can be found online at: https://www.frontiersin.org/articles/10.3389/frans.2023.1119489/full#supplementary-material
References
Annis, D. A., Nazef, N., Chuang, C. C., Scott, M. P., and Nash, H. M. A general technique to rank Protein−Ligand binding affinities and determine allosteric versus direct binding site competition in compound mixtures’, journal of the American chemical society. Am. Chem. Soc. (2004) 126(47):15495–15503. doi:10.1021/ja048365x
Báez Bolivar, E. G., Bui, D. T., Kitova, E. N., Han, L., Zheng, R. B., Luber, E. J., et al. Submicron emitters enable reliable quantification of weak protein–glycan interactions by ESI-MS. Anal. Chem. (2021) 93(9):4231–4239. doi:10.1021/acs.analchem.0c05003
Budhadev, D., Poole, E., Nehlmeier, I., Liu, Y., Hooper, J., Kalverda, E., et al. Glycan-gold nanoparticles as multifunctional probes for multivalent lectin–carbohydrate binding: Implications for blocking virus infection and nanoparticle assembly’, journal of the American chemical society. Am. Chem. Soc. (2020) 142(42):18022–18034. doi:10.1021/jacs.0c06793
Bui, D. T., Li, Z., Kitov, P. I., Han, L., Kitova, E. N., Fortier, M., et al. Quantifying biomolecular interactions using Slow mixing mode (SLOMO) nanoflow ESI-MS’, ACS central science. Am. Chem. Soc. (2022) 8(7):963–974. doi:10.1021/acscentsci.2c00215
Dülfer, J., Yan, H., Brodmerkel, M. N., Creutznacher, R., Mallagaray, A., Peters, T., et al. Glycan-induced protein dynamics in human norovirus P dimers depend on virus strain and deamidation status. Molecules (2021) 26(8):2125. doi:10.3390/molecules26082125
El-Hawiet, A., Kitova, E. N., Liu, L., and Klassen, J. S. Quantifying labile protein–ligand interactions using electrospray ionization mass spectrometry. J. Am. Soc. Mass Spectrom. (2010) 21(11):1893–1899. doi:10.1016/j.jasms.2010.07.008
Essig, K., Kronbeck, N., Guimaraes, J. C., Lohs, C., Schlundt, A., Hoffmann, A., et al. Roquin targets mRNAs in a 3′-UTR-specific manner by different modes of regulation. Nat. Commun. (2018) 9(1):3810. doi:10.1038/s41467-018-06184-3
Folta-Stogniew, E., and Williams, K. R. Determination of molecular masses of proteins in solution: Implementation of an HPLC size exclusion chromatography and laser light scattering service in a core laboratory. J. Biomol. Tech. JBT (1999) 10(2):51–63.
Fryčák, P., and Schug, K. A. On-line dynamic titration: Determination of dissociation constants for noncovalent complexes using Gaussian concentration profiles by electrospray ionization mass spectrometry’, analytical chemistry. Am. Chem. Soc. (2007) 79(14):5407–5413. doi:10.1021/ac070519e
Gabelica, V., Galic, N., Rosu, F., Houssier, C., and De Pauw, E. Influence of response factors on determining equilibrium association constants of non-covalent complexes by electrospray ionization mass spectrometry. J. Mass Spectrom. (2003) 38(5):491–501. doi:10.1002/jms.459
Garcia-Alai, M. M., Heidemann, J., Skruzny, M., Gieras, A., Mertens, H. D. T., Svergun, D. I., et al. Epsin and Sla2 form assemblies through phospholipid interfaces. Nat. Commun. (2018) 9(1):328. doi:10.1038/s41467-017-02443-x
Ghaemmaghami, S., Fitzgerald, M. C., and Oas, T. G. A quantitative, high-throughput screen for protein stability. Proc. Natl. Acad. Sci. (2000) 97(15):8296–8301. doi:10.1073/pnas.140111397
Glasmacher, E., Hoefig, K. P., Vogel, K. U., Rath, N., Du, L., Wolf, C., et al. Roquin binds inducible costimulator mRNA and effectors of mRNA decay to induce microRNA-independent post-transcriptional repression. Nat. Immunol. (2010) 11(8):725–733. doi:10.1038/ni.1902
Guo, Y., Sakonsinsiri, C., Nehlmeier, I., Fascione, M. A., Zhang, H., Wang, W., et al. Compact, polyvalent mannose quantum dots as sensitive, ratiometric FRET probes for multivalent protein–ligand interactions. Angew. Chem. Int. Ed. (2016) 55(15):4738–4742. doi:10.1002/anie.201600593
Heissmeyer, V., and Vogel, K. U. Molecular control of Tfh-cell differentiation by Roquin family proteins. Immunol. Rev. (2013) 253(1):273–289. doi:10.1111/imr.12056
Hellman, L. M., and Fried, M. G. Electrophoretic mobility shift assay (EMSA) for detecting protein-nucleic acid interactions. Nat. Protoc. (2007) 2(8):1849–1861. doi:10.1038/nprot.2007.249
Hellwig, N., Martin, J., and Morgner, N. LILBID-MS: Using lasers to shed light on biomolecular architectures. Biochem. Soc. Trans. (2022) 50(3):1057–1067. doi:10.1042/BST20190881
Henrich, E., Peetz, O., Hein, C., Laguerre, A., Hoffmann, B., Hoffmann, J., et al. Analyzing native membrane protein assembly in nanodiscs by combined non-covalent mass spectrometry and synthetic biology. eLife (2017) 6:209544–e21014. doi:10.7554/eLife.20954
Hentze, M. W., Castello, A., Schwarzl, T., and Preiss, T. A brave new world of RNA-binding proteins. Nat. Rev. Mol. Cell Biol. Engl. (2018) 19(5):327–341. doi:10.1038/nrm.2017.130
Hopper, J. T. S., and Robinson, C. V. Mass spectrometry quantifies protein interactions—from molecular chaperones to membrane porins. Angew. Chem. Int. Ed. (2014) 53(51):14002–14015. doi:10.1002/anie.201403741
Illes-Toth, E., Stubbs, C. J., Sisley, E. K., Bellamy-Carter, J., Simmonds, A. L., Mize, T. H., et al. Quantitative characterization of three carbonic anhydrase inhibitors by LESA mass spectrometry. J. Am. Soc. Mass Spectrom. (2022) 33(7):1168–1175. American Society for Mass Spectrometry. Published by the American Chemical Society. All rights reserved., doi:10.1021/jasms.2c00024
Janowski, R., Heinz, G. A., Schlundt, A., Wommelsdorf, N., Brenner, S., Gruber, A. R., et al. 7. England (2016). p. 11032. Roquin recognizes a non-canonical hexaloop structure in the 3’-UTR of Ox40Nat. Commun. doi:10.1038/ncomms11032
Jecklin, M. C., Schauer, S., Dumelin, C. E., and Zenobi, R. Label-free determination of protein–ligand binding constants using mass spectrometry and validation using surface plasmon resonance and isothermal titration calorimetry. J. Mol. Recognit. (2009) 22(4):319–329. doi:10.1002/jmr.951
Jørgensen, T. J. D., Roepstorff, P., and Heck, A. J. R. Direct determination of solution binding constants for noncovalent complexes between bacterial cell wall peptide analogues and vancomycin group antibiotics by electrospray ionization mass spectrometry’, analytical chemistry. Am. Chem. Soc. (1998) 70(20):4427–4432. doi:10.1021/ac980563h
Kaeslin, J., Brunner, C., Ghiasikhou, S., Schneider, G., and Zenobi, R. Bioaffinity screening with a rapid and sample-efficient autosampler for native electrospray ionization mass spectrometry’, analytical chemistry. Am. Chem. Soc. (2021) 93(39):13342–13350. doi:10.1021/acs.analchem.1c03130
Kairys, V., Baranauskiene, L., Kazlauskiene, M., Matulis, D., and Kazlauskas, E. Binding affinity in drug design: Experimental and computational techniques’, expert opinion on drug discovery. Taylor Francis (2019) 14(8):755–768. doi:10.1080/17460441.2019.1623202
Karlsson, R., Michaelsson, A., and Mattsson, L. Kinetic analysis of monoclonal antibody-antigen interactions with a new biosensor based analytical system. J. Immunol. Methods (1991) 145(1):229–240. doi:10.1016/0022-1759(91)90331-9
Kempen, E. C., and Brodbelt, J. S. A method for the determination of binding constants by electrospray ionization mass spectrometry’, analytical chemistry. Am. Chem. Soc. (2000) 72(21):5411–5416. doi:10.1021/ac000540e
Kitov, P. I., Kitova, E. N., Han, L., Li, Z., Jung, J., Rodrigues, E., et al. A quantitative, high-throughput method identifies protein–glycan interactions via mass spectrometry. Commun. Biol. (2019) 2(1):268. doi:10.1038/s42003-019-0507-2
Kitova, E. N., El-Hawiet, A., Schnier, P. D., and Klassen, J. S. Reliable determinations of protein–ligand interactions by direct ESI-MS measurements. Are we there yet? J. Am. Soc. Mass Spectrom. (2012) 23(3):431–441. American Society for Mass Spectrometry. Published by the American Chemical Society. All rights reserved., doi:10.1007/s13361-011-0311-9
Kleinekofort, W., Avdiev, J., and Brutschy, B. A new method of laser desorption mass spectrometry for the study of biological macromolecules. Int. J. Mass Spectrom. Ion Process. (1996) 152(2–3):135–142. doi:10.1016/0168-1176(95)04330-6
Kopicki, J.-D., Saikia, A., Niebling, S., Gunther, C., Anjanappa, R., Garcia-Alai, M., et al. Opening opportunities for Kd determination and screening of MHC peptide complexes. Commun. Biol. (2022) 5(1):488. doi:10.1038/s42003-022-03366-0
Largy, E., Konig, A., Ghosh, A., Ghosh, D., Benabou, S., Rosu, F., et al. Mass spectrometry of nucleic acid noncovalent complexes’, chemical reviews. Am. Chem. Soc. (2022) 122(8):7720–7839. doi:10.1021/acs.chemrev.1c00386
Leney, A. C., and Heck, A. J. R. Native mass spectrometry: What is in the name?’, journal of the American society for mass spectrometry. J. Am. Soc. Mass Spectrom. (2017) 28(1):5–13. doi:10.1007/s13361-016-1545-3
Leppek, K., Schott, J., Reitter, S., Poetz, F., Hammond, M. C., and Stoecklin, G. Roquin promotes constitutive mRNA decay via a conserved class of stem-loop recognition motifs. Cell (2013) 153(4):869–881. doi:10.1016/j.cell.2013.04.016
Liao, J., Madahar, V., Dang, R., and Jiang, L. Quantitative FRET (qFRET) technology for the determination of protein–protein interaction affinity in solution. Molecules (2021) 26(21):6339. doi:10.3390/molecules26216339
Lieblein, T., Zangl, R., Martin, J., Hoffmann, J., Hutchison, M. J., Stark, T., et al. Structural rearrangement of amyloid-β upon inhibitor binding suppresses formation of Alzheimer’s disease related oligomers. eLife (2020) 9:e59306–e59330. doi:10.7554/eLife.59306
Lim, H.-K., Hsieh, Y. L., Ganem, B., and Henion, J. Recognition of cell-wall peptide ligands by vancomycin group antibiotics: Studies using ion spray mass spectrometry. J. Mass Spectrom. (1995) 30(5):708–714. doi:10.1002/jms.1190300509
Liu, X. R., Zhang, M. M., Rempel, D. L., and Gross, M. L. Protein-ligand interaction by ligand titration, fast photochemical oxidation of proteins and mass spectrometry: Litpoms. J. Am. Soc. Mass Spectrom. (2019) 30(2):213–217. doi:10.1007/s13361-018-2076-x
Loo, R. R. O., Goodlett, D. R., Smith, R. D., and Loo, J. A. Observation of a noncovalent ribonuclease S-protein/S-peptide complex by electrospray ionization mass spectrometry. J. Am. Chem. Soc. (1993) 115(10):4391–4392. ACS Publications. doi:10.1021/ja00063a079
Neu, V., Steiner, R., Muller, S., Fattinger, C., and Zenobi, R. Development and characterization of a capillary gap sampler as new microfluidic device for fast and direct analysis of low sample amounts by ESI-MS’, analytical chemistry. Am. Chem. Soc. (2013) 85(9):4628–4635. doi:10.1021/ac400186t
Peters, T., Creutznacher, R., Maass, T., Mallagaray, A., Ogrissek, P., Taube, S., et al. Norovirus–glycan interactions — How strong are they really? Biochem. Soc. Trans. (2021) 50(1):347–359. doi:10.1042/BST20210526
Powell, K. D., and Fitzgerald, M. C. Accuracy and precision of a new H/D exchange- and mass spectrometry-based technique for measuring the thermodynamic properties of Protein−Peptide complexes’, biochemistry. Am. Chem. Soc. (2003) 42(17):4962–4970. doi:10.1021/bi034096w
Przybylski, C., Benito, J. M., Bonnet, V., Mellet, C. O., and Garcia Fernandez, J. M. Revealing cooperative binding of polycationic cyclodextrins with DNA oligomers by capillary electrophoresis coupled to mass spectrometry. Anal. Chim. Acta (2018) 1002:70–81. doi:10.1016/j.aca.2017.11.034
Root, K., Wittwer, Y., Barylyuk, K., Anders, U., and Zenobi, R. Insight into signal response of protein ions in native ESI-MS from the analysis of model mixtures of covalently linked protein oligomers. J. Am. Soc. Mass Spectrom. (2017) 28(9):1863–1875. doi:10.1007/s13361-017-1690-3
Schlundt, A., Heinz, G. A., Janowski, R., Geerlof, A., Stehle, R., Heissmeyer, V., et al. Structural basis for RNA recognition in roquin-mediated post-transcriptional gene regulation.’, Nature structural and molecular biology. U. S. (2014) 21(8):671–678. doi:10.1038/nsmb.2855
Schlundt, A., Tants, J.-N., and Sattler, M. Integrated structural biology to unravel molecular mechanisms of protein-RNA recognition. Methods. (2017) 118–119:119–136. doi:10.1016/j.ymeth.2017.03.015
Stenberg, E., Persson, B., Roos, H., and Urbaniczky, C. Quantitative determination of surface concentration of protein with surface plasmon resonance using radiolabeled proteins. J. Colloid Interface Sci. (1991) 143(2):513–526. doi:10.1016/0021-9797(91)90284-F
Tants, J.-N., Becker, L. M., McNicoll, F., Muller-McNicoll, M., and Schlundt, A. NMR-derived secondary structure of the full-length Ox40 mRNA 3 UTR and its multivalent binding to the immunoregulatory RBP Roquin. Nucleic Acids Res. (2022) 50:4083–4099. doi:10.1093/nar/gkac212
Vu Huu, K., Zangl, R., Hoffmann, J., Just, A., and Morgner, N. Bacterial F-type ATP synthases follow a well-choreographed assembly pathway. Nat. Commun. (2022) 13(1):1218. doi:10.1038/s41467-022-28828-1
Walport, L. J., Low, J. K. K., Matthews, J. M., and Mackay, J. P. The characterization of protein interactions – what{,} how and how much? Chem. Soc. Rev. R. Soc. Chem. (2021) 50(22):12292–12307. doi:10.1039/D1CS00548K
Wen, J., Arakawa, T., and Philo, J. S. Size-exclusion chromatography with on-line light-scattering, absorbance, and refractive index detectors for studying proteins and their interactions. Anal. Biochem. (1996) 240(2):155–166. doi:10.1006/abio.1996.0345
Wortmann, A., Jecklin, M. C., Touboul, D., Badertscher, M., and Zenobi, R. Binding constant determination of high-affinity protein–ligand complexes by electrospray ionization mass spectrometry and ligand competition. J. Mass Spectrom. (2008) 43(5):600–608. doi:10.1002/jms.1355
Wyatt, P. J. Light scattering and the absolute characterization of macromolecules. Anal. Chim. Acta (1993) 272(1):1–40. doi:10.1016/0003-2670(93)80373-S
Yefremova, Y., Melder, F. T. I., Danquah, B. D., Opuni, K. F. M., Koy, C., Ehrens, A., et al. Apparent activation energies of protein–protein complex dissociation in the gas–phase determined by electrospray mass spectrometry. Anal. Bioanal. Chem. (2017) 409(28):6549–6558. doi:10.1007/s00216-017-0603-4
Young, P., Hense, G., Immer, C., Wohnert, J., and Morgner, N. LILBID laser dissociation curves: A mass spectrometry-based method for the quantitative assessment of dsDNA binding affinities. Sci. Rep. (2020) 10(1):20398. doi:10.1038/s41598-020-76867-9
Keywords: dissociation constants, native mass spectrometry, method development, RNA protein complexes, biomolecular interactions
Citation: Schulte J, Tants J-N, von Ehr J, Schlundt A and Morgner N (2023) Determination of dissociation constants via quantitative mass spectrometry. Front. Anal. Sci. 3:1119489. doi: 10.3389/frans.2023.1119489
Received: 08 December 2022; Accepted: 26 January 2023;
Published: 24 February 2023.
Edited by:
Huilin Li, Sun Yat-sen University, ChinaReviewed by:
Prashant Jethva, Washington University in St. Louis, United StatesCharlotte Uetrecht, University of Siegen, Germany
Copyright © 2023 Schulte, Tants, von Ehr, Schlundt and Morgner. This is an open-access article distributed under the terms of the Creative Commons Attribution License (CC BY). The use, distribution or reproduction in other forums is permitted, provided the original author(s) and the copyright owner(s) are credited and that the original publication in this journal is cited, in accordance with accepted academic practice. No use, distribution or reproduction is permitted which does not comply with these terms.
*Correspondence: Nina Morgner, bW9yZ25lckBjaGVtaWUudW5pLWZyYW5rZnVydC5kZQ==
†ORCID ID: Jan-Niklas Tants, orcid.org/0000-0002-2455-8135