 Florencia Cora Jofre
 Ariane I. Barros
 Joaquim A. Nóbrega
 Marianela Savio
- 1Facultad Ciencias Exactas y Naturales, Universidad Nacional de La Pampa (UNLPam), Santa Rosa, La Pampa, Argentina
- 2Instituto de Ciencias de la Tierra y Ambientales de La Pampa (Consejo Nacional de Investigaciones Científicas y Técnicas - Universidad Nacional de La Pampa), INCITAP, Mendoza, Argentina
- 3Study Group on Soil Residues and Organic Matter, Department of Rural and Soil Engineering, Faculty of Agronomy and Zootechnics, Federal University of Mato Grosso, Mato Grosso, Brazil
- 4Group for Applied Instrumental Analysis, Department of Chemistry, Federal University of São Carlos, São Carlos, Brazil
This study evaluates the effectiveness of Multi-Energy Calibration (MEC) for multielemental analysis in animal feeds using plasma-based optical emission spectrometry (ICP-OES and MIP-OES). The aim was to improve accuracy in detecting essential minerals by overcoming matrix interferences that affect instrumental techniques. Swine feed samples from different growth stages were analyzed, focusing on essential minerals for animal health and productivity, such as Ca, Co, Cu, Fe, K, Mg, Mn, Na, P, and Zn. The MEC strategy utilizes multiple wavelengths per element, reducing calibration complexity and enhancing accuracy by using only two calibration solutions per sample. Results demonstrate that MEC improves recoveries (80%–105%) when compared to traditional external calibration (EC). The limits of quantification (LOQs) ranged from 0.09 mg kg⁻1 for Mn to 31 mg kg⁻1 for Ca and Na using MEC-ICP-OES, and from 0.08 mg kg⁻1 for Mn to 354 mg kg⁻1 for P using MEC-MIP-OES. For EC, they ranged from 0.4 mg kg⁻1 for Co to 195 mg kg⁻1 for K with ICP-OES and from 2.0 mg kg⁻1 for Mg to 607 mg kg⁻1 for Fe with MIP-OES. MEC provides high precision and matrix-matching capabilities. This makes MEC a reliable method for complex feed matrices, supporting more accurate feed formulations to ensure optimal livestock nutrition.
1 Introduction
The rapid growth of the global population, projected to reach nearly 10 billion by 2050, is driving a significant increase in food demand, emphasizing the need for sustainable agricultural practices (Beily et al., 2011). In alignment with the Sustainable Development Goals (SDGs), which focus on eradicating hunger, achieving food security, improving nutrition, and promoting sustainable agriculture, many countries are adopting tailored strategies to boost food production (SDGs, 2024). One major area of focus is livestock production, where confined animal systems have become prevalent, increasing the demand for nutritionally balanced feed supplements (McDowell, 1992). These supplements must provide adequate concentrations of essential nutrients such as proteins, vitamins, and minerals to ensure animal health and productivity (Solà-Oriol and Gasa, 2017; Shurson et al., 2011; Spears and Weiss, 2008). The mineral content of feed is critical, as both deficiencies and excesses can lead to diseases, affecting not only animal wellbeing but also the quality of animal-derived food products consumed by humans (Patience, 1996; Novo et al., 2018).
Swine production offers advantages such as high efficiency in converting plant protein into animal protein, adaptability to thermal variations, and shorter production cycles compared to other livestock (Spears and Weiss, 2008). Efficient feed management, accounting for about 70% of production costs, is essential for profitability, particularly as pigs require specific nutrients at different life stages, from reproduction to growth. Therefore, the accurate measurement of essential minerals like calcium (Ca), chlorine (Cl), cobalt (Co), copper (Cu), iodine (I), iron (Fe), magnesium (Mg), manganese (Mn), phosphorus (P), potassium (K), selenium (Se), sodium (Na), sulfur (S), zinc (Zn), among others, in animal feed is crucial for ensuring optimal growth and productivity (National Research Council, 2012).
The complexity of agro-food matrices, which include pastures, grains, and rations, implies challenges for analytical techniques used in trace element determination. Sample preparation is a critical step, as it can introduce errors, with residual organic carbon and suspended solids potentially causing spectral and non-spectral interferences (Analytical Methods Committee, 2013). In recent years, different sample treatments employing microwave, infrared and/or ultrasound radiations have been proposed to improve the analyte extraction (Matusiewicz, 2017; Nóbrega et al., 2012; Jofre and Savio, 2024). Additionally, calibration is a crucial aspect of analytical procedures, as it ensures the accurate translation of signal intensities into analyte concentrations. Traditional methods like external calibration (EC) are widely used for simple matrices, but for complex matrices, alternatives like internal standardization (IS) and standard additions (SA) are often necessary to correct for interferences (Carter et al., 2018; Barros, Pinheiro, and Nóbrega, 2019; Donati and Amais, 2019).
To address conventional methods limitations, a novel calibration technique known as Multi-Energy Calibration (MEC) has been developed (Virgilio et al., 2017). When applying MEC to plasma emission spectrometry, multiple emission lines (wavelengths) for each element are measured simultaneously for calibration, instead of relying on a single emission line. Since inductively coupled plasma optical emission spectrometry (ICP-OES) and microwave induced plasma optical emission spectrometry (MIP-OES) plasmas can reach high temperatures (ca. 10,000 K and ca. 5,000K, respectively), they effectively atomize, excite, and ionize many elements, generating multiple characteristic atomic and ionic emission lines. MEC takes advantage of this fact, offering several significant advantages that make it a powerful calibration strategy in plasma emission spectrometry. By utilizing multiple wavelengths, it mitigates interferences through the identification and elimination of affected wavelengths. A fundamental advantage of the MEC strategy is its ability to facilitate the visual identification of emission lines impacted by interferences, which appear as outliers on the calibration plot (Carter et al., 2018). This method is highly efficient, requiring only two calibration solutions per sample, thereby streamlining the analytical process and reducing both time and resource demands. Furthermore, its compatibility with existing instrumentation ensures that no modifications are necessary, making MEC a straightforward and adaptable technique for diverse analytical applications (Virgilio et al., 2020).
As shown in Figure 1, laser-induced breakdown spectroscopy (LIBS) demonstrates the highest number of publications, particularly in 2020, while MIP-OES and ICP-OES show a more consistent distribution across the years. (Santos et al., 2024; Carneiro and Dias, 2021; Virgilio et al., 2020; Pereira et al., 2020; Cruz et al., 2024; Li et al., 2020; Garde et al., 2020; Cruz et al., 2020; Gonçalves et al., 2019; Higuera, Silva, and Nogueira, 2019; Barros, Pinheiro, and Nóbrega, 2019; Machado et al., 2018; Virgilio et al., 2017; Castro, Babos, and Pereira-Filho, 2020; Carvalho et al., 2019; Vieira et al., 2019; Augusto et al., 2018; Babos et al., 2019; Babos et al., 2018; Fortunato et al., 2019; Soares, Donati, and Rocha, 2022). Notably, no MEC-related publications associated with these techniques are reported for the years 2022 and 2023 Comparative studies between ICP-OES and MIP-OES are limited to publications from 2017 to 2020, highlighting the need for additional research to provide comprehensive comparative data on these two techniques. As demonstrated in prior studies (Santos et al., 2024; Pereira et al., 2020; Machado et al., 2018; Gonçalves et al., 2019; Higuera, Silva, and Nogueira, 2019; Carter et al., 2018), MEC has proven particularly effective for complex matrices such as food, beverages, and biological samples, among others. Its versatility and robust performance in identifying interferences and delivering accurate results position MEC as a significant advancement in plasma spectrometry calibration strategies.
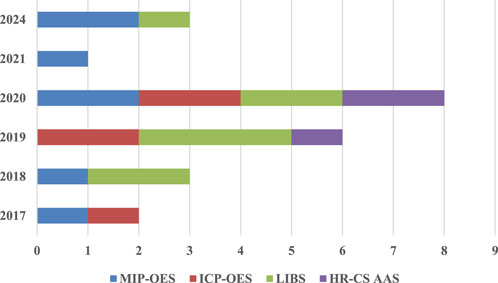
Figure 1. Distribution of MEC publications with MIP-OES, ICP-OES, LIBS, and HR-CS AAS from 2017 to 2024.
This study aims to evaluate the potential of MEC as a matrix-matching calibration strategy for the determination of minerals such as Ca, Co, Cu, Fe, K, Mg, Mn, Na, P, and Zn in animal feed samples using ICP-OES and MIP-OES; ensuring reliable quantification of mineral content. Additionally, the study seeks to assess the nutritional value of the feed, as this information is critical for formulating balanced rations that directly impact pig growth and development.
2 Materials and methods
2.1 Sampling and sample preservation
Thirteen swine feed samples covering different physiological stages in pork life were obtained from a local farm in La Pampa, Argentina. The following different growth stages were considered: Growth stages I (3–5 kg), II (5–10 kg), III (10–20 kg), and IV (20–50 kg); Development phases I (20–50 kg), II (20–50 kg) and III (50–80 kg); Completion phase I (20–50 kg), II (50–80 kg) and III (50–80 kg); Bristle (80–120 kg); Bristle in gestation; and Bristle in lactation. All samples were gathered into polyethylene bags and stored in a dry and dark place. The samples were then pulverized using cryogenic milling equipment (model MA 775, Marconi, Piracicaba, SP, Brazil).
2.2 Sample preparation
Samples for ICP-OES determination were prepared according to the method proposed by Savio et al. (2019), using an UltraWAVE™ microwave oven with a single reaction chamber design (SRC, Milestone, Sorisole, Italy) (Nóbrega et al., 2012). For MIP-OES determination, samples were prepared following the method by Cora Jofre et al., using an infrared radiation digestion prototype (IRAD) (Jofre et al., 2020).
2.3 Instrumentation
Multielemental determinations were carried out by ICP-OES iCAP 7,000 from Thermo with dual view configuration (Thermo Fisher Scientific, Madison, WI, United States) and by MIP-OES, Agilent model MP AES 4210, operating in conventional conditions as shown in Table 1. Argon (99.999%, White Martins-Praxair) was used in all measurements.
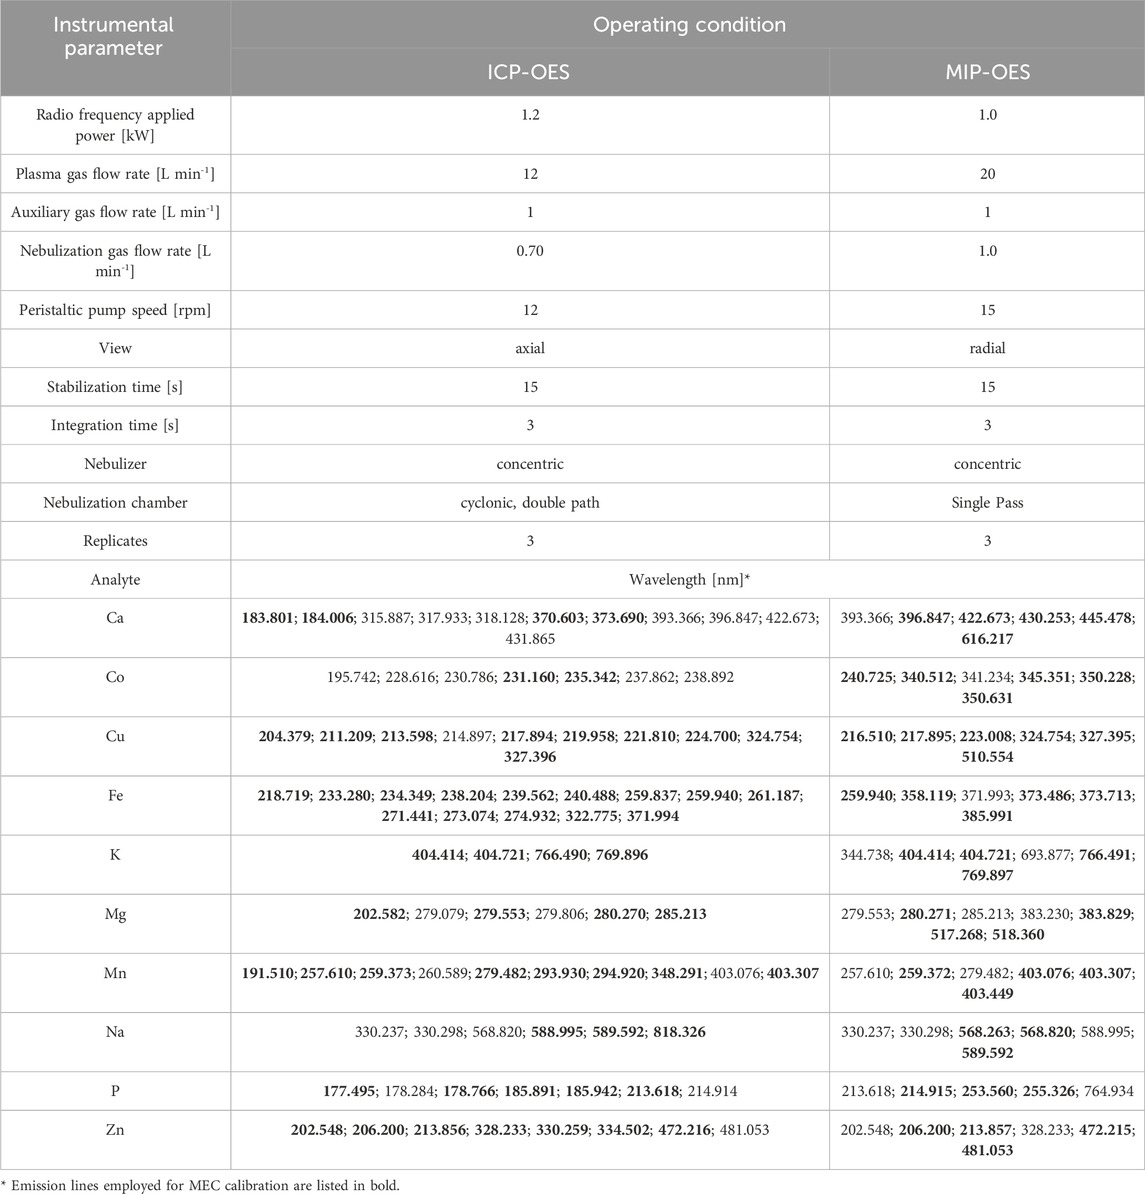
Table 1. Operating conditions for ICP-OES and MIP-OES determinations, including selected wavelength lines (discarded wavelengths are indicated in bold).
2.4 Reagents, standards, and solutions
2.4.1 For MEC-ICP-OES determination
All reagents were of analytical grade, and all solutions were prepared using distilled-deionized water. A Millipore ultrapure water system (Millipore, Billerica, MA, United States) was utilized, which generates ultrapure deionized water (resistivity ≥18.2 MΩ cm). Concentrated HNO3 (Merck, Darmstadt, Germany) was obtained using a sub-boiling device (Milestone). Concentrated hydrogen peroxide (30% w w−1), Labsynth, Diadema, SP, Brazil) was also employed.
Standard solutions for MEC experiments were prepared by diluting of 1,000 mg L-1 solution of Ca, Co, Cu, Fe, K, Mg, Mn, Na, P, and Zn (Qhemis, São Paulo, SP, Brasil; Titrisol-Merck, Darmstadt, Germany and Fluka, Buchs St. Gallen, Switzerland) in 0.14 mol L-1 HNO3 solution. To assess the accuracy of the method, two reference materials (RM-Agro E3001a - Bovine Liver and MRC20 - Corn grain) and a proficiency test material “animal mineral supplement” (SM18-03) produced by EMBRAPA Pecuária Sudeste (São Carlos, SP, Brazil), were used.
2.4.2 For MEC-MIP-OES determination
All solutions were prepared using ultrapure water sourced from a Millipore® ultrapure water system (Mili-Q) as described previously. For sample digestion, nitric acid (HNO₃, 65% w w−1, MERCK) was purified using a Berghoff® sub-boiling mineral acid distillation system to produce ultrapure, metal-free acid. Hydrogen peroxide (H₂O₂, 30% w w−1, SIGMA-ALDRICH) was also utilized. Standard solutions were prepared by diluting individual 1,000 mg L⁻1 stock solutions of Ca, Co, Cu, Fe, K, Mg, Mn, Na, P, and Zn (Sigma-Aldrich) for MEC analytical calibration. The proposed method was validated using the same reference materials as Section 2.4.1.
2.5 Preparation of solutions and calculations for MEC experiments
For preparing the calibration curves based on MEC strategy two solutions per sample and a mixing proportion of 1:1 (v v−1) were adopted. The solution 1 (S1) was comprised of 50% (v v−1) of the digested sample and 50% (v v−1) of the standard solutions containing all analytes (Ca, Co, Cu, Fe, K, Mg, Mn, Na, P, and Zn) at varying concentrations (C_std) determined according to the expected analyte concentrations in the samples, as outlined by Carter et al. (Carter et al., 2018). Solution 2 (S2) consisted of 50% (v v−1) of the digested sample and 50% (v v−1) of an analytical blank solution (Virgilio et al., 2017; Machado et al., 2018). For the construction of MEC calibration curve, emission intensities at multiple wavelengths were recorded for each analyte, where the signals for S1 and S2 are plotted on the x and y-axes, respectively, resulting in a straight line. Once the MEC calibration curves were established, the concentration of each analyte was calculated using the following Equation 1 proposed by Virgilio et al. (2017):
All experiments were carried out in triplicate, and the results were expressed as the mean of the measurements ± a confidence interval (α = 0.05).
2.6 Statistical analysis
Microsoft Office Professional Plus Excel™ was utilized for all computations, including calibrations, performance metrics, recovery analyses, correlation assessments, comparisons, and associated statistical tests.
For MEC, the calculation of limits of detection (LODs) and quantification (LOQs) were made following error propagation approach, employing the concentration of the standard solution (C_std), the standard deviation of the slope (S_slope), and the slope itself, as described by Virgilio et al. (2020). The following Equations 2, 3 were applied:
3 Results and discussion
3.1 Multi-energy calibration strategy optimization
For the MEC method, optimal analytical lines were selected based on their sensitivity and interference absence. Each one, presented in Table 1, was used to obtain the calibration curve. Lines that deviate from the expected calibration model, indicated as outliers, were systematically excluded (emission lines employed for MEC calibration are listed in Table 1 in bold).
In the present study, the MEC strategy was applied to multielement determinations using both ICP-OES and MIP-OES. Signals from S1 (x-axis) and S2 (y-axis) were used to construct the MEC plots (Virgilio et al., 2017; Machado et al., 2018). Figures 2, 3 display the calibration curves for the 10 analytes determined by ICP-OES and MIP-OES using MEC, based on the reference material RM-Agro E3001a (Bovine Liver). Supplementary Tables S1, 2 show the average intensities (n = 3) and SD used for MEC-ICP-OES and MEC-MIP-OES curves construction. Similarly, Supplementary Figures S1, 2, exhibit the calibration curves for the 10 analytes measured by ICP-OES and MIP-OES using MEC, based on Corn Grain reference material. The slopes and R2 values are compared in Table 2 and Supplementary Table S3 for 10 analytes across different sample types (e.g., maize, bovine liver, and animal mineral supplement), using both MEC-ICP-OES and MEC-MIP-OES. The calibration plots linearity was evaluated, and curves with emission lines that exhibited R2 values above 0.9692 for ICP-OES and 0.9025 for MIP-OES were retained for further analysis (Table 2 and Supplementary Table S3), where a R2 near 1.000 suggests that the selected wavelengths are likely free from interferences (Pereira et al., 2020). The slopes of the calibration curves were carefully assessed to ensure all angular coefficients fell within the acceptable range (0.1 < slope <0.9), as slopes outside this range could indicate potential inaccuracies (Virgilio et al., 2020).
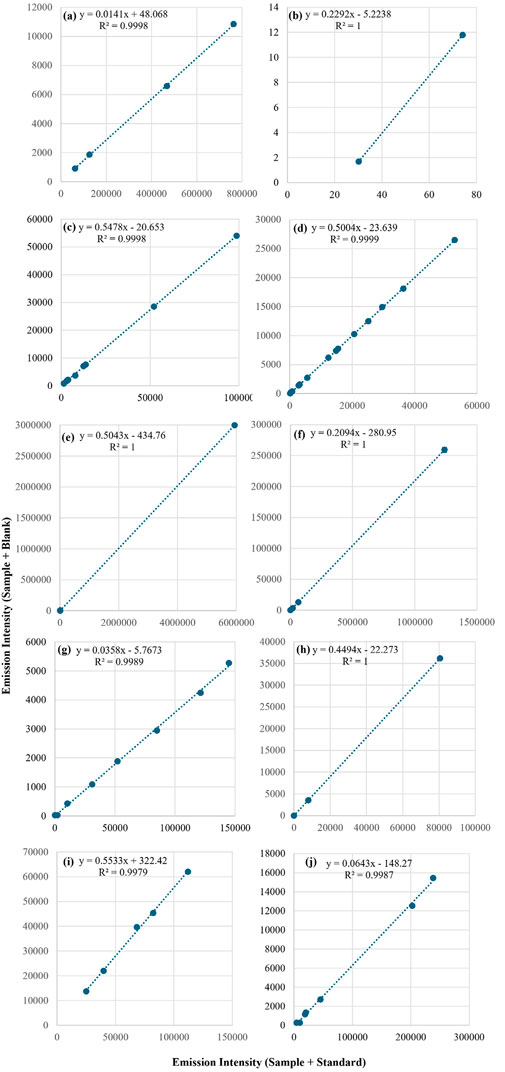
Figure 2. Multi-energy calibration curves for (A) Ca, (B) Co, (C) Cu, (D) Fe, (E) K, (F) Mg, (G) Mn, (H) Na, (I) P and (J) Zn determined in RM-Agro E3001a - Bovine Liver by ICP-OES.
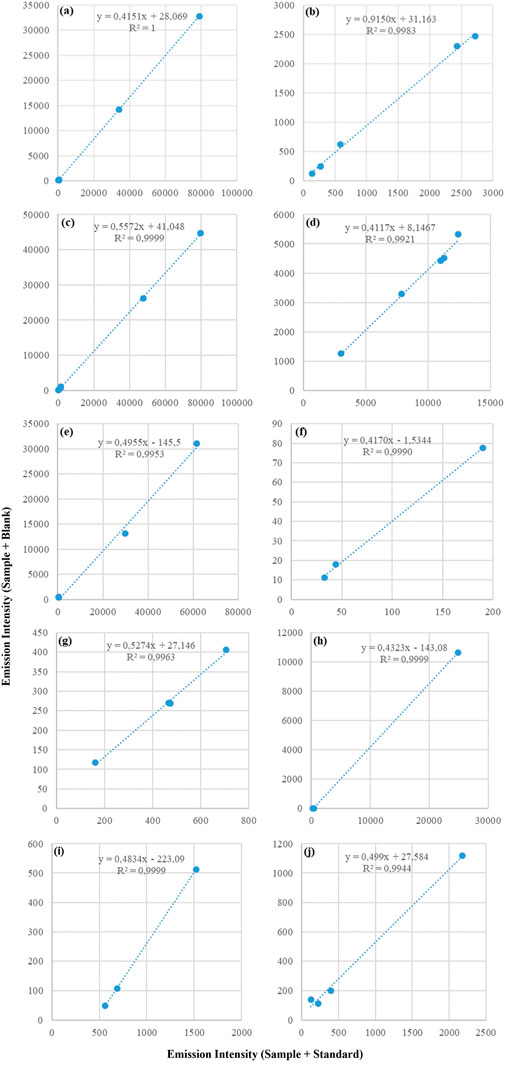
Figure 3. Multi-energy calibration curves for (A) Ca, (B) Co, (C) Cu, (D) Fe, (E) K, (F) Mg, (G) Mn, (H) Na, (I) P and (J) Zn determined in RM-Agro E3001a - Bovine Liver by MIP-OES.
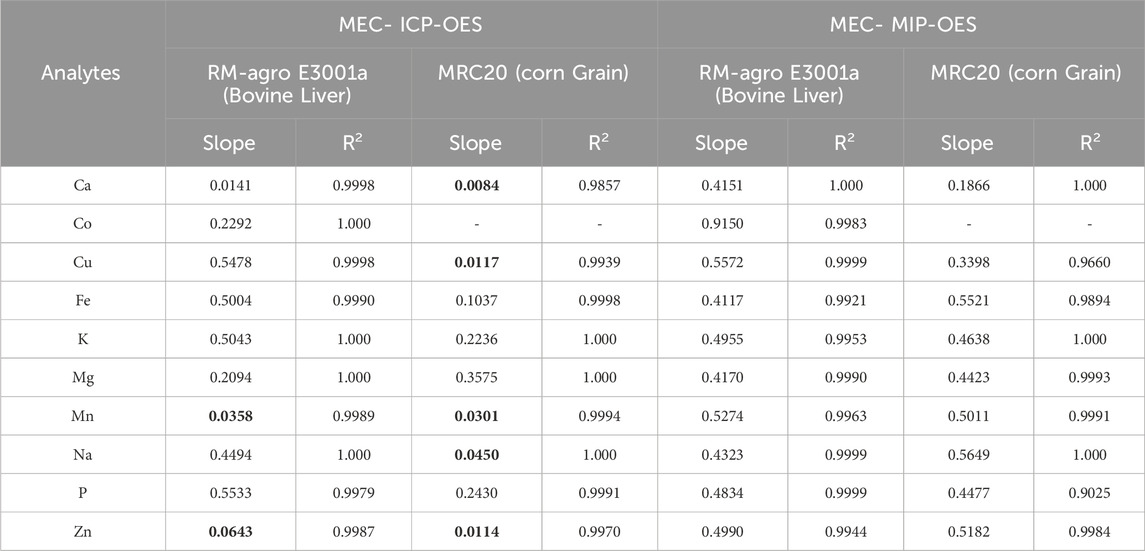
Table 2. Slopes and R2 values comparison for the 10 analytes analyzed across MEC-ICP-OES and MEC-MIP-OES techniques in RM-Agro E3001a - Bovine Liver and MRC20-Corn grain.
Slope values for ICP-OES falls outside the recommended range, particularly in bovine liver where it could be seen a lower range for Ca, Mn and Zn (between 0.0141 (Ca) and 0.0643 (Zn)), while for Co, Cu, Fe, K, Mg, Na and P the range was 0.2292 (Co) and 0.5533 (P); in the case of maize 0.0084 (Ca) and 0.045 (Na) for Ca, Cu, Mn, Na and Zn, while for Fe, K, Mg and P the range was 0.1037 (Fe) and 0.243 (P). MIP-OES has slope values in the range between 0.4117 (Fe) and 0.5572 (Cu) and Co showing a value close to 0.9150, for bovine liver (Table 2). Whereas for corn grains, the lowest slope corresponds to Ca (0.1866) and the highest to Na (0.5649). According to Santos et al. and Virgilio et al., this discrepancy in slopes could be due to an imbalance between the analyte concentrations in the calibration solutions (C_std) and the sample (C_sam) (Santos et al., 2024; Virgilio et al., 2020). This mismatch between the standard and sample concentrations can lead to slope values outside the ideal range. Therefore, adjusting the concentrations of the calibration solutions to be closer to those of the sample, would help to better align the slopes with the optimal range (Santos et al., 2024). As was discussed above, some ICP-OES calibration slopes fall outside the recommended range; however, MEC still maintains high recovery rates (Table 3), demonstrating that it can handle non-ideal slope values while preserving accuracy. To assess the concentration mismatch in the reference material, a proficiency test material, “Animal Mineral Supplements” (SM18-03), was analyzed. As shown in Supplementary Table S3 and Supplementary Figure S3, the slopes for elements Ca, Co, Cu, Fe, K, Mg, Mn, Na, P, and Zn ranged from 0.2221 (P) to 0.9907 (Ca). Thus, it is evident that the use of multiple wavelengths for calibration compensates for spectral and matrix interferences.
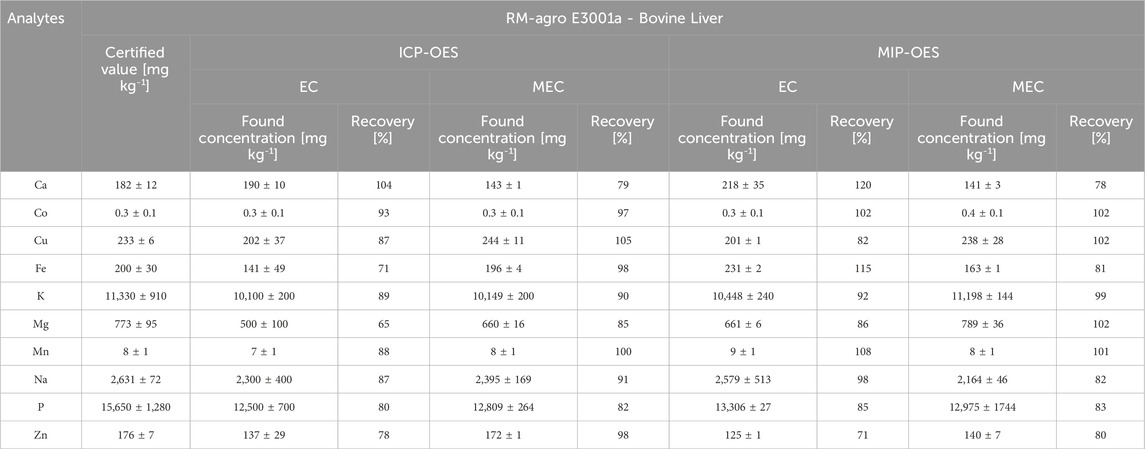
Table 3. Comparative concentration results (mean ± confidence interval; n = 3 replicates) and recovery percentages (%) for the determination of Ca, Co, Cu, Fe, K, Mg, Mn, Na, P, and Zn (mg kg⁻1) in the reference material RM-Agro E3001a - Bovine Liver, using EC and MEC calibrations with ICP-OES and MIP-OES.
3.2 MEC vs. EC recoveries
The traditional EC and MEC methods accuracy was evaluated by analysis of the reference material RM-Agro E3001a (Bovine Liver). The concentrations of Ca, Co, Cu, Fe, K, Mg, Mn, Na, P, and Zn determined using EC by ICP-OES and MIP-OES; and MEC by ICP-OES and MIP-OES are presented in Table 3. The concentrations for MEC were calculated according to Section 2.5; Equation 1. For ICP-OES analysis, recoveries ranged from 80% to 104% for EC (Fe, Mg, and Zn did not reach 80% recovery), and from 82% to 105% for MEC. For MIP-OES, recoveries ranged from 82% to 120% for EC (Zn did not reach 80% recovery), and from 80% to 102% for MEC. In both MEC-ICP-OES and MEC-MIP-OES, Ca recoveries are nearly identical, approaching 80%. As could be seen, MEC showed similar recovery improvements in both ICP-OES and MIP-OES, with quantitative recoveries, indicating that it provides a reliable calibration for both plasma techniques. Although concentration imbalance can influence the slope, MEC, however, is less dependent on slope values because it relies on multiple calibration points derived from different energy transitions. This means that even if the slope is slightly outside range (0.1–0.9), MEC can still produce accurate results, as observed with elements like Ca, Cu, Mn, Na, and Zn. Quantitative recoveries indicate that MEC effectively mitigates matrix effects, which might otherwise skew results in complex samples like bovine liver. This is especially evident where MEC provides significantly better recoveries compared to EC (e.g., Zn in ICP-OES and MIP-OES). Additionally, Supplementary Table S4 compares analytes recoveries in reference material MRC20-Maize grain by ICP-OES and MIP-OES using MEC.
To continue comparing the results of MEC with EC calibration for ICP-OES and MIP-OES, key figures of merit such as LOD, LOQ, and precision (%Relative Standard Deviation (RSD)) were evaluated.
3.3 Analytical performance
LOD and LOQ calculated according to IUPAC guidelines may not be fully appropriated for the MEC calibration method, as they mainly consider deviations in blank measurements as the primary error source (Virgilio et al., 2020). In contrast, for multi-signal calibration methods like MEC, it is essential to incorporate errors arising from both the slope and the intercept, as multiple calibration plots are generated based on the number of replicates (Section 2.6; Equations 2, 3).
The analytical performance results are shown in Table 4. The developed procedure achieved LOQs ranging from 0.4 mg kg⁻1 for Co to 195 mg kg⁻1 for K by EC-ICP-OES and 0.09 mg kg⁻1 for Mn to 31 mg kg⁻1 for Ca and Na by MEC-ICP-OES; and 2.0 mg kg⁻1 for Mg to 607 mg kg⁻1 for Fe by EC-MIP-OES and 0.08 mg kg⁻1 for Mn to 354 mg kg⁻1 for P by MEC-MIP-OES. Consistently with Alencar et al. and Gonçalvez et al. MEC can often yield LODs an order of magnitude lower than EC calibration (Alencar et al., 2019; Gonçalves et al., 2019). As it could be seen in Table 4, MEC achieves lower LOQs compared to EC, except for Co and Na in MIP-OES, and for Co in ICP-OES; while Cu, Na and Zn have the same order of magnitude in ICP. This is primarily because MEC can leverage multiple wavelengths (or energy levels) for calibration, increasing signal-to-noise ratios and enhancing sensitivity. In contrast, EC relies on single wavelengths for each analyte, which may limit sensitivity. EC methods could suffer from higher background noise in complex matrices, making LOQs typically higher than those observed with MEC, especially in the lower plasma temperature, where reductions of up to two orders of magnitude can be observed in MIP-OES (Ca, Cu, Fe, Mg, and Mn) (Alencar et al., 2019; Oliveira et al., 2018).
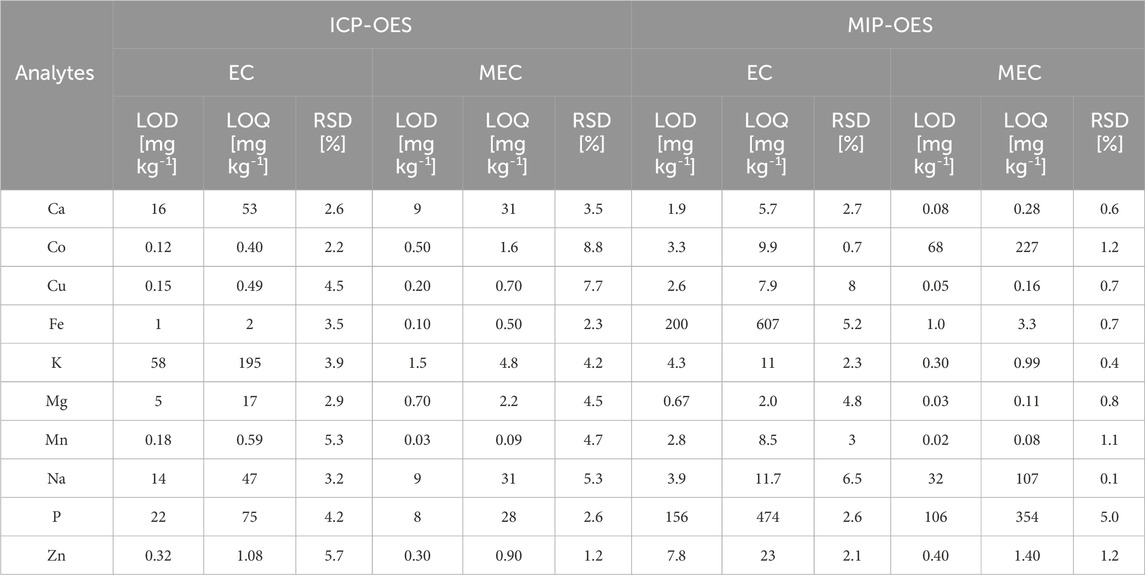
Table 4. Analytical figures of merits for EC and MEC, by ICP-OES and MIP-OES.
As shown in Table 5, the use of MEC as a methodology in this study resulted in exceptional LODs for several elements. The best LODs for Ca, Cu, K, and Mg were achieved in this work using MEC-MIP-OES, demonstrating its capability to enhance sensitivity for these elements. For Co, the LODs reported by Barros et al., 2019 for a urine matrix were lower than those obtained in this study, highlighting that matrix effects can influence LODs even when using advanced calibration methods like MEC.
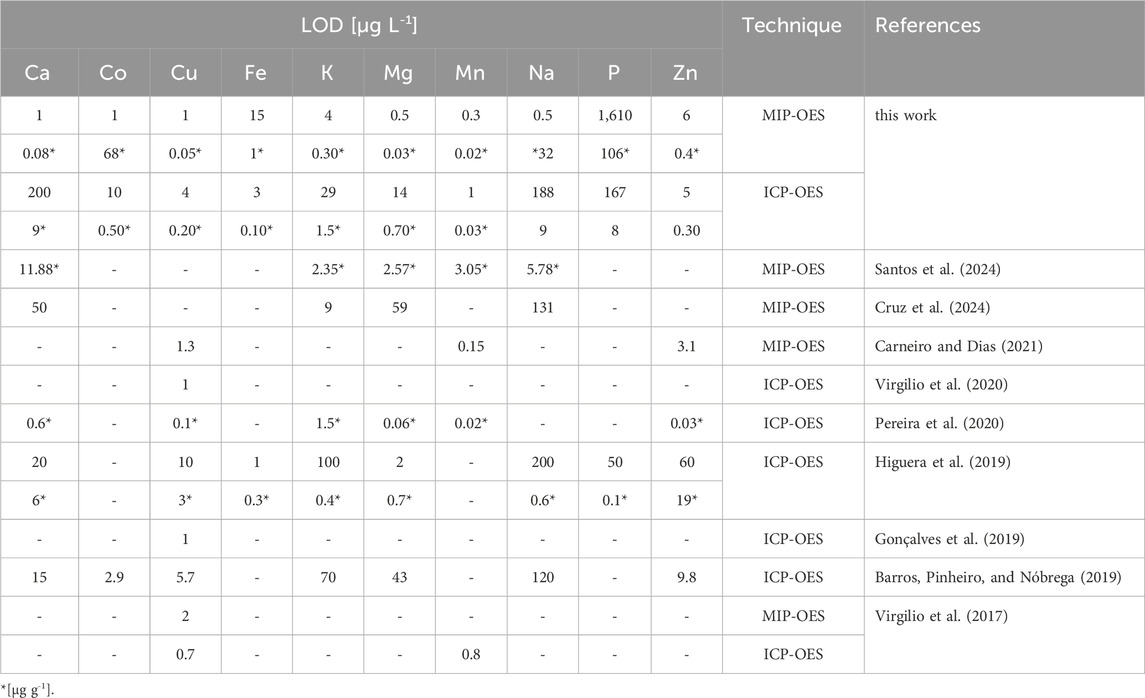
Table 5. Comparison of LODs achieved with MEC using ICP-OES and MIP-OES.
The LODs for Cu obtained in this study are consistent with those reported in the literature, falling within the same order of magnitude, showcasing MEC’s reliability in achieving comparable performance. For Fe, while Higuera et al., 2019 reported the lowest LODs in μg L⁻1 for a meat matrix using ICP-OES, the best LODs expressed in μg g⁻1 were obtained in this study when MEC-ICP-OES was employed, underscoring the robustness of MEC for solid sample matrices. Similarly, for Mn, the LODs achieved using both MEC-MIP-OES and MEC-ICP-OES are similar to those reported by Pereira et al., 2020, further supporting MEC’s effectiveness across techniques.
A particularly noteworthy result was observed for Na, where the MEC-MIP-OES methodology yielded LODs that were four orders of magnitude lower than those reported in other studies, demonstrating a significant improvement in sensitivity. In contrast, for P, the LODs obtained using MEC in this study were four (ICP-OES) and five (MIP-OES) orders of magnitude higher than those reported by Higuera et al., 2019, suggesting potential challenges in achieving optimal sensitivity for this element under the tested conditions.
Finally, for Zn, the LODs achieved in this study are of the same order of magnitude as those reported by Carneiro and Dias 2021 for MIP-OES and Barros et al., 2019 for ICP-OES, with the best sensitivity observed in Carneiro and Dias’ study. These findings highlight MEC’s significant advantages in improving sensitivity and addressing matrix effects while indicating opportunities for refinement in certain cases. Overall, MEC demonstrates its utility as a powerful calibration strategy for improving the detection of multiple elements in complex matrices.
In all cases, the MEC precision, expressed as %RSD, was better than 8.8% in ICP-OES and 1.2% in MIP-OES. For ICP-OES, only Fe, Mn, P and Zn exhibited lower RSD in MEC compared to EC. MEC-MIP-OES consistently demonstrated lower RSD for all analytes, indicating more precise measurements.
MEC demonstrated enhanced accuracy over EC, largely due to its matrix-matching capabilities, which provided higher trueness and precision. Analytes such as Co, Fe, Na, and P are more effectively determined by MEC-ICP-OES, while Ca, Cu, K, and Mg are better suited to MEC-MIP-OES, but both instrumental techniques led to accurate results for all analytes. Manganese and Zn show comparable performance with both methods.
3.4 Analytical application for animal feed quality assurance
The MEC method was applied to analyze animal feed samples and assess the mineral nutritional composition of the feed. This data is essential for formulating balanced rations and could directly influence pig growth.
The excesses or deficiencies of minerals such as Ca, Co, Cu, Fe, K, Mg, Mn, Na, P, and Zn can lead to nutritional imbalances in swine, affecting their health and productivity (McDowell, 1992; Patience, 1996; Fabà et al., 2019). To address this, the developed MEC-ICP-OES and MEC-MIP-OES procedure was applied to determine these essential mineral nutrients in pig feed samples (Figure 4).
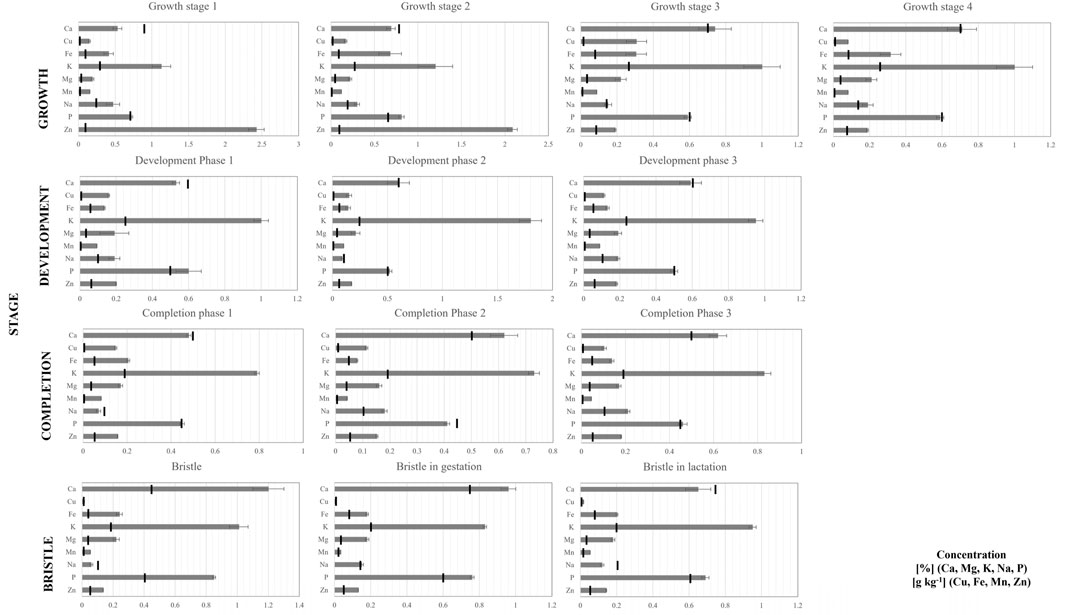
Figure 4. Determination of Ca, Co, Cu, Fe, K, Mg, Mn, Na, P, and Zn by MEC-MIP-OES and MEC-ICP-OES in different categories of animal feed samples. Results are reported as mean ± confidence interval (n = 3). Dietary mineral requirements for growing pigs, gestating sows, and lactating sows, as specified by National Research Council (2011), are indicated by a black line in the graph for reference.
The mineral concentrations obtained were then compared to the dietary mineral requirements for different physiological stages of swine (marked by a black line in Figure 4), including growing pigs, gestating sows, and lactating sows, as defined by the Nutrient Requirements of Swine (National Research Council, 2012) (Figure 4). The comparison revealed that most physiological stage samples did not meet the required nutritional levels exceeding the recommended values. However, certain minerals, such as Ca, Na, and P, in a few samples were nearly aligned with NRC guidelines. Given the variability in nutrient requirements based on numerous factors, it is essential for feed suppliers to enhance their ability to accurately define and evaluate feed ingredients. This necessitates continuous reevaluation of feed formulations to ensure they meet the minimum nutritional requirements for animals. Increased emphasis on quality control is critical to ensure accurate feed formulations for supporting optimal growth and health in swine.
3.5 Conclusion
MEC strategy has demonstrated robust and consistent performance for ICP-OES and MIP-OES. The results confirm that MEC is an effective calibration method for rapid, accurate multielement analysis with optical plasma techniques, reliably quantifying essential elements like Ca, Co, Cu, Fe, K, Mg, Mn, Na, P, and Zn with accurate recoveries.
This approach excels at matrix-matching in complex samples, such as biological tissues and animal feeds, offering a flexible solution that does not require instrument modifications. For laboratories already using ICP-OES or MIP-OES, MEC is an easy-to-implement enhancement to the existing instrument, reducing the need for labor-intensive matrix-matching standards and improving calibration efficiency. By optimizing the calibration process, MEC can significantly increase sample throughput and reduce analysis time.
While MEC presents clear advantages for multielement determination, some challenges remain. For instance, all calculations could be easier performed if proper data treatment was implemented in the built-in software that controls modern instruments. As an additional bonus, emission lines affected by interferences are easily spotted in the analytical calibration curve because they do not follow the expected linear response with analyte concentration. In this sense, if analytical chemistry can be seen as a science to generate chemical information about samples, MEC is a powerful ally because it allows bettering exploiting multiple analytical signals typically obtained when applying instrumental analysis.
In the context of nutritional research, such as in animal feed analysis, MEC can support improved efficiency in swine production by enabling precise mineral analysis. This is highly beneficial for producers, as reliable analytical data allow for precise feed formulation, leading to cost savings and optimized nutrition. Quality control in agri-foods, facilitated by MEC, is thus essential for ensuring that feed formulations meet nutritional standards, ultimately benefiting both suppliers and producers.
Data availability statement
The original contributions presented in the study are included in the article/Supplementary Material, further inquiries can be directed to the corresponding author.
Author contributions
FC: Conceptualization, Investigation, Validation, Writing–original draft, Writing–review and editing, Data curation, Formal Analysis. AB: Writing–review and editing, Methodology, Supervision. JN: Supervision, Writing–review and editing, Funding acquisition. MS: Supervision, Writing–review and editing, Conceptualization, Investigation, Validation, Writing–original draft.
Funding
The author(s) declare that financial support was received for the research, authorship, and/or publication of this article. This work was financially supported by the Special fund for Universidad Nacional de La Pampa. This study was financed in part by Conselho Nacional de Desenvolvimento Científico e Tecnológico (CNPq – grants 303107/2013-8, 307452/2023-9 and 428558/2018-6); Coordenação de Aperfeiçoamento de Pessoal de Nível Superior Brasil (CAPES) – Finance Code 001; Instituto Nacional de Ciências e Tecnologias Analíticas Avançadas – CNPq, Grant No. 573894/2008-6 and FAPESP and Grant No. 2014/50951-4.
Acknowledgments
The authors are grateful to the Consejo Nacional de Investigaciones Cientifícas y Tećnicas (CONICET), Agencia Nacional de Promoción Cientifíca y Tecnológica (ANPCYT) and Universidad Nacional de La Pampa; Conselho Nacional de Desenvolvimento Científico e Tecnológico (CNPq), and Coordenação de Aperfeiçoamento de Pessoal de Nível Superior (CAPES/PNPD – Graduate Program in Chemistry, Federal University of São Carlos). We also acknowledge the technical support provided by Analítica (São Paulo, SP, Brazil), Milestone (Sorisole, BG, Italy) and Thermo Scientific. The authors also would like to express their gratitude to the Instituto Nacional de Ciências e Tecnologias Analíticas Avançadas (INCTAA), Instituto Nacional de Tecnología Agropecuaria (INTA) and to swines’ producers that kindly provided samples.
Conflict of interest
The authors declare that the research was conducted in the absence of any commercial or financial relationships that could be construed as a potential conflict of interest.
Generative AI statement
The author(s) declare that no Generative AI was used in the creation of this manuscript.
Publisher’s note
All claims expressed in this article are solely those of the authors and do not necessarily represent those of their affiliated organizations, or those of the publisher, the editors and the reviewers. Any product that may be evaluated in this article, or claim that may be made by its manufacturer, is not guaranteed or endorsed by the publisher.
Supplementary material
The Supplementary Material for this article can be found online at: https://www.frontiersin.org/articles/10.3389/frans.2025.1527110/full#supplementary-material
References
Alencar, M. C., Gonçalves, D. A., Nicolodelli, G., Oliveira, S. L., Donati, G. L., and Caires, A. R. L. (2019). Evaluating the applicability of multi-energy calibration as an alternative method for quantitative molecular spectroscopy analysis. Spectrochimica Acta - Part A Mol. Biomol. Spectrosc. 221 (October), 117221. doi:10.1016/j.saa.2019.117221
Augusto, A., Castro, J., Sperança, M., and Pereira, E. (2018). Combination of multi-energy calibration (MEC) and laser-induced breakdown spectroscopy (LIBS) for dietary supplements analysis and determination of Ca, Mg and K. J. Braz. Chem. Soc. doi:10.21577/0103-5053.20180211
Analytical Methods Committee (2013). “What Causes most errors in chemical analysis?”. Anal. Methods 5 (12), 2914–2915. doi:10.1039/C3AY90035E
Babos, D. V., Barros, A. I., Nóbrega, J. A., and Pereira-Filho, E. R. (2019). Calibration strategies to overcome matrix effects in laser-induced breakdown spectroscopy: direct calcium and phosphorus determination in solid mineral supplements. Spectrochim. Acta Part B At. Spectrosc. 155 (1), 90–98. doi:10.1016/j.sab.2019.03.010
Babos, D. V., Virgilio, A., Costa, V. C., Donati, G. L., and Pereira-Filho, E. R. (2018). Multi-energy calibration (MEC) applied to laser-induced breakdown spectroscopy (LIBS). J. Anal. Atomic Spectrom. 33 (10), 1753–1762. doi:10.1039/C8JA00109J
Barros, A. I., Pinheiro, F. C., and Nóbrega, J. A. (2019). Calibration strategies to correct for matrix effects in direct analysis of urine by ICP OES: internal standardization and multi-energy calibration. Anal. Methods 11 (27), 3401–3409. doi:10.1039/C9AY00907H
Beily, M. E., Brunori, J., Campagna, D. A., Cottura, G., Crespo, D., and Denegri, G. D. (2011). “Buenas Prácticas Pecuarias (BPP) para la producción y comercialización porcina familiar,” in Instituto Nacional de Tecnología Agropecuaria; Organización de las Naciones Unidas para la Agricultura y la Alimentación 277. Available at: https://www.fao.org/3/i2094s/i2094s.pdf.
Carneiro, C. N., and Dias, F. de S. (2021). Multiple response optimization of ultrasound-assisted procedure for multi-element determination in Brazilian wine samples by microwave-induced plasma optical emission spectrometry. Microchem. J. 171 (December), 106857. doi:10.1016/j.microc.2021.106857
Carter, J. A., Barros, A. I., Nóbrega, J. A., and Donati, G. L. (2018). Traditional calibration methods in atomic spectrometry and new calibration strategies for inductively coupled plasma mass spectrometry. Front. Chem. 6 (November), 504. doi:10.3389/fchem.2018.00504
Carvalho, A. A. C., Cozer, L. A., Luz, M. S., Nunes, L. C., Rocha, F. R. P., and Nomura, C. S. (2019). Multi-energy calibration and sample fusion as alternatives for quantitative analysis of high silicon content samples by laser-induced breakdown spectrometry. J. Anal. Atomic Spectrom. 34 (8), 1701–1707. doi:10.1039/C9JA00149B
Castro, J. P., Babos, D. V., and Pereira-Filho, E. R. (2020). Calibration strategies for the direct determination of rare Earth elements in hard disk magnets using laser-induced breakdown spectroscopy. Talanta 208 (February), 120443. doi:10.1016/j.talanta.2019.120443
Cruz, E., Lizeth, T., Guerrero Esperanza, M., Wrobel, K., Yanez Barrientos, E., Aguilar, F. J. A., et al. (2020). Determination of major and minor elements in Mexican red wines by microwave-induced plasma optical emission spectrometry, evaluating different calibration methods and exploring potential of the obtained data in the assessment of wine provenance. Spectrochim. Acta Part B At. Spectrosc. 164 (February), 105754. doi:10.1016/j.sab.2019.105754
Cruz, E., Lizeth, T., Wrobel, K., Barrientos, E. Y., Escobosa, A. R. C., Garay-Sevilla, Ma E., et al. (2024). Determination of sodium, potassium, calcium and magnesium in urine, using microwave plasma - atomic emission spectrometry and multi-energy calibration. J. Mexican Chem. Soc. 68 (1), 18–28. doi:10.29356/jmcs.v68i1.1906
Donati, G. L., and Amais, R. S. (2019). Fundamentals and new approaches to calibration in atomic spectrometry. J. Anal. Atomic Spectrom. 34 (12), 2353–2369. doi:10.1039/C9JA00273A
Fabà, L., Gasa, J., Tokach, M. D., Font-i-Furnols, M., Vilarrasa, E., and Solà-Oriol, D. (2019). Effects of additional organic micro-minerals and methionine on carcass composition, gait score, bone characteristics, and osteochondrosis in replacement gilts of different growth rate. Animal Feed Sci. Technol. 256 (September), 114262. doi:10.1016/j.anifeedsci.2019.114262
Fortunato, F. M., Catelani, T. A., Pomares-Alfonso, M. S., and Pereira-Filho, E. R. (2019). Application of multi-energy calibration for determination of chromium and nickel in nickeliferous ores by laser-induced breakdown spectroscopy. Anal. Sci. 35 (2), 165–168. doi:10.2116/analsci.18P286
Garde, R., Nakadi, F. V., García-Ruiz, E., and Resano, M. (2020). Introducing multi-energy ratios as an alternative to multi-energy calibration for Br determination via high-resolution continuum source graphite furnace molecular absorption spectrometry. A case study. J. Anal. Atomic Spectrom. 35 (11), 2606–2619. doi:10.1039/D0JA00359J
Gonçalves, D. A., Domingos de Souza, I., Rosa, A. C. G., Melo, E. S. P., Goncalves, A. M. B., de Oliveira, L. C. S., et al. (2019). Multi-wavelength calibration: determination of trace toxic elements in medicine plants by ICP OES. Microchem. J. 146 (May), 381–386. doi:10.1016/j.microc.2019.01.021
Higuera, J. M., Silva, A. B. S., and Nogueira, A. R. A. (2019). Multi-energy calibration: a practical method for determination of macro and micro nutrients in meat by ICP OES. J. Braz. Chem. Soc. 30 (12), 2575–2581. doi:10.21577/0103-5053.20190171
Jofre, C., Florencia, D. N. L., and Savio, M. (2020). An eco-friendly infrared method for rapid soil sample preparation for multielemental determination by microwave induced plasma atomic emission spectrometry. Microchem. J. 159 (December), 105448. doi:10.1016/j.microc.2020.105448
Jofre, F. C., and Savio, M. (2024). Infrared radiation: a sustainable and promising sample preparation alternative for inorganic analysis. TrAC Trends Anal. Chem. 170 (1), 117469. doi:10.1016/j.trac.2023.117469
Li, X., Zhao, T., Zhong, Q., Nie, S., Xiao, H., Zhao, S., et al. (2020). Iterative multi-energy calibration and its application in online alloy smelting process monitoring using laser-induced breakdown spectroscopy. J. Anal. Atomic Spectrom. 35 (10), 2171–2178. doi:10.1039/D0JA00247J
Machado, R. C., Silva, A. B. S., Donati, G. L., and Nogueira, A. R. A. (2018). Multi-energy calibration as a strategy for elemental analysis of fertilizers by microwave-induced plasma optical emission spectrometry. J. Anal. Atomic Spectrom. 33 (7), 1168–1172. doi:10.1039/c8ja00077h
Matusiewicz, H. (2017). Sample preparation for inorganic trace element analysis. Phys. Sci. Rev. 2 (5). doi:10.1515/psr-2017-8001
McDowell, L. R. (1992). Minerals in animal and human nutrition: comparative aspects to human nutrition animal feeding and nutrition. Elsevier Science.
Nóbrega, J. A., Pirola, C., Fialho, L. L., Rota, G., de Campos Jordão, C. E. K. M. A., and Pollo, F. (2012). Microwave-assisted digestion of organic samples: how simple can it become? Talanta 98 (August), 272–276. doi:10.1016/j.talanta.2012.06.079
National Research Council (2012). Nutrient requirements of Swine: Eleventh revised edition. Washington, DC: The National Academies Press. doi:10.17226/13298
Novo, D. L. R., Pereira, R. M., Costa, V. C., Hartwig, C. A., and Mesko, M. F. (2018). A novel and eco-friendly analytical method for phosphorus and sulfur determination in animal feed. Food Chem. 246 (April), 422–427. doi:10.1016/j.foodchem.2017.11.036
Oliveira, A. F., Gonzalez, M. H., and Nogueira, A. R. A. (2018). Use of multiple lines for improving accuracy, minimizing systematic errors from spectral interferences, and reducing matrix effects in MIP OES measurements. Microchem. J. 143 (December), 326–330. doi:10.1016/j.microc.2018.08.032
Patience, J. F. (1996). Precision in swine feeding programs: an integrated approach. Animal Feed Sci. Technol. 59 (1–3), 137–145. doi:10.1016/0377-8401(95)00894-2
Pereira, H. S., Nogueira da Silva, K. R., Melo, E. S. de P., Aragão do Nascimento, V., and Raposo, J. L. (2020). Multi-energy calibration: an easy strategy for fast and accurate determination of macro- and micro-nutrients in biomass waste samples by ICP OES. J. Anal. Atomic Spectrom. 35 (8), 1558–1565. doi:10.1039/D0JA00189A
Santos, T. S., Arruda dos Santos, E., Victor Soares de Araújo, J., Jadán-Piedra, C., Jorgensen Cassella, R., Duyck, C., et al. (2024). Multi-energy calibration and induced plasma optical emission spectrometry (MEC-MIP OES) as an alternative method for the multi-elemental determination of essential elements in cocoa. J. Food Compos. Analysis 136 (1), 106798. doi:10.1016/j.jfca.2024.106798
Savio, M., Fialho, L. L., and Nóbrega, J. A. (2019). Greening microwave-assisted acid digestion of animal feed samples. Anal. Methods 11 (46), 5857–5863. doi:10.1039/C9AY01586H
SDGs (2024). Sustainable development Goals. Available at: https://www.Un.Org/Sustainabledevelopment/.
Shurson, G. C., Salzer, T. M., Koehler, D. D., and Whitney, M. H. (2011). Effect of metal specific amino acid complexes and inorganic trace minerals on vitamin stability in premixes. Animal Feed Sci. Technol. 163 (2–4), 200–206. doi:10.1016/j.anifeedsci.2010.11.001
Soares, S., Donati, G. L., and Rocha, F. R. P. (2022). Digital-image photometry with multi-energy calibration. Microchem. J. 182 (November), 107938. doi:10.1016/j.microc.2022.107938
Solà-Oriol, D., and Gasa, J. (2017). Feeding strategies in pig production: sows and their piglets. Animal Feed Sci. Technol. 233 (November), 34–52. doi:10.1016/j.anifeedsci.2016.07.018
Spears, J. W., and Weiss, W. P. (2008). Role of antioxidants and trace elements in health and immunity of transition dairy cows. Veterinary J. 176 (1), 70–76. doi:10.1016/j.tvjl.2007.12.015
Vieira, A. L., Gonçalves, D. A., Virgilio, A., Ferreira, E. C., Jones, B. T., Donati, G. L., et al. (2019). Multi-energy calibration for the determination of non-metals by high-resolution continuum source molecular absorption spectrometry. J. Anal. Atomic Spectrom. 34 (5), 972–978. doi:10.1039/C9JA00006B
Virgilio, A., Gonçalves, D. A., McSweeney, T., Gomes Neto, J. A., Nóbrega, J. A., and Donati, G. L. (2017). Multi-energy calibration applied to atomic spectrometry. Anal. Chim. Acta 982 (August), 31–36. doi:10.1016/j.aca.2017.06.040
Keywords: multi-energy calibration, animal feed, multielemental determination, ICP-OES, MIP-OES
Citation: Cora Jofre F, Barros AI, Nóbrega JA and Savio M (2025) Multi-energy calibration in plasma emission spectrometry: elemental analysis of animal feeds. Front. Anal. Sci. 5:1527110. doi: 10.3389/frans.2025.1527110
Received: 12 November 2024; Accepted: 03 February 2025;
Published: 27 February 2025.
Edited by:
Elefteria Psillakis, Technical University of Crete, GreeceReviewed by:
Alessandra Cincinelli, University of Florence, ItalyAshok K. Shakya, Al-Ahliyya Amman University, Jordan
Copyright © 2025 Cora Jofre, Barros, Nóbrega and Savio. This is an open-access article distributed under the terms of the Creative Commons Attribution License (CC BY). The use, distribution or reproduction in other forums is permitted, provided the original author(s) and the copyright owner(s) are credited and that the original publication in this journal is cited, in accordance with accepted academic practice. No use, distribution or reproduction is permitted which does not comply with these terms.
*Correspondence: Marianela Savio, bXNhdmlvQGV4YWN0YXMudW5scGFtLmVkdS5hcg==