 Mohammad Ebrahim Hasan-Nejad1
 Amir Mohammadi-Nejad
- 1Department of Agricultural Economics, SR.C., Islamic Azad University, Tehran, Iran
- 2Center for Remote Sensing and GIS Research, Faculty of Earth Sciences, Shahid Beheshti University, Tehran, Iran
Introduction: Broiler producers face various risks, leading to productivity and financial fluctuations worldwide. Agricultural insurance is an important risk management tool to stabilize income. Employing optimal insurance methods is crucial for effective production risk management.
Method: In this study, we used the panel method and spatial regression model to assess the impact of explanatory variables on the demand for poultry insurance. The explanatory variables included risk factors, the number of birds, loss cases, insurance premiums, and insurers' commitment to each insured chicken. The data for this study was obtained from the Agricultural Insurance Fund from 2010 to 2020 in Iran.
Results and Discussion: The results indicate that an increase in mortality rates, loss cases, and risk factors positively and significantly influences the volume of insured chickens. Furthermore, increasing the insurer's commitment to each chicken positively and substantially affects poultry insurance demand. Specifically, a 1% increase in the insurer's commitment for each chicken in a province corresponds to a 1.1% rise in the number of insured chickens. An examination of the overall long-term effects reveals that a 1% increase in the risk factor, the number of loss cases, and the insurer's commitment for each chicken in a province, leads to an average rise of 0.14%, 0.35%, and 1.2%, respectively, in the number of insured chickens within the same province. These findings highlight the importance of risk management strategies, such as agricultural insurance, in stabilizing the income of broiler producers. Policymakers and industry stakeholders should focus on strengthening the insurance system and increasing insurers' commitment to promoting the uptake of poultry insurance among producers.
Introduction
The agricultural sector faces a multitude of risks and uncertainties (Pakravan-Charvadeh and Flora, 2022). While risk in agriculture is inevitable, it is also manageable (Rashidi et al., 2024). Climate shocks and other natural diseases contribute to and perpetuate poverty and food insecurity in rural areas of the developing world, particularly affecting agricultural products (Carter et al., 2018). Agricultural insurance stands as a vital risk management tool within this sector (Wang et al., 2022). It serves as a protective mechanism, covering losses incurred by agricultural products, trees, livestock, poultry, bees, silkworms, and aquatic animals due to natural disasters like hailstorms, severe storms, hot monsoon climates, droughts, earthquakes, floods, frosts, fires, lightning strikes, as well as general and quarantine-related plant pests and diseases (Falco et al., 2014). Moreover, it encompasses general and quarantine-related animal infectious diseases, safeguarding structures, facilities, constructions, canals, agricultural water wells, and production components such as agricultural machinery, tools, and equipment (Pakravan-Charvadeh et al., 2020). Economic losses sustained by insured farmers during the breeding period or crop year are compensated up to the limits defined by the insurer (Sahraei et al., 2022).
In recent years, there has been a noticeable shift towards more flexible and comprehensive insurance products tailored to the specific needs of poultry farmers. This includes the introduction of parametric insurance, which provides payouts based on predefined triggers, such as adverse weather conditions or disease outbreaks, rather than traditional indemnity-based claims. Such innovations aim to address the increasing frequency and severity of risks associated with climate change and biosecurity threats. Moreover, the integration of technology in risk assessment and management has gained traction. Advances in data analytics and satellite monitoring allow insurers to better evaluate risks and set premiums based on real-time data, enhancing the accuracy of coverage and responsiveness to emerging threats. There is also a growing emphasis on collaboration between insurers and farmers to develop customized policies that reflect individual operational risks. This trend recognizes the diverse challenges faced by poultry producers in different regions and promotes a more tailored approach to insurance coverage.
The study utilizes spatial modeling and panel data analysis to investigate these relationships. Previous research in this domain has provided valuable insights. Previous research by Goodwin and Smith (2003) has shown that insurance program design significantly impacts farmers’ insurance decisions, a factor that aligns with our findings regarding insurer commitment. Carter et al. (2018) highlights the role of agricultural insurance in mitigating climate related food insecurity, which complements our emphasis on insurance as a risk management tool. A study revealed that environmental and management variables, as well as flock immunization against diseases and biological safety measures, significantly influence the ranking of poultry farms concerning the risk of casualties (Zaghari et al., 2016). Another study showed that the demand for agricultural insurance is multidimensional and dependent on insurance premiums, insurance premium subsidies, cultivation levels, farmers’ education levels, production risks, and religious considerations (Sihem, 2019). Also, some scholars contended that farmers with multiple income sources tended to substitute insurance for other forms of employment. They also highlighted that production risks influenced insurance decisions due to their moderate frequency and impact (Adjei et al., 2016). Another study noted that European risk management regulations confirmed the limitations of agricultural insurance in terms of usefulness and efficiency. Given the anticipation of increased severe weather patterns, the researchers stressed the need to explore innovative risk assessment models that can cater to the diverse needs of stakeholders, including farmers, insurance companies, and society (Capitanio and De Pin, 2018). Others revealed that family size, price, and participation type negatively influenced participation in agricultural insurance, whereas education, farming experience, premium period, and risk covered positively influenced participation (Bannor et al., 2023; Rashidi-Chegini et al., 2021).
While previous studies recognize the significance of agricultural insurance in stabilizing the income of broiler producers, there is a notable lack of comprehensive analysis regarding the various factors influencing the demand for poultry insurance, especially from a spatial and panel data perspective. Broiler farming and its related insurance markets often display considerable regional disparities and temporal fluctuations, which are crucial for optimizing risk management strategies. By addressing these gaps, this study enhances the existing literature on agricultural risk management and provides empirical evidence that can assist policymakers and industry stakeholders in developing more effective poultry insurance programs. Specifically, the study evaluates the impact of variables such as risk factors, loss cases, indemnity ratios, premiums, and insurer commitments on insurance demand, utilizing a decade’s worth of panel data from 31 Iranian provinces. So, the overarching objective of the present study is to assess the impact of explanatory variables, such as the risk factor, commitment per chicken, and the loss-to-insurance premium ratio, on the demand for poultry insurance.
Insurance background
While poultry includes various species such as chicken, turkey, goose, and duck worldwide, the first species that comes to mind in the poultry breeding sector is the chicken (Tuncel and Kara, 2022). The inception of poultry insurance in Iran dates back to 1994 when it initially covered commercial laying hens and broilers. However, the widespread adoption of insurance for broiler farms in the country commenced during the latter part of the 2000s. In 2005, a new risk factor, “elimination of the contaminated center,” was incorporated into the obligations of the Agricultural Insurance Fund following approval by the Islamic Council. Consequently, all poultry producers, including broilers, breeding, and laying hens, were mandated to ensure their one-day-old chicks from the start of production. This regulatory change led to substantial growth in insurance activity within the poultry sector. Agricultural insurance serves as a critical risk management tool, providing financial protection to farmers against a wide range of risks and uncertainties. The evolution of poultry insurance in Iran, particularly the inclusion of the “elimination of the contaminated center” risk factor, has played a significant role in expanding insurance coverage and enhancing the resilience of the poultry industry. An analysis of poultry insurance patterns in Iran reveals that since the inception of poultry insurance in 1994, the coverage has expanded to include a wider range of risk factors. These encompass natural risks, such as natural disasters, as well as management-related factors that can result in minor damages and even diseases in poultry, which can often be controlled through vaccination. However, the evolution of poultry insurance has also highlighted some inherent challenges. One issue is the proliferation of moral risks, where insured poultry farmers may be inclined to file claims for minor losses more frequently. This, in turn, has led to a gradual reduction in insurance commitments and an elevation in risk factors associated with poultry operations. In a pivotal development, the Iranian agricultural insurance system underwent methodological changes in 2016. These changes entailed the stratification of risk and covered risk factors, the elimination of particular layers of risk, and the exclusion of specific managerial risk factors from subsidized insurance. Furthermore, the evaluation method was transformed, culminating in the implementation of a more favorable plan, which was achieved through the collaborative efforts and support of poultry farmers and their respective organizations, such as the Agricultural Insurance Fund. These reforms were aimed at addressing the challenges posed by the proliferation of moral risks and the frequent compensation for minor losses. By restructuring the insurance coverage and evaluation methods, the goal was to strike a better balance between the interests of poultry farmers and the sustainability of the agricultural insurance system. The involvement of poultry farmer organizations in this process underscores the importance of stakeholder engagement in shaping the evolution of agrarian insurance policies.
The evolution of poultry insurance varies significantly across countries, shaped by distinct agricultural practices and regulatory environments. In the United States, poultry insurance has expanded through federally subsidized programs like multi-peril crop insurance, which addresses risks from disease outbreaks and natural disasters. Similarly, the European Union employs diverse insurance solutions under the Common Agricultural Policy (CAP), including innovative options like parametric insurance that triggers payouts based on specific events. Australia has developed comprehensive insurance schemes to manage biosecurity threats and climate challenges, while in developing countries like India and Brazil, the rapid growth of the poultry sector has led to government-backed programs that provide subsidized insurance for smallholders, addressing losses from disease and adverse weather.
Compared to prior Iranian and international studies, this research has the advantages of using comprehensive provincial time series data and examining a broader set of key insurance variables beyond just premiums, subsidies, and mandatory/optional policies. Based on the information presented in Table 1, the growth trend of insurance has significantly increased since 2015.
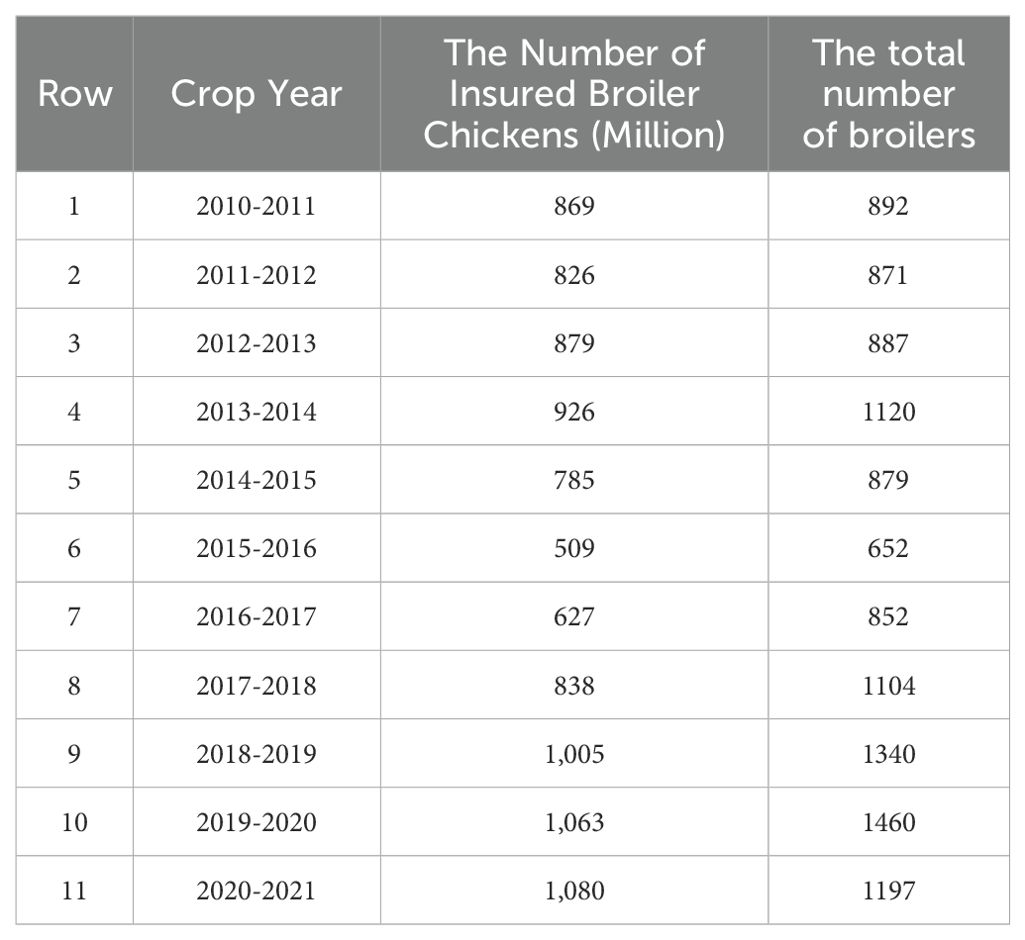
Table 1. The number of insured broiler chickens.
According to the findings from Figure 1, after the crop year 2016-2017, the commitment for each chicken exhibited a higher growth rate.
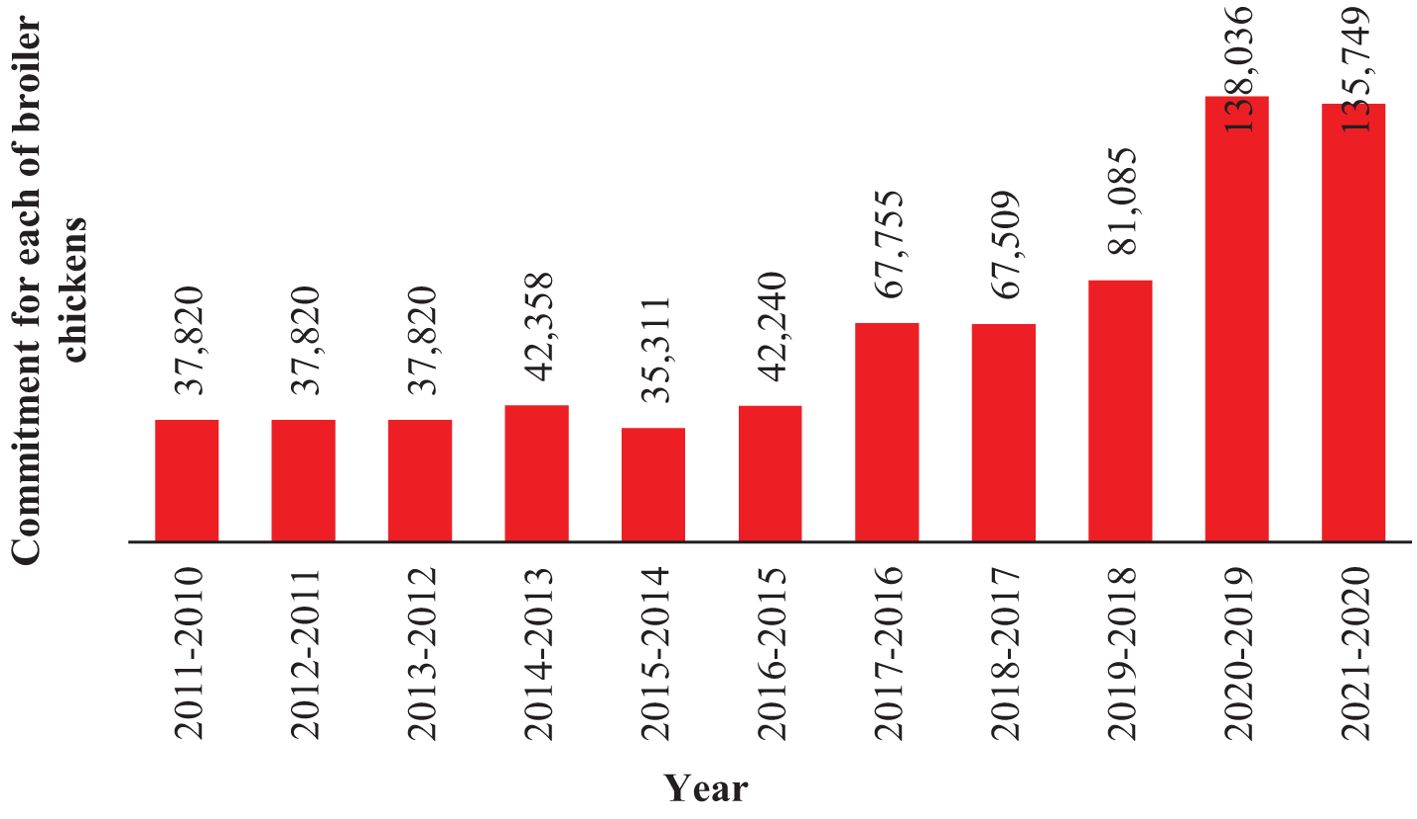
Figure 1. Commitment for each of broiler chickens.
Material and method
Data and information
The data for this study was sourced from the Agricultural Insurance Fund in Iran from 2010 to 2020 in Iran. The dataset includes information on the poultry insurance market across 31 Iranian provinces over these 10 years. The spatial panel data analysis technique was employed to investigate the impact of these explanatory variables on the demand for poultry insurance across the 31 Iranian provinces over the 2010–2020 period. This approach allowed the researchers to account for both the spatial dependencies and temporal dynamics in the data.
Spatial analysis
Spatial dependence models are commonly used in regional science and rural economics. In cross-sectional data, these models primarily focus on spatial interaction (spatial autocorrelation) and spatial structure (spatial heterogeneity) (Elhorst, 2014). The spatial panel modeling technique employed in this research is grounded in the methodological framework developed by Elhorst (2014), offering robust tools for analyzing regional dependencies in panel data. The inclusion of spatial econometric models is inspired by Anselin (1988), who pioneered the analysis of spatial dependencies in regional data. These models employ the metric of economic distance, resulting in cross-sectional data that resembles the time index in time series statistics (Anselin, 1988). With the growing use of macro and micro panel data, spatial panel data models have gained significant attention in empirical studies (Baltagi, 2005). Tuncel and Kara (2022) quantitatively assess profit determinants in broiler enterprises, supporting our approach to examining economic and insurance-related drivers of farm sustainability. The existence of spatial correlation and heterogeneity between sections can be expressed using the spatial error component regression model (Baltagi, 2005).
i=1…, N t=1…, T
In Equation 1, yti represents the observation related to the ith province for time t, Xti is the corresponding (k×1) vector of observations related to non-random estimators, and uti is the regression disturbance component. In vector graphics, it is assumed that the disturbance vector in the above relationship includes random regional effects and an error term that is spatially self-correlated (Sadat et al., 2023) (Equations 2, 3).
Where μ′= (μ1…, μN) is the vector of random country effects that has a standard, independent, and uniform distribution with zero mean and variance, and λ represents the spatial scalar autocorrelation coefficient with |λ|<1. W is the spatial weight matrix of N×N in which the diagonal elements are zero, meeting the expression’s non-singularity condition (IN-λW). Additionally, v′= (vt1…, vtN) has a standard, independent, and uniform distribution with zero mean and variance and is independent of μi. Equation 2 can be rewritten as follows (Equation 4):
Where B=IN-λw and IN represent the same matrix with dimension N. The matrix expression of the model (1) is as follows (Equation 5):
Where y has dimensions of NT×1, X has dimensions of NT×k, β has dimensions of k×1 and u have dimensions of NT×1. The vector form of Equation 2 can be rewritten as follows (Equation 6):
Where , and the symbol ⊗⊗ represents the Kronecker product in mathematics. According to these assumptions, the variance-covariance matrix for u is as Equation 7:
Where JT is the identity matrix with T dimension. The variance-covariance matrix can be rewritten as Equation 8:
Where, , and ET=IT- . Sentence∑-1 is as Equation 9:
Also, . According to the hypothesis of normality, the likelihood function for this model is as follows (Equation 10):
Where, u = y - Xβ. Since the maximum likelihood estimation has higher computational complexity, the Generalized Method of Moments (GMM) is often used as an alternative approach to maximum likelihood for estimating spatial cross-sectional models. This approach becomes more advantageous as the number of cross-sectional units (N) increases. Suppose the number of cross-sectional units (N) is large. In that case, the generalized method of moments becomes computationally feasible, and it can also be used for panel data models (when the time dimension T is constant and N tends to infinity). In this method, the regression model is similar to the form in Equation 5, but the disturbance term u follows a first-order spatial autoregressive process (Baltagi, 2005).
Equations 11, 12 are different from relations (1) and (2) because the regional effects μ in this specification can be spatially correlated. By definition , , and the generalized moments (GM) estimator is based on can be shown as Equation 13:
By substituting ϵ = u - λū and ϵ̄ = ū - λū̄ into the moment conditions, a system of six equations involving the second moments E [u, ū] and E [ū, ū̄] can be obtained. Under the presence of random effects, the ordinary least squares (OLS) estimator remains consistent (Baltagi, 2005). Initially, a panel linear regression model with specific spatial effects is considered as Equation 14, in which spatial interaction effects are ignored (Fischer and Getis, 2010).
Where i is an index for the cross-section dimension (spatial units), N,…, i =1, and t is an index for the time dimension (periods), T,…, t=1. yit is the observation related to the dependent variable for cross-section i at time t, Xit is a row vector K×1 of observations related to the independent variables, and β is a vector K×1 of the fixed unknown parameters (Fischer and Getis, 2010). The error term ϵit, independently and uniformly distributed for section i at time t, has a zero mean and variance σ2. The term μi represents the specific spatial effect. According to the usual argument, these spatial effects control all time-constant variables and are specific to space. Eliminating them can bias the estimates in a typical time series study (Fischer and Getis, 2010).
By specifying the relationship between cross-sectional units, the model can include lags of the dependent variable or a spatial autoregressive process in the error term, respectively known as spatial autoregressive model (SAR) and Spatial Error Model (SEM). In the spatial autoregressive model, it is assumed that the dependent variable is a function of the dependent variable in the neighboring units and a set of observed spatial characteristics which is shown in Equation 15:
Where δ is the spatial autoregressive coefficient, and Wij is an element of the spatial weight matrix, which explains the spatial order of the studied sample units. It is assumed that W is a pre-specified non-negative matrix of order N. The Spatial autoregressive model is a contractual specification for the equilibrium output of a spatial or social interactive process in which the Value of the dependent variable for an agent is determined with neighboring agents. On the other hand, the spatial error model assumes that the dependent variable is a function of the set of observed spatial features and a spatially auto-correlated error term (Fischer and Getis, 2010) which is shown in Equations 16, 17:
Φit represents the spatial autocorrelation error term, and ρ is the spatial autocorrelation coefficient. Specifying a spatial error model does not require a theoretical framework for the underlying social or spatial interaction process. This model represents a particular case of a non-spherical error covariance matrix. Additionally, this model is consistent with situations where unobservable shocks follow a spatial pattern (Fischer and Getis, 2010). The literature has proposed two main approaches to estimating spatial interactive effects models. One method is based on Maximum Likelihood (ML), and the other is based on instrumental variables or Generalized Methods of Moments (GMM). The key difference between the GMM estimator and the maximum likelihood estimator is that the GMM estimator does not rely on the assumption of normally distributed error terms. In both estimators, it is assumed that for all i’s and t’s, the error terms (ϵit) are independently and identically distributed with zero mean and constant variance σ2 (Fischer and Getis, 2010).
Variables
To achieve the main objective of the current study, we used some variables to investigate a special model. The key variables in the dataset are:
● Number of insured chickens: This represents the demand for poultry insurance, the dependent variable in the analysis.
● Risk factors: This variable captures the various risks faced by broiler farmers, such as natural disasters, disease outbreaks, and management-related factors.
● Loss cases: This variable quantifies the number of insurance claims or loss events experienced by the insured poultry farms.
● Insurance premiums: The premiums the insurers charges for poultry insurance coverage.
● Insurer’s commitment per chicken: The insurance coverage level or compensation provided for each insured chicken.
Results and discussion
Firstly, it is imperative to investigate the stationarity of the study variables. In macro panel data analysis, it is typically assumed that the number of cross-sectional units (N) and periods (T) both tend toward infinity. Consequently, the selection of an appropriate unit root test becomes necessary. In light of the asymptotic properties of the Levin-Lin-Chu (LLC) test, this study employs it to assess the stationarity of the variables. The outcomes are presented in Table 2. As per the results in Table 3, the null hypothesis, which suggests the presence of a unit root, is rejected, confirming the stationarity of the variables under consideration.

Table 2. Results of the LLC unit root test.
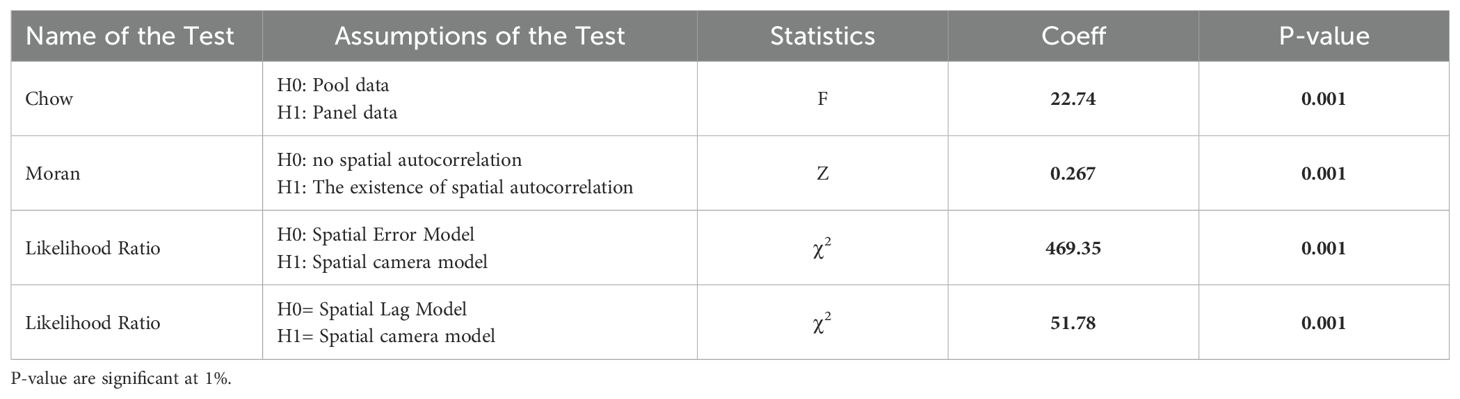
Table 3. Results of statistical tests.
After confirming the stationarity of the studied variables to facilitate panel data analysis, it is crucial to examine the spatial autocorrelation of the data. This process involves assessing the potential for reducing the spatial model to a non-spatial interval model and ascertaining the uncorrelatedness of the individual effects of the explanatory variables. For this purpose, a battery of tests, including the Chow test, Moran’s I test, Likelihood Ratio (LR) test, and Hausman test (presented in Table 3), were employed for the dependent variable. The Chow test evaluates whether the intercepts are the same across cross-sectional units (indicating the need for pooled data) or different (indicating the need for panel data). The F-statistic value in the tables leads to rejecting the null hypothesis, suggesting that panel data should be employed for estimation. The Moran’s I test, commonly used to evaluate spatial autocorrelation, tests the null hypothesis of no spatial autocorrelation. However, the test results reject this null hypothesis, revealing the presence of positive spatial autocorrelation in the data. The Likelihood Ratio (LR) test assesses the possibility of reducing the spatial model to either a spatial error or an autoregressive model. The null hypotheses for these tests are H0: γ+βδ=0 for the spatial error model and H0: γ=0 for the spatial autoregressive model. As indicated in the tables, the rejection of both null hypotheses implies that the spatial model is the appropriate specification for estimating the spatial patterns. Lastly, the Hausman test helps choose between fixed and random effects in the spatial panel data approach. It assesses the correlation between individual effects and explanatory variables. Fixed effects and random effects estimators are consistent if there is no correlation between the disturbance component and the explanatory variables. Conversely, if there is a correlation, the random effects estimator becomes inconsistent, while the fixed effects estimator remains consistent and efficient. The value of the Hausman statistic in the tables indicates that the null hypothesis of random effects can be rejected at a 5% significance level, suggesting that the fixed effects method is the preferred estimation approach.
In this analysis, we scrutinize the pattern associated with the dependent variable in Table 4 and then examine the results using statistical and theoretical criteria. In Table 5, a majority of the explanatory variables exhibit statistical significance. Notably, the logarithm of indemnity cases and the risk factor both have positive and statistically significant influences on the number of insured chickens. These findings suggest that when insurance companies incur higher losses and make larger indemnity payments, this leads to higher levels of insured chickens and heightened satisfaction among poultry farmers with the insurance policies. Furthermore, the positive and significant impact of the logarithm of the commitment per chicken on the number of insured chickens underscores that an increase in commitment per chicken tends to incentivize more poultry farmers to ensure their production units, thereby driving up the demand for insurance.
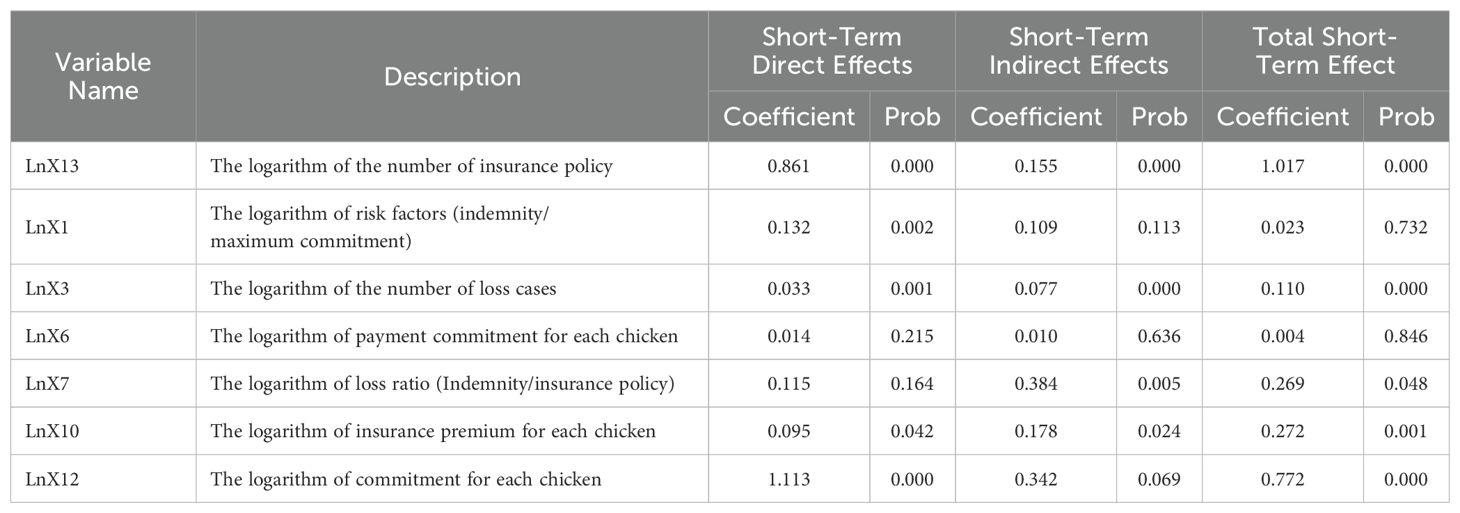
Table 4. The pattern of insured chicken quantities.
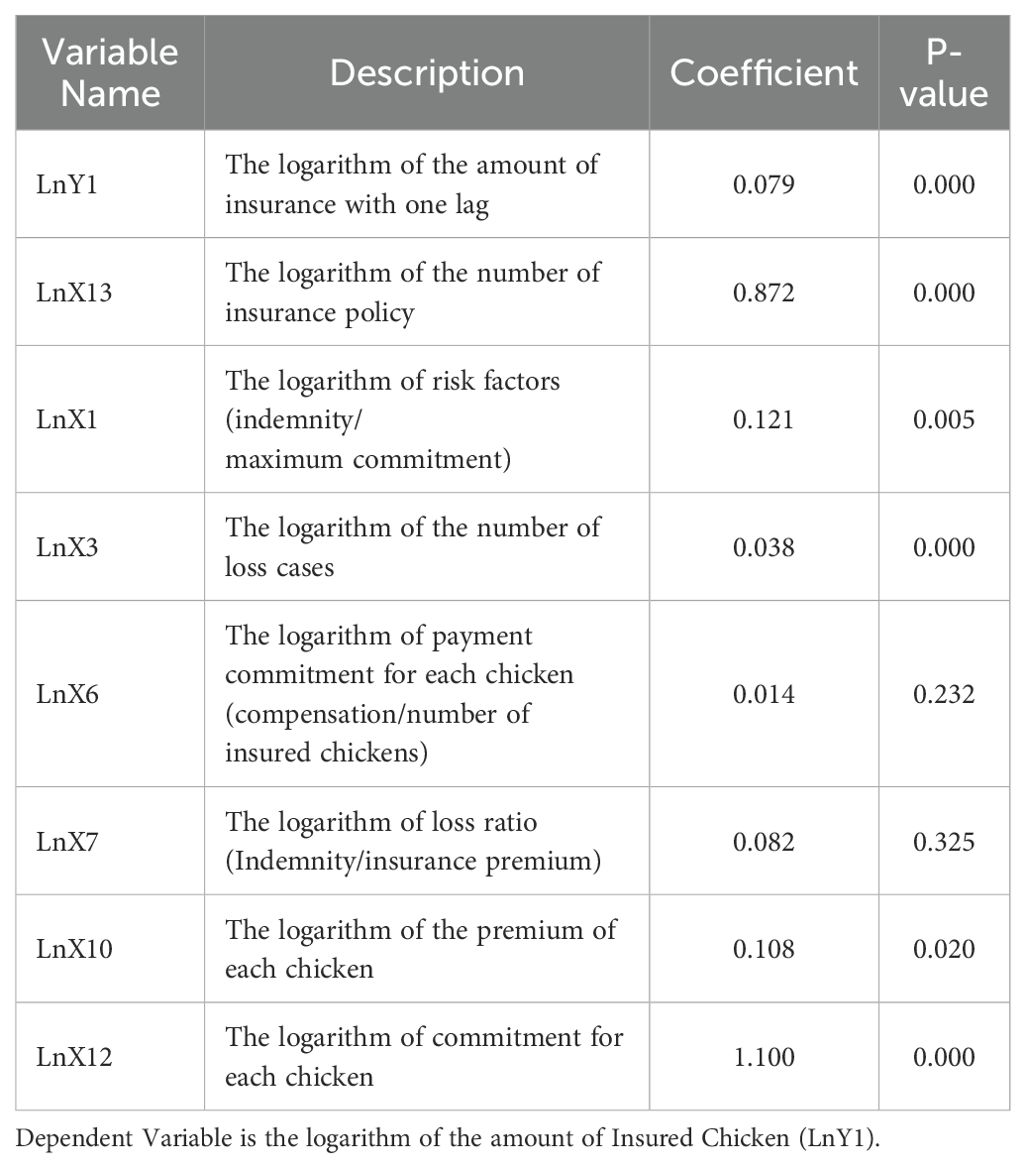
Table 5. Trends in the number of insured chickens.
As the risk factor rises, insurance premiums subsequently increase, affecting the average fair premiums. This finding aligns with a study, confirming this relationship (Pearcy and Smith, 2014). The practice of partial indemnity payments, along with the comprehensive coverage of all layers of risk, tends to amplify the risk factor. Consequently, this poses challenges to agricultural insurance concerning moral hazard control, necessitating an adjustment of insurance premiums and obligations, thus impacting overall insurance efficiency. Capitanio and De Pin (2018) have reported that producers are often reluctant to embrace insurance policies that do not yield an immediate benefit. Conversely, although the loss ratio positively impacts the number of insured chickens, it fails to achieve statistical significance. Similarly, the logarithm of the insurance premium per chicken, despite positively influencing the number of insured chickens, does not reach statistical significance. While it was expected that fluctuations in insurance premiums would significantly affect insurance demand, the government subsidizes a noteworthy portion of the premium, accounting for approximately 30% of the total insurance premium paid. Consequently, the actual insurance premium paid by poultry farmers is relatively insignificant, leading to an insignificant impact on insurance demand. Some scholars have reported that a fair insurance premium positively influences the acceptance of subsidized insurance (Du et al., 2017). Government subsidies in agricultural insurance have been shown to boost producer participation in insurance programs, as evidenced by the research conducted by other scholars (Ramirez and Shonkwiler, 2017). It is worth noting that commitment per chicken has exhibited a consistent upward trend during the years under review, significantly contributing to the increased quantity of insured chickens.
So far, we have discussed the statistical significance of the studied variables and their signs. The spatial regression model leverages the complex structure of spatial dependence among observations, specifically provinces, and its estimated parameters contain valuable information regarding the relationship between observations and regions. Therefore, any change in an explanatory variable related to a province affects not only the dependent variable in that province (direct effect) but also has an impact on other provinces (indirect effect). One of the distinctive characteristics of spatial regression models is their ability to measure these interactions, which is a crucial aspect of analyzing spatial econometric models. In other words, spatial econometrics excels in developing modeling strategies that elucidate regional interactions. However, this wealth of information can pose challenges in interpreting the estimation results.
Tables 4, 6 present the results of direct and indirect effects on both short-term and long-term outcomes of explanatory variables. The findings from Table 6 underscore that an increase in the number of loss cases and the commitment per chicken have positive and statistically significant effects on the number of insured chickens. Specifically, a 1% increase in the commitment per chicken in a province leads to a 1.1% direct increase in the number of insured chickens in that province. Additionally, a 1% increase in loss cases in one province results in a 0.76% indirect increase in the number of insured chickens in other provinces. These results highlight the importance of spatial interactions and the ability of spatial regression models to capture both direct and indirect effects of the explanatory variables on the dependent variable across different regions.

Table 6. The pattern of insured chicken quantities.
According to Table 6, when considering the explanatory variables related to the risk factor, a 1% increase in the number of loss cases, commitment per chicken, and the risk factor in a province results in a 0.14%, 0.35%, and 0.12% average increase, respectively, in the number of insured chickens in that same province. A comprehensive examination of the cumulative long-term effects presented in Table 6 reveals that a 1% change (either a decrease or increase) in the commitment amount per chicken in a given province leads to a corresponding 0.8% change in the opposite direction in the number of insured chickens within the same province or other provinces. Furthermore, as the number of loss cases and the amount of insurance premium per unit decrease or increase by 1%, the number of insured chickens in the same province and other provinces experiences a decrease or increase of 0.11% and 0.29%, respectively. These findings underscore the significant and complex spatial interactions captured by the spatial regression model, where changes in key risk-related variables in one province can have both direct and indirect effects on the number of insured chickens across the regional market.
Mahul and Stutley (2010) provide an extensive analysis of government-supported agricultural insurance programs in developing countries, which supports the relevance of policy-backed insurance strategies discussed in this study.
Conclusion
The findings from this study underscore the significant impact of various factors on the performance of agricultural insurance, including fluctuations in insurance premiums, risk factors, indemnity payouts, and the extent of the insurer’s commitment to compensating losses resulting from risks. Regarding the results of the study, some practical policy can be recommended. Firstly, the results highlight the importance of insurance uptake among poultry farmers as a vital risk management tool. Increasing awareness and understanding of the benefits of insurance can significantly stabilize their incomes, particularly in regions facing higher risk factors. Policymakers should consider implementing incentives or subsidies for poultry insurance premiums, aimed at encouraging participation, especially in high-risk areas. Additionally, enhancing insurers’ commitment per chicken through performance-based incentives could improve customer satisfaction and reduce claim rates. Furthermore, educational programs are crucial for farmers, focusing on risk management and the functionalities of insurance products. Training sessions that emphasize the importance of timely loss reporting can empower farmers to utilize insurance more effectively. Collaboration among government bodies, insurance companies, and agricultural organizations is also vital. This cooperation can lead to the development of comprehensive risk management strategies, fostering platforms for sharing best practices and data to inform policy decisions. Finally, establishing a monitoring framework to evaluate the effectiveness of insurance programs will allow for ongoing adjustments based on evolving risks and market conditions. Moreover, the spatial regression model underscored the substantial influence of explanatory variables on the dependent variable, both in the short and long term, across various provinces.
Limitations
This study has a few limitations that should be considered when interpreting the findings. Firstly, the study focused on the demand for poultry insurance, specifically broiler farms. The findings may not be generalizable to other agricultural sectors, such as crop insurance or livestock insurance, which may have distinct risk profiles and determinants of insurance demand. Additionally, the spatial regression model employed in the analysis assumes that the spatial dependence between provinces is fixed over time. In reality, the spatial relationships and their impacts on insurance demand may evolve over the study period, which is not captured in the current model. Furthermore, the data used in this study does not include information on farmers’ socioeconomic characteristics, such as education level, risk aversion, or financial literacy. These factors can also play a role in shaping the demand for agricultural insurance and are not explicitly accounted for in the current analysis. Finally, the study period ends in 2020, and the landscape of agricultural insurance may have changed since then, particularly in response to the COVID-19 pandemic and other recent events. Extending the analysis to more recent years could provide a more up-to-date understanding of the factors influencing poultry insurance demand in Iran. Despite these limitations, this study offers valuable insights into the determinants of poultry insurance demand in Iran, which can inform policymakers and industry stakeholders in their efforts to strengthen the agricultural insurance system and promote its uptake among broiler farmers.
Future research could focus on several areas to enhance our understanding of poultry insurance demand. Firstly, studies should examine the demand for agricultural insurance across other sectors, such as crop and livestock insurance, to identify distinct risk profiles and determinants. Additionally, it would be beneficial to explore how spatial relationships and their impacts on insurance demand evolve over time, possibly using dynamic spatial models. Incorporating socioeconomic characteristics of farmers, such as education level and risk aversion, could provide deeper insights into insurance decision-making. McIntosh et al. (2013) underlined the influence of socioeconomic factors such as education and income level on farmers’ insurance uptake, variables which could enhance the current model. Lastly, extending the analysis to include more recent data beyond 2020 would help capture changes in the agricultural insurance landscape influenced by recent events, such as the COVID-19 pandemic. By addressing these aspects, future studies can contribute to developing more robust and tailored insurance programs for agricultural producers.
Policy recommendations
The policy implications of this study are in line with OECD (2011), which emphasizes comprehensive risk management frameworks for agriculture. Based on the findings, a key policy recommendation for insurers would be to focus on risk stratification to enhance the attractiveness of insurance for producers, bolster commitment levels, reduce risk factors, and ensure equitable premiums. This entails conducting a cost-effective risk classification, prioritizing coverage for infrequent but high-impact risks over frequent managerial risks, and providing a substantial commitment to mitigate these potentially devastating events. By adopting these strategies, insurers can address the concerns voiced by countries regarding multiple, repetitive payments and the absence of a consistent, scientifically sound system for accurately predicting risk coefficients and ensuring appropriate commitment, which have been detrimental to the demand for agricultural insurance.
Future research in poultry insurance can focus on assessing the impact of climate change on production and insurance demand, exploring technological innovations like data analytics and blockchain, and investigating behavioral factors influencing farmers’ decisions. Regional case studies can identify best practices, while evaluating the effectiveness of government policies and subsidies is essential.
Data availability statement
The original contributions presented in the study are included in the article/supplementary material. Further inquiries can be directed to the corresponding author.
Author contributions
MH: Conceptualization, Data curation, Investigation, Methodology, Writing – original draft. AM: Supervision, Validation, Writing – review & editing. MG: Project administration, Resources, Writing – review & editing. SZ: Writing – review & editing.
Funding
The author(s) declare that no financial support was received for the research and/or publication of this article.
Conflict of interest
The authors declare that the research was conducted in the absence of any commercial or financial relationships that could be construed as a potential conflict of interest.
Publisher’s note
All claims expressed in this article are solely those of the authors and do not necessarily represent those of their affiliated organizations, or those of the publisher, the editors and the reviewers. Any product that may be evaluated in this article, or claim that may be made by its manufacturer, is not guaranteed or endorsed by the publisher.
References
Adjei C., Amagashie D., Anim-Somuah H., and Oppong B. (2016). Poultry farms risk management by insurance: evidence from Ghana. Br. J. Economics Manage. Trade 15, 1–8. doi: 10.9734/BJEMT/2016/26636
Anselin L. (1988). Spatial Econometrics: Methods and Models Vol. 4 (Dordrecht, Netherlands: Springer Netherlands). doi: 10.1007/978-94-015-7799-1
Baltagi B. H. (2005). Econometric Analysis of Panel Data 3rd Edition, 3rd edition. Chichester, West Sussex, UK (for this edition): John Wiley & Sons
Bannor R. K., Oppong-Kyeremeh H., Amfo B., Kuwornu J. K. M., Chaa Kyire S. K., and Amponsah J. (2023). Agricultural insurance and risk management among poultry farmers in Ghana: An application of discrete choice experiment. J. Agric. Food Res. 11, 100492. doi: 10.1016/j.jafr.2022.100492
Capitanio F. and De Pin A. (2018). Measures of efficiency of agricultural insurance in Italy, economic evaluations. Risks 6, 126. doi: 10.3390/risks6040126
Carter M. R., Janzen S. A., and Stoeffler Q. (2018). Can Insurance Help Manage Climate Risk and Food Insecurity? Evidence from the Pastoral Regions of East Africa. Cham, Switzerland: Springer International Publishing 201–225. doi: 10.1007/978-3-319-61194-5_10
Du X., Feng H., and Hennessy D. A. (2017). Rationality of choices in subsidized crop insurance markets. Am. J. Agric. Economics 99, 732–756. doi: 10.1093/ajae/aaw035
Elhorst J. P. (2014). Spatial econometrics: From cross-sectional data to spatial panels ( Berlin, Heidelberg (Germany): Springer Berlin Heidelberg). doi: 10.1007/978-3-642-40340-8
Falco S., Adinolfi F., Bozzola M., and Capitanio F. (2014). Crop insurance as a strategy for adapting to climate change. J. Agric. Economics 65, 485–504. doi: 10.1111/1477-9552.12053
Fischer M. M. and Getis A. (2010). Handbook of Applied Spatial Analysis (Software Tools, Methods and Applications). 1st ed (Heidelberg: Springer Berlin).
Goodwin B. K. and Smith V. H. (2003). An ex post evaluation of the conservation reserve, federal crop insurance, and other government programs: program participation and soil erosion. J. Agric. Resource Economics 28, 201–216.
Mahul O. and Stutley C. J. (2010). Government Support to Agricultural Insurance (Washington, D.C., United States: The World Bank). doi: 10.1596/978-0-8213-8217-2
McIntosh C., Sarris A., and Papadopoulos F. (2013). Productivity, credit, risk, and the demand for weather index insurance in smallholder agriculture in Ethiopia. Agric. Economics 44, 399–417. doi: 10.1111/agec.12024
OECD (2011). Managing Risk in Agriculture (Paris, France (OECD headquarters): Organisation for Economic Cooperation and Development (OECD). doi: 10.1787/9789264116146-en
Pakravan-Charvadeh M. R. and Flora C. (2022). Sustainable food consumption pattern with emphasis on socioeconomic factors to reduce food waste. Int. J. Environ. Sci. Technol. 19, 1–16. doi: 10.1007/S13762-022-04186-9
Pakravan-Charvadeh M. R., Khan H. A., and Flora C. (2020). Spatial analysis of food security in Iran: associated factors and governmental support policies. J. Public Health Policy 41, 1–24. doi: 10.1057/s41271-020-00221-6
Pearcy J. and Smith V. (2014). The tangled web of agricultural insurance: evaluating the impacts of government policy. SSRN Electronic J. doi: 10.2139/ssrn.2435008
Ramirez O. A. and Shonkwiler J. S. (2017). A probabilistic model of crop insurance purchase decision. J. Agric. Resource Economics 42, 10–26. doi: 10.22004/ag.econ.252751
Rashidi T., Pakravan-Charvadeh M. R., Gholamrezai S., and Rahimian M. (2024). Unveiling the nexus of climate change, adaptation strategies, and food security: Insights from small-scale farmers in zagros mountains in Iran. Environ. Res. 252, 118691. doi: 10.1016/j.envres.2024.118691
Rashidi-Chegini K., Pakravan-Charvadeh M. R., Rahimian M., and Gholamrezaie S. (2021). Is there a linkage between household welfare and income inequality, and food security to achieve sustainable development goals? J. Cleaner Production 326, 129390. doi: 10.1016/j.jclepro.2021.129390
Sadat S. A. A., Pakravan-Charvadeh M. R., Gholamrezai S., Rahimian M., Lane G., Béland D., et al. (2023). Factors associated with Afghan household food security pre- and post-Taliban regime. J. Public Health Policy 44, 1–15. doi: 10.1057/S41271-023-00439-0/METRICS
Sahraei S., Pakravan-Charvadeh M. R., Gholamrezai S., and Rahimian M. (2022). Assessing the association of sustainable agriculture with rural household food security (considering ecological, economic, and social aspects). Front. Nutr. 9. doi: 10.3389/FNUT.2022.899427
Sihem E. (2019). Economic and socio-cultural determinants of agricultural insurance demand across countries. J. Saudi Soc. Agric. Sci. 18, 177–187. doi: 10.1016/j.jssas.2017.04.004
Tuncel S. and Kara E. K. (2022). Determination of factors affecting profit by quantitative methods in broiler enterprises. Arquivo Brasileiro Medicina Veterinária e Zootecnia 74, 549–558. doi: 10.1590/1678-4162-12599
Wang H., Liu H., and Wang D. (2022). Agricultural insurance, climate change, and food security: evidence from Chinese farmers. Sustainability 14, 9493. doi: 10.3390/SU14159493
Keywords: agricultural insurance, broiler, profitability, optimizing, panel data analyses
Citation: Hasan-Nejad ME, Mohammadi-Nejad A, Ghorbani M and Zeraatkish SY (2025) Risk management in broiler farming: optimizing poultry insurance coverage using a spatial panel data analysis. Front. Anim. Sci. 6:1468935. doi: 10.3389/fanim.2025.1468935
Received: 22 July 2024; Accepted: 17 April 2025;
Published: 16 May 2025.
Edited by:
Arda Sözcü, Bursa Uludağ University, TürkiyeReviewed by:
Ashkan Nabavi-Pelesaraei, Technical University of Denmark, DenmarkEmel Kızılok Kara, Kırıkkale University, Türkiye
Copyright © 2025 Hasan-Nejad, Mohammadi-Nejad, Ghorbani and Zeraatkish. This is an open-access article distributed under the terms of the Creative Commons Attribution License (CC BY). The use, distribution or reproduction in other forums is permitted, provided the original author(s) and the copyright owner(s) are credited and that the original publication in this journal is cited, in accordance with accepted academic practice. No use, distribution or reproduction is permitted which does not comply with these terms.
*Correspondence: Amir Mohammadi-Nejad, YS5tb2hhbWFkaW5lamFkQGlhdS5hYy5pcg==