Abstract
We calculate the greenhouse gas (GHG) emissions and energy consumption of two French beekeeping systems, one amateur system (Amat) and one professional system (Pro) with 300 hives. The GHG emissions reach 2.7 kgCO2eq/kg of honey for Amat and 1.49 for Pro. Travel to visit the apiaries accounted for 59% of the total GHG emissions for Amat and 28% for Pro, and sugar accounted for 21% and 41%, respectively. The energy consumption reached 37.4 MJ/kg for Amat and 19.9 MJ/kg for Pro; travel represented 65% of energy consumption for Amat and 34% for Pro, and sugar accounted for 15% and 32%, respectively. The sensitivity analysis revealed that the most important factor influencing GHG emissions was the bee mortality rate, followed by the distances covered by vehicles and the level of sugar use. The average energy consumption per kg of dry matter produced between Amat and Pro is close to that observed for French dairy cattle production. The GHG emissions are well below those of dairy production, by factors of 3.7 and 6.6 for Amat and Pro, respectively. Finally, we make the following recommendations to improve the environmental performance of beekeeping farms, in terms of GHG emissions and energy consumption, in the French context but a priori also in other contexts i) maintain efforts to identify and reduce causes of bee mortality; ii) limiting distances traveled and using low-energy, low-carbon vehicles; and iii) using well-insulated hives. We also provide the GHG emission and energy consumption factors for the artificial swarms purchased.
1 Introduction
Beekeeping is part of the livestock sector and is represented on every continent. The question of its sustainability is generally studied with a view towards adapting to changing conditions, particularly in terms of the available resources, economic context and, more generally, with a socioeconomic approach (Kouchner et al., 2019). In addition to the numerous studies addressing the problems of bioaggressors affecting beehives, a major issue is now emerging: the impact and adaptation of beekeeping to global changes, particularly climate change as highlighted by Decourtye et al. (2019). This author also reminds us of the importance of beekeeping in crop pollination processes, particularly for entomophilous crop pollination. Indeed, beekeeping is also recognized for the services it provides. According to the Sustainable Development Goals (SDG) of the United Nations, beekeeping provides a wide range of services in addition to pollination. Thus, Patel et al. (2021) specifies that beekeeping contributes towards 15 of the 17 SDGs of the United Nations, but there is no mention of beekeeping’s consumption of resources or its impact on climate change (GHG emissions) in the eight priority thematic areas it has proposed in which bees can play a crucial role in achieving the SDGs. At the same time, we can see that, with respect to the roles played by beekeeping systems in the context of climate change and the consumption of nonrenewable resources (energy), there are very few scientific articles, and they are relatively recent (post-2010) and are generally context dependent (Pignagnoli et al., 2010; Kendall et al., 2013; Mujica et al., 2016; Sillman et al., 2021; Pignagnoli et al., 2023).
Given that the effects of human activities on climate change and the issue of energy resources are at the heart of global concerns, and that agricultural activities, including livestock farming, are particularly under the spotlight, it is essential to take a more in-depth look at these issues for beekeeping production. In particular, it is necessary to specify which farming practices and inputs have the greatest impact on the indicators used. It would also be interesting to compare the level of these indicators with those calculated for other livestock productions, such as ruminants, per kilo of food supplied, using a comparable methodology.
Based on the five studies cited above, beekeeping production in different countries and continents is based on relatively common practices: apiary rearing, fairly widespread supplementation of hive feed during periods when there are no food resources available for foraging, and frequent transhumance, particularly for large-scale production units. Focusing more specifically on the French context, we can note significant differences in the production practices and costs that are associated with the size of the enterprise. Small apiaries involve lower transportation costs (visits to fixed apiaries) and simple processing tools, which are often handcrafted and not very mechanized. Larger apiaries, on the other hand, require more extensive travel to bring the apiaries closer to the resources, as well as substantial investments in equipment. However, these enterprises benefit from economies of scale, both in terms of transportation and honey processing. In addition, their level of production per hive is high, as is the level of food supplementation of the colonies. All these factors appear a priori to be important in the type of analysis we are considering and deal with the question of the impacts of beekeeping production from the point of view of climate change (level of greenhouse gas (GHG) emissions) and energy consumption, by using a life cycle assessment (LCA) approach. This type of analysis (LCA) has been widely used since the 1980s and 1990s (Bjørn et al., 2018) and is now well referenced from a methodological point of view. A two-level approach is used to generalize our analysis: i) the use of French cases based on three typical and contrasting beekeeping systems and ii) a sensitivity analysis based on the main components identified with respect to GHG emissions and energy consumption. The discussion allows us to compare our results with those of studies carried out in other contexts and to suggest ways of improving these balances. We also make an original comparison of these results with those of other major agricultural products, particularly from ruminant farms, highlighting the specific features and potential of beekeeping production.
2 Materials and method
2.1 Data
The data used in this analysis come from the study of apiaries located in various French regions; the values used are derived from the monitoring of about one hundred farms, either directly, for diagnostics, health monitoring and help in implementing good practices, or through producer associations. These farms are distributed equally in the Rhône-Alpes, Auvergne, Occitanie and Provence-Alpes-Côte d’Azur regions (Figure 1). These data were confirmed by farm descriptions found in professional journals. For the purposes of this study, we used the notion of “typical cases”. These are “farms reconstructed through collective modeling and expert appraisal, in which we seek to reconstruct the functioning of a coherent system in all its components” (IDELE, 2024). The elements of apiary management that are required for a conventional life cycle analysis (LCA) have been listed, i.e., the inputs used, whether they concern the rearing itself (hives and their construction materials, feed supplements, namely, sugars) but also the farm vehicles and the facilities dedicated to packaging and sales, as well as the electricity consumption by the facilities and the management of the enterprise. Marketing supplies have not been considered (particularly for short-distance sales).
Figure 1

Perimeters location of the beekeeping farms used to define the reference system, in four French regions.
One particular system is not examined in detail in this article, but it is a nonmarginal mode of production, on the scale of France, for example, but for which honey production is not the primary objective. We call it Biodiv, for biodiversity. Its characteristics and results are described in Box 1.
Box 1 The Biodiversity system (Biodiv).
This is a hobby farm. It consists of only a few hives (fewer than ten) with a low production of 2 to 3 kg of honey per hive per year. No specific investment can be considered in the type of analysis we carry out. In fact, the hives are generally built from recycled materials and/or kept for up to thirty years and are therefore easily depreciated. Examples include the Warré beehive (Warré, 1948), designed in a mindset of self-sufficiency in the means of production. We therefore consider this activity to generate negligible costs. The mortality rate is generally low, if not nil, given the self-renewal process by swarming. There is no sugar supplementation. Even if it is not very productive, this system has a zero GHG and energy balance, as there are no specific material or input costs to consider.
Two contrasting types of farming systems are the focus of this study (Table 1):
-
Amateur breeding systems (Amat), with a dozen hives and associated operational equipment, aim to produce significant quantities of honey: the hives each produce an average of 15 kg of honey per year. Investments remain relatively limited, but we do include a vehicle to visit the hives. A supply of 5 kg of sugar per hive per year is provided. A bee mortality rate of 30% was assumed. Indeed, this rate was reached and exceeded in almost half of French departments during the 2021–2022 campaign (Laurent, 2023).
-
Professional breeding systems (Pro300), with 300 hives, each producing an average of 40 kg of honey per year. Equipment (including a vehicle) and honey processing equipment are required to ensure the transhumance and management of these many hives (uncapping, extraction, ripening equipment, and pallet truck). The corresponding investments are included in the LCA. An input of 15 kg of sugar per hive per year was used. A bee mortality rate of 30% was assumed.
Table 1
| Beekeeping system names and values of the LCA factors used | Amat | Pro300 | Pro600 | LCA CO2 and energy factors | |||
|---|---|---|---|---|---|---|---|
| KgCO2eq/U | MJ/U | Unit | Ref. | ||||
| Hives (number) | 10 | 300 | 600 | ||||
| Honey per hive (kg) | 15 | 40 | 40 | 12.7 | kg | USDA | |
| Mortality rate (%) | 30 | 30 | 30 | ||||
| Sugar (kg/hive) | 5 | 15 | 15 | 1.15 | 11.73 | kg | A-Ademe |
| Swarm to compensate bees mortality | yes | yes | yes | 17.1 | 200.0 | Unit | Pro300 |
| Equipment | |||||||
| Hive: wood (kg) | 21 | 21 | 21 | 0 | 7 | kg | Dia’Terre |
| Linear depreciation (years) | 15 | 15 | 15 | ||||
| Hive: stainless roof (kg) | 2.43 | 2.43 | 2.43 | 3.667 | 18 | kg | Dia’Terre |
| Linear depreciation (years) | 20 | 20 | 20 | ||||
| Vehicle | |||||||
| Weight (kg) | 1200 | 2000 | 2000 | 2.033 | 80 | kg | Dia’Terre |
| Degressive depreciation (% per year) | 15 | 15 | 15 | ||||
| Referenced year for depreciation (1) | 9.9 | 4.8 | 3.1 | ||||
| Distance per year for beekeeping (km) | 600 | 8000 | 12000 | ||||
| Fuel (liters/km) | 8 | 12 | 12 | 3.25 | 45.7 | liter | Dia’Terre |
| Oil (litres per 20000km) | 7 | 7 | 7 | 2.67 | 36.18 | liter | Dia’Terre |
| Other equipment | |||||||
| Extractor Stainless (kg) | 20 | 100 | 100 | 3.67 | 35 | kg | Dia’Terre |
| Iron (kg) | 30 | 100 | 100 | 1.22 | 23 | kg | Dia’Terre |
| Depreciation time (years) | 40 | 30 | 20 | ||||
| Uncapping device (kg) | 0 | 300 | 300 | 2.033 | 18 | kg | Dia’Terre |
| Depreciation time (years) | 30 | 20 | |||||
| Ripening equipment Stainless (kg) | 10 | 200 | 400 | 3.67 | 35 | kg | Dia’Terre |
| Depreciation time (years) | 50 | 25 | 25 | ||||
| Pallet truck (kg) | no | 1500 | 1500 | 2.033 | 18 | kg | Dia’Terre |
| Depreciation time (years) | 10 | 6.67 | |||||
| Building | |||||||
| Storage (m²) | no | 75 | 112.5 | 26.7 | 515.5 | m² | Dia’Terre |
| Insulated (m²) | no | 75 | 112.5 | 208.6 | 4072 | m² | Dia’Terre |
| Electricity | |||||||
| Light (kwh/year) | 1 | 40 | 90 | ||||
| Dehumidifier (kwh/year) | 0 | 15 | 22.5 | ||||
| Extractor (kwh/year) | 2 | 60 | 120 | ||||
| Uncapping device (kwh/year) | 0 | 40 | 80 | ||||
| Computer (kwh/year) | 2.6 | 26 | 39 | ||||
| Total | 5.6 | 141 | 272 | 0.078 | 10.4 | kwh | Dia’Terre |
Characteristics of the three studied beekeeping systems: enterprise size, production level and operating resources.
Emission and energy consumption factors for selected inputs. Amat for amateur beekeeping system, Pro300 and Pro600 for professional beekeeping systems with 300 hives and 600 hives, respectively. A-Ademe for Agribalyse-Ademe.(1) Equations for base year for vehicule depreciation according to the number of annual km are For Amat: = −1.617 × 10⁻⁹ × km3 + 8.949 × 10⁻⁶ × km2 − 1.85 × 10⁻² × km + 18.13 For Pro: = −1.544 × 10⁻¹² × km3 + 8.476 × 10⁻⁸ × km2 − 1.644 × 10⁻³ × km + 13.3
As we see the development of 600-hive farms with the inclusion of a partner or the hiring of an employee, we discuss the interest, from the point of view of GHG emissions and energy consumption, of moving from a Pro300 system to a Pro600 system, a professional farm with 600 hives. Table 1 shows the assumptions made concerning the differences in equipment and costs between the Pro300 and Pro600 breeding systems. As the level of activity is greater in the Pro600 system, the equipment is under greater strain, and we have considered shorter depreciation periods and higher electricity consumption, which are not proportional to the increase in apiary size (from 300 to 600 hives) due to economies of scale. For example, the average annual distance covered by the farm vehicle increased by 50%, as did the surface area of the buildings required for the farm activities.
2.2 Method
We carried out a classic LCA, which is based on the methodology deployed by ADEME in the Dia’Terre tool (SOLAGRO, 2009), which is itself based primarily on GESTIM data (Gac et al., 2011). The factors considered are described in Table 1, with the emission and energy consumption factors used. In particular, this table specifies the characteristics of the equipment used and their energy consumption (extraction, uncapping, ripening equipment, pallet truck, buildings, and vehicle). It also provides two equations (one for Amat and one for Pro), which enable us to modulate the cost of depreciation (GHG and energy) according to the annual mileage covered. In fact, with declining balance depreciation (usually 15% per year for vehicles), the closer the reference year is to the purchase date, the higher the depreciation level.
In the context of high swarm mortality, it is essential to consider the environmental cost (GHG and energy) of swarm replacement. Here, as throughout the entire text, when we mention “swarm”, we mean artificial swarm. We consider that the farmer renews his dead swarms by purchase and does not produce them himself. To the best of our knowledge, no GHG emissions or energy consumption factors have been proposed in the literature for swarm production. In accordance with the queen production method described in Box 2, we use values of 17.1 kg CO2eq and 200 MJ per purchased swarm based on a mortality rate of 5% of the hives from which the honey consumed for swarm production comes. Based on a mortality rate of 30%, the values of these coefficients would be 21.5 kg CO2eq swarm and 258 MJ per swarm.
Box 2 The production of swarms to compensate for winter mortality. What is the cost in terms of GHG emissions and energy consumption?
The French bee population consists of approximately 1,300,000 colonies, of which 30% die during the winter, i.e., 390,000 colonies that beekeepers must replenish each year during the beekeeping season. This annual renewal of dead colonies is accomplished either by colony division or by queen rearing followed by the production of nuclei to be transformed into swarms after queen fertilization. The construction of wax combs represents the equivalent of 8 kg of honey per swarm. In addition, 8 kg of sugar is needed to support the development of each swarm until the end of its first wintering. Honey and sugar are the two specific inputs required for swarm production. Hives used for dead colonies are reused for the new swarms, so no purchase is considered. Nor do we take into account the wooden products that make up the frames and the wires that support the combs; their impact is considered negligible. Only honey and sugar are considered. The references used (GHG emission factor and energy consumption) for the consumed honey are those from the Pro300 system, under the assumption of controlled swarm mortality (5%). As these Pro300 honey references are themselves established via GHG emission and energy consumption factors for purchased swarms, the calculations of these two GHG and energy consumption factors for swarms are performed via progressive adjustments to obtain figures of 17.1 kg CO2eq and 200 MJ per purchased swarm.
We express the results (CO2eq for GHG and MJ for energy consumed) per kg of product (i.e., honey), either per kg gross or per kg dry matter, to facilitate comparisons with other food products (meat, milk, and cereals).
Allocations of GHG emissions or energy are sometimes envisaged for products supplied by bees other than honey, as can be done in contexts where pollination by farmed bees is an activity in its own right, such as in arboriculture (e.g., almond trees in the USA) (Traynor, 2017). Lindstrom et al. (2016) for example, reported that the presence of beehives contributes to an 11% increase in productivity per hectare of rapeseed for open-pollinated cultivars. Pollination can thus be considered a service, similar to honey production, and an allocation on an economic basis is then made to allocate the emitted GHG (and the energy consumed) to the different products. We do not allocate to products other than honey in this study, particularly for pollination. Indeed, we consider “average” systems, which are admittedly based on well-specified dimensions but without qualifying the food resources of the bees, since these apiaries can be located in different regions of France, from lowland areas to mountain and rangeland zones.
To perform a sensitivity analysis, we independently vary each of the factors identified as contributing to the GHG and energy balances by grouping certain factors together and retaining them in the end: the bee mortality rate (which considers the impact on the number of swarms purchased and the quantity of honey produced at the apiary level); travel in terms of annual kilometers traveled (including fuel but also vehicle depreciation, depending on this annual distance); fuels and depreciations other than those associated with the vehicle (including the pallet truck); sugar and electricity. The ranges of variation were empirically defined at +/− 50% for these factors: amount of sugar per hive, annual travel distance, fuel for other equipment, depreciation value of equipment, and electricity consumption. The minimum mortality value was set at 5% (considered to be the ideal level for optimal colony health management), and the maximum value was set at 60%, which may be observed occasionally.
We also calculate the energy efficiency. This is the ratio between the energy produced in the form of agricultural commodities (honey in this case) and the amount of energy (direct or indirect) required for the production process.
We compare these GHG emission and energy consumption levels, as well as the efficiencies, with those of other major agricultural products, such as dairy cows, beef cattle and field crops (mostly cereals), on average, with French references (Bordet et al., 2010; Metayer et al., 2010; Bochu et al., 2011). For these very different types of foodstuffs, we report the GHG emissions and energy consumption per kg of dry matter produced, even though it would also have been possible to relate them to the energy or protein contents of the products.
3 Results
3.1 Greenhouse gas emissions
Amat achieves the highest level, at 2.67 kg CO2eq/kg of honey (Table 2), with fuel contributing 56% of this total, followed by sugar 21% and swarm purchases 18% (Figure 2a). Pro300 has a lower emission level, at 1.49 kg CO2eq/kg. The vehicle fuel consumption is limited to 25% of the total (Figure 2b), which is less than half that of Amat, owing to economies of scale, with a total of 8,000 kg of honey produced vs. 100 kg for Amat.
Table 2
| Bee mortality | Amateur | Profess. 300 | Pro.300/Amateur | Profess. 600 | Pro.600/Pro.300 | |
|---|---|---|---|---|---|---|
| CO2Eq/kg honey (kg) | 5% | 1.67 | 0.99 | −41.0% | 0.86 | −12.8% |
| 30% | 2.67 | 1.49 | −44.2% | 1.32 | −11.5% | |
| Energy Kg honey (MJ) | 5% | 24.0 | 13.3 | −44.6% | 11.2 | −15.7% |
| 30% | 37.4 | 19.9 | −46.8% | 17.0 | −14.3% | |
| Energy efficiency (%) | 5% | 53% | 95% | 80.4% | 113% | 18.6% |
| 30% | 34% | 64% | 88.1% | 75% | 16.7% |
Synthetic results for CO2Eq emissions, energy consumption and energy efficiency (MJ honey/MJ used) for 3 types of beekeeping (Pro300 and Pro600 for professional beekeeping systems with 300 hives and 600 hives, respectively).
Results are given for 5% and for 30% bee mortality.
Figure 2
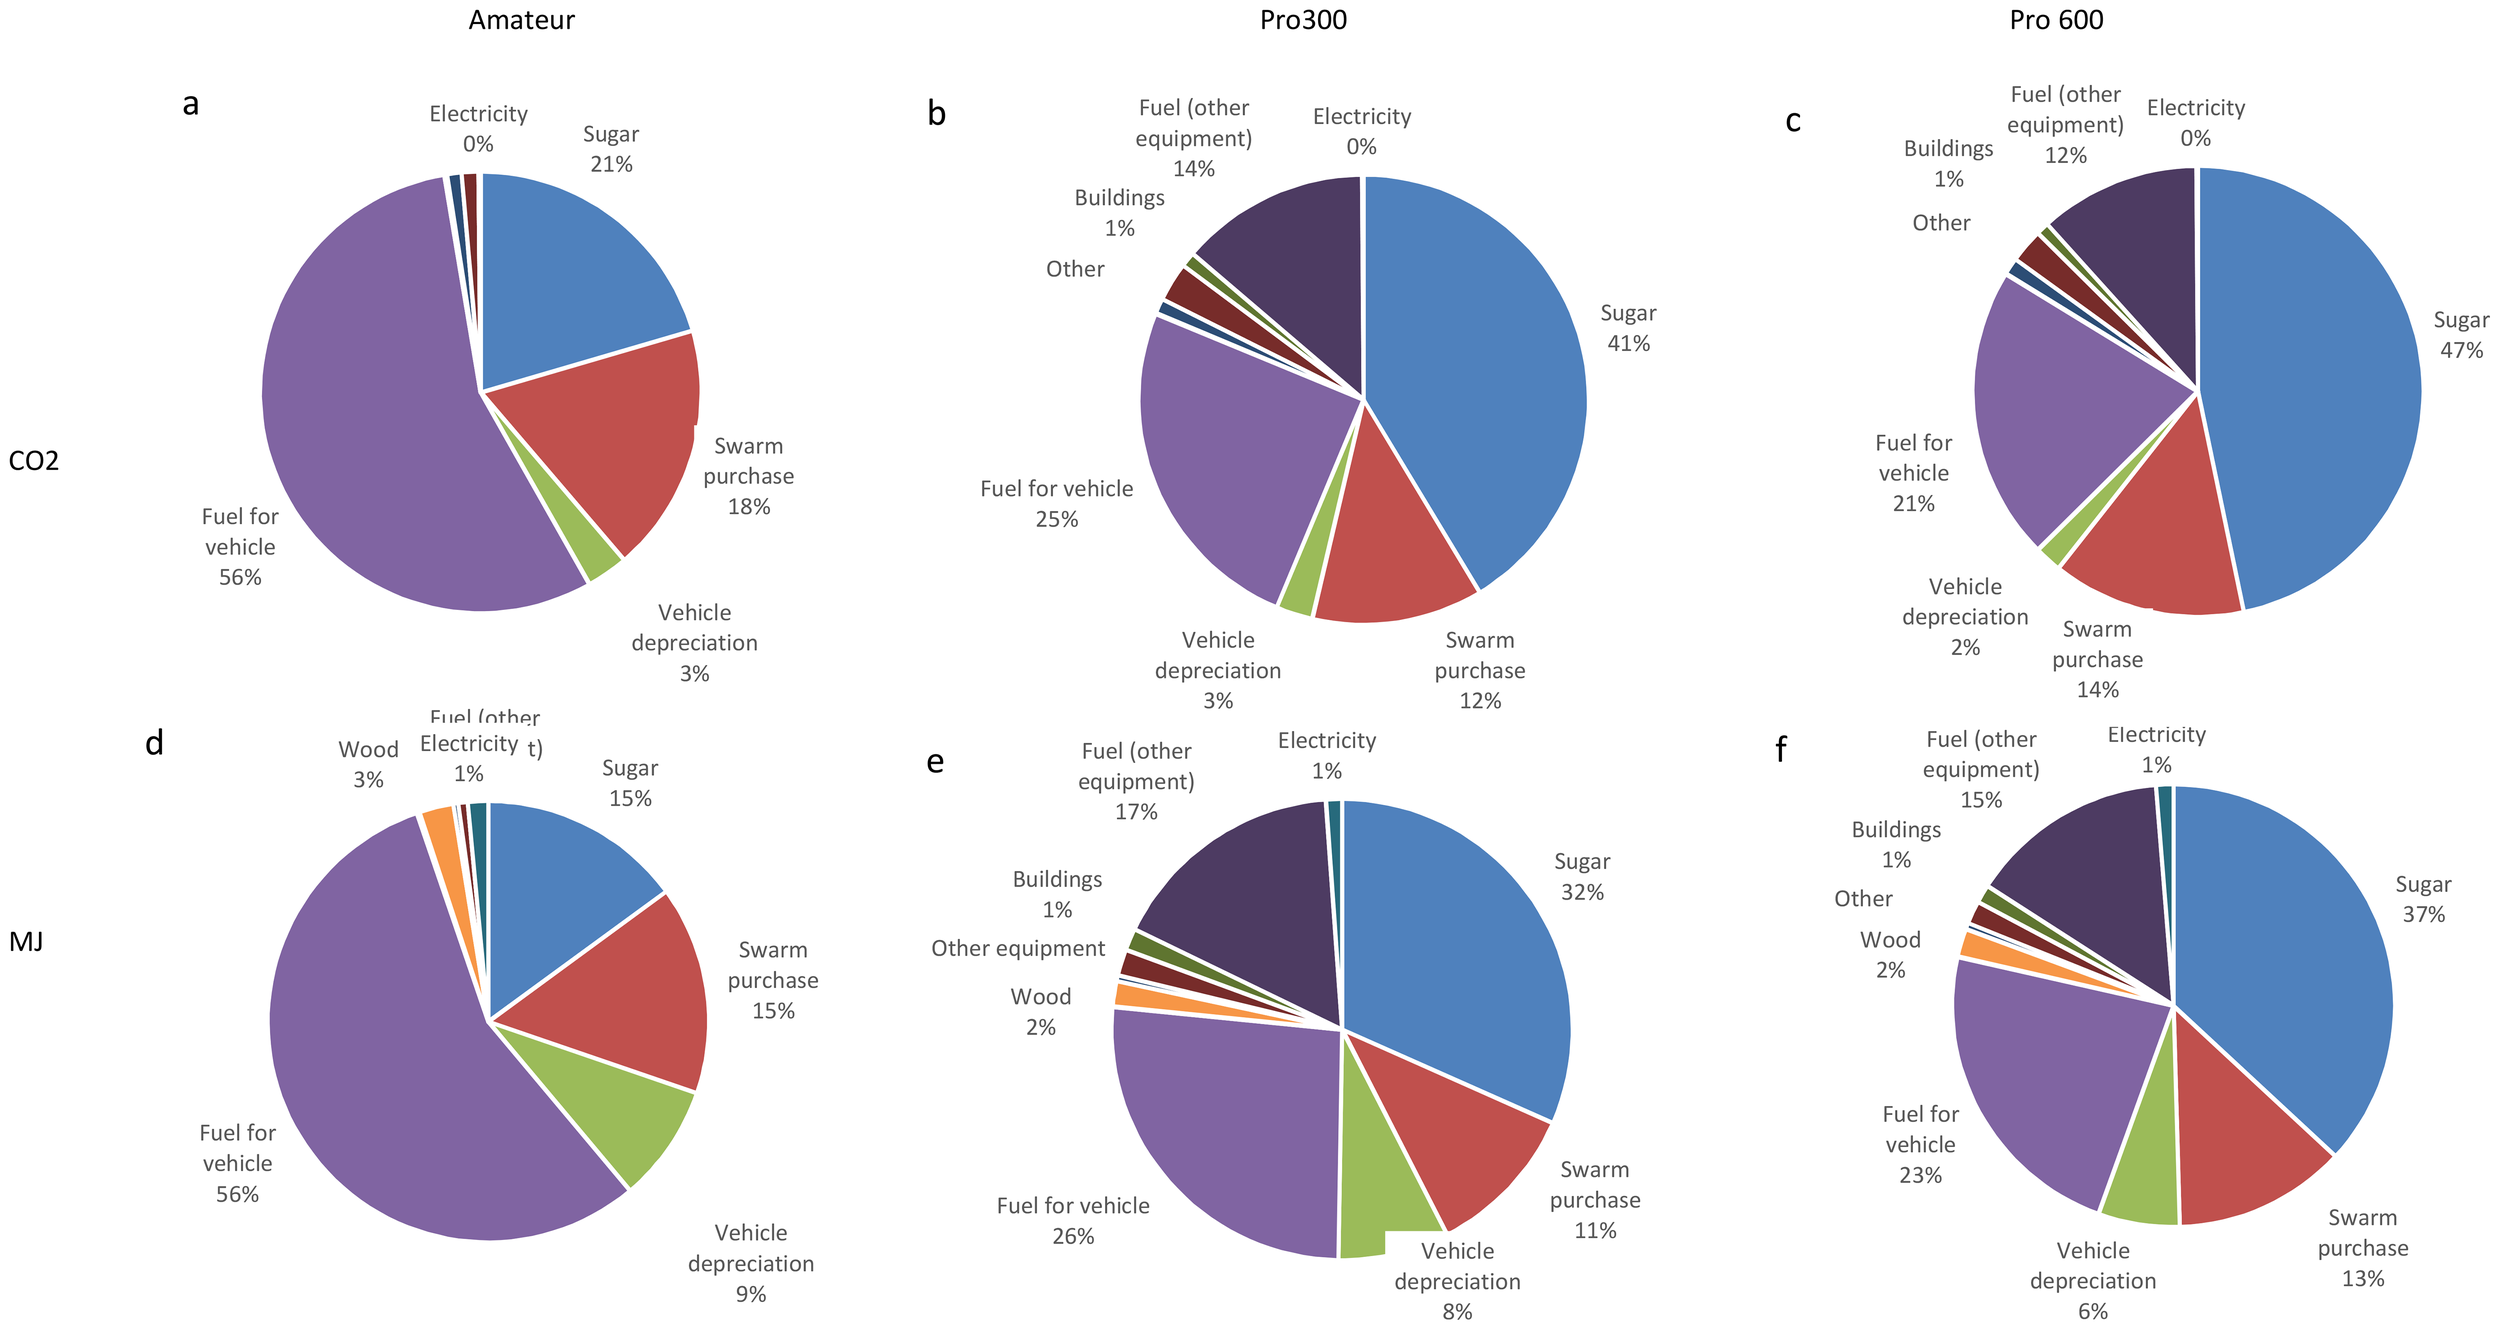
Shares of GHG emissions (in CO2) and energy (MJ) balance components: GHG emissions for AMat (a), for pro300 (b) and for Pro600 (c) and energy for AMat (d), for Pro 300 (e) and for Pro600 (f) , Pro300 and Pro600 for professional beekeeping systems with 300 hives and 600 hives, respectively. The main use of fuel is transhumance of the hives between seasons and for regular visits to apiaries. Sugar is used when the natural resources available for feeding bees are insufficient, particularly in winter.
For Pro300, however, it is necessary to add the fuel that is used by other equipment (not used at Amat), which accounts for 14% of the total emissions. Sugar is ultimately the largest component of the GHG balance for Pro300, accounting for 41% of the total. In this system, swarm purchases represent the third item, accounting for 12% of total GHG costs. All other items are minimal, at less than 3% of the total for Pro300. Pro600, with an additional economy of scale, reaches 1.32 kg CO2eq/kg (Figure 2c).
3.2 Energy
The energy consumption for Amat is almost double that of Pro300, at 37.4 vs. 19.9 MJ/kg. Fuel represents 56% of the energy used for Amat (Figure 2d). Adding depreciation, the total energy cost of the vehicle represents 65% of the total energy cost for Amat. Sugar account for 15% of the total.
Sugar is much more significant for Pro300, where it accounts for 32%, whereas the total cost of the vehicle reaches 34% (Figure 2e). Pro300 benefits from a certain economy of scale for equipment, owing to the large number of hives and good honey productivity. Pro600 has the best energy balance, at 17.0 MJ/kg.
3.3 Energy efficiency
The ratio between the energy produced and the energy used reaches 0.34 for Amat, 0.64 for Pro300 and 0.75 for Pro600 (Table 2). The greater efficiency of Pro300 vs. Amat corresponds to its lower energy consumption per kg of honey produced. Notably, for all three cases, the levels achieved are less than one; i.e., these systems produce less energy in the form of honey than they consume.
However, controlling the mortality rate significantly improves these efficiencies, with Pro600 even exceeding the threshold value of one in this context (Table 2).
4 Discussion
4.1 Levels of greenhouse gas emissions and energy used
Of the three gases usually included in agricultural GHG LCAs (CO2, CH4 and N2O), only CO2 appears in beekeeping, either directly (fuel combustion) or indirectly (inputs). Owing to the much higher production per hive and economies of scale and by expressing the results in terms of kg of honey produced, Pro300 achieves significantly better results than Amat, by −44.2% for GHGs and −46.8% for MJs. Doubling the number of hives results in Pro600 decreasing its GHG emissions by 11.5% and its energy consumption by 14.3% compared to P300 (Table 2).
4.2 Sensitivity analysis for the Amat and Pro300 systems
The factors with the greatest overall impact on GHG emission levels and energy consumption were ranked in order of importance from top to bottom (Figure 3).
Figure 3
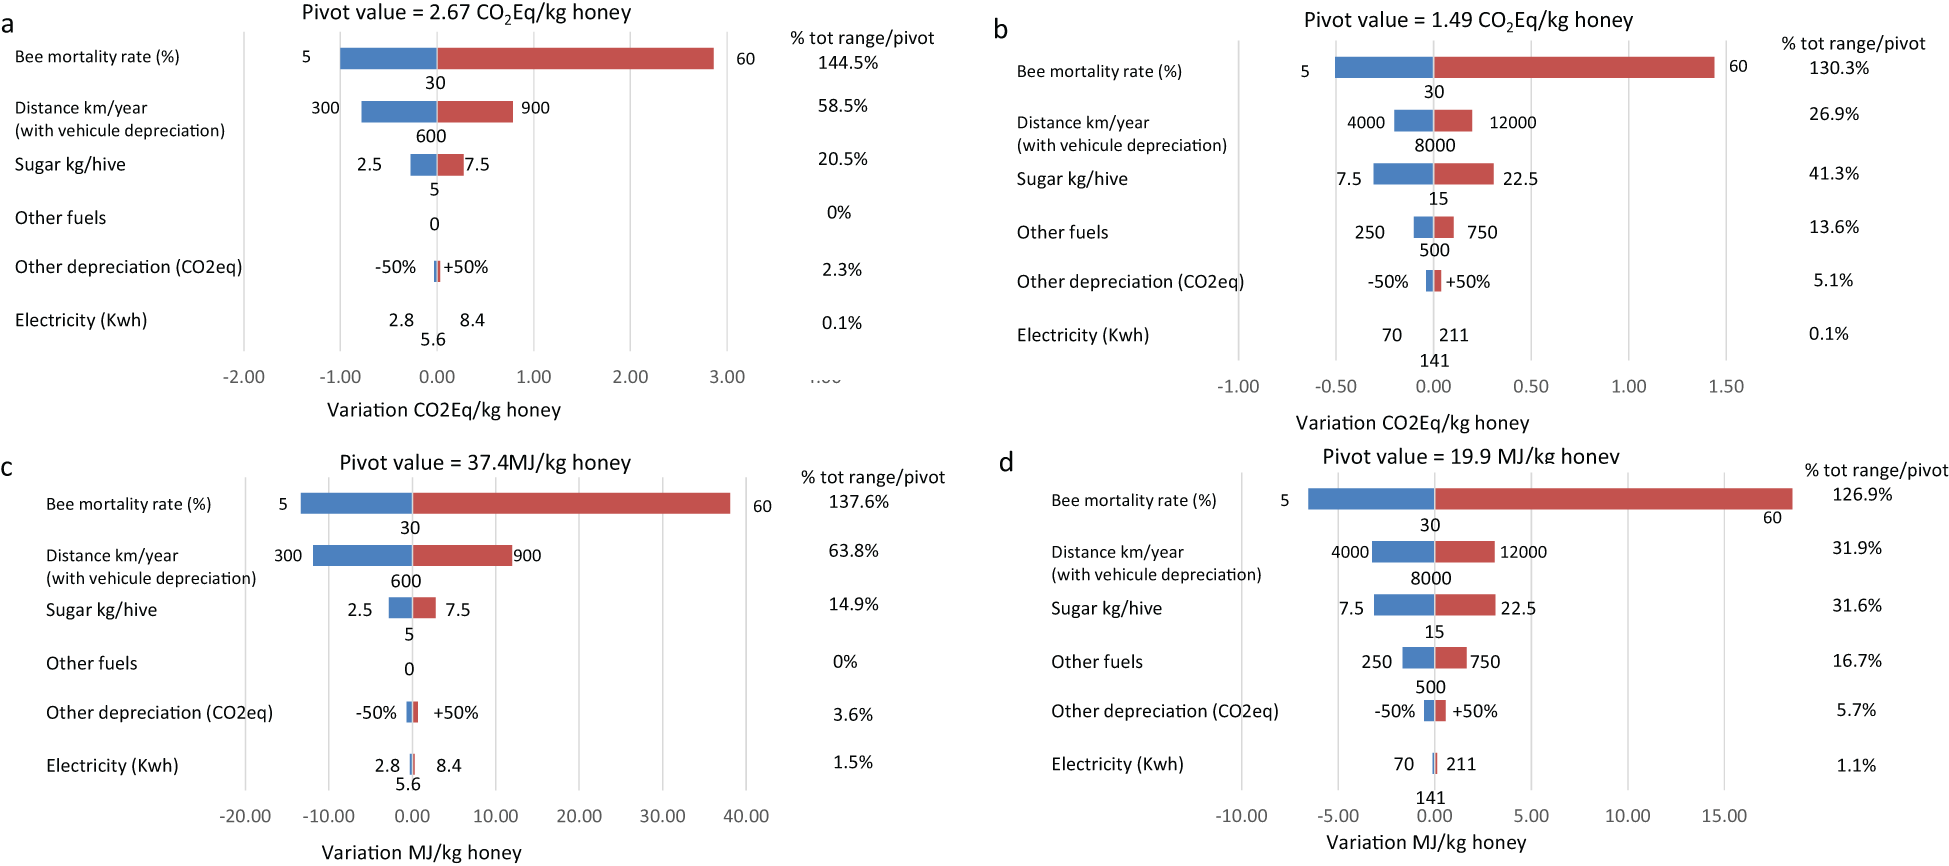
Sensitivity analysis: Ranges of variation in GHG emissions (a for Amat and b for Pro300) and energy consumption (c for Amat and d for Pro300) for the six variation factors highlighted. For each of these six factors, the minimum, maximum, and average values are given. The average value of each factor (“pivot values” leads to the overall average value (pivot value, given at the top of each figure). The abscissa corresponds to the variation on C02eq/kg or MJ/kg according to the variation in each six factors studied. The right-hand column of each graph shows the ratios between the overall variation of the given factor and its pivot value. Pro300 and Pro600 for professional beekeeping systems with 300 hives and 600 hives, respectively.
The bee mortality rate is the factor with the greatest impact on both GHG emissions and energy consumption for Amat and Pro300. This is because the honey production levels are directly affected by bee mortality, and one kg of honey is the functional unit used to express GHG emissions and energy consumption. Notably, the rate of hive renewal through swarm purchases is directly linked to the mortality rate. When the latter increases from a minimum of 5% to a maximum of 60%, the GHG/kg indicators increase by 144.5% and 130.3% (with reference to the average levels presented in sections 3.1 and 3.2) for Amat and Pro300, respectively; simultaneously, the energy consumption per kg of honey increases by 137.6% and 126.9%, respectively.
Notably, the relationships between mortality rates and the levels of GHG emissions and energy consumption indicators are not linear but rather exponential, as illustrated in Figure 4. Thus, a shift from 60% to 80% mortality multiplies the GHG emissions per kg of honey by a factor of more than two.
Figure 4
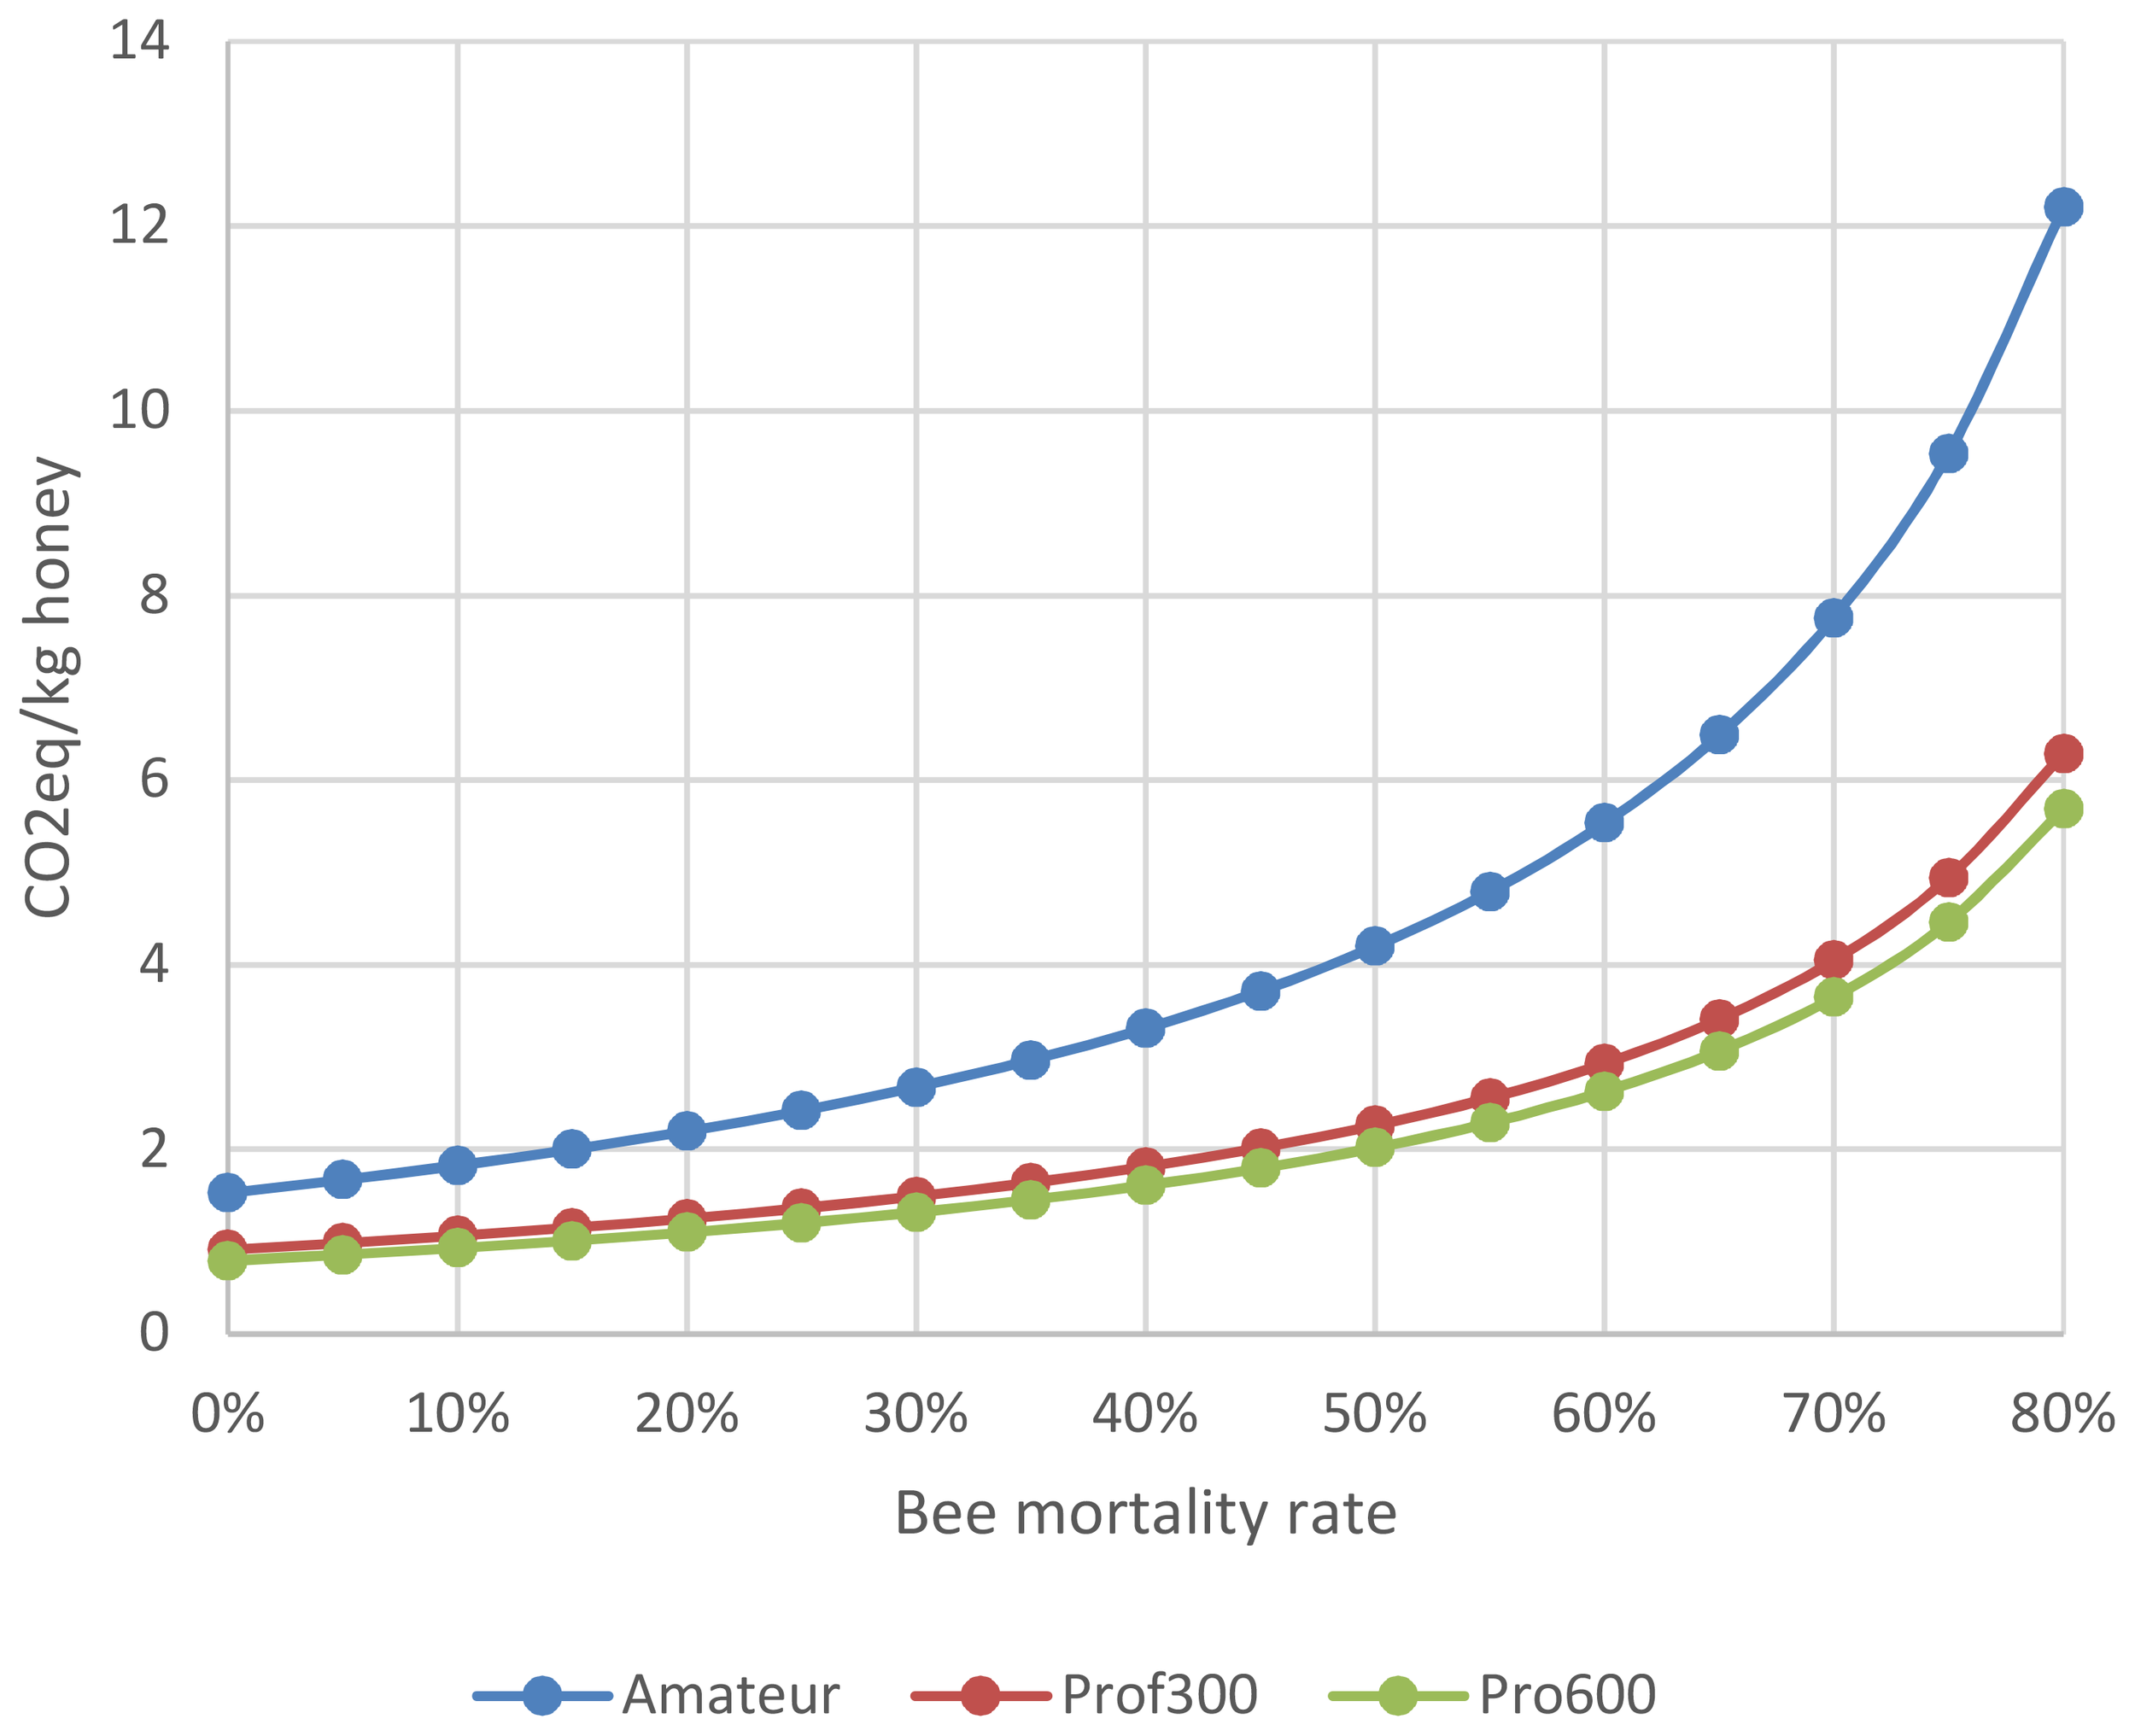
Relationships between mortality rates and level of GHG emissions and energy consumption per kg of honey for the amateur, P300 and P600 beekeeping systems. Pro300 and Pro600 for professional beekeeping systems with 300 hives and 600 hives, respectively.
The second factor for Amat and third for Pro300 is the annual distance traveled. When this increases from 1 to 3 (300 to 900 km for Amat and 4000 to 12000 km for Pro300), the GHG emissions increase by 58.5% and 26.9%, respectively, and the energy consumed increases by 63.8% and 31.9%, for Amat and Pro300, respectively.
The amounts of sugar used for bee feeding were third for Amat and second for Pro300: for Pro300, the increase from 7.5 to 22.5 kg of sugar per hive corresponds to a sharp increase in GHGs, 41.3% of the initial average level, and 31.6% of the energy. For Amat, the change from 2.5 kg of sugar to 7.5 kg per hive resulted in a 20.5% increase in GHGs and a 14.9% increase in energy. The other components have negligible impacts, except for Pro300, for fuels other than those dedicated to vehicles, where a change from 250 to 750 liters results in a 13.6% increase in GHGs and a 16.7% increase in energy consumed.
4.3 Comparison with other livestock production and crops
The GHG emissions per kg of dry matter produced are 3.7 (Amat) to 6.6 times (Pro300) lower than those of dairy cattle and are 14.3 (Amat) to 25.7 (Pro300) times lower than those of suckler cows (Figure 5a). This is due mainly to the absence of emissions of i) CH4, the gas that most often represents the main GHG component for ruminants, and ii) N2O, which is linked to the use of nitrogen fertilizers and manure. The lower feed efficiency of suckler cows than dairy cattle explains their lower relative performance. In ruminant farming, GHG emissions that are associated with manure management (mainly manure and slurry) account for a significant proportion of the GHG balance. To the best of our knowledge, no study has reported on the GHG emissions associated with bee excreta, and this factor is therefore not included in the GHG balance. We assume that this item is negligible in relation to the emission factors used above. Indeed, the basic diet of foraging bees is honey and therefore consists mainly of carbohydrates. As far as nurse bees are concerned, only 15% of their diet is based on pollen or bee bread (the rest being honey), of which 15% is not assimilated by the bee, and there is no knowledge regarding the CH4 or N2O emissions that are possibly associated with the corresponding excreta. During the winter, the bee performs two or three cleaning flights to empty its rectal ampulla, eliminating approximately 5 mg of feces each time. The total amount of excreta per bee per year was estimated at 50 mg, i.e., 1.5 kg for a colony of 30,000 bees compared with the 40 kg of honey produced. To our knowledge, no study has assessed the possible impact of these excreta on the hive’s GHG balance.
Figure 5
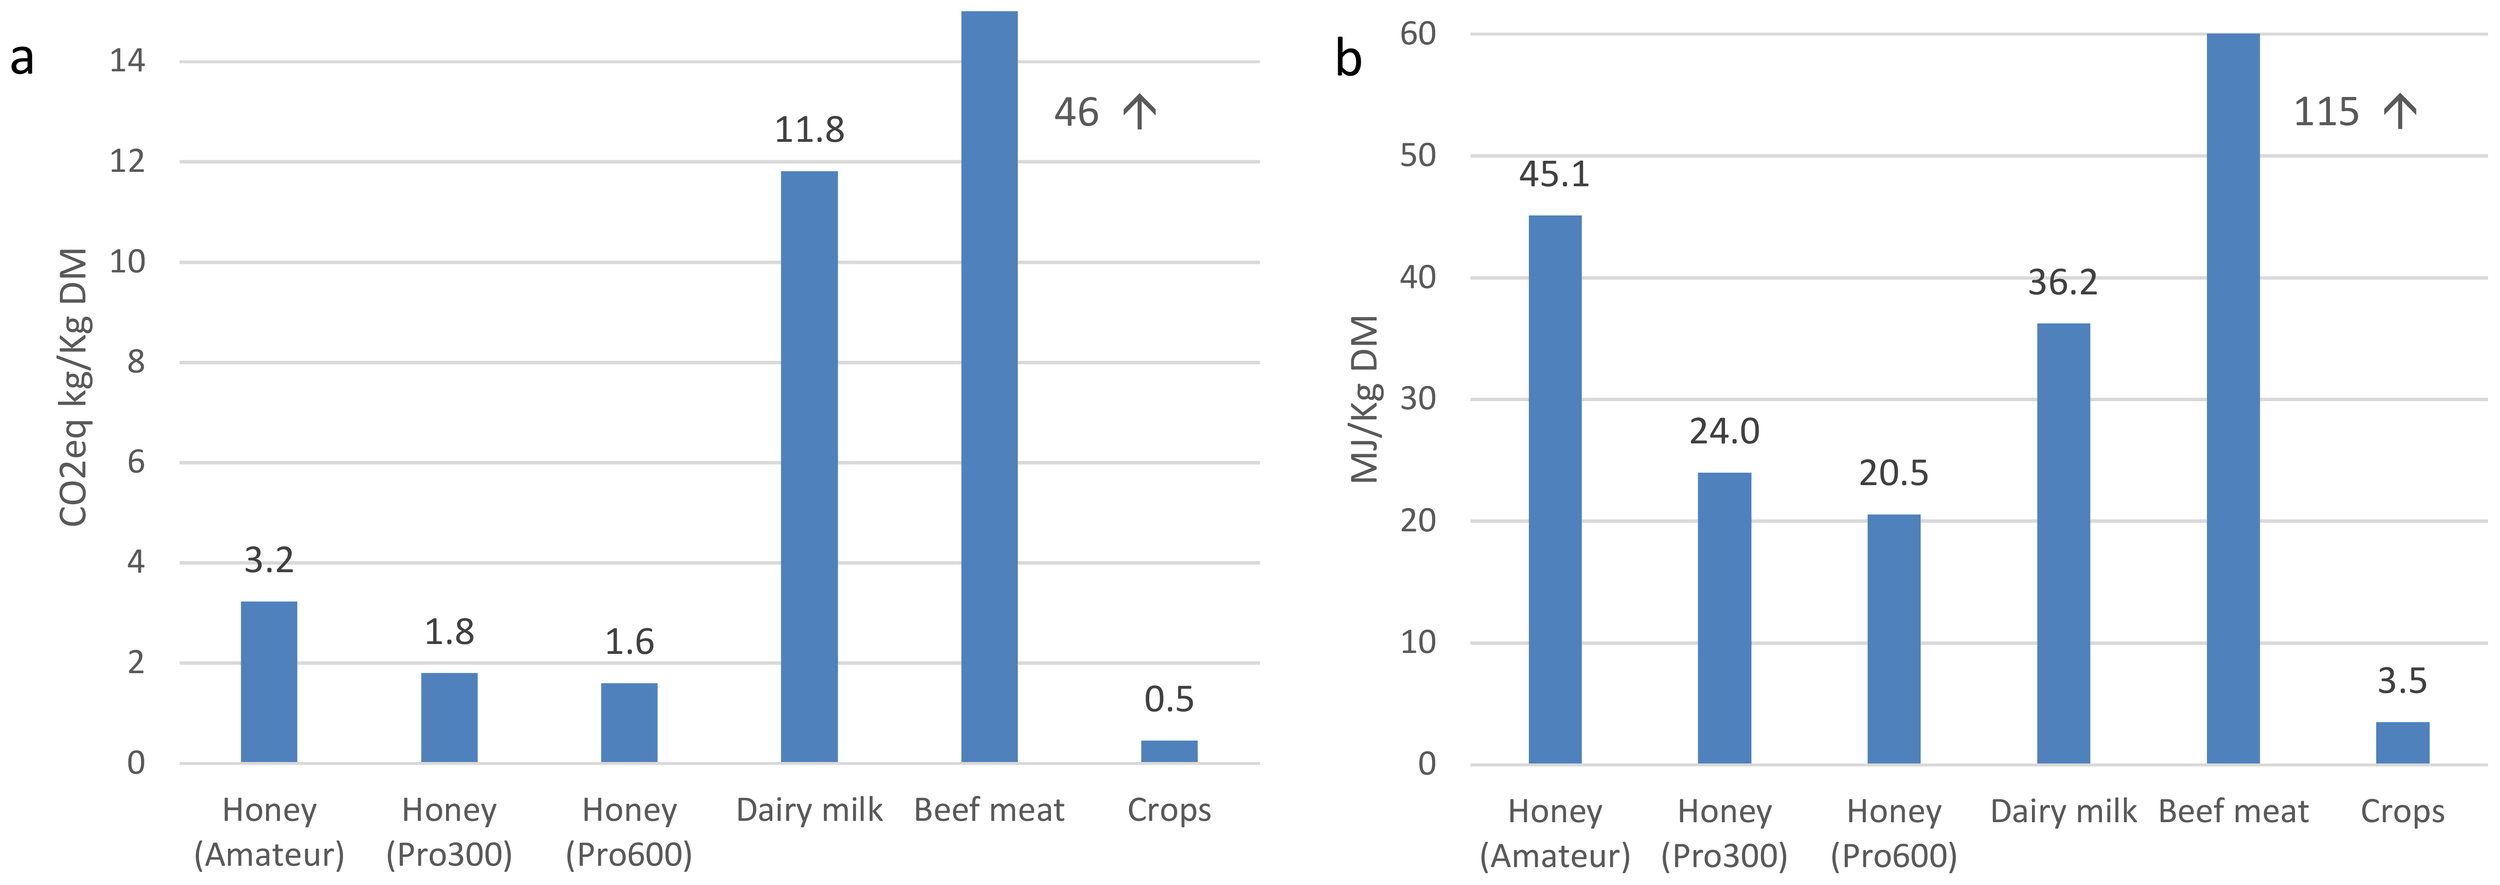
GES emissions (a) and energy consumption (b) per kg of dry matter produced (honey, milk, meat, crops) for the amateur and professional beekeeping systems and for dairy cattle, beef cattle, and field crop production (average French data). Pro300 and Pro600 for professional beekeeping with 300 hives and 600 hives, respectively.
In terms of energy consumption, the results for Pro300 were better than those for dairy cattle, at 24.0 MJ/kg DM vs. 36.2, i.e., -34% (Figure 5b). Amat, on the other hand, used 45% more energy than dairy production (45.1 MJ/kg DM). The energy consumption of Pro300 and Amat were much lower than beef production (by a factor of 3.3, on average). Field crop production was lower than honey and milk production by a factor of almost 10.
With respect to energy efficiency, at 0.64, Pro300 is greater than the average amount for French milk production (0.59, according to Benoit and Mottet (2023)), and Amat, at 0.34, is lower than the reference value for suckler cow systems (0.44) (Figure 6). The energy efficiency for Pro600 reaches 0.75, a level significantly greater than that of dairy cow and almost double that of suckler beef production. Field crop production averages 5.4.
Figure 6
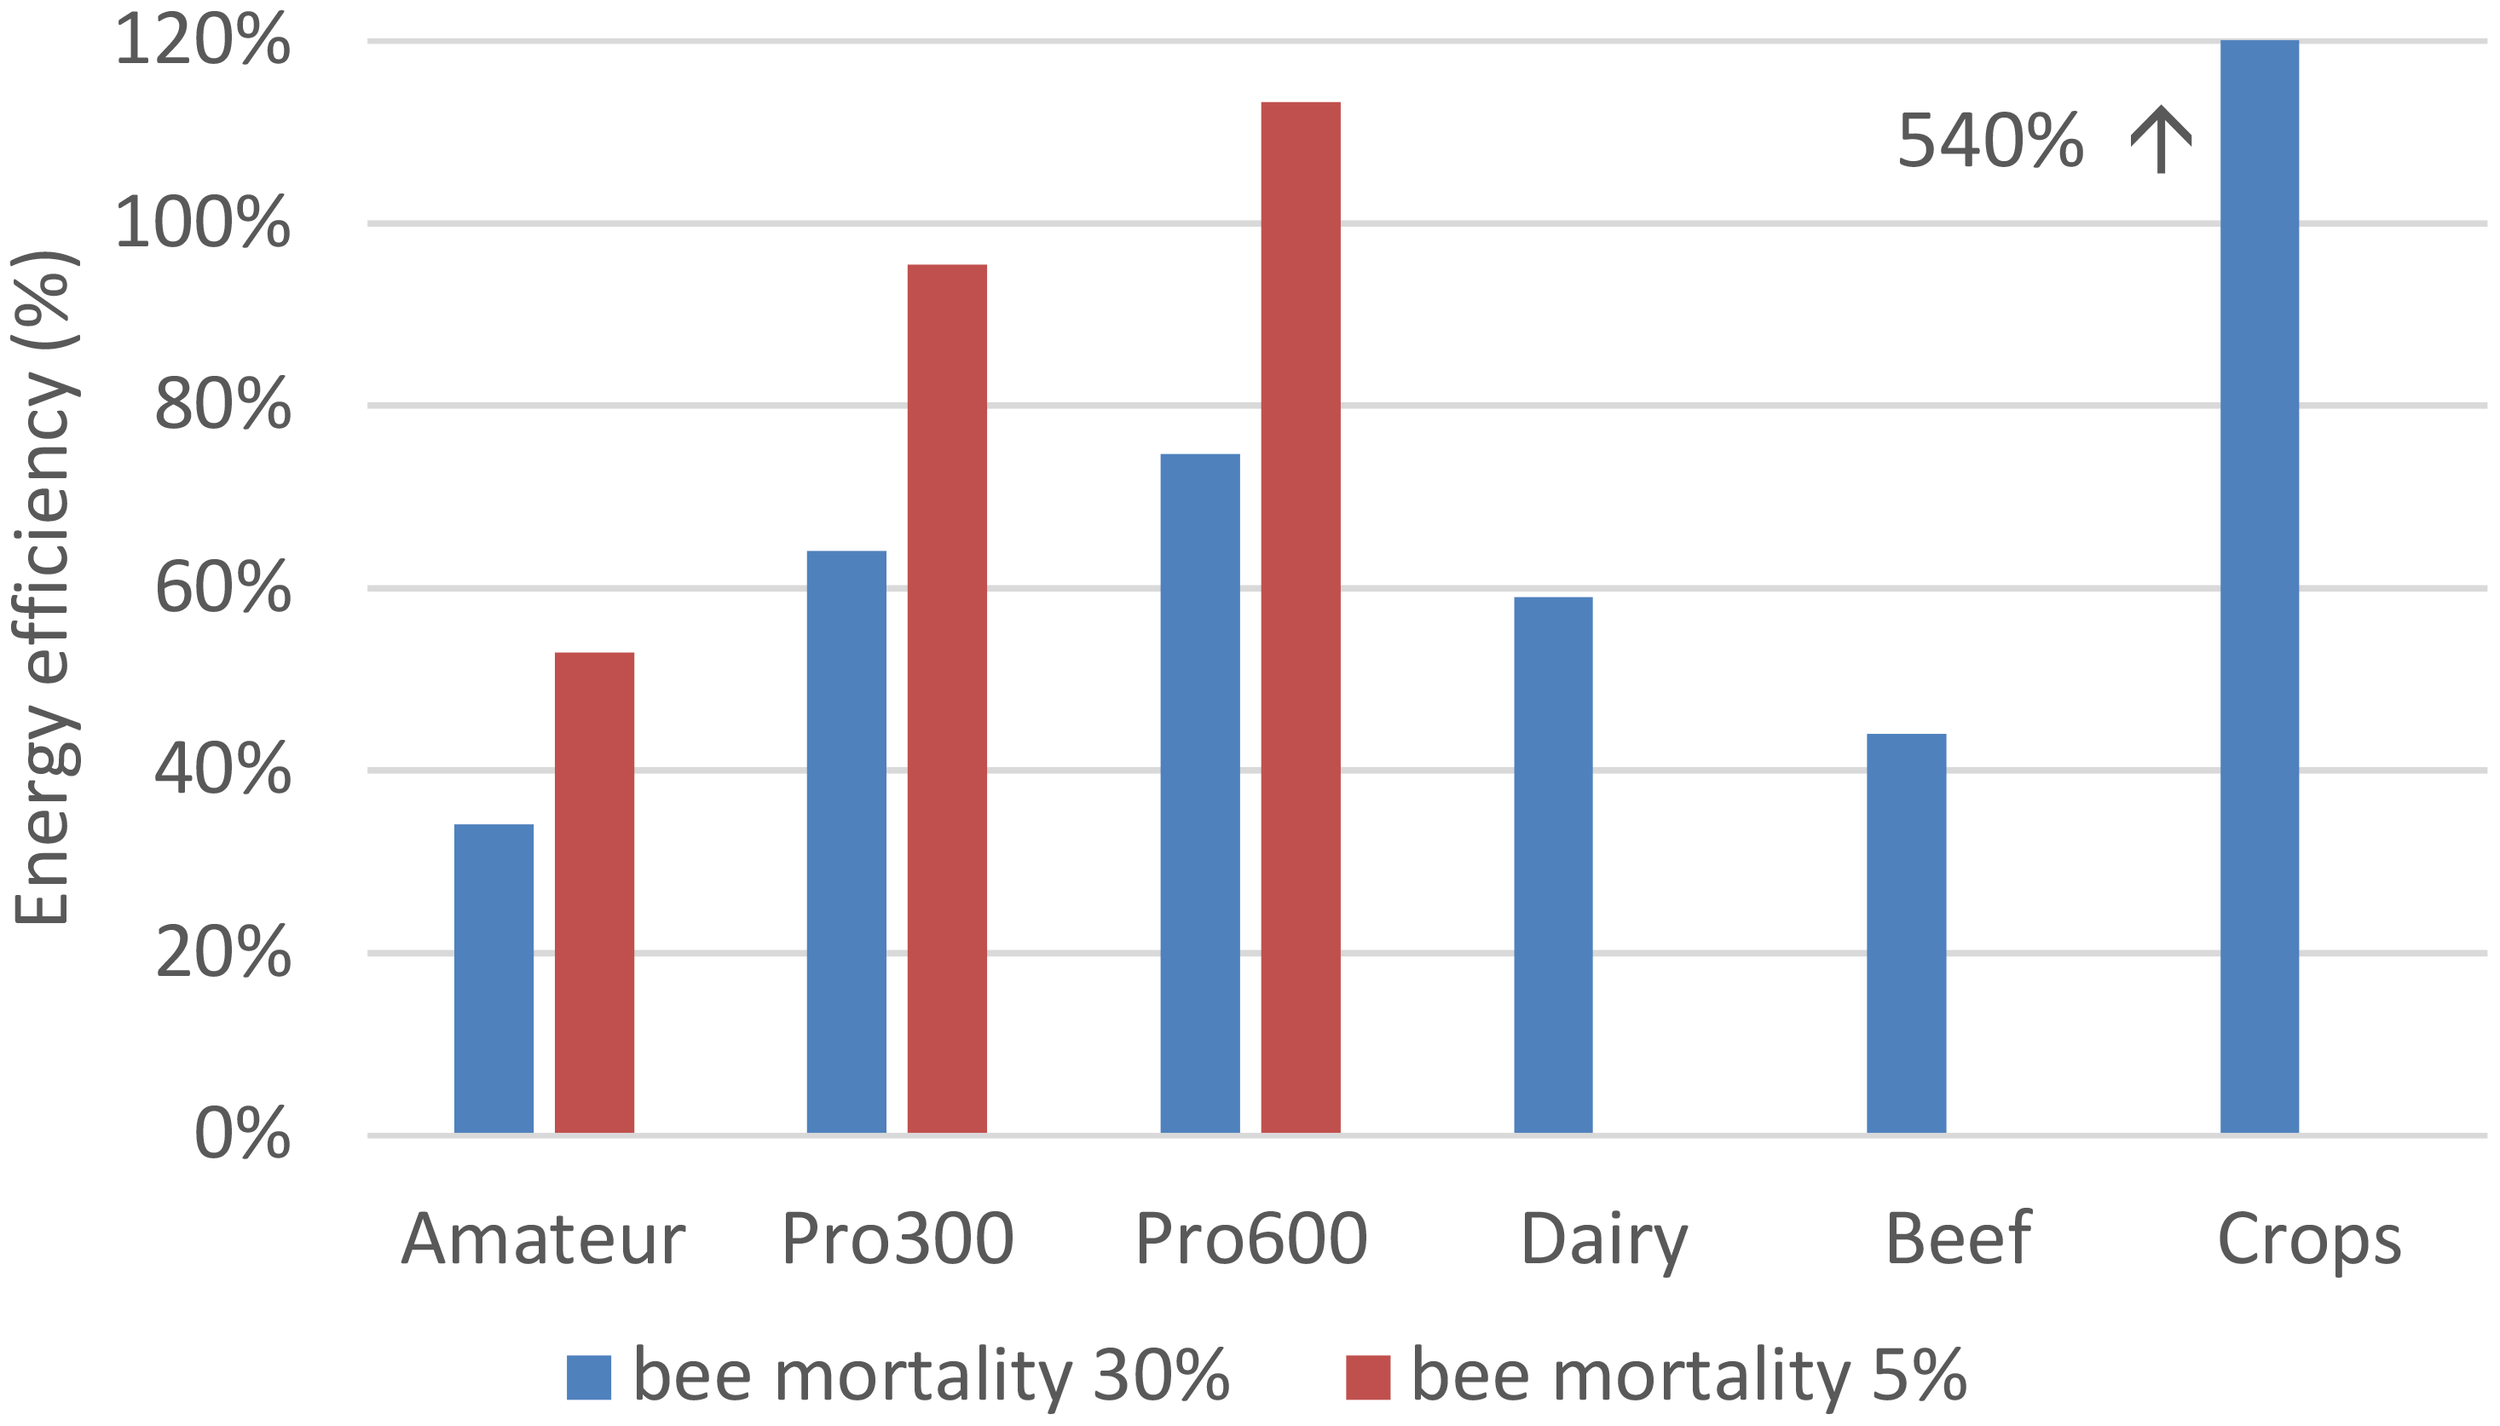
Comparison of the energy efficiency (MJ produced/MJ used) for amateur beekeeping system, Pro300, pro600 (professional beekeeping systems with 600 hives), dairy cattle, beef cattle and field crop production (average French data). Results for two levels of bee mortality (5% and 3%). Pro 300 and Pro 600 for professional beekeeping systems with 300 hives and 600 hives, respectively.
Overall, in terms of energy production, beekeeping systems result in the same order of magnitude or slightly higher amounts than those of dairy or suckler cattle. As far as greenhouse gas emissions are concerned, their balance is much better, with emissions being composed solely of CO2.
4.4 Bibliographical comparison
Pignagnoli et al. (2023) calculated an average value of 1.44 kg CO2eq/kg for Italian beekeeping systems, a value very close to that of Pro300, and, like us, identified transportation and feeding as the two main items. In another publication, Pignagnoli et al. (2010) presented figures of 1.40 to 2.20 kg CO2eq/kg of honey for transhumant systems. These figures overlap with the ranges established in the two studied systems (1.49 and 2.67 CO2eq/kg). For sedentary farmers, they provided figures of 0.38 to 0.48 kg CO2eq/kg of honey, which also correspond to our results showing that travel is the main contributor to the GHG balance, particularly for Amat (59% of the total).
Kendall et al. (2013) provides a range of values between 0.67 and 0.92 kg CO2eq/kg honey after an economic allocation between honey production and pollination services. Notably, the pollination service provided by bees is an economic activity in its own right in some North American contexts (Traynor, 2017) but not within the area where the types of farming we are studying are located.
Sillman et al. (2021) reported emissions of 0.65 kg CO2eq/kg of honey after allocation to pollen and broods but not to the pollination service. Considering this pollination service results in a negative balance.
Mujica et al. (2016) revealed a figure of 2.5 kg CO2eq/kg. However, their scope of analysis is broader than the one we have chosen. In their context, production is highly concentrated and is marketed for export, with the weight of the long-distance transportation of honey to ports being a significant factor in the overall balance. The honey transformation process is also highlighted as having a high weight, but it should be noted that the emission factor retained for the electricity used (0.479 t CO2/MWh) is higher than that retained in France (0.078 t CO2/MWh), where the share of nuclear power is very important.
Finally, our results are consistent with those reported in the international literature. However, this comparison shows that it is necessary to recall that the results we present are associated with the French context, with, for example, given hive travel distances, a marketing mode not taken into account (travel for honey delivery), and specific energy sources used, for electricity for example (partly decarbonized).
4.5 How to improve balance sheets?
We have shown that the variations in colony mortality are the determining factor for the levels of GHG emissions and energy consumption per kg of honey produced. Controlling it is therefore essential. The impact of animal mortality on the GHG emissions per unit of food produced is not specific to beekeeping and has been identified in all farming systems worldwide, particularly in relation to animal health management. According to Özkan et al. (2022), “The impacts of animal health conditions on GHG emissions are significant as they affect mortality, morbidity and productivity”. Indeed, Hristov et al. (2013) noted that, according to this most commonly used indicator, “reduced mortality and morbidity lead to greater saleable output, diluting GHG emissions per unit product”. Addressing the challenge of overcoming swarm mortality is therefore essential, both from an economic point of view and in terms of GHG emissions and energy consumption per kg of honey produced. The Asian hornet, which appeared in France in 2004, is now widespread throughout the country and beyond. It is responsible for significant mortality in beehives, and is a major concern for beekeepers. A great deal of research has been carried out, and a number of solutions are promising, in particular to keep hornets away from hives or to locate and destroy their nests but also solutions based on biological methods like the biocontrol method resulting from the project Beefeedis V2, which won a France2030 award (France 2030, 2025). The company Solu’Natur also won a France2030 award for its Bee’Full® product (France 2030, 2025), made up of additives designed to compensate for the lack of biodiversity in bee feed, helping to support the bee’s immune system and slow down the aging process, with the ultimate aim to limit bee mortality. This solution is associated which a method using qPCR analyses to identify and quantify pathogens present in bees with no apparent symptoms. This first step makes it possible to assess the risk of colony mortality and more precisely how soon this could occur. Immediate stimulation of the bees’ innate immunity at this stage of pathogen development makes it possible to significantly reduce them, or even eliminate, and thus avoid any risk of pathology for the colonies (Grosmond, 2024).
With respect to the cost of travel in terms of GHG emissions, it should be noted that most of this cost comes from fuel consumption, which is of fossil origin. The use of renewable fuels, particularly biofuels, could lead to significant gains in this area. The use of electric vehicles to reduce GHG emissions (LCAs) is nevertheless controversial, given the emissions associated with their manufacture (mainly batteries) and the origin of the electricity used. For example, there would be a gain in France, as opposed to Germany, where most electricity comes from coal combustion (Liu et al., 2013). In terms of the energy balance, the priority is to reduce the number of kilometers traveled.
Hive temperature regulation is also an indirect way to improve these balances, as it relies in part on bee activity, mobilizing either honey or sugar. Early works referred to the notion of regulating the hive temperature, which is sufficiently high to ensure the viability of the brood in winter, owing to the activity of the bees and their consumption of honey. As early as the 1940s, reference was made to the need to protect hives from cold to ensure the viability of colonies (Mesnard, 1943). Since then, numerous studies have highlighted the techniques used by bees in hives to ensure thermoregulation (Jarimi et al., 2020). This is linked to the optimization of apiary ventilation, with impacts, in particular, on the colony health status (Sudarsan et al., 2012). Villa et al. (1987) reported that honey consumption during the winter period averages 3 kg per brood for five cases in Africa and 2.3 kg per brood in Europe for a duration of 10 days at temperatures between −2°C and 10°C. By extrapolating these data to 150 days (winter period), we can estimate honey consumption amounts of 45.3 and 34.2 kg per brood, respectively, in African and European cases, i.e., on the order of marketed honey production per hive. Hive design aimed at reducing both heat loss in winter and excess temperatures in summer (which also leads to significant energy expenditures by the bees to ensure cooling) thus appears to be a decisive factor affecting both the health of the bees and their caloric intake requirements (sugar and/or honey), which are determining factors in the GHG and energy balances presented above. New hive concepts are emerging, such as the low-consumption hive proposed by Guillemain et al. (2023), which is based on observations of natural apiaries (tree trunks). Indeed, traditional beekeeping, whose Polish example is often cited, uses trunks as hives, with great interest for bees, particularly in terms of internal temperature regulation (Nawrocki, 2014). In France, equivalent practices exist, particularly in the Cévennes region, with the use of chestnut trunks (Elie and Aubert, 2009).
4.6 Climate change: strong impacts on these balances
Climate change results, among other effect, in large potential variations in temperatures—in particular, heat peaks and heatwaves—but also in rainfall, which can be lower but also potentially higher, punctually or over time. These phenomena, particularly the high temperatures combined with water deficits, can severely limit the resources available to bees for foraging and increase the risk of bee mortality. This scarcity of resources has a direct effect on the quantity of honey produced. Mechanically, if honey production is halved—as has already been observed during these phenomena and which will a priori be the case in 2024 in France—GHG emissions and MJ used per kg of honey (results presented above) are doubled, and the energy efficiency is halved.
5 Conclusion
These balances have been derived based on the average values for each of the systems compared, which are considered typical cases, particularly with respect to transportation distances, which can vary considerably from one case to another. The Pro300 professional system outperforms the Amat system, mainly owing to economies of scale in terms of travel (equipment and fuel) and produces significantly higher production per hive. The Amateur system is penalized by the high relative cost of fuel, linked to the very low economies of scale for travel. Closer proximity of the hives and the use of low-GHG emission vehicles are the two ways forward. Compared with those of Pro300, the results of Pro600, with optimized means of production (enhanced economies of scale), improved, with an 11.5% reduction in GHG emissions and a 14.3% reduction in energy consumption. Sugar and fuel represent the two main items in terms of GHG and energy balance. Breeding and honey processing equipment, with smaller contributions, are the third item, with a similar contribution from swarm purchases (based on a mortality rate of 30%). The Biodiv system, which is not very productive but is completely self-sufficient, cannot represent a large-scale production model; nevertheless, it offers excellent environmental performance in terms of GHGs, energy consumption and energy efficiency.
The sensitivity analysis revealed that, over the ranges of variation used for the factors considered, bee mortality has by far the greatest impact on the results of the GHG and energy balances per kg of honey. All costs in terms of GHG emissions and energy consumption were allocated to honey production, whereas pollination services were ignored. Indeed, even if this could have had a significant impact on the results, we do not have the necessary data for the contexts in which the hives studied are located. A comparison with other livestock production systems shows that the performance of these beekeeping systems is similar to that of dairy or beef cattle production in terms of energy consumption but is much better in terms of GHG emissions, in the absence of methane and fertilizer use, and without any impact on excreta, unlike ruminant livestock, for example. Furthermore, no emissions or energy consumption associated with the cultivation of the plants used (foraging) are considered, as any inputs used on these surfaces are allocated entirely to the corresponding plant production and not to bees.
Reducing bee mortality appears to be a major key to improving these balances; interesting approaches are now being proposed to overcome the invasion of asiatic hornets and, as far as pathological problems are concerned, methods of anticipation using qPCR method seem promising. Economies of scale for moving and visiting hives, and seeking to reduce the use of sugar, for example by improving the hives structure for better thermal insulation, are key ways of improving results. Systematic economic quantification of the pollination service could help to refine the calculated results and to improve them, both for the pollination of cultivated plants and that of wild species, in terms of the externalities generated, particularly from the point of view of maintaining the associated biodiversity.
The identification of these avenues for improving performance, both in terms of practices and methodology such as the allocation of services provided by bees, are elements that could be taken up by public decision-makers to promote virtuous beekeeping, which provides a very wide range of services to society.
Statements
Data availability statement
The original contributions presented in the study are included in the article/supplementary material. Further inquiries can be directed to the corresponding author.
Ethics statement
This study complies with the Code of Ethics and the principles of scientific integrity and ethics of the French National Research Institute for Agriculture, Food and Environment.
Author contributions
MB: Conceptualization, Data curation, Formal analysis, Methodology, Project administration, Supervision, Validation, Visualization, Writing – original draft, Writing – review & editing. GG: Conceptualization, Investigation, Methodology, Resources, Validation, Formal analysis, Writing – review & editing.
Funding
The author(s) declare that no financial support was received for the research and/or publication of this article.
Acknowledgments
We thank American Journal Experts (AJE) for improving the English writing.
Conflict of interest
GG has developed a bee mortality prevention kit based on qPCR analysis: PathoBeeFull+®. This kit is commercially available and is marketed by the company Solu’Nature, for which GG is a consultant.
The remaining author declares that the research was conducted in the absence of any commercial or financial relationships that could be construed as a potential conflict of interest.
Generative AI statement
The author(s) declare that no Generative AI was used in the creation of this manuscript.
Publisher’s note
All claims expressed in this article are solely those of the authors and do not necessarily represent those of their affiliated organizations, or those of the publisher, the editors and the reviewers. Any product that may be evaluated in this article, or claim that may be made by its manufacturer, is not guaranteed or endorsed by the publisher.
References
1
Benoit M. Mottet A. (2023). Energy scarcity and rising cost: Towards a paradigm shift for livestock. Agric. Syst.205, 103585. doi: 10.1016/j.agsy.2022.103585
2
Bjørn A. Owsianiak M. Molin C. Hauschild M. Z. (2018). “LCA history,” in Life cycle assessment: theory and practice. Eds. HauschildM. Z.RKR.OlsenS. I. (Springer International Publishing, Cham), 17–30. doi: 10.1007/978-3-319-56475-3_3
3
Bochu J. L. Bordet A. C. Métayer N. (2011). Références PLANETE 2010, fiche 10 - production « Bovins viande » (SOLAGRO), 9. Available at: https://solagro.org/medias/publications/f54_10refplanete2010bovinviande.pdf.
4
Bordet A. C. Bochu J. L. Trévisiol A. (2010). Références PLANETE 2010, Fiche 2- Production « Bovins lait strict » (SOLAGRO), 25. Available at: https://solagro.org/medias/publications/f46_2-refplanete2010blaitstrict.pdf.
5
Decourtye A. Alaux C. Le Conte Y. Henry M. (2019). Toward the protection of bees and pollination under global change: present and future perspectives in a challenging applied science. Curr. Opin. Insect Sci.35, 123–131. doi: 10.1016/j.cois.2019.07.008
6
Elie Y. Aubert J. L. (2009). Chronique des ruches-troncs, l’arbre aux abeilles. Editions GabriAndré, 4, 108p.
7
France 2030 (2025). 46 nouveaux lauréats pour investir dans une alimentation saine, durable et traçable. Dossier presse21. Available at: https://www.info.gouv.fr/upload/media/content/0001/13/0c2b5ea9de6faf05e682191b608d23abeb400481.pdf (Accessed February 15, 2025).
8
Gac A. Cariolle M. Deltour L. Dollé J. B. Espagnol S. Flénet F. et al . (2011). GES’TIM – des apports pour l’évaluation environnementale des activités agricoles. Innovations Agronomiques17, 83–94. doi: 10.17180/kccz-bn32ff.ffhal-02653118
9
Grosmond G. (2024). Mortalité hivernale à 30%, est-ce une fatalité? l’Abeille de France. Available online at: https://solunature.fr/wp-content/uploads/2024/04/ADF_1121-mars-Sanitaire.pdf (Accessed February 15, 2025).
10
Guillemain M. Merit D. Riondet J. (2023). La ruche basse consommation d’énergie. Une révolution apicole, 120.
11
Hristov A. N. Ott T. Tricarico J. Rotz A. Waghorn G. Adesogan A. et al . (2013). SPECIAL TOPICS — Mitigation of methane and nitrous oxide emissions from animal operations: III. A review of animal management mitigation options1. J. Anim Sci.91, 5095–5113. doi: 10.2527/jas.2013-6585
12
IDELE (2024). Qu’est-ce qu’un cas-type? Définition, construction et usage. Available online at: https://idele.fr/?eID=cmis_download&oID=workspace%3A%2F%2FSpacesStore%2F47765ac8-8136-4ed1-b68d-7181c1ca1a89&cHash=4daf1886481590b5107c0d60986c927f (Accessed July, 22 2024).
13
Jarimi H. Tapia-Brito E. Riffat S. (2020). A review on thermoregulation techniques in honey bees’ (Apis mellifera) beehive microclimate and its similarities to the heating and cooling management in buildings. Future Cities Environ.6, (1). doi: 10.5334/fce.81
14
Kendall A. Yuan J. Brodt S. B. (2013). Carbon footprint and air emissions inventories for US honey production: case studies. Int. J. Life Cycle Assess.18, 392–400. doi: 10.1007/s11367-012-0487-7
15
Kouchner C. Ferrus C. Blanchard S. Decourtye A. Basso B. Le Conte Y. et al . (2019). Bee farming system sustainability: An assessment framework in metropolitan France. Agric. Syst.176, 102653. doi: 10.1016/j.agsy.2019.102653
16
Laurent M. (2023).Enquête nationale de mortalité hivernale des colonies d’abeilles en métropole durant l’hiver 2021-2022. Premiers résultats. In: Plateforme ESA (Epidémiosurvaillance santé animale). Available online at: https://www.plateforme-esa.fr/sites/default/files/2023-11/enmha_2021-2022_resultats_correction_2023_vf.pdf (Accessed August 01, 2024).
17
Lindstrom S. A. Herbertsson L. Rundlof M. Smith H. G. Bommarco R. (2016). Large-scale pollination experiment demonstrates the importance of insect pollination in winter oilseed rape. Oecologia180, 759–769. doi: 10.1007/s00442-015-3517-x
18
Liu S. Tao R. Tam C. M. (2013). Optimizing cost and CO2 emission for construction projects using particle swarm optimization. Habitat Int.37, 155–162. doi: 10.1016/j.habitatint.2011.12.012
19
Mesnard L. (1943). Les sources de chaleur et la régulation thermique dans la ruche. Bull. l’Académie Vétérinaire France96, 177–179. doi: 10.3406/bavf.1943.15046
20
Metayer N. Bochu J. L. Bordet A. C. Trevisiol A. (2010).Références PLANETE 2010. In: Fiche 3 – Production « Grandes cultures strict ». Available online at: https://solagro.org/images/imagesCK/files/publications/f47_3refplanete2010gc.pdf (Accessed 02/01/2023).
21
Mujica M. Blanco G. Santalla E. (2016). Carbon footprint of honey produced in Argentina. J. Cleaner Production116, 50–60. doi: 10.1016/j.jclepro.2015.12.086
22
Nawrocki P. (2014). Tree beekeeping in Poland, some history. Available online at: https://bienenbotschaft.de/wp-content/uploads/2018/12/tree-beekeeping-in-Poland_history-3.pdf (Accessed July 17, 2024).
23
Özkan Ş. Teillard F. Lindsay B. Montgomery H. Rota A. ,. P. G. Dhingra M. et al . (2022). The role of animal health in national climate commitments (Rome: FAO), 36. doi: 10.4060/cc0431en
24
Patel V. Pauli N. Biggs E. Barbour L. Boruff B. (2021). Why bees are critical for achieving sustainable development. Ambio50, 49–59. doi: 10.1007/s13280-020-01333-9
25
Pignagnoli A. Pignedoli S. Carpan E. Costa C. Dal Prà A. (2010). Carbon footprint of honey in different beekeeping systems. Sustainability13, (11063). doi: 10.3390/su131911063
26
Pignagnoli A. Pignedoli S. Carpana E. Costa C. Dal Pra A. (2023). Greenhouse gas (GHG) emissions from honey production: two-year survey in italian beekeeping farms. Animals: an Open Access J. MDPI13, (4). doi: 10.3390/ani13040766
27
Sillman J. Uusitalo V. Tapanen T. Salonen A. Soukka R. Kahiluoto H. (2021). Contribution of honeybees towards the net environmental benefits of food. Sci. Total Environ.756, 143880. doi: 10.1016/j.scitotenv.2020.143880
28
SOLAGRO (2009). Dia’terre. https://solagro.org/travaux-et-productions/outils/dia-terre (Accessed February 22, 2023).
29
Sudarsan R. Thompson C. Kevan P. G. Eberl H. J. (2012). Flow currents and ventilation in Langstroth beehives due to brood thermoregulation efforts of honeybees. J. Theor. Biol.295, 168–193. doi: 10.1016/j.jtbi.2011.11.007
30
Traynor J. (2017). A history of almond pollination in california. Bee World94, 69–79. doi: 10.1080/0005772x.2017.1353273
31
Villa J. D. Gentry C. Taylor O. R. (1987). Preliminary observations on thermoregulation, clustering, and energy utilization in african and european honey bees. J. Kansas Entomological Soc.60, 4–14.
32
Warré E. (1948). L’apiculture pour tous. 235. Editions Coyote, 235p. Available online at: https://freethebees.ch/wp-content/uploads/2017/12/Apiculture-pour-tous.pdf.
Summary
Keywords
life cycle assessment, energy efficiency, bees, honey, mortality
Citation
Benoit M and Grosmond G (2025) Analysis of the greenhouse gas emissions and energy consumption in beekeeping: what are the sensitivity factors?. Front. Anim. Sci. 6:1524343. doi: 10.3389/fanim.2025.1524343
Received
07 November 2024
Accepted
09 April 2025
Published
08 May 2025
Volume
6 - 2025
Edited by
Francisco Javier Navas González, University of Cordoba, Spain
Reviewed by
Elio Romano, Centro di ricerca per l’Ingegneria e le Trasformazioni agroalimentari (CREA-IT), Italy
Brandon Hopkins, Washington State University, United States
Updates
Copyright
© 2025 Benoit and Grosmond.
This is an open-access article distributed under the terms of the Creative Commons Attribution License (CC BY). The use, distribution or reproduction in other forums is permitted, provided the original author(s) and the copyright owner(s) are credited and that the original publication in this journal is cited, in accordance with accepted academic practice. No use, distribution or reproduction is permitted which does not comply with these terms.
*Correspondence: Marc Benoit, marc-p.benoit@inrae.fr
†ORCID: Marc Benoit, orcid.org/0000-0001-6190-866X; Gilles Grosmond, orcid.org/0009-0009-5398-2988
Disclaimer
All claims expressed in this article are solely those of the authors and do not necessarily represent those of their affiliated organizations, or those of the publisher, the editors and the reviewers. Any product that may be evaluated in this article or claim that may be made by its manufacturer is not guaranteed or endorsed by the publisher.