 Panduranga Reddy Punuru1Vinoo Regula2
 Muralidhar Metta3
 Sudhakar Krovvidi2Jaya Madhuri Bhumireddy2Prasanna Baratam2Vani Sunkara1
 Ravikanth Reddy Poonooru1,4*
- 1College of Veterinary Science, Sri Venkateswara Veterinary University, Proddatur, Andhra Pradesh, India
- 2NTR College of Veterinary Science, Sri Venkateswara Veterinary University, Gannavaram, Andhra Pradesh, India
- 3College of Veterinary Science, Sri Venkateswara Veterinary University, Garividi, Andhra Pradesh, India
- 4Division of Animal Sciences, University of Missouri, Columbia, MO, United States
Introduction: The vast genetic diversity of Indian sheep in semi-arid regions remains largely unexplored, posing difficulties in conservation and sustainable management. Genetic characterization is essential for safeguarding these breeds and designing selective breeding strategies to enhance their resilience and productivity. To bridge this knowledge gap, an investigation was undertaken to genetically characterize different populations of semi-arid sheep (Nellore breed Palla, Brown, and Jodipi phenotypic strains, Macherla and Vizianagaram sheep) from India through microsatellite loci and to explore their genetic divergence.
Methods: Blood samples and genetic data from five distinct sheep populations were collected from 672 shepherds across 162 flocks. To ensure a thorough genetic characterization, thirty microsatellite markers were utilized. Genetic diversity and population structure were then analyzed using MICROCHECKER, LDNe, STRUCTURE, and Genepop.
Results and Discussion: Vizianagaram sheep population displayed the highest allele count (276) with a mean allele number of 12.545, while Nellore Palla had the lowest allele count (205) with a mean allele number of 9.318. Private alleles identified in the populations were 22, 33, 48, 57, and 41 for Macherla, Nellore Brown, Nellore Jodipi, Vizianagaram, and Nellore Palla sheep, respectively. The mean observed heterozygosity (Ho) values ranged from 0.587 to 0.732, while the expected heterozygosity (He) values ranged from 0.692 to 0.769 among the populations studied. The microsatellite markers demonstrated a high level of polymorphism, with the Polymorphic Information Content (PIC) value ranging from 0.61 to 0.85. The most notable genetic differentiation among the populations investigated was observed between Vizianagaram and Palla sheep, as evidenced by a high FST value of 0.180. Conversely, the lowest genetic differentiation was recorded between Macherla and Nellore Brown sheep, with an FST value of 0.011. Nei’s unbiased genetic distance varied across populations, with the highest distance observed between Nellore Palla and Vizianagaram sheep (0.926) and the lowest between Macherla and Nellore Brown sheep (0.032), complementing the results of genetic differentiation using FST value. Bottleneck analysis conducted across all populations revealed an abundance of low-frequency alleles, suggesting the absence of recent bottlenecks. Effective population size is optimum in all populations except Nellore Palla and Brown sheep. Structure analysis and factorial correspondence analysis revealed that the five sheep populations under study were distributed into three distinct clusters, with Palla forming a separate cluster. Furthermore, the results of principal component analysis demonstrated that Palla sheep formed a separate sub-cluster within the cluster containing Brown and Macherla sheep. The findings provide valuable insights for conservation and sustainable utilization of the sheep populations for breeding programs.
Introduction
The livestock sector in India serves as a cornerstone of the agricultural economy, providing sustenance and livelihoods to millions while bolstering the nation’s food security. Among the group of livestock species, sheep farming emerged as a quintessential and economically pivotal practice. Indigenous sheep breeds scattered across India’s diverse landscapes are emblematic of centuries of natural selection, finely adapted to thrive amidst the country’s varied agroecological tapestry. Their remarkable adaptability to harsh environments not only underscores their innate resilience but also positions them as indispensable assets for fostering sustainable livestock production systems. Andhra Pradesh stands is the second most populous state for sheep in India, boasting a staggering 17.6 million ovine residents as of 2019, according to the Department of Animal Husbandry and Dairying (DAHD, 2019). This remarkable figure emphasizes the integral role of sheep farming within the state’s agricultural landscape.
The genesis of this blooming sheep population can be traced back to Andhra Pradesh’s rich agro-climatic conditions and deeply rooted cultural practices, which have nurtured the development of diverse sheep populations over centuries (Reddy et al., 2018). Among these, the Nellore breed reigns supreme, showcasing a spectrum of genetic diversity within its three distinct strains, namely, Nellore Jodipi, Nellore Brown, and Nellore Palla. Nellore Jodipi sheep are primarily found in the united Chittoor and Nellore districts, while Nellore Brown sheep inhabit YSR, Kurnool, and few mandals in Anantapur district. Nellore Palla sheep, on the other hand, are exclusive to Atmakur taluk of Nellore district. Beyond the prominence of the Nellore breed, Andhra Pradesh hosts a mosaic of locally adapted genetic groups of sheep that have evolved in response to the region’s varied environmental conditions. Macherla sheep, thriving along the coastal regions adjacent to the Krishna River, particularly in Guntur, Prakasam, and Krishna districts of Andhra Pradesh, as well as Nagar Kurnool and parts of Nalgonda district in Telangana; and the Nagavali or Vizianagaram sheep in the north coastal belt, including Visakhapatnam, Vizianagaram, and Srikakulam districts epitomize this diversity. These indigenous sheep populations embody centuries of adaptation to their specific ecological niches, from navigating coastal terrains to enduring fluctuating temperatures. Such adaptation highlights the resilience and versatility ingrained within these breeds, making them vital assets for sustainable livestock production in Andhra Pradesh.
This region is characterized by a hot and humid coastal climate, transitioning into a semi-arid southern peninsular zone. Its topography and landscape are diverse, consisting of mountain ranges, plateaus, deltas and plains. Sheep in this region are primarily raised for meat production and produce coarse, hairy fleece (https://www.dahd.nic.in). Macherla sheep exhibit a bicolour coat pattern of white with black markings. Nellore Brown sheep have a uniform brown coat, while Palla sheep possess an entirely white coat colour. Nellore Jodipi sheep are characterized by white coat with black pigmentation localized on the legs, ventral abdomen, ears, and the base of the horns. Similarly, Vizianagaram sheep have black patches on a white coat, typically concentrated on the head, neck, and legs (Prasanna, 2019). Macherla sheep have white coat with black patches. The mean adult body weight across these five sheep breeds ranges from 28 kg to 47.85 kg, with North Coastal sheep exhibiting the lowest weight (28 kg; Prasanna, 2019) and Macherla sheep the highest (47.85 kg; Reddy et al., 2021). Although the height of all sheep populations is comparable, Macherla sheep exhibit a more pronounced muscular build than the others.
Their significance extends beyond mere livestock numbers, particularly in marginalized areas unsuitable for conventional agriculture. These unrecognized breeds play a crucial role in ensuring food security and providing sustainable livelihood opportunities for communities. However, despite their invaluable contributions, many of these unrecognized genetic groups remain uncharacterized, posing a challenge to their conservation and sustainable utilization. Recognizing this gap, there has been a surging interest in unravelling the genetic makeup and diversity patterns of these local sheep populations. Genetic characterization holds immense importance not only for conservation endeavours but also for devising targeted breeding programs aimed at enhancing productivity and adaptability to evolving environmental conditions (Phookan et al., 2024). Moreover, insights drawn from genetic diversity studies hold promise in safeguarding the unique genetic heritage of these invaluable resources for future generations. By integrating traditional knowledge with modern genetic techniques, efforts to characterize and conserve Andhra Pradesh’s indigenous sheep breeds are assured to foster resilience, sustainability, and food security within the state’s agricultural landscape.
Molecular markers, particularly microsatellites, are indispensable tools for analyzing genetic variation within and among sheep breeds. Their abundance, high level of repeat-number polymorphism, and co-dominant inheritance make microsatellite markers well-suited for a variety of applications, including genome mapping, phylogenetic inference, and population genetics in farm animals. Understanding the genetic variety of indigenous sheep can lead to effective conservation initiatives, breeding programs, and management policies (Sharma et al., 2020). Thus, microsatellite markers play a crucial role in unravelling the genetic diversity and structure of local sheep populations, providing essential insights for their conservation and management in Andhra Pradesh and beyond. Hence, the present study was carried out with an objective to characterize five sheep populations of Andhra Pradesh genetically and to study the amount of divergence between these genetic groups.
Material and methods
Sampling locations and flock management
The geographical and climatic description of the sampling sites is provided in Supplementary File 1. In the present study, data of five sheep populations were collected from 672 shepherds belonging to 162 flocks. The average flock size of the genetic groups identified in the present study is 61.11 ± 1.32 with a range of 20 to 148. Majority of the farmers are following complete migratory system while the remaining very few are providing shelter only at the nighttime. Majority of the sheep habitations are having thatched roofs and asbestos tiled roofs with kutcha type flooring. The shepherds protect the lambs during nighttime using big bamboo baskets. The most common practice of feeding was grazing in the fields viz. waste barren lands, road-side grasses, forest lands and harvested fields whereas, very few shepherds supplement breeding rams and ram lambs using grains. Majority of shepherds are well-versed with deworming practices and are deworming their sheep thrice a year and all the farmers are immunizing their sheep regularly. Ewes lambed round the year as the breeding rams always remain with ewes during grazing and penned together with a male to female ratio of 1:39.27. The annual income of majority of shepherds is less than one lakh.
Sample collection
Blood samples were collected from unrelated animals of the Macherla (32), Nellore Brown (32), Nellore Jodipi (48), Nellore Palla (32), and Vizianagaram (48) sheep populations of both sexes from the farmer-managed flocks within their breeding areas (Figure 1) from 2017-18. About 5ml of blood was collected from the Jugular vein of these sheep, into EDTA-coated tubes. These tubes were promptly stored in iceboxes and subsequently at -20°C until DNA extraction was performed at department of Animal Genetics and Breeding, NTR College of Veterinary Science, Gannavaram. DNA isolation from the blood samples was done using high salt method (Miller et al., 1988) with modifications to suit the lab conditions by adding chloroform and isoamyl alcohol for organic extraction to improve the purity of DNA. Quality and quantity of DNA was estimated using agarose gel electrophoresis (1 per cent) and Nanodrop™ 2000/2000c (Thermo fisher scientific, USA) respectively.
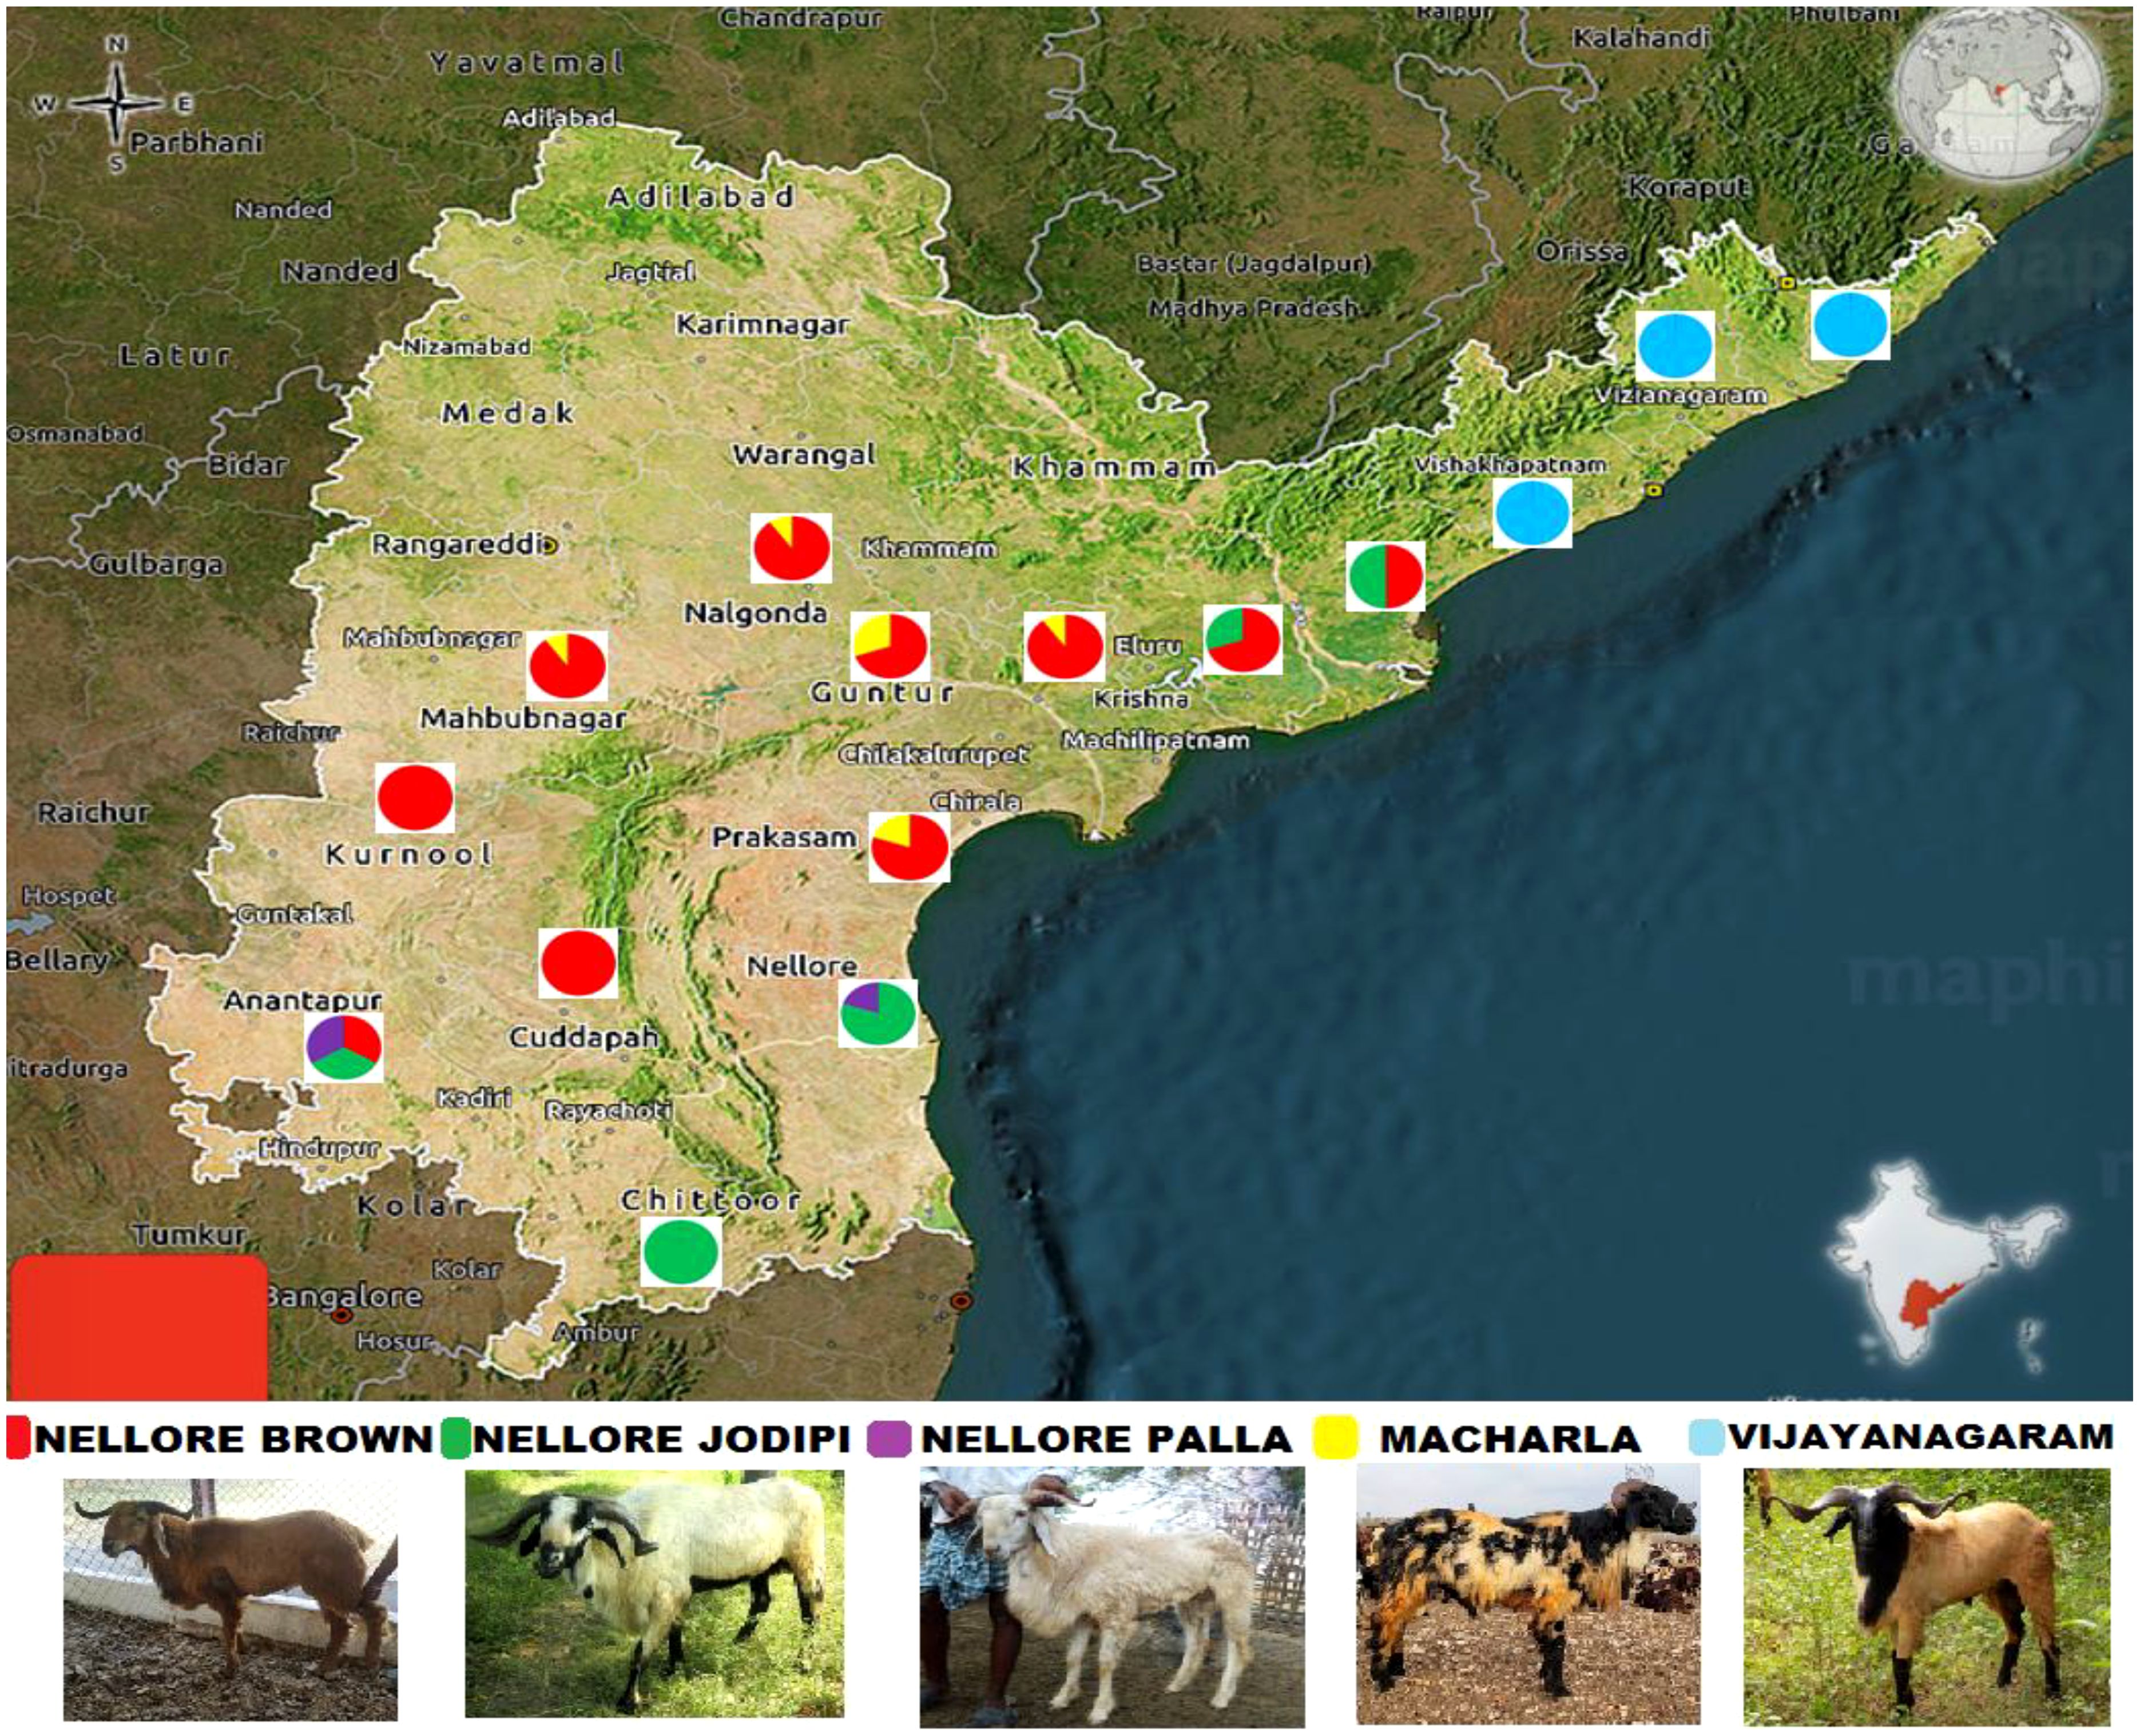
Figure 1. Geographical distribution of sheep population of Andhra Pradesh.
Microsatellite genotyping
In the present study, adherence to the recommendations provided by the ISAG-FAO Advisory Group on Animal Genetic Diversity (FAO, 2011) was paramount. To achieve a comprehensive characterization of sheep populations, a panel comprising thirty microsatellite markers was utlilized which were designed and procured from Eurofins genomic Pvt. ltd. Bengalore. These loci were organized into ten distinct panels to facilitate throughput multiplex genotyping. The list of primers used along with their sequences, fluorescent labels and annealing temperatures are presented in Supplementary File 2. The forward primers of these markers were labeled with fluorophores, specifically FAM (6-carboxyfluorescein), HEX (Hexachloro-6-carboxyfluorescent), or TAMRA (5-carboxytetramethylrhodamine). DNA samples were subjected to amplification of the microsatellite loci by employing the ProFlex PCR system from Applied Biosystems, using 5 pmol of each forward and reverse primer in a 96-well plate format. These panels were meticulously designed to ensure that none of the microsatellites shared the same size range or fluorophore dye. Following the amplification, the resulting PCR amplicons were genotyped using the ABI-3730XL capillary electrophoresis unit at AgriGenome Labs Pvt Ltd. Kerala, India. Subsequently, the genotypic data obtained was analyzed using Genemapper 5.0 software from Applied Biosystems, USA, facilitating the accurate determination of allele sizes and genotypic profiles across the sheep populations under investigation.
Analyses of genetic diversity and structure
MICROCHECKER software was utilized to examine potential sources of error such as large allele dropout, stutter bands, and null alleles in the microsatellite data. Loci that exhibited amplification failure in more than 10 per cent of individuals, as well as individuals with over 10 per cent dropout rates, were removed from further analysis to mitigate bias. After filtering, data on 22 loci was formatted in GenALEx 6.5 input file format for subsequent analysis. Various population genetic parameters were calculated (Peakall and Smouse, 2012), including the number of alleles per locus (Na), mean number of alleles, effective number of alleles (Ne), allele frequency, observed heterozygosity (Ho), expected heterozygosity (He), Nei genetic distance, Hardy-Weinberg equilibrium, and analysis of molecular variance (AMOVA). To know the inbreeding status of the populations, effective population size was estimated using LDNe ver.1.3 package (Waples, 2006).
Polymorphic information content (PIC) was calculated using MolKin 3.0 software (Gutiérrez and Goyache, 2009). The Bottleneck program (Cornuet and Luikart, 1996) was used to detect past bottleneck events in the studied sheep populations. The analysis tested deviations from mutation-drift equilibrium under three mutation models: the Infinite Allele Model including IAM (Kimura and Crow, 1964), the Stepwise Mutation Model (SMM; Ohta and Kimura, 1973), and the Two-Phase Model (TPM; Di Rienzo et al., 1994). Sign and Wilcoxon tests were performed to assess significance. Principal component analysis (PCoA) and Factorial correspondence analysis and neighbour-joining tree construction were conducted using GENETIX and DARwin software, respectively, to visualize genetic relationships among populations.
Population structure was analyzed using STRUCTURE software (v2.3.4) under an admixture model with correlated allele frequencies among breeds. Burn-in and Monte Carlo Markov Chain (MCMC) simulations were set to 200,000 and 100,000 iterations, respectively, with 10 independent runs for each number of clusters (K ranging from 2 to 6). Results were processed using STRUCTURE HARVESTER (Evanno et al., 2005) to estimate the likelihood membership coefficient (ΔK) and determine the most probable number of clusters. Dendogram was constructed using Genepop (V.4.7.5) to analyze the genetic diversity among the populations.
Results
Allelic diversity
Loci that were not amplified in more than 10 percent of the individuals with more than 10 percent dropout of alleles were eliminated from further analysis to avoid the bias in the results. Finally, data from 22 microsatellites was included for the further analysis. Across the examined sheep populations, a diverse range of alleles was identified, with varying counts across the populations, Macherla (217), Nellore Brown (221), Nellore Palla (205), Nellore Jodipi (263), and Vizianagaram (276) sheep. Population wise statistics are given in Table 1, while the overall microsatellite loci statistics across all populations are provided in Table 2. The mean of observed number of alleles per locus was 9.864, 10.045, 11.955, 12.545 and 9.318 for Macherla, Nellore Brown, Nellore Jodipi, Vizianagaram and Nellore Palla. Microsatellite loci displayed notable genetic variation, with the number of alleles (Na) ranging from 3 (BM1329, Macherla, DMSY1 and BM1329, Palla) to 30 (BM1329, Jodipi) across populations. Effective number of alleles (Ne) were estimated at 4.618 (Macherla), 4.525 (Nellore Brown), 4.034 (Nellore Palla), 5.488 (Nellore Jodipi) and 5.535 (Vizianagaram). When considering all populations together, the observed alleles ranged from 6 (SRCRSP1, SRCRSP9) to 17 (OarJMP58) with a mean of 10.59, while the mean of effective alleles ranged from 2.3 (SRCRSP1) to 6.93 (MAF65).

Table 1. Mean and SE over loci for each population.
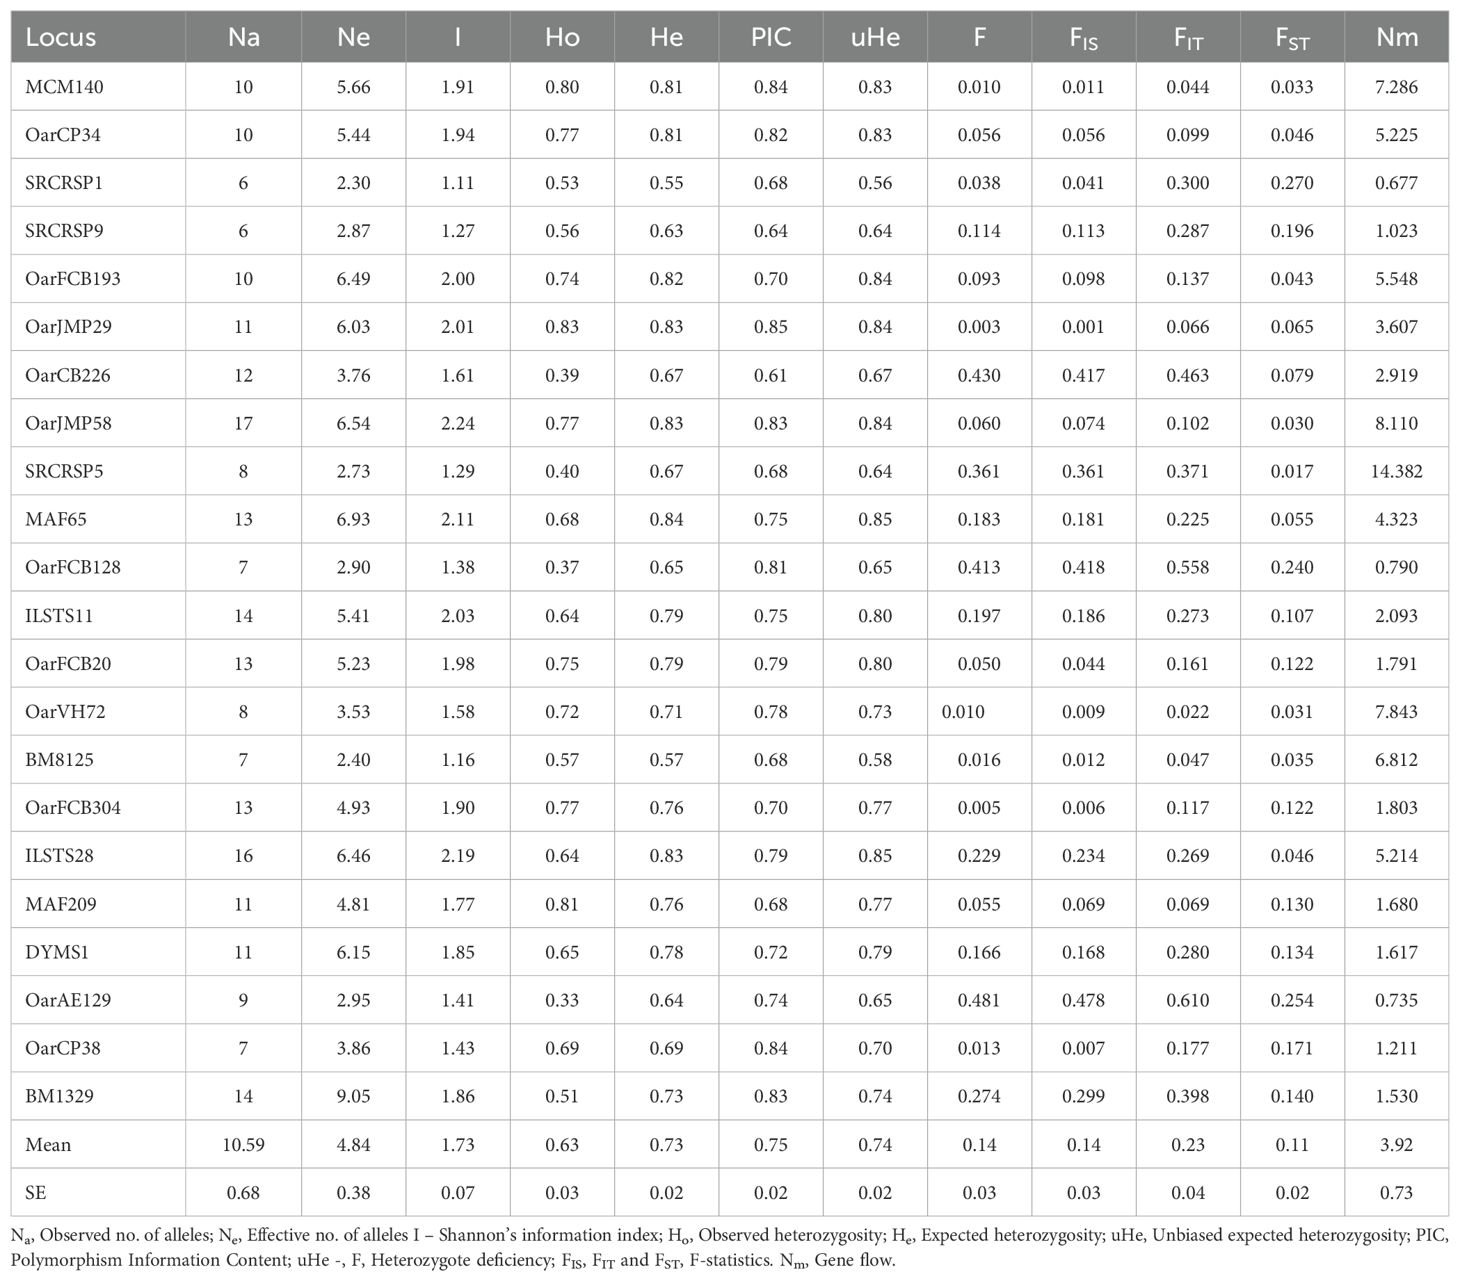
Table 2. Mean and SE over populations for each locus.
Polymorphism information content
The PIC values across the studied sheep populations ranged from 0.37 (BM1329 in Nellore Palla) to 0.92 (DYMS1 in Nellore Brown), as shown in Table 2. Notably, a substantial proportion of PIC values exceeded 0.6, indicative of the markers’ robust discriminatory power and suitability for genetic diversity analyses.
Heterozygosity
The overall observed and expected heterozygosities were 0.633 and 0.735 respectively. The mean observed heterozygosity (H0) and the gene diversity (He) values ranged from 0.542 (Palla) to 0.732 (Vizianagaram) and 0.692 (Palla) to 0.769 (Vizianagaram) as presented in Table 1. Notably, the average observed heterozygosity was consistently lower than expected across all sheep populations. Significant deviations from Hardy-Weinberg equilibrium were observed in 16, 18, 18, 11, and 14 loci out of 25 loci in Macherla, Nellore Brown, Nellore Palla, Vizianagaram and Nellore Jodipi sheep, respectively. These deviations suggest non-random mating patterns within the populations, indicating departures from the expected equilibrium of allele frequencies in a randomly mating population. All examined populations showed significant deviations from Hardy-Weinberg equilibrium.
Bottleneck effects on the populations
The mode-shift analysis revealed a typical L-shaped allele frequency distribution, as shown in Figure 2. Results from the Infinite Allele Model (IAM), Stepwise Mutation Model (SMM), and Two-Phase Model (TPM), along with mode-shift analysis and effective population size estimates (Table 1), indicated no recent reduction in population size among local sheep populations of Andhra Pradesh, suggesting the absence of a bottleneck effect.
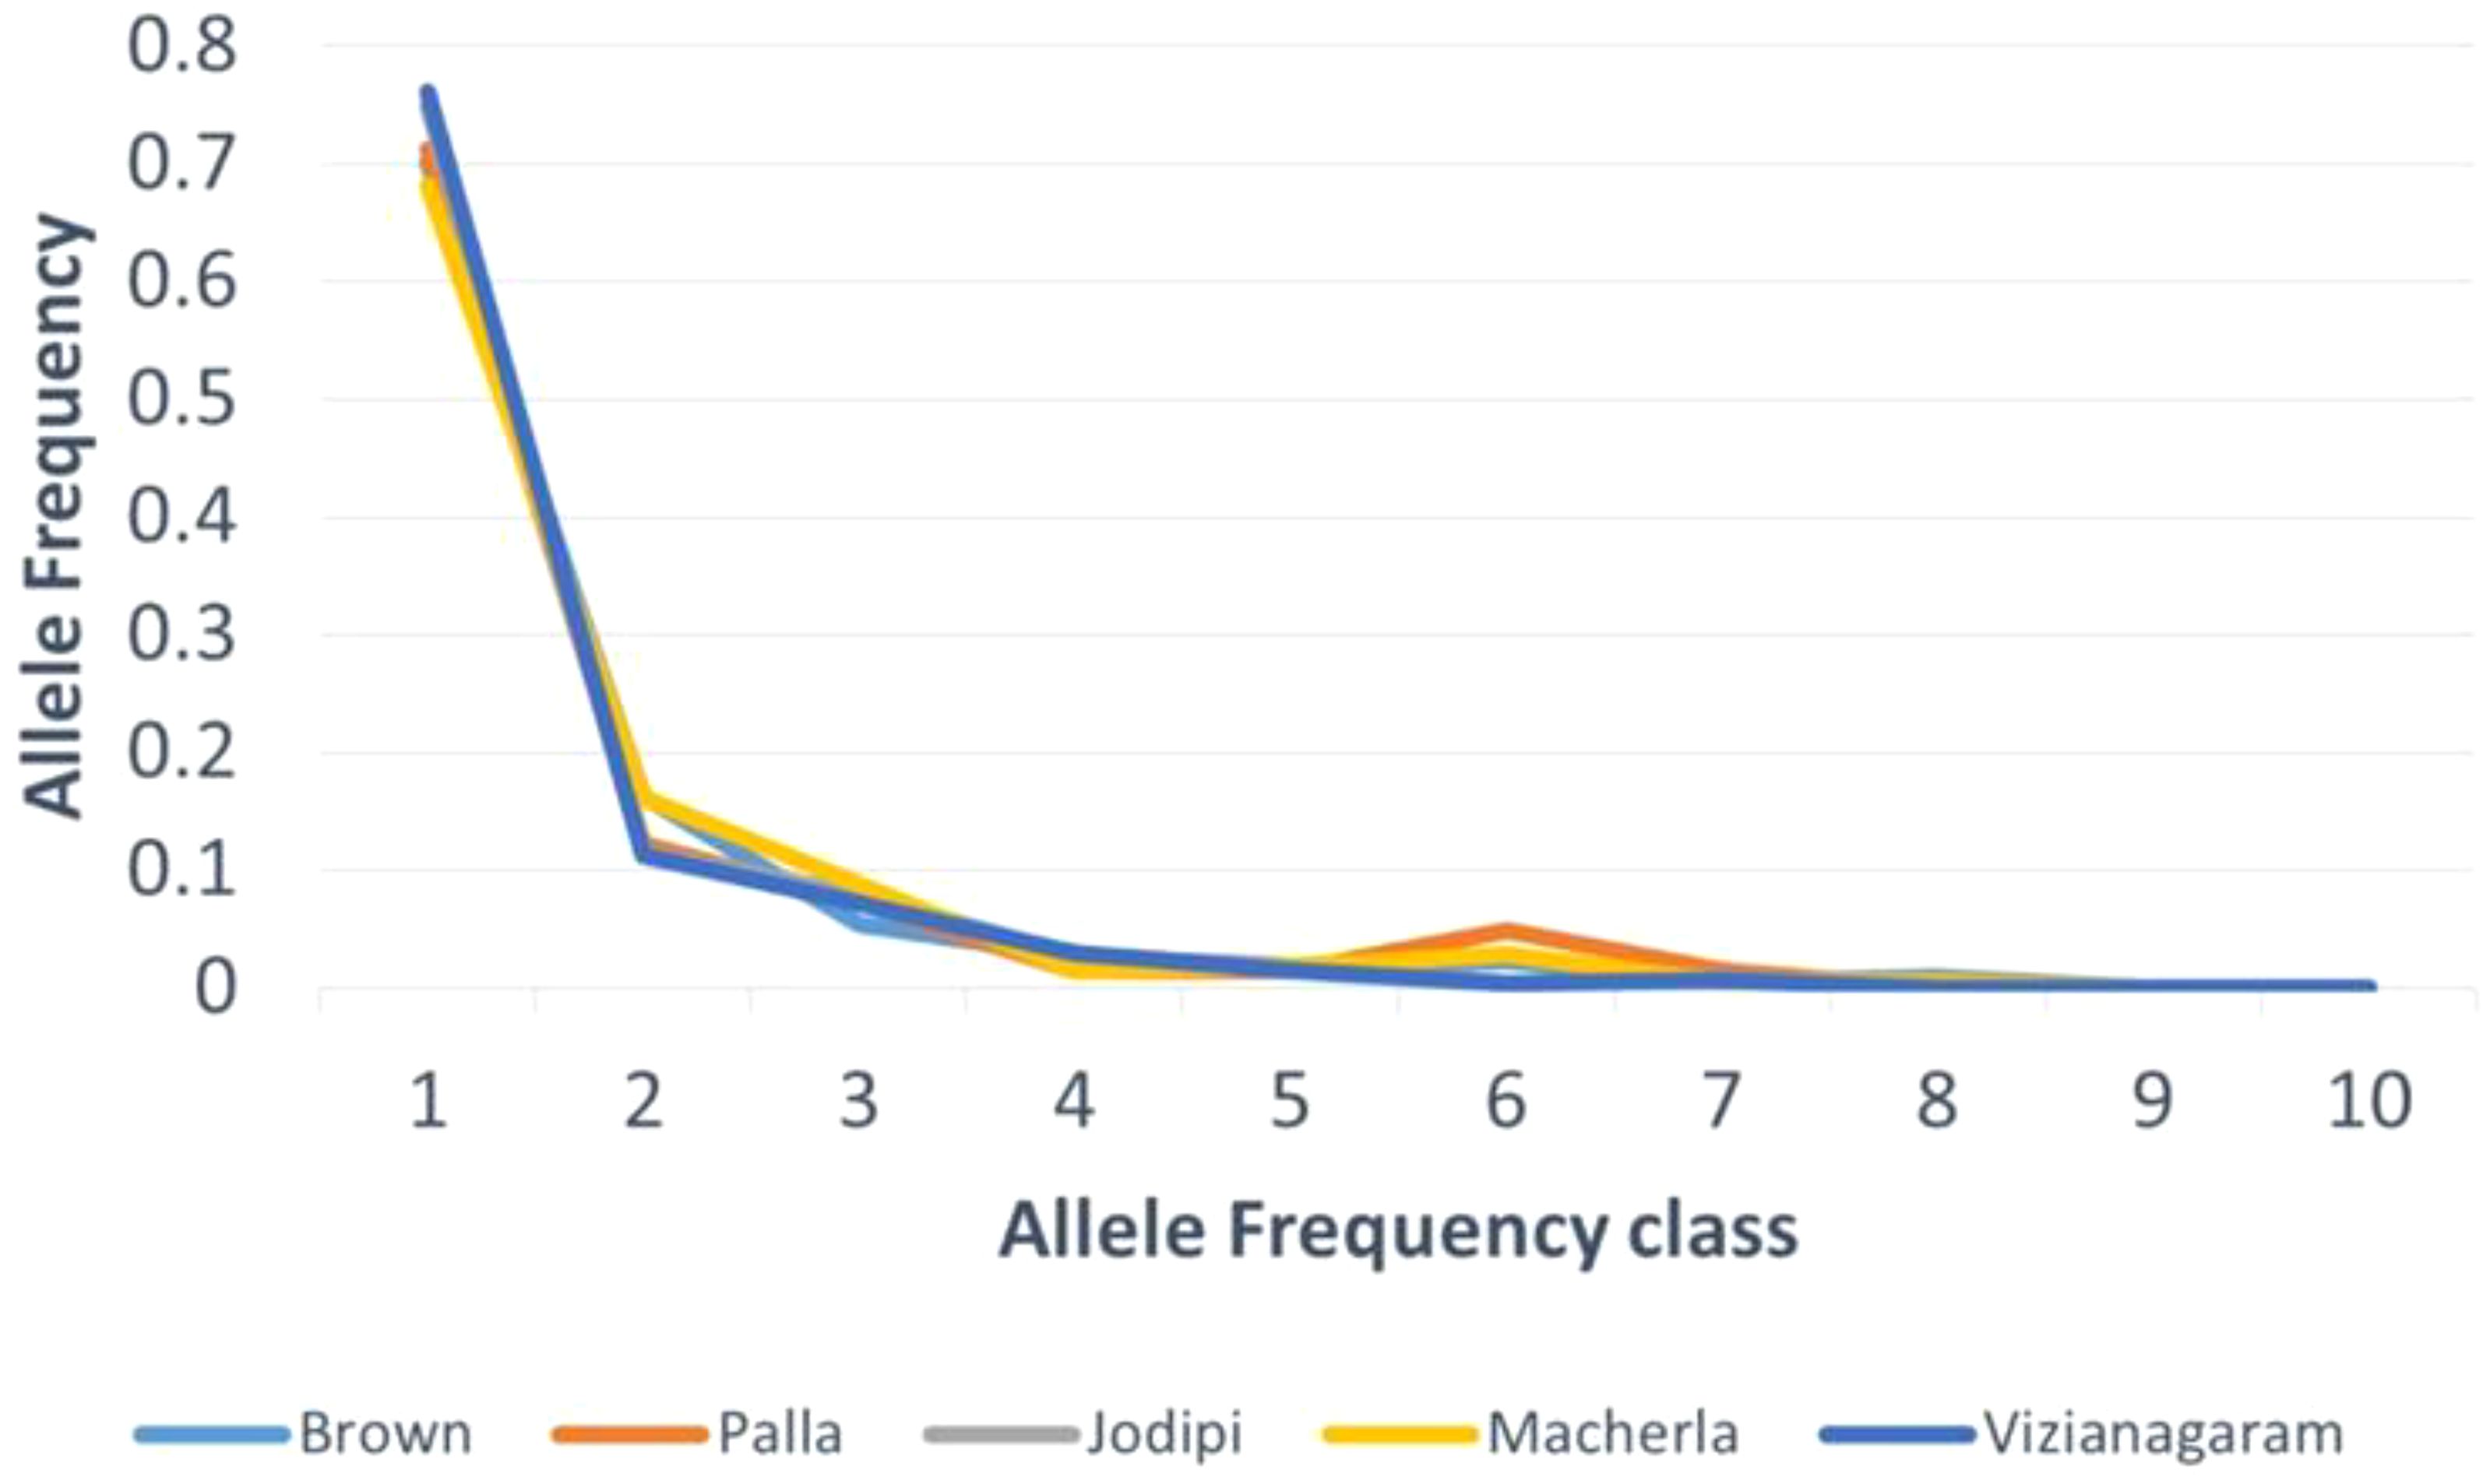
Figure 2. Bottle neck - Mode shift analysis.
Effective population size
The effective population size is optimal, maintaining low inbreeding levels. Among the five sheep populations under study, the effective population size as shown in Table 1 was found to be lower in Nellore brown (61.4) and higher in Vizianagaram sheep (155.5).
Genetic distances and F-statistics
The Analysis of Molecular Variance (AMOVA) showed that the extent of genetic variation was 12, 14 and 74 per cent among breeds, among the individuals and within the individuals, respectively, as depicted in Figure 3. FIS values ranged from -0.069 (MAF209) to 0.478 (oarAE129), with a mean of 0.142, indicating the presence of approximately 14% inbreeding within the studied populations. Notably, three loci exhibited negative FIS values (FIS < 0), signifying the absence of inbreeding at these loci, while positive FIS values were observed at 19 out of 22 loci, ranging from 0.001 to 0.478.
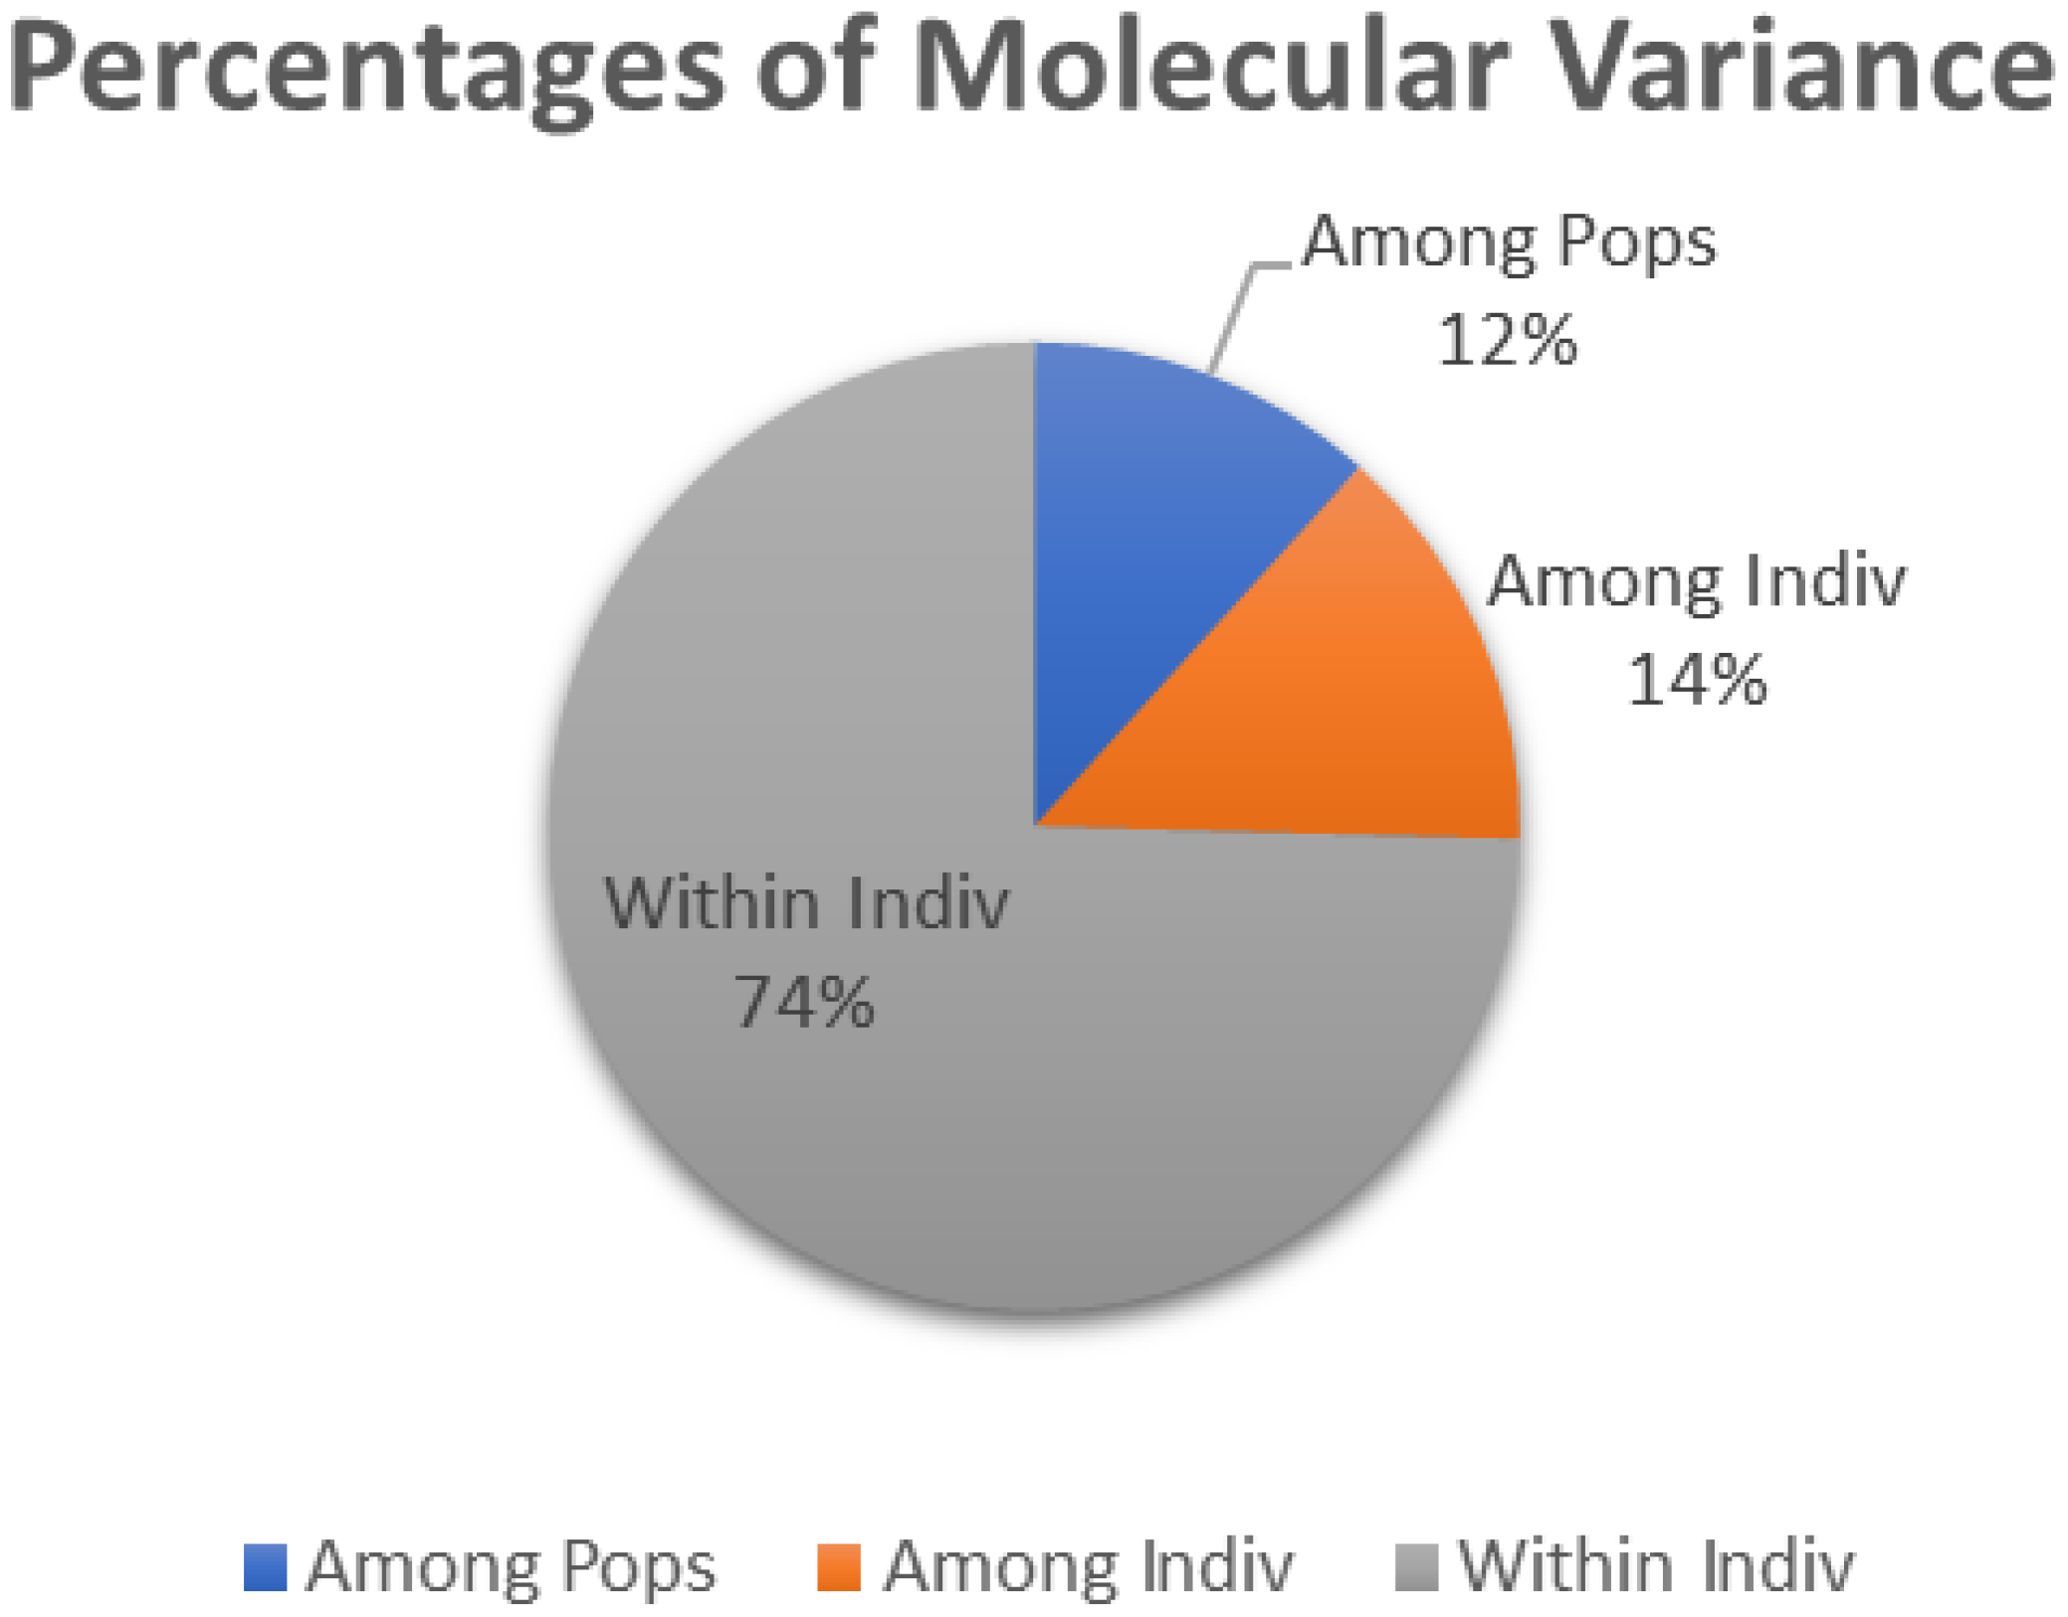
Figure 3. AMOVA among the populations.
The FIT value, representing overall heterozygosity loss, ranged from 0.022 (oarVH72) to 0.558 (oarFCB128), with a mean of 0.231. Differentiation coefficients (FST) based on allele numbers were significant between pairwise comparisons. Pairwise FST values ranged from 0.011 (between Macherla and Nellore Brown sheep) to 0.180 (between Vizianagaram and Nellore Palla sheep), as shown in Table 3 and Figure 4. Notably, there was a high differentiation coefficient observed between Nellore Palla sheep and other populations, with Vizianagaram sheep also displaying substantial differentiation.
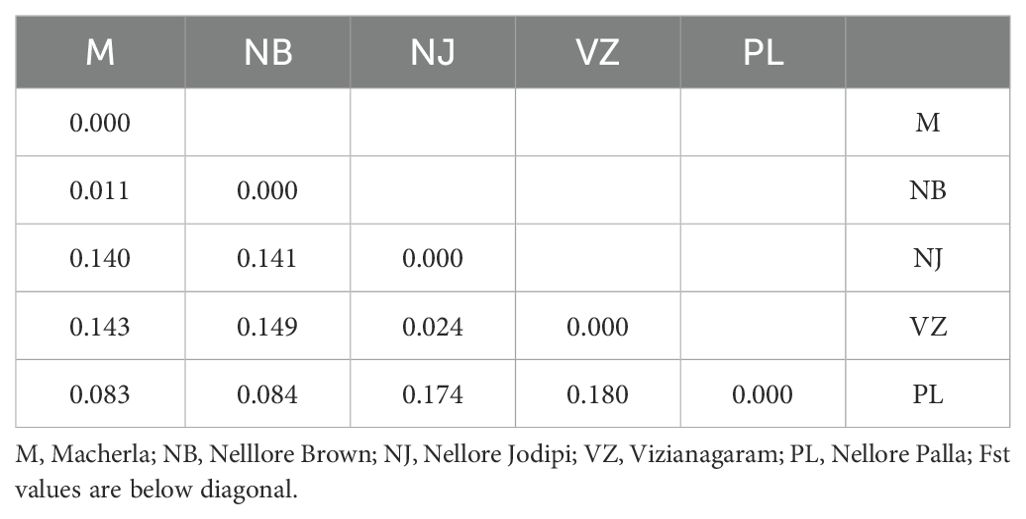
Table 3. Pairwise population FST values.
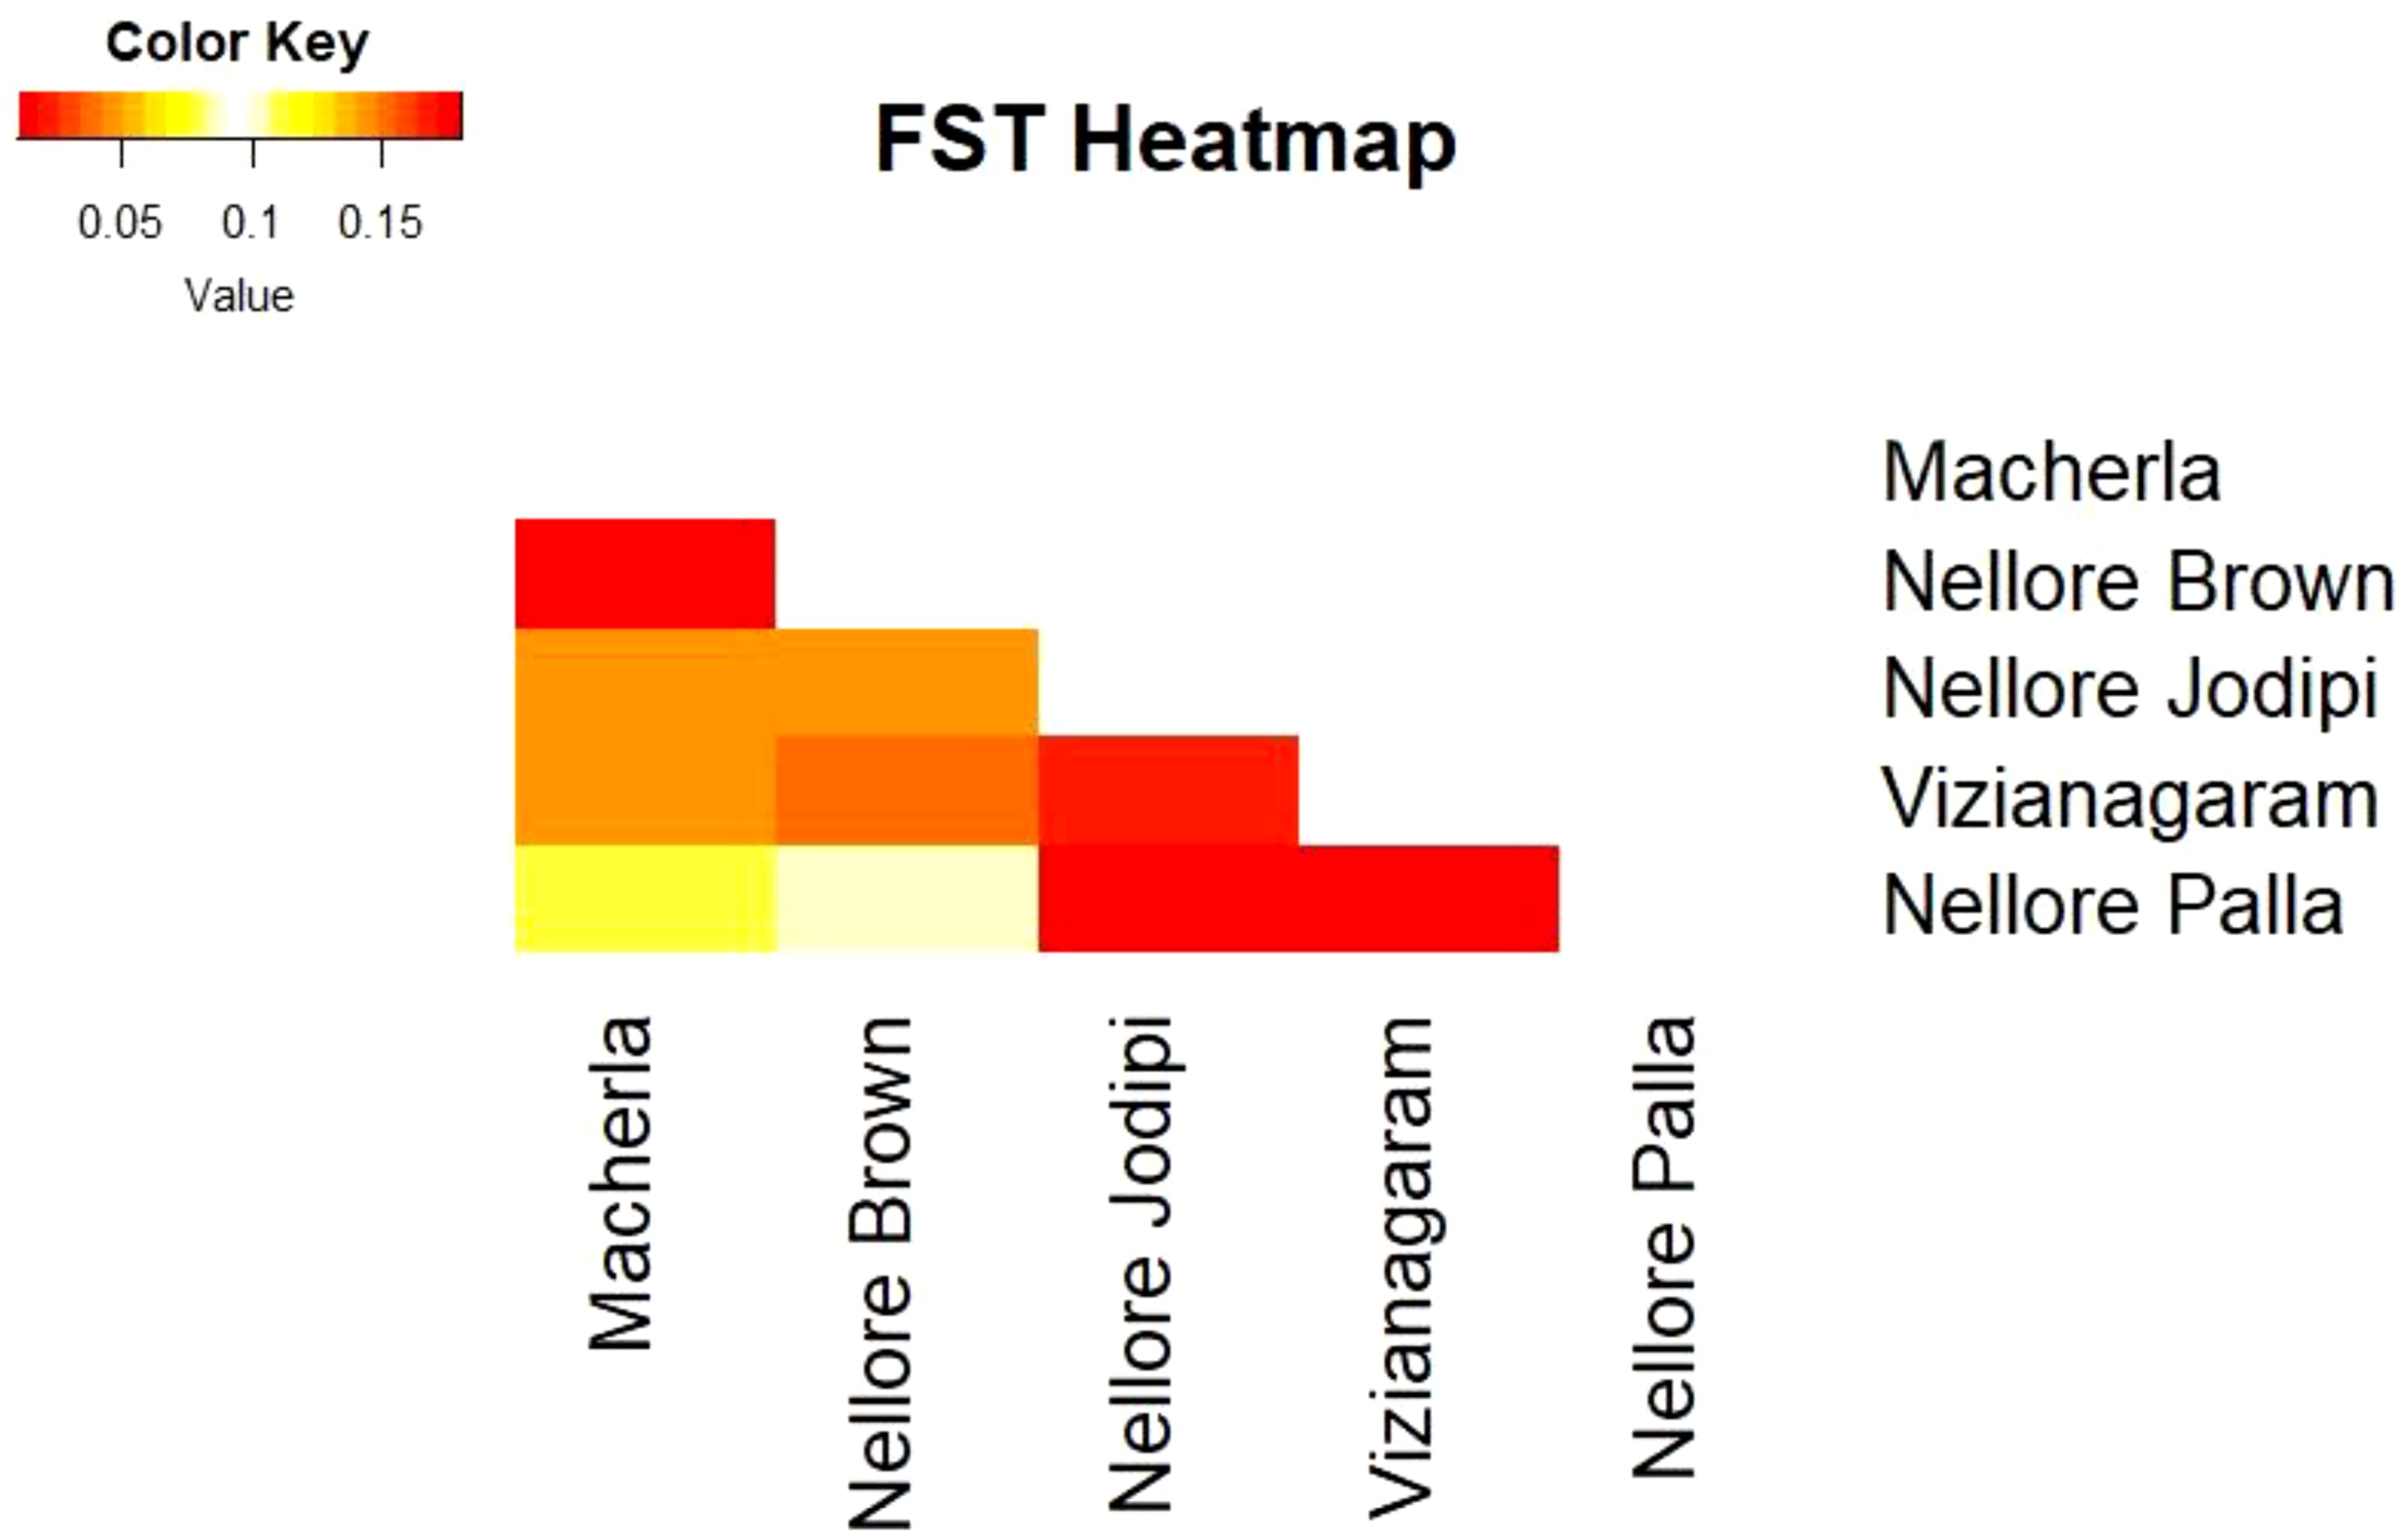
Figure 4. FST Heat map.
The highest genetic distance (DA) was recorded between Nellore Palla and Vizianagaram (SP) sheep (0.926) and the next highest between, Nellore Jodipi and Palla sheep (0.912) as given in Table 4. The genetic relationships among populations were further validated through the construction of a phylogenetic tree (NJ) using the UPGMA method in Darwin software based on genetic distance values as illustrated in Figure 5. The resulting tree revealed the clustering of the five sheep populations into two separate groups. Specifically, the first cluster encompassed Macherla, Nellore Brown, and Nellore Palla sheep, which formed a cohesive subcluster. The second group comprised Vizianagaram and Nellore Jodipi sheep populations. This clustering pattern indicated a tendency for geographically close sheep breeds to cluster together, highlighting potential genetic relationships influenced by geographical proximity.
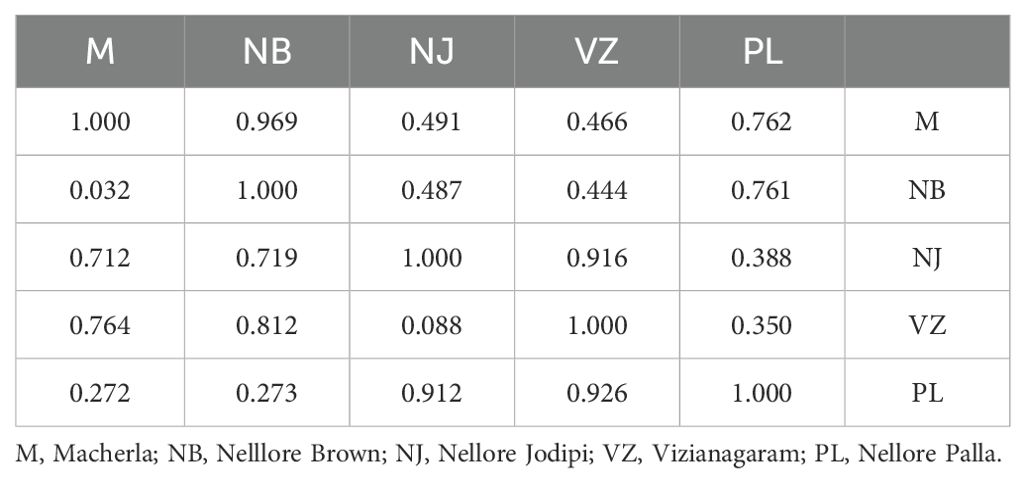
Table 4. Pairwise population matrix of nei unbiased genetic distance.
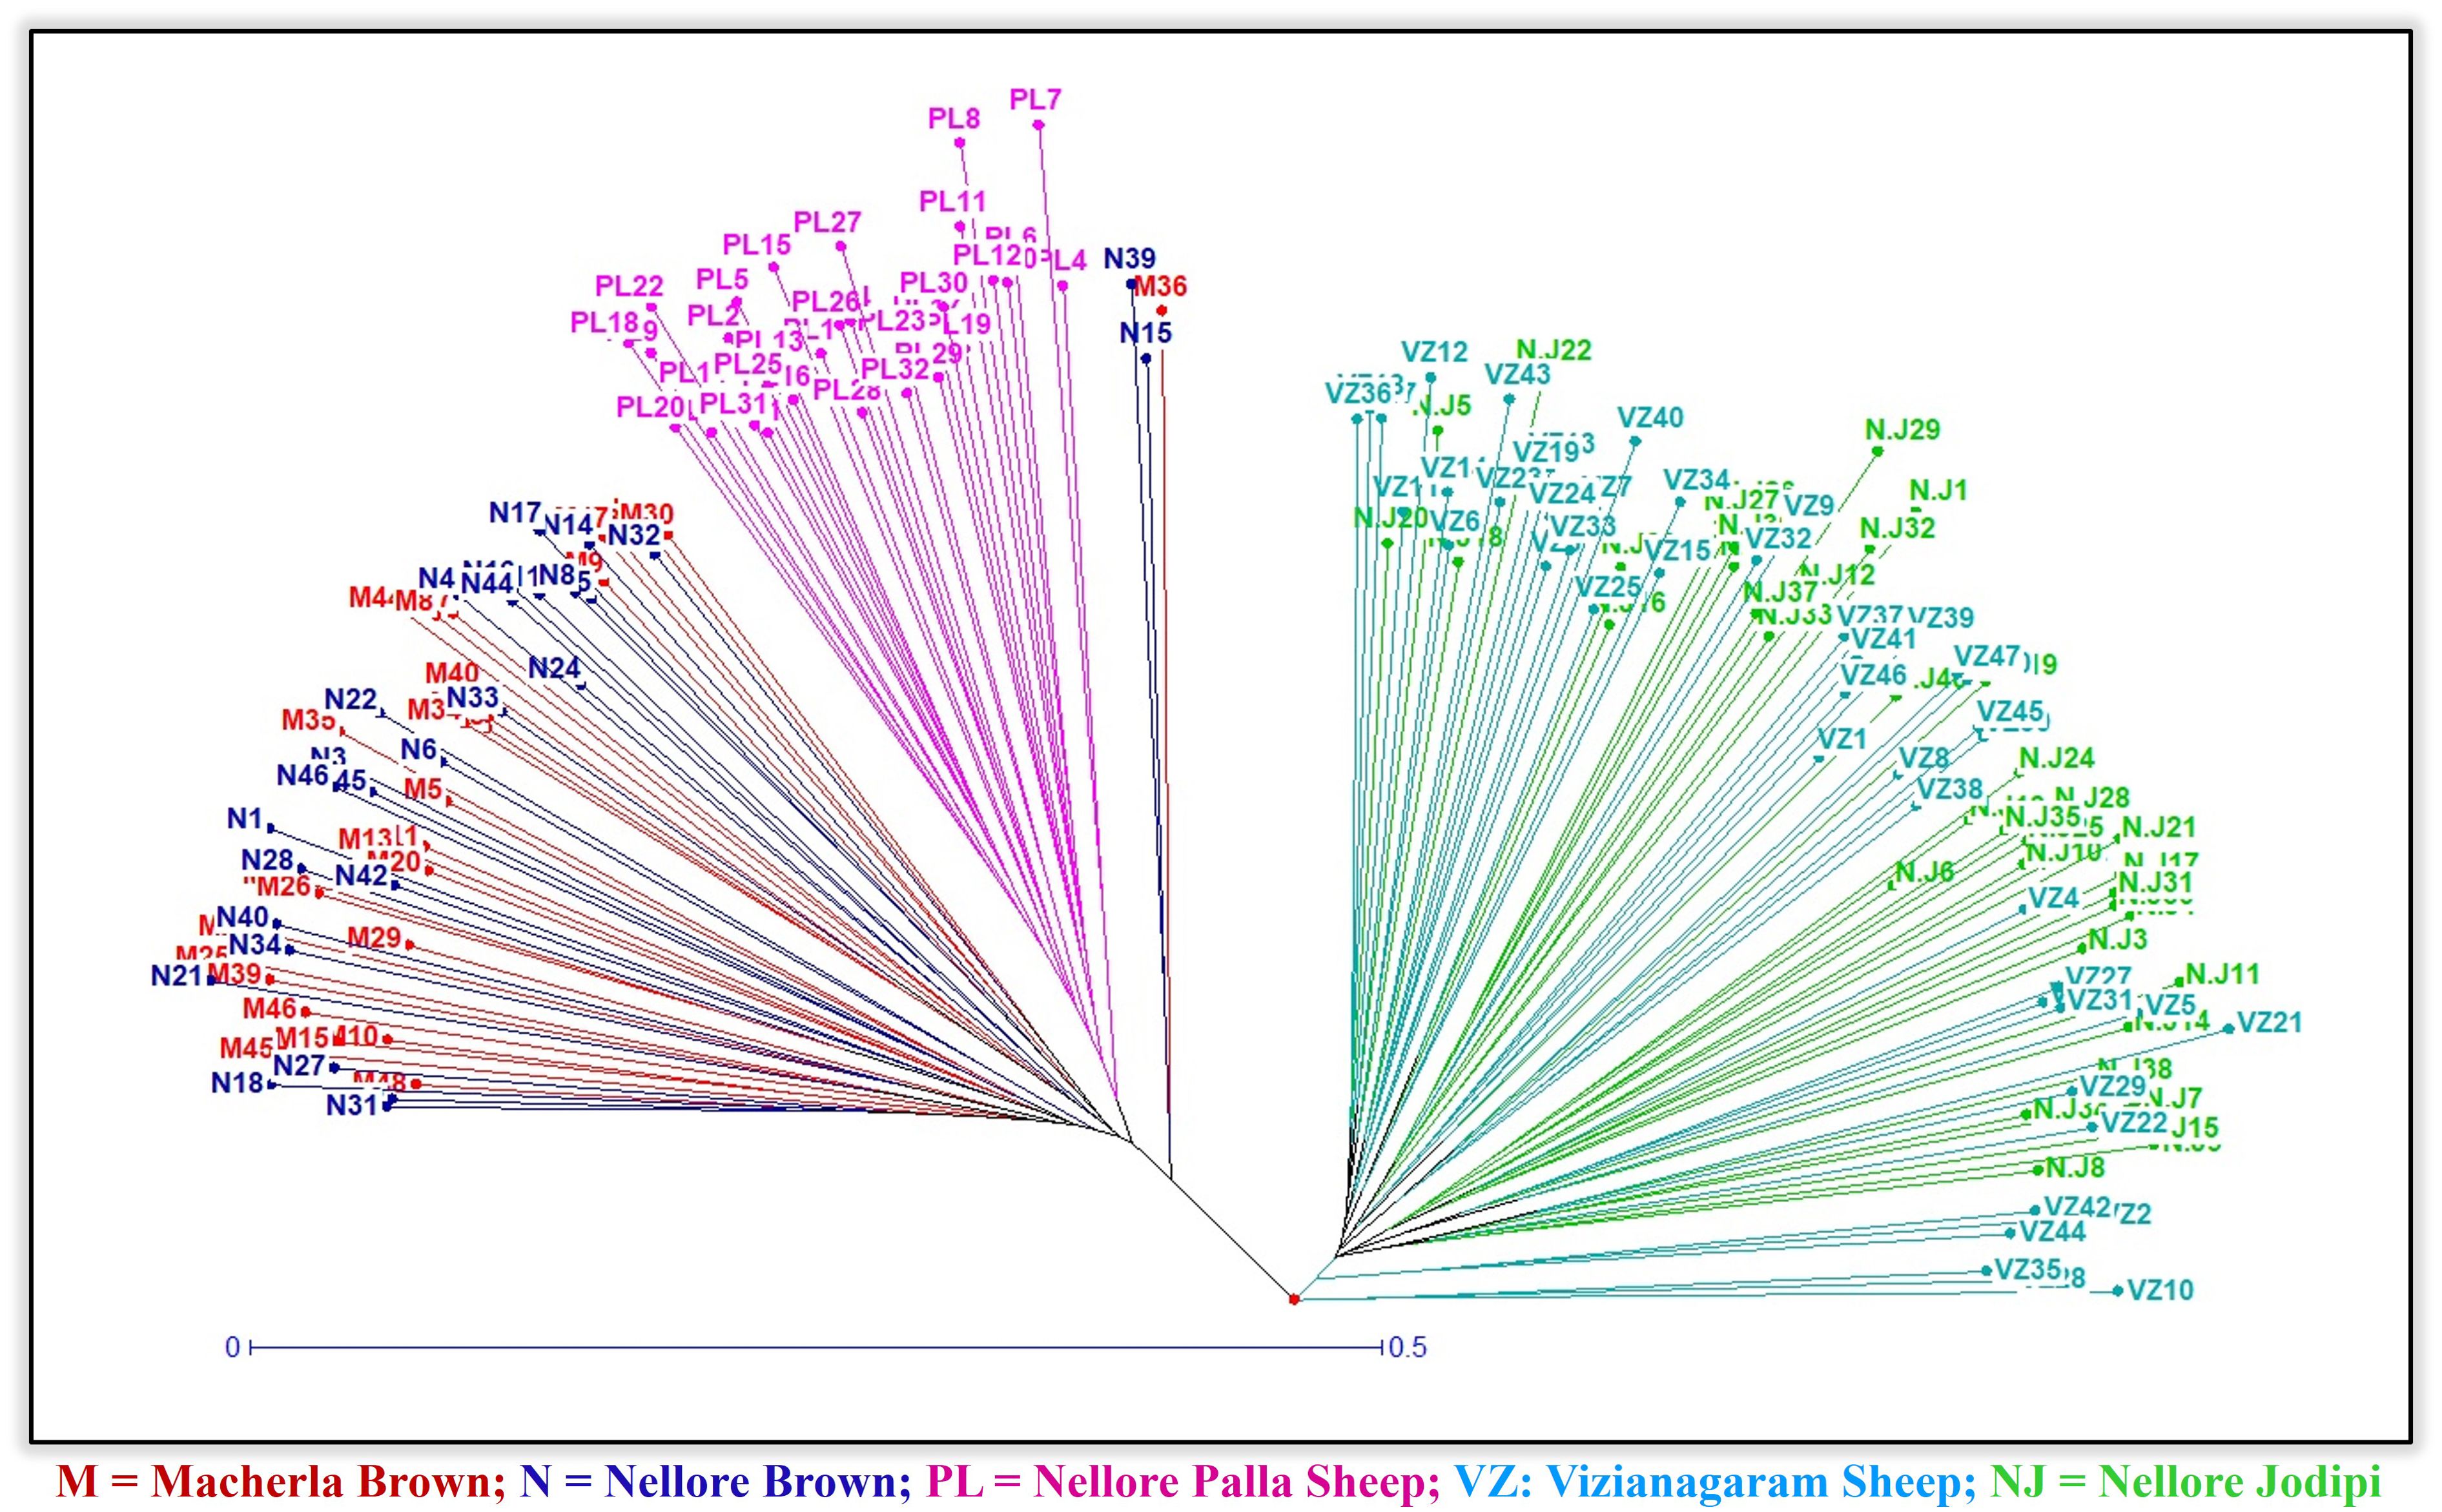
Figure 5. Phylogenetic tree using UPGMA method.
Correspondence analysis
Factorial Correspondence Analysis (FCA) and Principal Component Analysis (PCA) were performed to examine relationships among individuals and populations (Figures 6, 7). In both scenarios, the analyses revealed that the five sheep populations were segregated into three distinct clusters. These results were consistent with those obtained from the phylogenetic tree construction. Specifically, Macherla and Nellore Brown sheep formed one cluster, while Vizianagaram and Nellore Jodipi sheep grouped into a second cluster. Notably, Nellore Palla sheep formed a separate cluster distinct from the others. The results were visualized in three-dimensional graphs, where the first three principal components (axes 1, 2, and 3) accounted for 12.54%, 16.25%, and 19.62% of the total variation, respectively.

Figure 6. Factorial correspondence analysis.
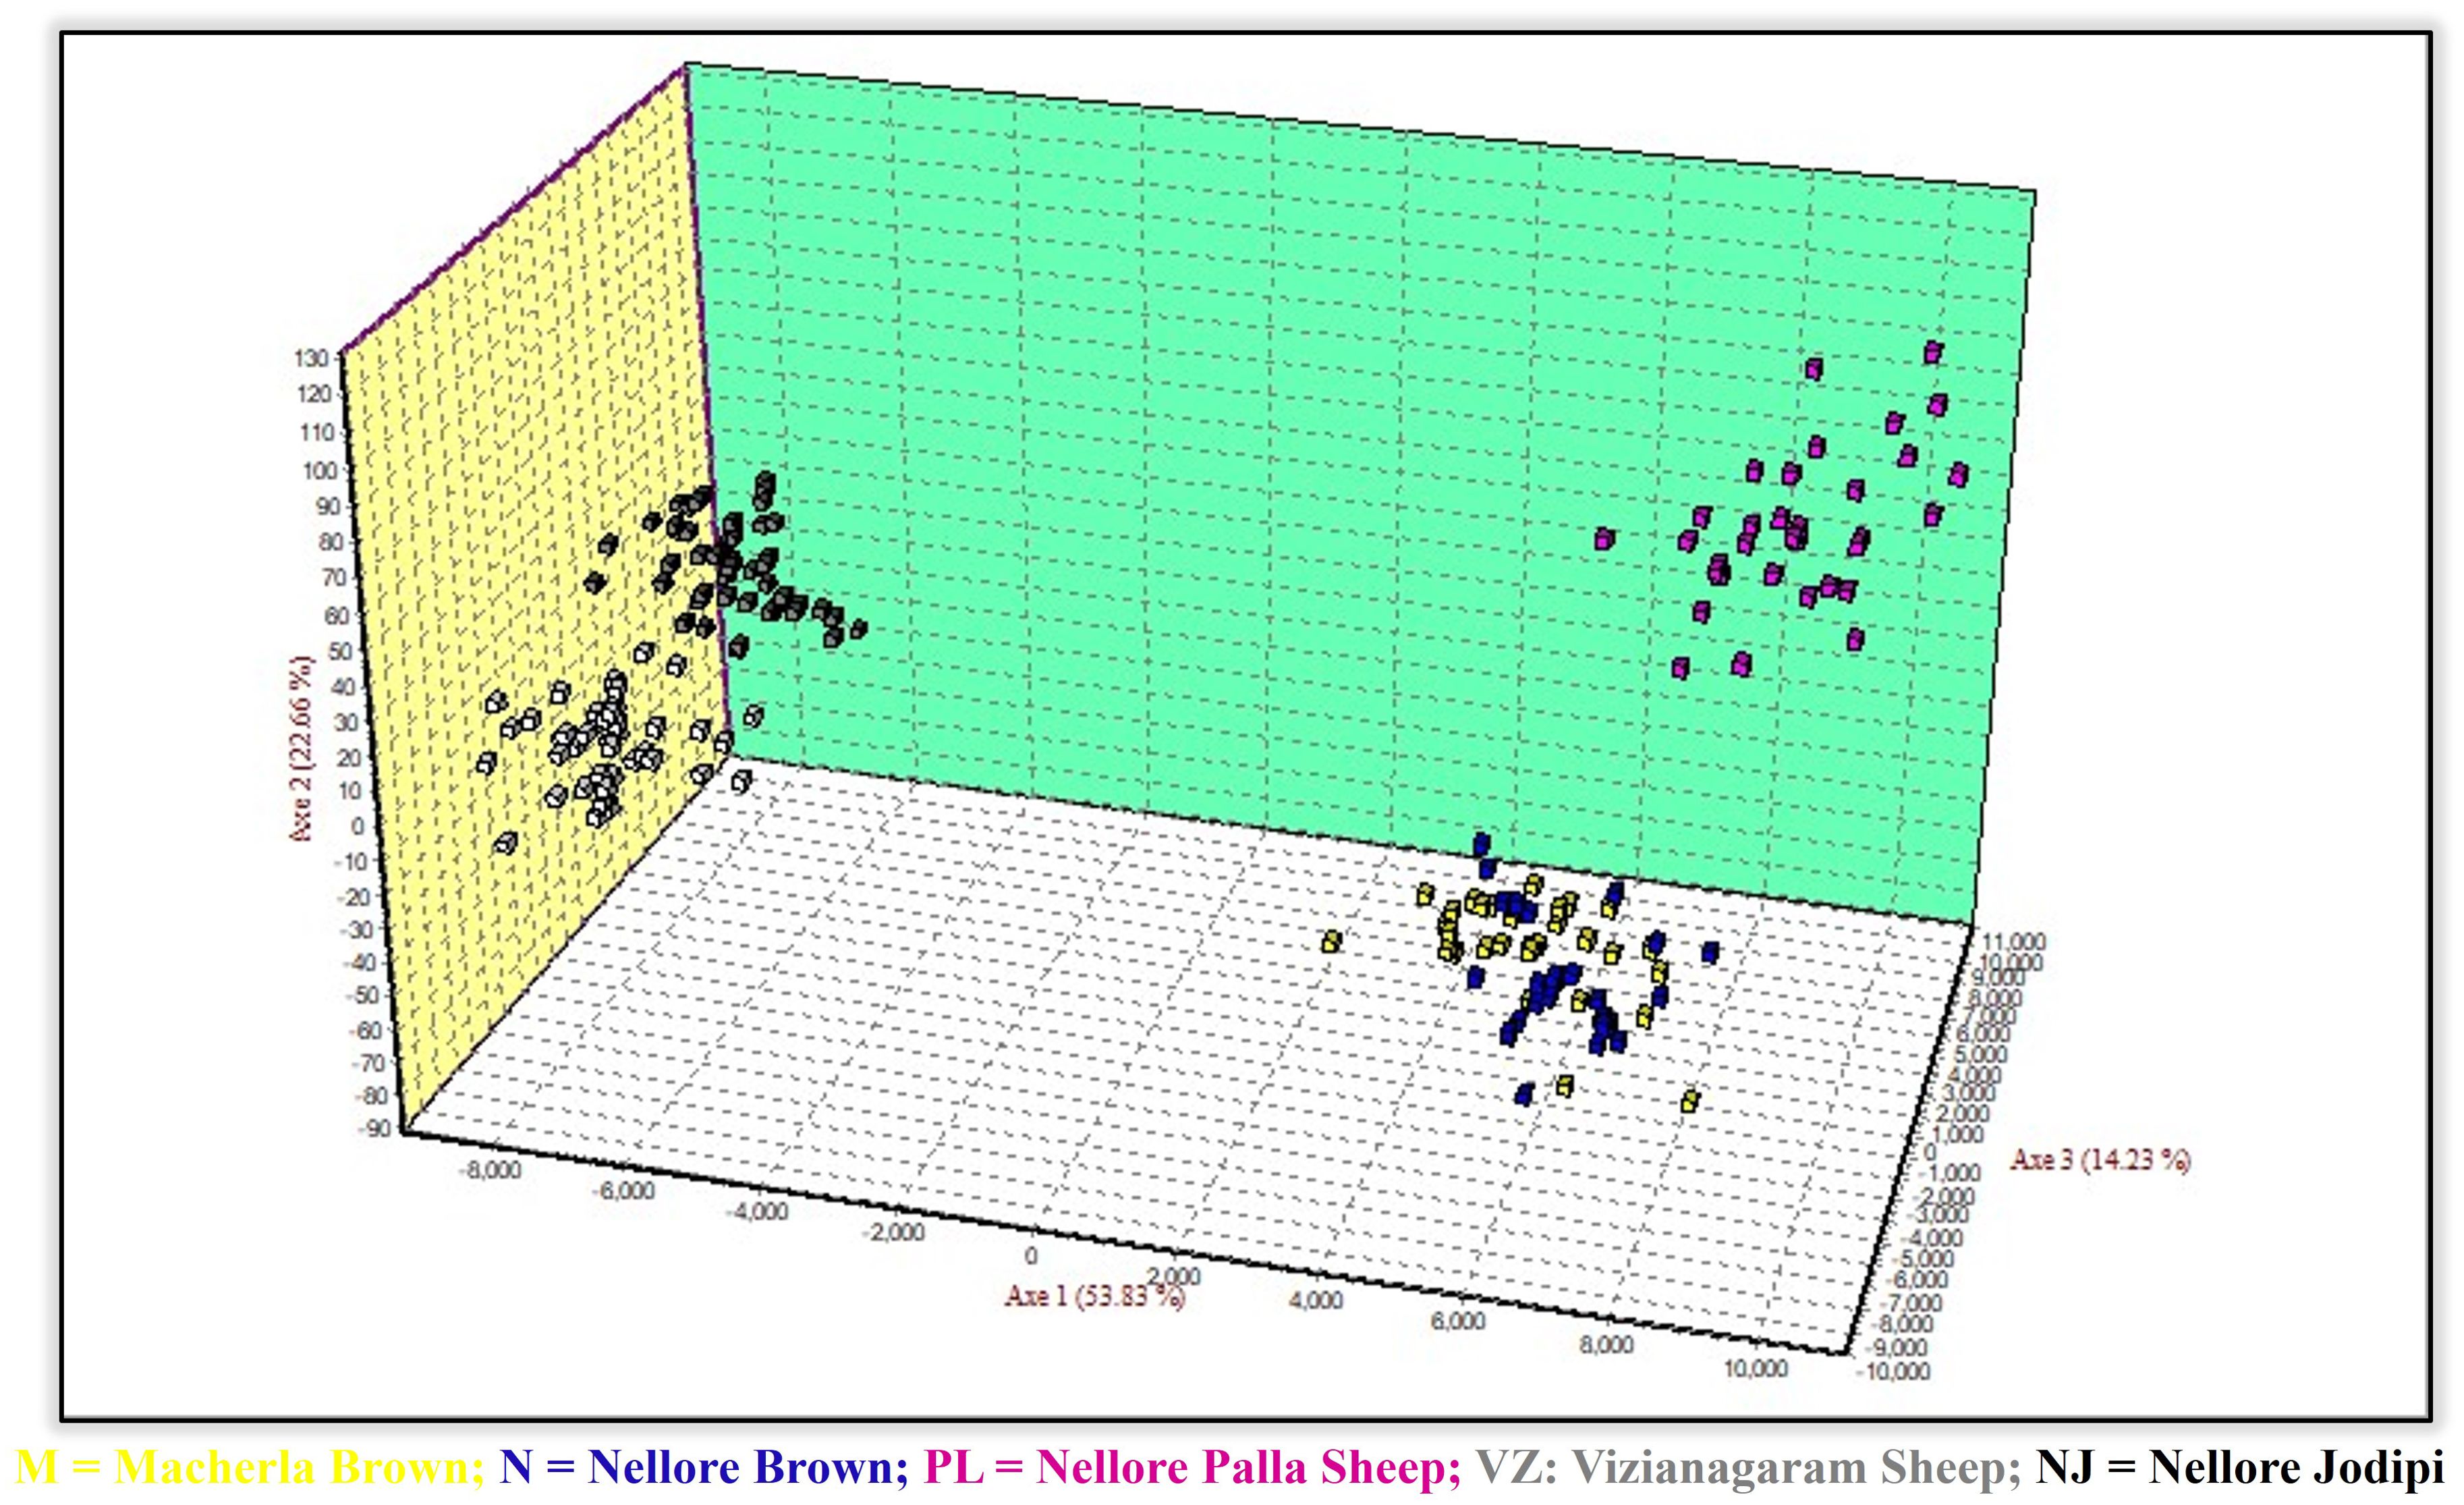
Figure 7. Principal component analysis.
Genetic structure of populations
The genetic population structure of each sheep breed was analyzed using the correlated allele frequency model within the STRUCTURE software (Figure 8). Following the methodology proposed by Evanno et al. (2005) and utilizing STRUCTURE HARVESTER, the most likely number of ancestral populations (K) was determined to be 3. This suggests that the studied sheep breeds are best characterized by three distinct genetic clusters or backgrounds rather than five populations. The first cluster comprises Macherla and Nellore Brown sheep, while the second cluster encompasses Nellore Jodipi and Vizianagaram sheep. Notably, Nellore Palla sheep form a separate third cluster. This analysis provides insights into the genetic diversity and structure of these sheep breeds, highlighting distinct population groupings and relationships among them. A dendrogram constructed using Genepop supported the clusters formed by FCA, PCA, and STRUCTURE, with the Palla population forming a subcluster with Macherla and Nellore Brown sheep, as shown in Figure 9. Top of Form.
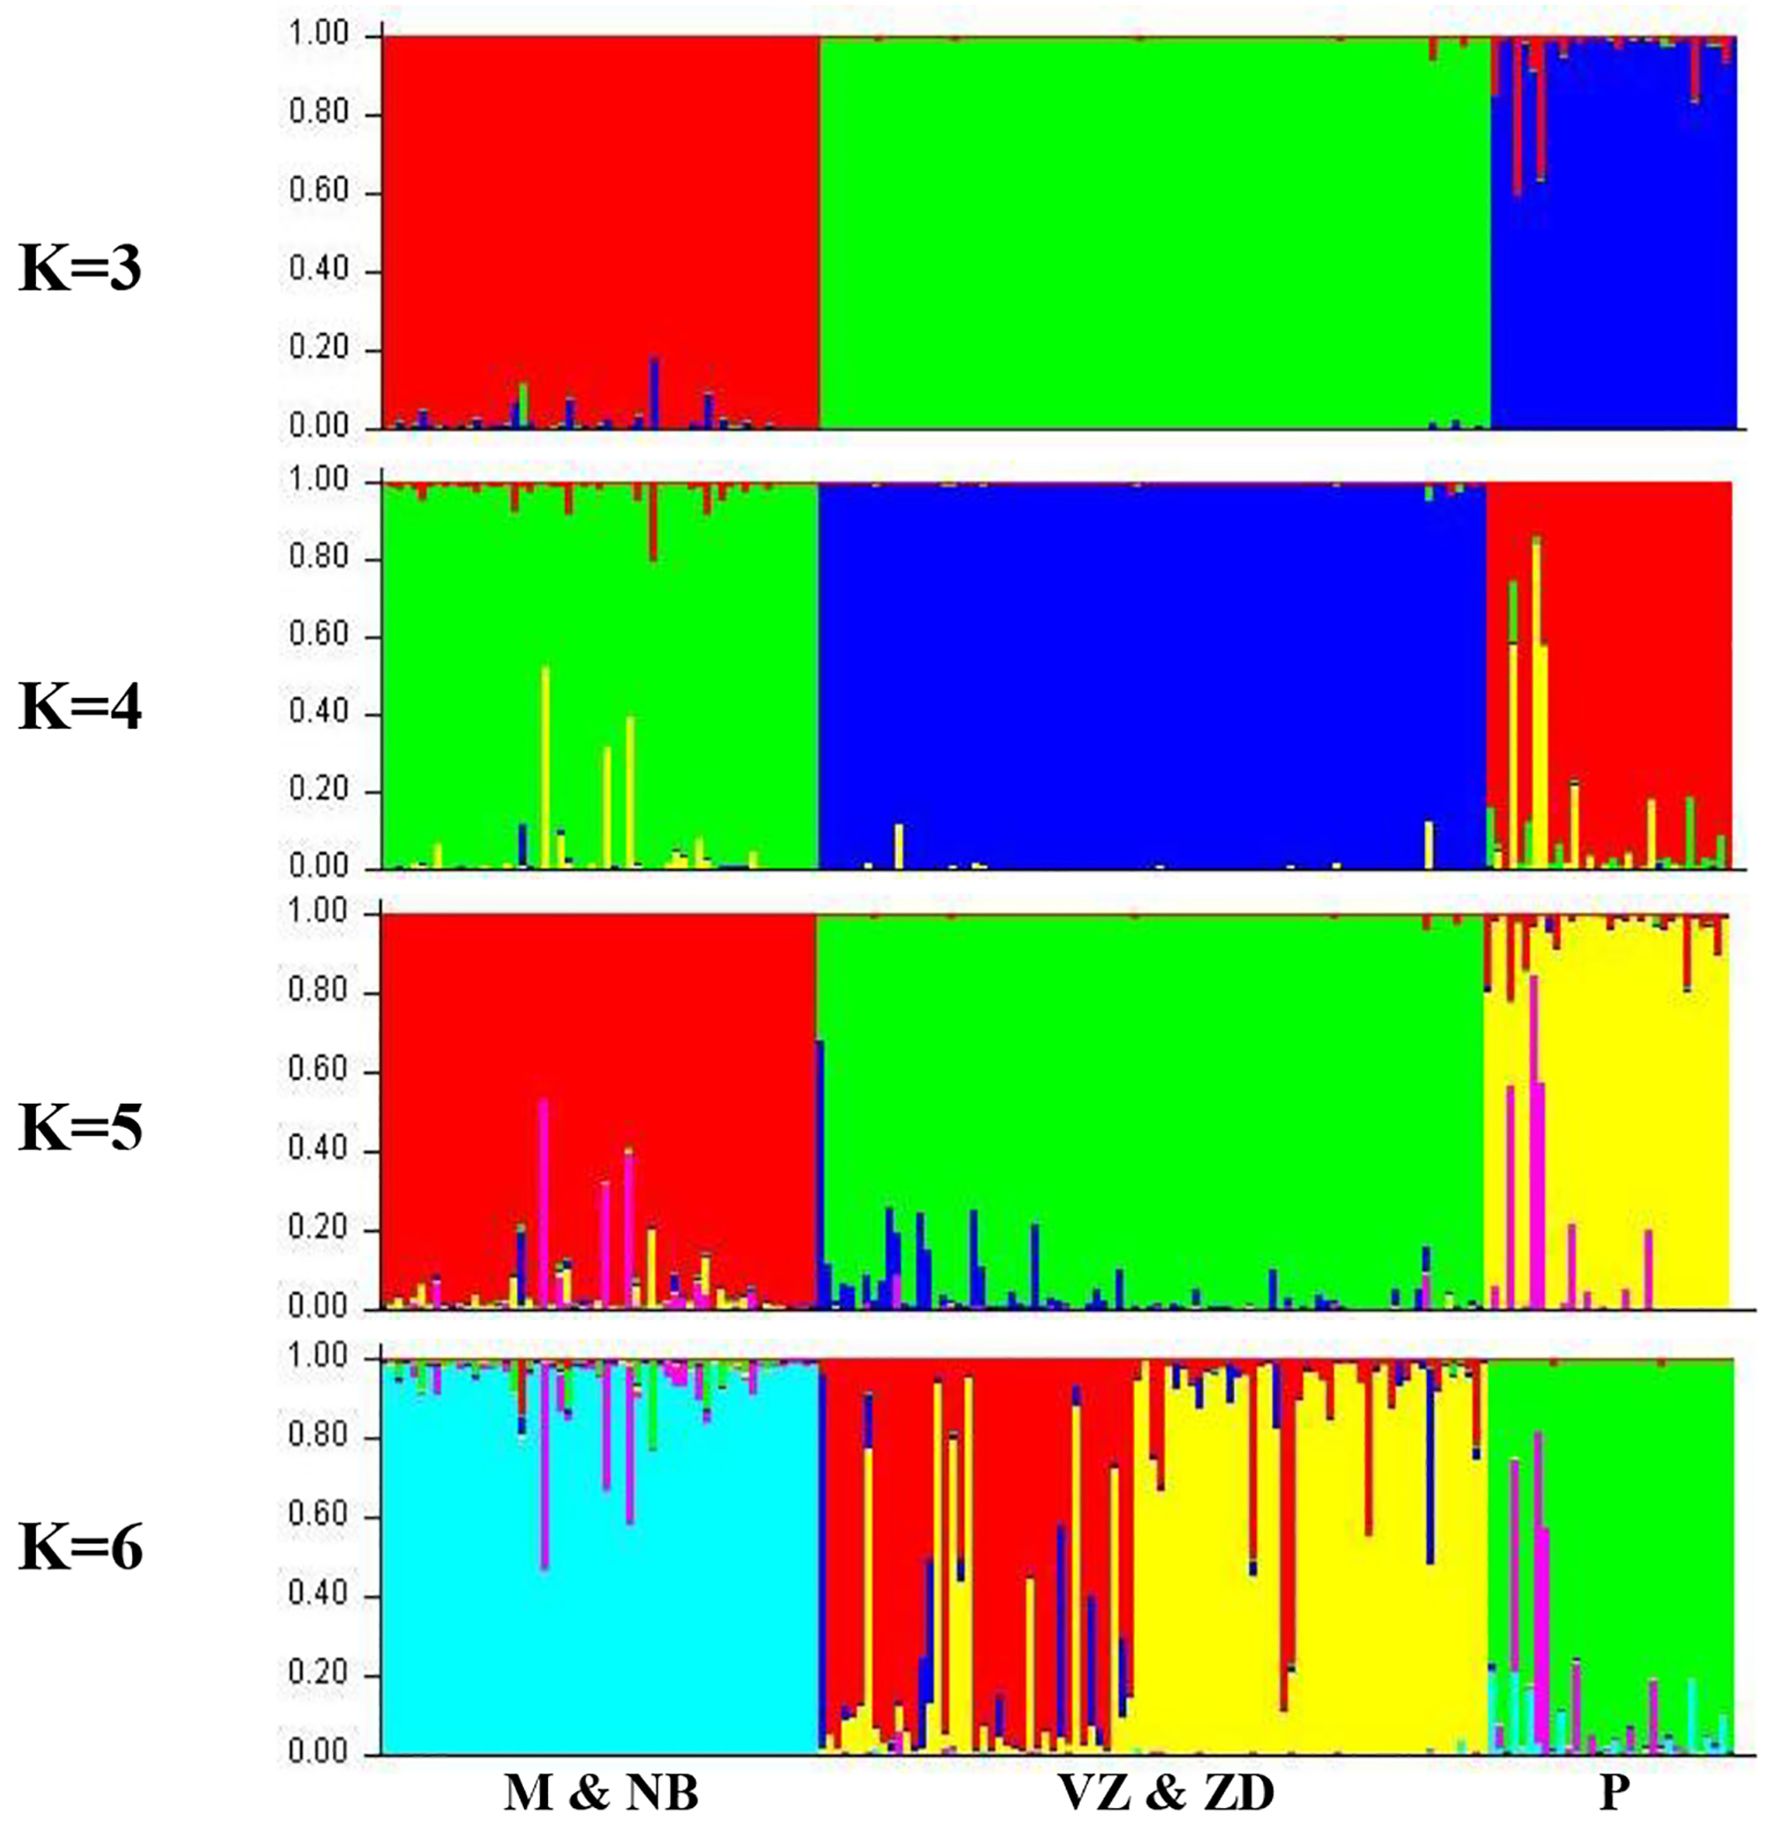
Figure 8. Structure analysis.
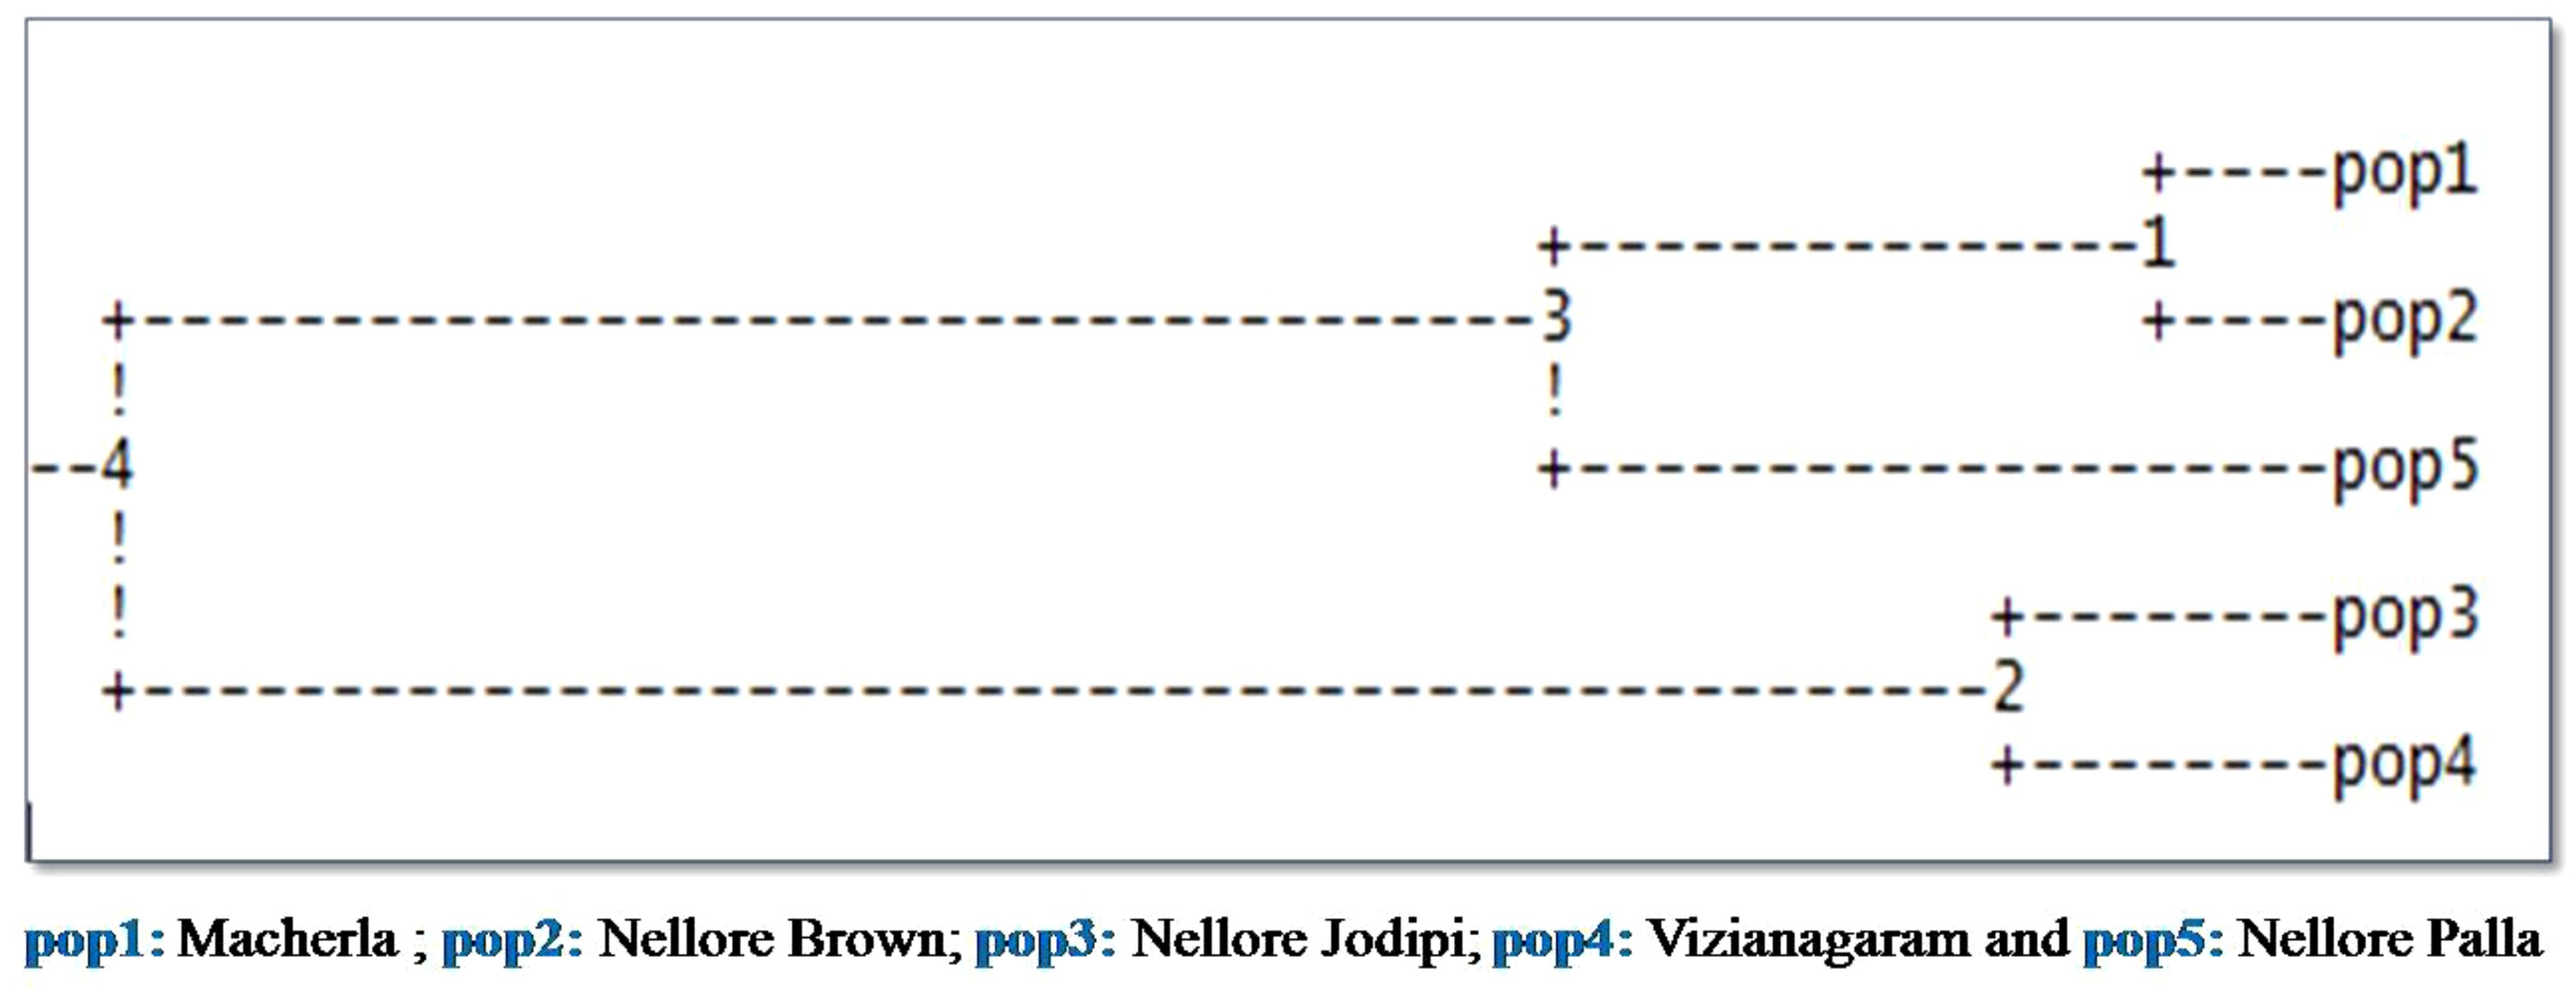
Figure 9. Dendogram constructed by genepop.
Breed specific alleles
Alleles unique to a single breed are referred to as private or breed-specific alleles. A total of 22, 33, 48, 57, and 41 private alleles were identified in Macherla, Nellore Brown, Nellore Jodipi, Vizianagaram, and Nellore Palla sheep, respectively. Their frequencies ranged from 1% to 10% at all loci, except for the DYMS1 locus, where allele 159 had a frequency of 43% and allele 161 had a frequency of 54% in Palla sheep.
Discussion
Domestic animal diversity, influenced by geographical isolation and selective breeding, constitutes a crucial aspect of global biodiversity. Characterizing and conserving genetic diversity within livestock breeds is essential for meeting the diverse demands of agricultural systems, including productivity, disease resilience, and environmental adaptation (Sharma et al., 2020). By understanding and conserving this genetic diversity, we can ensure food security, enhance agricultural sustainability, and safeguard cultural heritage for future generations. Hence, the present study was undertaken to analyze the genetic diversity of local sheep populations of Andhra Pradesh.
Allelic diversity is a key metric for assessing genetic variation within a population, representing the average number of alleles per locus. This metric can offer insights into historical fluctuations in population size and the rate of gene flow between populations (Slatkin, 1985; Nei, 1987; Luikart et al., 1998). In the present study, Andhra Pradesh sheep populations exhibited a higher allelic diversity, with an average of 10.59 alleles per locus, contrasting with lower mean allele counts reported in 11 Indian sheep populations as 8.27 by Sharma et al., 2020, 8.12 in Tiruchi Black sheep (Kavitha et al., 2015) and 9.66 in Ramnad White sheep (Raja et al., 2012). This heightened diversity may reflect historical fluctuations in population size and potentially different levels of gene flow between populations of Andhra Pradesh.
The mean effective number of alleles (He) across all loci in Andhra Pradesh sheep was 4.83, surpassing reports in Tiruchi Black sheep (4.48; Kavitha et al., 2015), Kilakarsal sheep (3.85; Radha et al., 2011) and Vembur sheep (4.09; Pramod et al., 2009). However, Coimbatore sheep exhibited a higher mean effective number of alleles (4.93; Kumarasamy et al., 2009) than the population under the current study. The lower effective number of alleles observed compared to the actual number of alleles might be attributed to the dominance of a few alleles contributing to the higher allelic frequency at each locus. This phenomenon, known as allele frequency skewness, occurs when certain alleles are more prevalent within the population, reducing the effective number of alleles despite multiple alleles being present at a locus. Consequently, while a locus may harbour a diverse array of alleles, the dominance of particular alleles limits the effective number of alleles calculated based on their contribution to genetic diversity. This highlights the importance of considering not only the number of alleles but also their distribution and frequency when assessing genetic diversity within a population.
The factors contributing to the observed differences in genetic diversity between sheep populations in the different studies are likely multifaceted. Historical breeding practices, geographic isolation, and demographic events could all shape the genetic diversity within a population. Additionally, environmental factors and selection pressures might influence allele frequencies over time. High genetic diversity in the populations studied could enhance the resilience to environmental stressors and disease, as well as provide a broader genetic resource for future breeding initiatives aimed at improving desirable traits. Continued monitoring of genetic diversity and implementing strategies to maintain or enhance it will be essential for the long-term sustainability and productivity of Andhra Pradesh sheep.
Private alleles tend to occur in low frequencies (Szpiech and Rosenberg, 2011) and are said to be the indicators of reduced gene flow between populations (Slatkin, 1985). The presence of a high mean number of breed-specific alleles (1–10%) in this study suggests significant genetic distinctiveness among the populations. The notable exception at DYMS1 locus underscores the potential importance of this locus in contributing to genetic diversity of Palla with other sheep populations. Unlike this study, Sharma et al. (2020) reported private alleles (<5%) in only one of the studied populations, indicating a minimal degree of genetic distinctiveness. The variability observed in the presence and frequency of private alleles might be attributed to differences in sample size, geographical location, breed composition, genotyping methodology and marker selection. The high number of breed-specific alleles observed in the examined sheep breeds highlights the need for effective conservation and management of genetic diversity within these populations. Analyzing the distribution and frequency of private alleles offers valuable insights into population structure, gene flow dynamics, and evolutionary history, all of which are crucial for effective breeding and conservation strategies.
Polymorphism Information Content (PIC) is a valuable metric in genetic studies, reflecting the informativeness of molecular markers in delineating population structure (Botstein et al., 1980). In this study, the mean PIC value of 0.75 and Shannon Informative Index (I) of 1.72 suggest that the microsatellite markers utilized are highly informative, as all markers exhibited PIC values exceeding 0.7. PIC depends on the number of alleles and their relative frequencies. The higher the PIC value, the more is its usefulness in diversity studies of a breed. A PIC value of more than 0.7 is considered as highly informative and a marker with a value of 0.4–0.7 is considered as moderately informative. This indicates substantial genetic diversity within the studied sheep population. The high PIC values align with findings in other sheep breeds like Patanwadi, Marwari, and Dumba sheep (Jyotsana et al., 2010), indicating the robustness of microsatellite markers across diverse genetic backgrounds. However, higher PIC values reported for Tiruchi Black sheep (0.884; Kavitha et al., 2015) imply potential variations influenced by marker selection and population characteristics. These results emphasize the importance of employing highly informative markers for accurate genetic analyses, facilitating effective breeding strategies and conservation efforts in livestock populations.
Heterozygosity, represented by both observed (Ho) and expected (He) values, serves as a crucial indicator of genetic diversity within populations. In sheep populations of Andhra Pradesh, the mean observed heterozygosity was 0.632, while the gene diversity (expected heterozygosity) was 0.734 (Table 1). These values indicate relatively high levels of genetic diversity within these sheep populations. A comparison with other Indian sheep breeds reveals that Andhra Pradesh Local sheep exhibited higher levels of observed and expected heterozygosities than breeds such as Muzzafarnagri (Ho = 0.564, He = 0.648, Arora and Bhatia, 2004), Nali (Ho = 0.540, He = 0.604, Sodhi et al., 2006), Chokla (Ho = 0.609, He = 0.649, Sodhi et al., 2006), Jalauni (Ho = 0.565, He = 0.614, Arora et al., 2008), Kheri (Ho = 0.571, He = 0.620, Bhatia and Arora, 2010), Madras Red (Ho = 0.547, He = 0.615, Prema et al., 2008), Vembur (Ho = 0.593, He = 0.630, Pramod et al., 2009) and Kilakarsal (Ho = 0.572, He = 0.612, Radha et al., 2011) sheep. However, the observed and expected heterozygosity values in sheep of Andhra Pradesh are lower than those reported for Nilagiri (Ho = 0.684, He = 0.735, Girish et al., 2007) and Coimbatore (Ho = 0.753, He = 0.790, Kumarasamy et al., 2009) sheep breeds.
Most of the loci under study revealed lower observed heterozygosities than expected indicating a deficiency of heterozygotes. Whereas a few loci had higher observed heterozygosities than expected (OarBH72, MAF209, OarFCB304). The difference between observed and expected heterozygosities in most of the loci are low to moderate while, few loci had a wide difference (OarCB226, SRCRSP5, OarFCB128 and OarAE129). This is in accordance with most of the sheep breeds in India such as Magra (Arora and Bhatia, 2006), Jaluni (Arora et al., 2008), Changthangi (Sharma et al., 2010), Nellore Brown (Jonnakutti et al., 2018), Macherla Brown (Molabanti et al., 2019) had revealed a deficiency of heterozygotes.
The high value of expected heterozygosity indicated that the population had retained the presence of several alleles although at lower frequencies. The lower observed heterozygosity than the expected heterozygosity could be attributed to discrepancy due to the forces such as inbreeding. Though the collected samples are from unrelated individuals, due to the limited population and their geographical isolation, inbreeding could be possible among the population. Other reasons could be that the locus may be under selection or tightly linked to a region under selection, presence of null alleles and population sub structuring leading to Walhund effect (Nei, 1987; Peter et al., 2007). The marker with an average expected heterozygosity value of 0.3 to 0.8 can be considered as a useful marker in measuring genetic variation in a population (Takezaki and Nei, 1996). Hence, the markers used in this study are appropriate for genetic diversity studies.
Bottleneck influences the distribution of genetic variation within and among populations. Populations that have experienced a recent reduction of their effective population size exhibit a correlative reduction of the allele numbers and heterozygosity at polymorphic loci. However, the allelic diversity is reduced faster than the heterozygosity, i.e. the observed heterozygosity is larger than the heterozygosity expected from the observed allele number where the locus is at mutation-drift equilibrium. The analysis suggests that there has been no recent reduction in populations or bottlenecks in the studied populations. This phenomenon is not uncommon in Indian sheep populations, as indicated by previous studies (Thiagarajan, 2012; Radha et al., 2011; Pramod et al., 2009; Kumarasamy et al., 2009; Arora et al., 2008). The absence of recent population reductions or bottlenecks implies stability in population size and genetic diversity, which is essential for the long-term viability and resilience of these sheep populations.
As per Food and Agriculture Organization (FAO, 1995) and European Association of Animal Science EAAP (2005), Ne of less than 82 and 84, is considered as critical and endangered respectively, at which the populations lose diversity. Nellore Brown (61.4) and Nellore Palla (66.6) populations had a low to moderate Ne, indicating a rise in inbreeding in future generations. When the Ne is very small, genetic drift operates more strongly than natural selection, leading to increased homozygosity and inbreeding depression (Frankham, 1995 and Al-Atiyat, 2016). Although these two populations had low to moderate Ne, they did not show inbreeding as also evidenced from bottleneck analysis. There is however a need for monitoring to prevent further decline.
The mean FIS value of 0.141 indicates a presence of 14% inbreeding within the studied sheep populations, with 19 out of 22 loci showing positive FIS values, suggesting a deficiency of heterozygotes possibly due to factors like small population sizes, selection pressure, and population subdivision (Hedrick, 2000). This trend, known as the Wahlund effect, is particularly evident in Macherla and Nellore Brown sheep, which exhibit close genetic relatedness, further supported by the lowest FST value between them. The mean FIS values obtained in the present study were higher than the values obtained by Arora and Bhatia (2004) in Muzzafarnagri sheep (0.159), Hoda and Marsan (2012) in Albanian sheep (0.041), Ahmed et al. (2014) in Kail sheep (0.052), and Kavitha et al. (2015) in Tiruchy black sheep.
The overall FST value of 0.059 indicated moderate genetic differentiation between the two populations, correlating with geographic distance, shared ancestral variation, and historical gene flow. Notably, the Nellore Palla sheep appeared relatively distinct, reflecting high within-breed genetic variation (87.1 per cent), valuable for genetic improvement and conservation efforts. Macherla and Nellore Brown sheep displayed the least differentiation, possibly attributed to substantial germplasm exchange between the two populations (Nm = 16.570). The moderate genetic differentiation observed might be attributed to various factors including geography, reproductive isolation, genetic drift, and different production goals. The spread of these populations across three agroecological zones likely contributed to the overall moderate genetic differentiation observed. Visualization of population relationships through the NJ tree further supports this, with breeds clustering mainly in accordance with their geographic locations. This accentuates the influence of geography on genetic relationships among Andhra Pradesh sheep populations. Overall, these findings emphasize the complex interplay of genetic, environmental, and anthropogenic factors shaping the genetic diversity and population structure of indigenous sheep breeds.
Previous studies involving various sheep populations have utilized structure and admixture analyses as effective tools for identifying ancestral, pure, and hybrid populations (Alvarez et al., 2004; Ligda et al., 2009). In the present study, the results of STRUCTURE analysis using a Bayesian approach revealed admixture at the individual level within each sheep population, while clustering the five populations into three distinct gene pools, supported by the peak ΔK values at K = 3, indicating strong evidence for three ancestral groups. The close genetic association observed between Nellore Brown and Macherla sheep could be attributed to their proximity in geographical locations, where seasonal migrations of shepherds with their flocks contribute to intermixing among sheep populations. The factorial corresponding analysis (FCA) and Principal Component Analysis (PCA) further validate the results of the STRUCTURE analysis, confirming the presence of three ancestral populations. Overall, these findings underline the utility of structure and admixture analyses in elucidating the genetic structure and relationships among sheep populations, providing valuable insights into their evolutionary history and genetic diversity.
Conclusion
The study provides valuable insights into the genetic structure and relationships among Andhra Pradesh Local sheep populations. High genetic variability was observed across all populations, characterized by numerous alleles per locus, private alleles, high polymorphism, and heterozygosity. However, a deficit in heterozygosity and admixture patterns among geographically close populations were evident, likely due to endogamy and migratory practices within and between sheep flocks. Nellore Palla sheep appeared as the most differentiated population, while Macherla exhibited the least differentiation from Nellore Brown sheep, suggesting a common ancestry between them. Population structure analysis identified three main gene pools, with distinct genetic makeup reflecting past and recent gene flow, geographical separation, and isolation. To maintain existing genetic diversity, breeding strategies aimed at maintaining effective population size while minimizing inbreeding and genetic drift and preventing indiscriminate gene flow are crucial. Although the mode-shift analysis found no recent bottlenecks in the populations, the lower levels of observed heterozygosities and effective population size in Nellore Palla and Brown sheep populations underline the significance of incorporating conservation methods into these breeds.
Sustainable breeding programs and policies are needed to prevent indiscriminate gene flow among local sheep populations, including measures such as frequent exchange of rams among farms and flocks of the same breed and community involvement. These efforts are essential for the conservation and sustainable management of Andhra Pradesh Local sheep populations. Top of Form.
Data availability statement
The raw data supporting the conclusions of this article will be made available by the authors, without undue reservation.
Ethics statement
The animal studies were approved by the Institutional Animal Ethics Committee (IAEC), Sri Venkateswara Veterinary University (SVVU), Tirupati, Andhra Pradesh, India. Blood samples were collected under the supervision of veterinarians. The studies were conducted in accordance with the local legislation and institutional requirements. Written informed consent was obtained from the owners for the participation of their animals in this study.
Author contributions
PP: Conceptualization, Data curation, Formal Analysis, Investigation, Methodology, Software, Validation, Visualization, Writing – original draft, Writing – review & editing. VR: Conceptualization, Funding acquisition, Project administration, Resources, Supervision, Visualization, Writing – original draft, Writing – review & editing. MM: Conceptualization, Funding acquisition, Project administration, Resources, Supervision, Validation, Visualization, Writing – original draft, Writing – review & editing. SK: Conceptualization, Funding acquisition, Project administration, Resources, Supervision, Visualization, Writing – original draft, Writing – review & editing. JB: Formal Analysis, Investigation, Methodology, Software, Writing – original draft, Writing – review & editing. PB: Formal Analysis, Methodology, Validation, Writing – original draft, Writing – review & editing. RP: Conceptualization, Data curation, Formal Analysis, Investigation, Methodology, Software, Supervision, Validation, Visualization, Writing – original draft, Writing – review & editing. VS: Methodology, Formal Analysis, Writing – review & editing.
Funding
The author(s) declare that no financial support was received for the research and/or publication of this article.
Conflict of interest
The authors declare that the research was conducted in the absence of any commercial or financial relationships that could be construed as a potential conflict of interest.
Generative AI statement
The author(s) declare that no Generative AI was used in the creation of this manuscript.
Publisher’s note
All claims expressed in this article are solely those of the authors and do not necessarily represent those of their affiliated organizations, or those of the publisher, the editors and the reviewers. Any product that may be evaluated in this article, or claim that may be made by its manufacturer, is not guaranteed or endorsed by the publisher.
Supplementary material
The Supplementary Material for this article can be found online at: https://www.frontiersin.org/articles/10.3389/fanim.2025.1553610/full#supplementary-material
References
Ahmed Z., Babar M. E., Hussain T., Nadeem A., Awan F. I., Wajid A., et al. (2014). Genetic diversity analysis of Kail sheep by using microsatellite markers. J. Anim. Plant Sci. 24, 1329–1333.
Al-Atiyat R. (2016). Microsatellite-based estimation of inbreeding level in sheep populations of small effective size. South Afr. J. Anim. Sci. 46, 54–62. doi: 10.4314/sajas.v46i1.7
Alvarez I., Royo L. J., Fernández I., Gutiérrez J. P., Gómez E., Goyache F. (2004). Genetic relationships and admixture among sheep breeds from Northern Spain assessed using microsatellites. Anim. Sci. 82, 2246–2252. doi: 10.2527/2004.8282246x
Arora R., Bhatia S. (2004). Genetic structure of Muzzafarnagri sheep based on microsatellite analysis. Small ruminant Res. 54, 227–230. doi: 10.1016/j.smallrumres.2003.11.015
Arora R., Bhatia S. (2006). Genetic diversity of Magra sheep from India using microsatellite analysis. Asian-Australas J Anim Sci. 19, 938–942.
Arora R., Bhatia S., Sehrawat A., Maity S. B., Kundu S. S. (2008). Genetic variability in Jalauni sheep of India inferred from microsatellite data. Livest Res. Rural Dev. 20, 1–8.
Bhatia S., Arora R. (2010). Lesser-known ovine germplasm-an under evaluated asset of India. Indian J. Anim. Sci. 80, 880–890.
Botstein D., White R. L., Skolnick M., Davis R. W. (1980). Construction of a genetic linkage map in man using restriction fragment length polymorphisms. Am. J. Hum. Genet. 32, 314–331.
Cornuet J. M., Luikart G. (1996). Description power analysis for detecting recent population bottlenecks from allele frequency data. Genetics 144, 2001–2014. doi: 10.1093/genetics/144.4.2001
DAHD (2019). Available online at: http://dahd.nic.in/dahd/statistics.aspx (Accessed October 28, 2024).
Di Rienzo A., Peterson A. C., Garza J. C., Valdes A. M., Slatkin M., Freimer N. B. (1994). Mutational processes of simple sequence repeat loci in human populations. Proc. Natl. Acad. Sci. U.S.A. 91, 3166–3170. doi: 10.1073/pnas.91.8.3166
EAAP (2005). European Association for Animal Production (EAAP) Animal Genetic Data Bank (Hannover, Germany). Available at: http://www.tiho-hannover.de/einricht/zucht/eaap (Accessed November 02, 2024).
Evanno G., Regnaut S., Goudet J. (2005). Detecting the number of clusters of individuals using the software STRUCTURE: a simulation study. Mol. Ecol. 14, 2611–2620. doi: 10.1111/j.1365-294X.2005.02553.x
FAO (1995). World Watch List for Domestic Animal Diversity, 2nd ed. (Rome, Italy: Food and Agriculture Organization of the United Nations).
FAO (2011). “Molecular Genetic Characterization of Animal Genetic Resources (No. 9),” in FAO Animal Production and Health Guidelines (Rome: Food and Agriculture Organization of the United Nations).
Frankham R. (1995). Effective population-size adult-population size ratios in wildlife: a review. Genet. Res. 66, 95–107. doi: 10.1017/S0016672300034455
Girish H., Sivaselvam S. N., Karthickeyan S. M. K., Saravanan R. (2007). Molecular characterisation of Nilagiri sheep (Ovis aries) of South India based on microsatellites. Asian-australasian J. Anim. Sci. 20, 633–637. doi: 10.5713/ajas.2007.633
Gutiérrez J. P., Goyache F. (2009). A computer program for genetic analysis of populations using molecular coancestry information. J Heredity. 96, 718–721. doi: 10.1093/jhered/esi118
Hoda A., Marsan P. A. (2012). “Genetic characterization of Albanian sheep breeds by microsatellite markers,” in Analysis of genetic variation in animals (Rijeka, Croatia: InTech).
Jonnakutti S., Bhupathi P., Buddhe E., Yeddula R., Jagannath A., Gutti B. (2018). Studies on Genetic Variability in Nellore Brown Sheep using microsatellite markers. Int. J. Livestock Res. 8, 149–157. doi: 10.5455/ijlr.20180331101808
Jyotsana B., Jakhesara S., Prakash V., Rank D. N., Vataliya P. H. (2010). Genetic features of Patanwadi Marwari and Dumba sheep breeds (India) inferred by microsatellite markers. Small Rumin Res. 93, 57–61. doi: 10.1016/j.smallrumres.2010.03.008
Kavitha S. T., Subramanian A., Sivaselvam S. N., Thiagarajan R., Balasubramanian S. (2015). Genetic characterisation of Tiruchy Black sheep of Tamil Nadu using microsatellite markers. Indian J. Anim. Res. 49, 320–324. doi: 10.5958/0976-0555.2015.00061.8
Kimura M., Crow J. F. (1964). The number of alleles that can be maintained in a finite population. Genetics 49, 725–738. doi: 10.1093/genetics/49.4.725
Kumarasamy P., Prema S., Ganapathi P., Karthickeyan S. M. K., Kanakaraj P. (2009). Molecular characterization of Coimbatore breed of sheep (Ovis aries) in South India. J. Gen. Evol. 3, 56–65.
Ligda C. H., Altarayrah J., Georgoudis A. (2009). The econogene consortium. genetic analysis of greek sheep breeds using microsatellite markers for setting conservation priorities. Small Rum. Res. 83, 42–48. doi: 10.1016/j.smallrumres.2009.04.002
Luikart G., Allendorf F. W., Cornuet J. M., Sherwin W. B. (1998). Distortion of allele frequency distributions provides a test for recent population bottlenecks. J. Hered. 89, 238–247. doi: 10.1093/jhered/89.3.238
Miller S. A., Dykes D. D., Polesky H. F. (1988). A simple salting-out procedure for extracting DNA from human nucleated cells. Nucleic Acids Res. 16, 1215. doi: 10.1093/nar/16.3.1215
Molabanti M., Bhupati P., Jeepalyam S., Gutti B., Talokar A. (2019). Genetic diversity analysis of macherla brown sheep using microsatellite markers. Int. J. Livestock Res. 9, 84–93.
Ohta T., Kimura M. (1973). A model mutation appropriate to estimate the number of electrophoretically detectable alleles in a finite population. Genet. Res. 22, 201–204. doi: 10.1017/S0016672300012994
Peakall R., Smouse P. E. (2012). GenAlEx 6.5: genetic analysis in Excel Population genetic software for teaching and research—an update. Bioinformatics 28, 2537–2539. doi: 10.1093/bioinformatics/bts460
Peter C., Bruford M., Perez T., Dalamitra S., Hewitt G., Erhardt G. (2007). Genetic diversity and subdivision of 57 European and Middle-Eastern sheep breeds. Anim. Genet. 38, 37–44. doi: 10.1111/j.1365-2052.2007.01561.x
Phookan. A., zaman. G., das. B., Das. A., Das. P. J., Sharma. M., et al. (2024). Genetic diversity analysis of native sheep population of Eastern Indian Himalayas using microsatellite DNA markers. Indian J. Anim. Sci. 94, 532–538. doi: 10.56093/ijans.v94i6.139372
Pramod S., Kumarasamy P., Chandra A. R. M., Sridevi P., Rahumathulla P. S. (2009). Molecular characterization of Vembur sheep (Ovis aries) of South India based on microsatellites. Indian J. Sci. Technol. 2, 55–58. doi: 10.17485/ijst/2009/v2i11.9
Prasanna B. (2019). Molecular Genetic Analysis of Vizianagaram Sheep Using Microsatellite Markers. Sri Venkateswara Veterinary University, Tirupati.
Prema S., Sivaselvam S. N., Karthickeyan S. M. K. (2008). Evaluation of genetic diversity in Mecheri sheep (Ovis aries) of Tamil Nadu using microsatellite markers. Indian J. Biotechnol. pp, 401–403.
Radha P., Sivaselvam S. N., Kumarasamy P., Kumanan K. (2011). Genetic diversity and bottleneck analysis of Kilakarsal sheep by microsatellite markers. Indian J. Biotechnol. 10, 52–55.
Raja K. N., Jain A., Singh G., Kumar L., Yadav H. K., Arora R. (2012). Ramnad White sheep - Phenotypic and genetic characterization. Indian J. Anim. Sci. 82, 1082–1086. doi: 10.56093/ijans.v82i9.23676
Reddy P. R. K., Jakkula R., Reddy A. N., Kumar D. S., Lakshmi R. K. S., Hyder I. (2018). Assessment of feed resources availability for livestock in the semi-arid region of Andhra Pradesh. Indian J. Anim. Nutr. 39, 59–65. doi: 10.5958/2231-6744.2018.00007.5
Reddy P. P., Vinoo R., Muralidhar M., Venkatasesaiah C. H., Aswani Kumar K., Sudhakar K. (2021). Phenotypic characterization of macherla sheep- A lesser-Known sheep breed of andhra pradesh. J. Anim. Res. 3, 433–443. doi: 10.30954/2277-940X.03.2021.13
Sharma. R., Ahlawat. S., Sharma. H., Sharma. P., Panchal. P., Arora. R., et al. (2020). Microsatellite and mitochondrial DNA analyses unveil the genetic structure of native sheep breeds from three major agro−ecological regions of India. Sci. Rep. 10, 20422. doi: 10.1038/s41598-020-77480-6
Sharma R., Pandey A. K., Singh L. V., Maitra A., Arora R., Bhatia S., et al. (2010). Microsatellite-based diversity estimation of Changthangi – a high-altitude sheep breed of India. Indian J. Anim. Sci. 80, 436.
Slatkin M. (1985). Rare alleles as indicators of gene flow. Evolution 39, 53–65. doi: 10.2307/2408516
Sodhi M., Mukesh M., Bhatia S. (2006). Characterizing Nali and Chokla sheep differentiation with microsatellite markers. Small ruminant Res. 65, 185–192. doi: 10.1016/j.smallrumres.2005.04.032
Szpiech Z. A., Rosenberg N. A. (2011). On the size distribution of private microsatellite alleles. Theor. population Biol. 80, 100–113. doi: 10.1016/j.tpb.2011.03.006
Takezaki N., Nei M. (1996). Genetic distances and reconstruction of phylogenetic trees from microsatellite DNA. Genetics 144, 389–399. doi: 10.1093/genetics/144.1.389
Thiagarajan R. (2012). genetic diversity and bottleneck analysis of umblachery cattle by microsatellite marker. SCIBTech J. Biotechnol. 2, 28–33.
Keywords: genetic divergence, semi-arid sheep, microsatellites, local sheep populations, Macherla sheep
Citation: Punuru PR, Regula V, Metta M, Krovvidi S, Bhumireddy JM, Baratam P, Sunkara V and Poonooru RR (2025) Genetic characterization of semi-arid sheep populations in India using microsatellite markers. Front. Anim. Sci. 6:1553610. doi: 10.3389/fanim.2025.1553610
Received: 31 December 2024; Accepted: 17 March 2025;
Published: 08 April 2025.
Edited by:
Regina Roessler, University of Kassel, GermanyReviewed by:
Martha Nchang Bemji, Federal University of Agriculture, Abeokuta, NigeriaBozidarka Markovic, University of Montenegro, Montenegro
Copyright © 2025 Punuru, Regula, Metta, Krovvidi, Bhumireddy, Baratam, Sunkara and Poonooru. This is an open-access article distributed under the terms of the Creative Commons Attribution License (CC BY). The use, distribution or reproduction in other forums is permitted, provided the original author(s) and the copyright owner(s) are credited and that the original publication in this journal is cited, in accordance with accepted academic practice. No use, distribution or reproduction is permitted which does not comply with these terms.
*Correspondence: Ravikanth Reddy Poonooru, cnJweTh4QHVtc3lzdGVtLmVkdQ==; cmF2aS5udXRyaXRpb24wMDFAZ21haWwuY29t