 Gedefaw Fetene1
 Teshale Dereje Birara
- 1Federal Technical and Vocational Education and Training Institute, Woreta Agricultural Technical Vocational Educational and Training College, Woreta, Ethiopia
- 2Department of Animal Science, Bahir Dar University Colleges of Agriculture and Environmental Science, Bahir Dar, Ethiopia
- 3Department of Animal Science, Debre Markos University, Debre Markos, Ethiopia
The Surma cattle population is one of Ethiopia’s indigenous cattle populations with valuable qualitative and quantitative traits. This study aimed to identify the phenotypic characteristics of the Surma cattle population under farmers’ management conditions. A total of 384 Surma cattle were randomly sampled for the study of phenotypic traits. A purposive, multi-stage, stratified random sampling technique was used to determine the number of districts, kebeles, and households. Data were gathered through field observations and linear body measurements from the study population based on sex, district, and production system. The coat color of Surma cattle was spotted (82%), followed by patchy (12.2%) and plain (5.2%). The overall mean values for body weight (BW), chest girth (CG), body length (BL), height at the withers (HW), rump height (RH), rump length (RL), ear length (EL), and horn length (HL) were 223.54 ± 20 kg, 149.15 ± 7.16 cm, 108.60 ± 7.3 cm, 112.65 ± 7.5 cm, 111.34 ± 7.11 cm, 20.05 ± 1.6 cm, 18.48 ± 1.25 cm, and 25.00 ± 6.6 cm, respectively. The quantitative variables were significantly (p< 0.05) different between production systems, except for HL and EL, and all the measurements were significant (p< 0.05) between sexes. This study provides basic phenotypic information about Surma cattle for the first time, which is important for genetic study, conservation, and breed improvement. The Surma breed has a huge and well-framed body size in both male and female animals, which indicates that this breed may be used for beef breed improvement.
1 Introduction
Ethiopia is one of the Sub-Saharan African countries with a large potential for livestock production. The total number of cattle in all regions of the country, except for the non-sedentary population of three zones in Afar and six zones in the Somali Region, has been estimated to be over 66.2 million, 43.31% of which were males and 56.69% were females. The country has the largest population in Africa (CSA, 2023). The majority of these cattle (98.71%) are indigenous breeds, which are kept under extensive management (CSA, 2023).
Given its diversified ecology and large number of animals, Ethiopia is considered a center of diversity for animal genetic resources in general and indigenous cattle in particular (Mulugeta, 2015). The cattle breeds in Ethiopia are a valuable source of genetic material due to their adaptation to harsh climatic conditions, their ability to better utilize the limited and poor-quality feed resources, and their tolerance to the range of diseases found in these regions.
Ethiopia has 28 recognized indigenous cattle breeds (Assefa and Hailu, 2018) and is known for its diversified livestock production systems. The prospective development and the sustainability of local cattle production systems are dependent upon the availability of this genetic variation. The Ethiopian cattle breeds are categorized into four broad groups: hump-less, Zebu, Sanga, and Intermediate Sanga/Zenga (Hagos, 2016). The different cattle breeds/types under the four broad categories are found distributed in different agroecological zones. In general, in Ethiopia, 46% of the cattle population is found in the highlands, 16% in sub-humid zones, 16% in semi-arid regions, 14% in arid zones, and 8% in the humid parts of the country (MOARD, 2004).
There are distinct breeds suitable for diverse purposes in the different production environments or ecological zones. For instance, the Sheko cattle breed is known for its greater trypan tolerance compared with Zebu cattle, while the Abigar cattle breed has the potential to thrive in extreme heat and during disease outbreaks (Dinkissa, 2023). Characterization information needs to be available to design an appropriate animal breeding program for village conditions (Vieira et al., 2015).
In light of this, characterization of the animal genetic resources in their original location is a crucial foundation for the documentation, conservation, utilization, and development of sustainable genetic improvement approaches (Mustefa, 2023). Potential animal genetic resources are associated with marginal environments and marginalized pastoral communities. Different studies have been carried out to characterize the indigenous cattle breeds and populations found in the southwestern area of Ethiopia (Bahbahani et al., 2018; Desta et al., 2011; Fedlu et al., 2007; Admasu and Bayou, 2024). However, with regard to the Surma cattle population, there is insufficient information about its phenotypic characteristics, and it has not been registered in the Domestic Animal Diversity Information System (DAD-IS) before. Therefore, this study was systematically conducted to phenotypically characterize and describe the Surma cattle populations in this area, with the aim to facilitate their rational development, utilization, and conservation strategies in the Bench Maji Zone.
2 Materials and methods
2.1 Description of the study area
The study was conducted in the Bench Maji Zone, Southwest Ethiopia, where the Surma cattle populations reside. For the identification of the study area, two districts (i.e., Menit Shasha and Maji) were included due to the limited distribution of Surma cattle (Table 1; Figure 1).
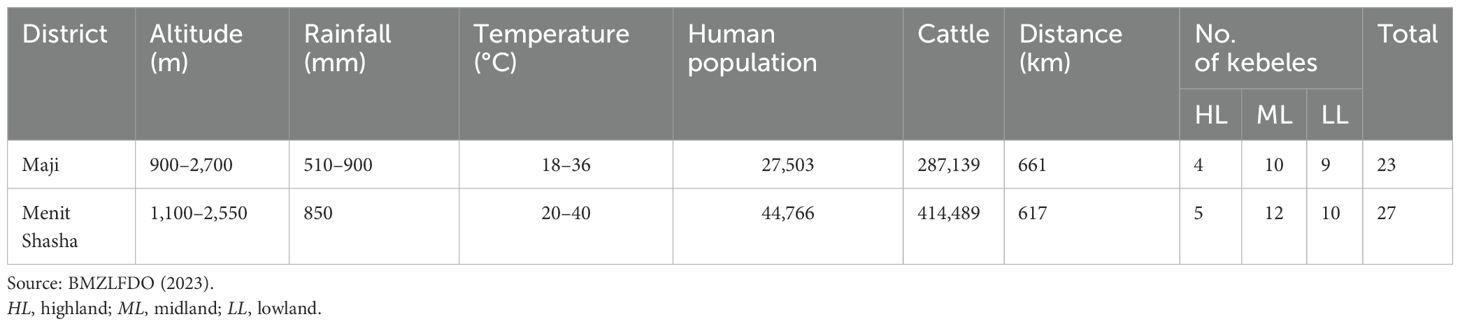
Table 1. Description of the study districts.
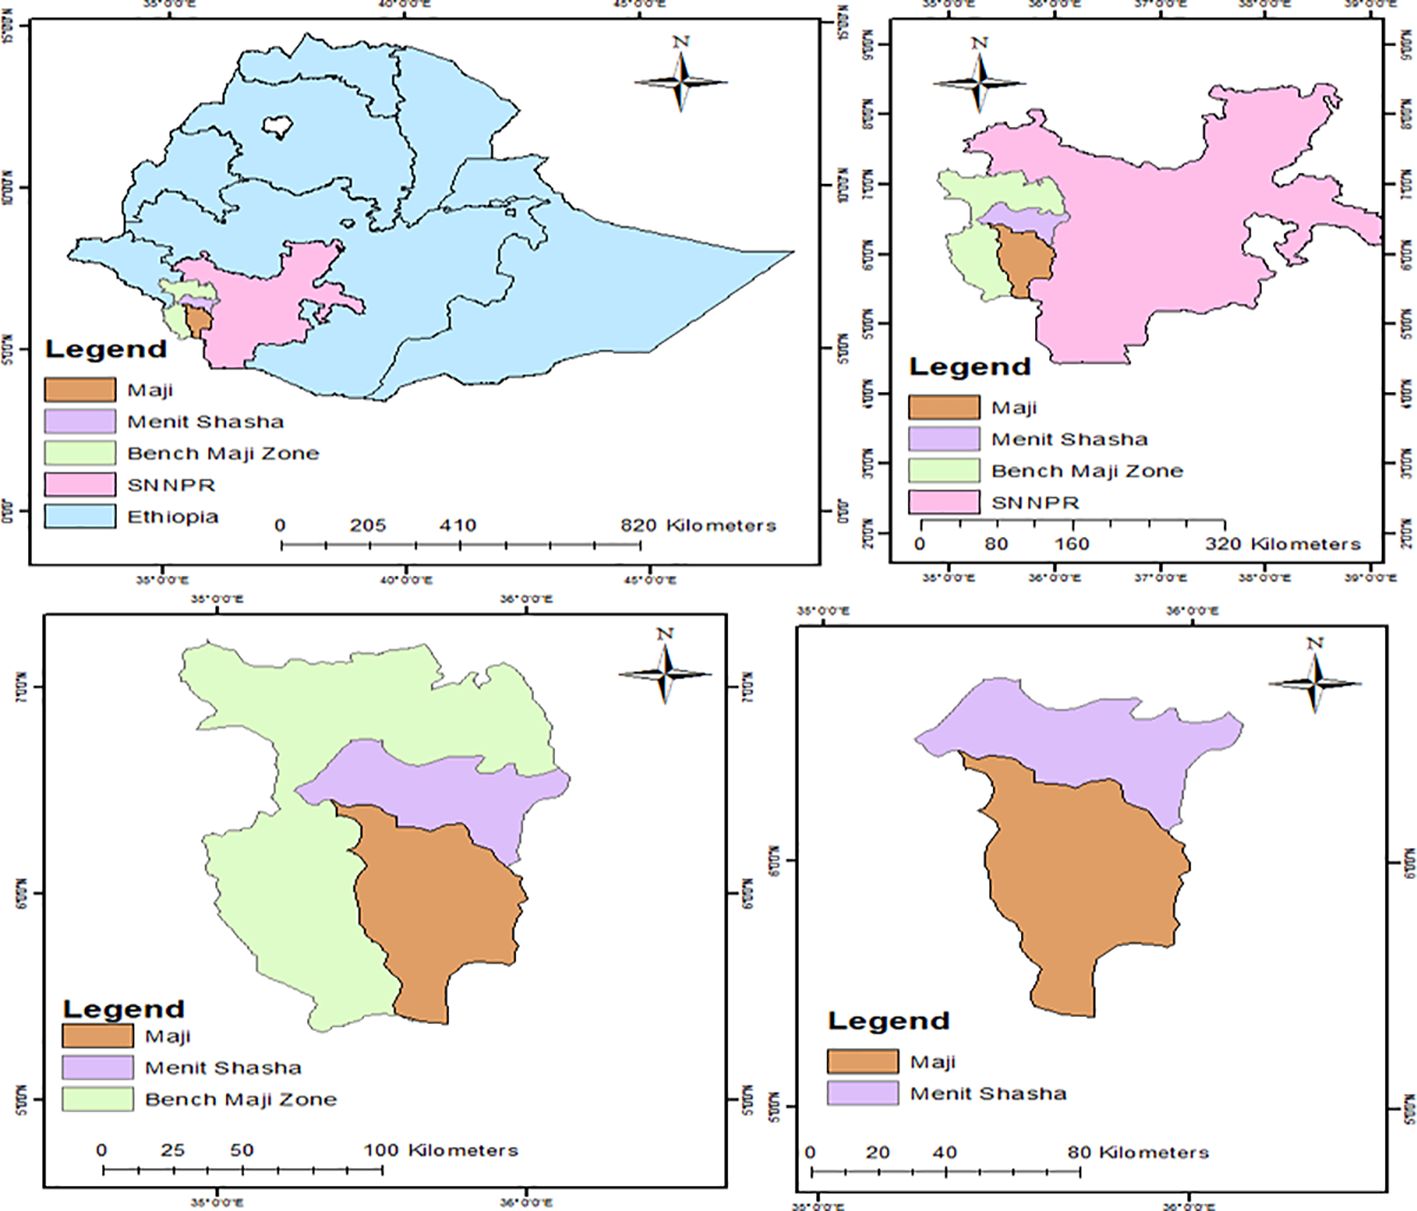
Figure 1. Map of the study areas.
2.1.1 Menit Shasha district
Menit Shasha district is found in the southwestern part of Ethiopia in the South Nations, Nationalities, and Peoples Region, in the Bench Maji Administrative Zone. It is one of the 11 districts of the Bench Maji Administrative Zone. This district is divided into 27 kebeles, among which 5 kebeles have highland, 12 kebeles have midland, and 10 kebeles have lowland agro-climatic conditions (MSLFDO, 2023; BMZLFDO, 2023).
According to CSA (2007), it has a total human population of 44,766 (22,549 male and 22,217 female inhabitants, of whom, 2,778 dwell in urban areas and 41,988 are in rural areas). It has a total land surface area of 2,770 km2. The district is located 617 km away from Addis Ababa. According to the data from MSLFDO (2016), the district has an elevation ranging from 1,100 to 2,200 m above sea level. The mean annual temperature varies from 20°C to 40°C, and the mean annual rainfall is recorded as 850 mm. The climate of the area is characterized by a long rainy season (June–November) and a short rainy season that extends from the end of March to May, while the dry and semi-dry season occurs between December and March (MSLFDO, 2016; BMZLFDO, 2016).
2.1.2 Maji District
Maji District is found in the southwestern part of Ethiopia in the South Nations, Nationalities, and Peoples Region, in the Bench Maji Administrative Zone. It is one of the 11 districts of the Bench Maji Administrative Zone. This district is divided into 23 kebeles, among which four kebeles have highland, nine have midland, and nine have lowland agro-climatic conditions (MLFDO, 2016). It has a total human population of 27,503 (13,489 male and 14,014 female inhabitants) (CSA, 2007). According to MLFDO (2016), it has a total land surface area of 1,651 km2. The district is 661 km away from Addis Ababa. According to the data from the MSLFDO, 2023 and BMZLFDO, 2023.
2.2 Samples and sampling techniques
A rapid field survey was carried out by the researcher in collaboration with experts and professionals from the Zonal and District Livestock and Fishery Development Office, Bench Maji Zone.
A purposive, multistage, stratified random sampling technique was employed for the selection of the study areas, kebeles, households, and individual cattle for qualitative and quantitative characterization. The sample was structured into three stages, as follows:
In the first stage, the Surma cattle predominant districts (i.e., Menit Shasha and Maji) were purposively selected from the Bench Maji Zone based on herd size per household, the suitability of the area for cattle production, road access, and the willingness of the farmers to participate in the program.
In the second stage, each selected district was stratified into two production systems (i.e., pastoralist and agro-pastoralist) for the study. From each production system, two kebeles were purposively selected, totaling four kebeles per district and eight kebeles across the study (Table 2). The selection criteria were cattle population density, accessibility, and the absence of tribal conflict and other constraints.

Table 2. Sampled information for phenotypic characterization.
In the third stage, from the selected kebeles, 184 households that owned five mature Surma cattle were randomly selected. The final sample size was determined according to the FAO (2012) guidelines for the phenotypic characterization of animal genetic resources for finite populations.
According to BMZLFDO (2023), the estimated population of mature cattle (males and females) in the study area was approximately 80,000. The required sample size was calculated as: n = (Z/m)2 × (p(1 − p).
Hence, based on the above formula:
The finite population correction (FPC) factor is routinely used in the calculation of sample sizes for simple random samples. The sample size equation used to solve for n′ (new sample size) when taking the FPC into account is as follows:
In the equations, n denotes the sample size, N is the population size, P is the sample proportion, Z represents the confidence level at 95%, m is the 5% significance level (0.05), and n′ is the new sample size.
A total of 382 cattle were considered for the qualitative and quantitative trait studies.
Based on the FAO (2012) guidelines for the phenotypic characterization of finite populations using simple random sampling, the required sample size was calculated as 382 cattle. However, for practical purposes of equal representation across the eight selected kebeles, the sample size was rounded up to 384 cattle (i.e., 48 animals per kebele). This slight increase does not compromise the statistical validity and allows for balanced sampling across strata, ensuring representativeness and ease of field implementation.
2.3 Data collection procedures
Primary data were collected through field measurements and observations, while secondary data, such as the cattle population and number of kebeles with the classification of the production system, were obtained from the Zonal and District Pastoral and Livestock and Fishery Development Office. Repeated exploratory visits helped to verify the accessibility and the availability of cattle in each selected kebele.
The age of cattle was determined based on the owners’ estimation and the dentition pattern, with only mature animals (≥4 years old) included in the study. Pregnant and sick animals were excluded to avoid measurement errors.
The qualitative traits that were examined and recorded included the coat color pattern, coat color type, horn shape and horn orientation, body condition score, dewlap size, hump position, hump shape, tail length, and udder size. Simultaneously, linear body measurements such as the chest girth (CG), body length (BL), height at the withers (HW), rump height (RH), rump length (RL), ear length (EL), and horn length (HL) were taken and recorded from the sampled mature males and females.
Each measurement was taken twice, and the average value was used for analysis. During measurements, the animals were restrained so that the heads and necks were most on a straight line to ensure the accuracy of the parameters being measured. The measurements were taken using a measuring tape and a graduated measuring stick.
2.4 Data management and statistical analysis
Data from the field measurements and trait observations were analyzed using the Statistical Package for the Social Sciences (SPSS, version 20). Descriptive statistics were employed to summarize the key parameters. The chi-square test was used to determine the association between categorical variables, such as the coat color pattern, coat color distribution, horn shape, horn orientation, ear orientation, hump size, dewlap size, tail size, and udder size.
The correlations of live body weight with the different body measurements were evaluated using Pearson’s correlation coefficients, which were calculated separately for males and females.
Furthermore, independent-samples t-tests were used to compare the mean values across sexes, districts, and production systems. When the F test showed significant differences, the means were subsequently separated using a two-tailed t-test (pairwise separation).
The statistical model is as follows:
where Yij is the observed value of the trait of interest, µ is the overall mean, Ai is the fixed effect of the ith production system (agro-pastoral or pastoral), Sj is the fixed effect of the jth sex (female or male), pk is the fixed effect of the kth district (Menit Shasha or Maji), and eij is the residual random effect associated with each record.
The interaction effects between districts, sexes, and production systems were considered during the preliminary model building phase. However, they were not included in the final model due to the limited sample sizes in certain interaction subgroups, which would have led to unreliable estimates and reduced model stability. In addition, model diagnostics indicated that the interaction terms did not significantly improve the model fit and that their inclusion introduced unnecessary complexity. Therefore, a main-effects model was retained to ensure model parsimony, robustness, and interpretability of the key variables. Further investigation of the interaction effects is being pursued in a follow-up study using a larger dataset.
3 Results and discussion
3.1 Qualitative trait variation
The results indicated that the predominant average coat color patterns of the identified Surma cattle were 82.0% spotted, followed by 12.2% patchy and 5.2% plain. Surma cattle have a predominantly red and white spotted coat color distribution (48.4%), followed by white and black spotted (18.8), with other diverse colors including fawn (16.7%), dark red (1.8%), and red and spotted (4.7%). As shown in Table 3, there were no significant differences between districts and agroecology and sex factors for both coat color pattern and coat color distribution. The sampled Surma cattle had non-uniform coat colors and only medium dewlap size. The hump size varied from small to large and the udder size from small to medium (Table 3). Highly contrasting coat color patterns were reported in the study of the Arsi, Bale, and Jemjem cattle breeds in Ethiopia, with the majority of the cattle population exhibiting a uniform coat color (Mustefa et al., 2024b). Similarly, in a higher proportion of the Guraghe and Jimma cattle populations, the majority of the cattle populations possessed red-colored, uniform body color patterns (Mustefa et al., 2024a). In addition to these, the Surma cattle population was different from the Boran cattle population, which possessed mainly white, light gray, fawn, or light brown with gray, black, and brown coat colors, as well as shading on the head, neck, shoulders, and hindquarters (Hussien et al., 2024).
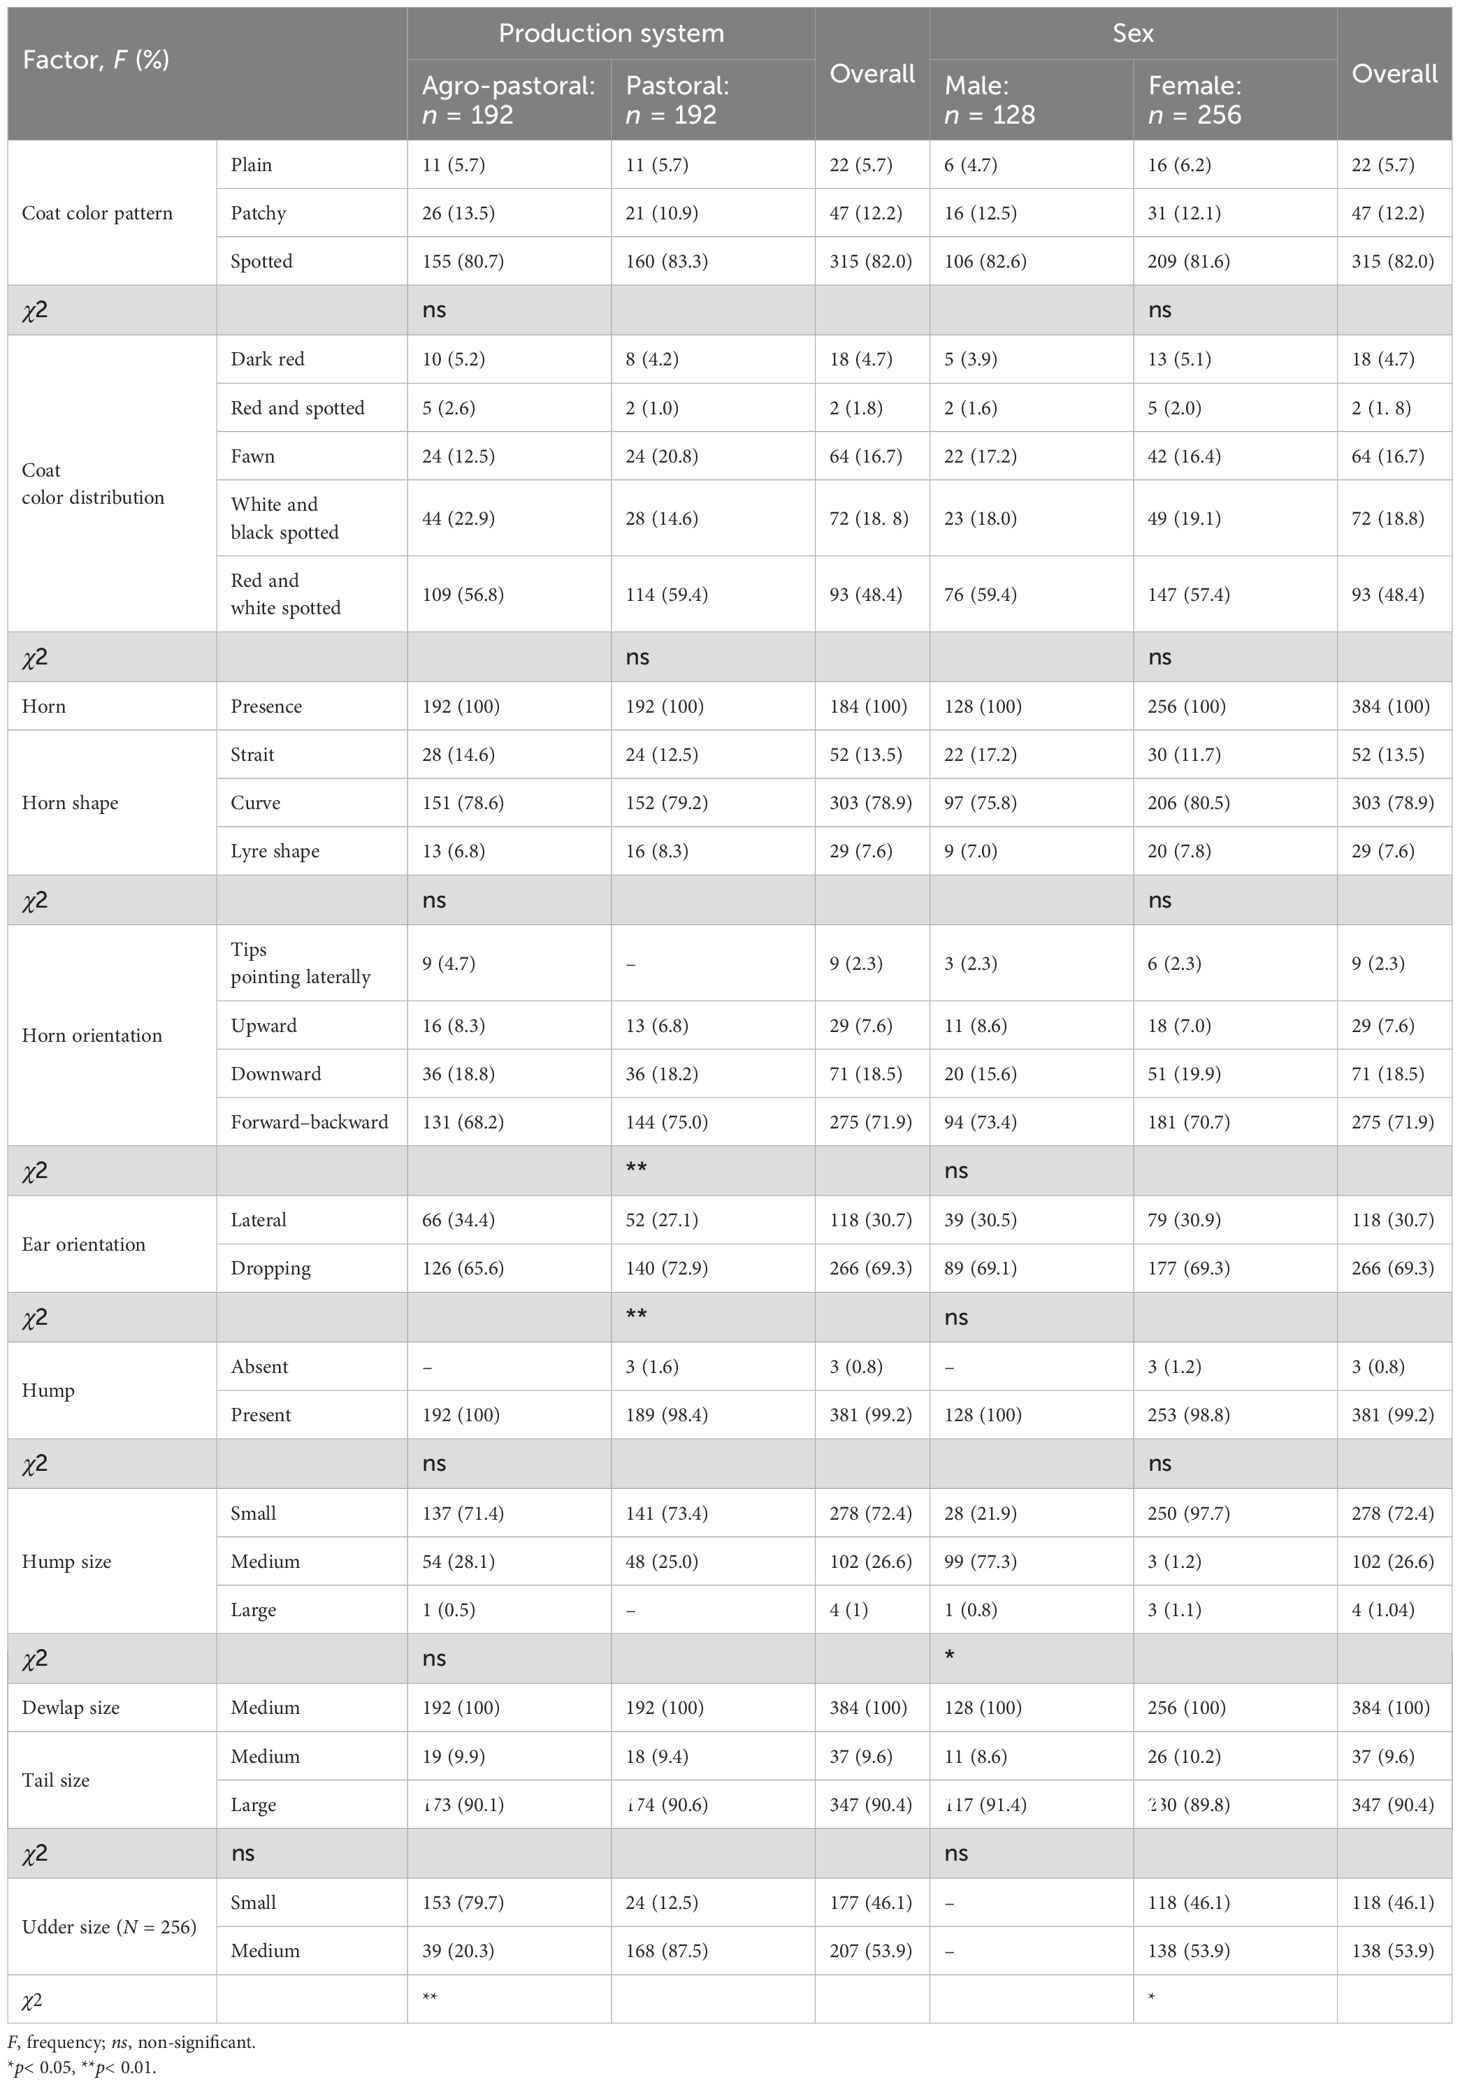
Table 3. Morphological features of the indigenous Surma cattle populations reared in the study area.
The Surma cattle breed also displayed different qualitative traits compared with the Raya cattle breed, which showed an upright, lyre-shaped horn, a large dewlap, a naval flap, and perpetual sheath sizes, as well as a dominant dark red body color with a uniform body color pattern, except for the similarity in hump size (Mustefa et al., 2021).
In the study area, of the sampled cattle population, 100% of Surma cattle has a curved horn, while 78.9% has a dominant horn shape, followed by a straight (13.5%) and a lyre shape (7.6). Of the total identified cattle, 71.9% had a forward–backward type of horn orientation, 69.3% had a dropping ear orientation, 72.4% had a small hump size, 100% had a medium dewlap size, 90.4% had a large tail size, and 53.9% had a medium udder size. The findings of this study are in agreement with those reported by Belayhun et al. (2024), where the majority of the cattle population in northern Ethiopia had a small hump size, a medium dewlap size, a dropping ear orientation, a large tail, and a curved horn shape compared with those reared in the Bench Sheko zone, southwestern Ethiopia, which are characterized by a plain coat color pattern, a forward and upward horn orientation, a lateral ear orientation (97.5%), and hump-less male cattle (Baye et al., 2022), as well as with the cattle population in Semen Achefer, Sekela, and Jabitenan districts of the Western Gojjam Zone of Amhara National Regional State (Tenagne et al, 2016). In addition, the Surma cattle population has no permanent settlement and adapted to different environments, while the Sheko cattle population is environmentally adapted to the existing environment or a to mixed production system (Bayou et al., 2014; Desta et al., 2011).
3.2 Morphometric measurements
The linear measurements for the Surma cattle populations from the different districts and production systems, as well as different sex factors, are presented in Table 4. The measured physical dimensions are displayed in Figure 2. The overall least squares mean and standard error values for CG, BL, HW, RH, RL, EL, and HL were 149.15 ± 7.16 cm, 108.60 ± 7.3 cm, 112.65 ± 7.5 cm, 111.34 ± 7.11 cm, 20.05 ± 1.6 cm, 18.48 ± 1.25 cm, and 25.00 ± 6.6 cm, respectively.
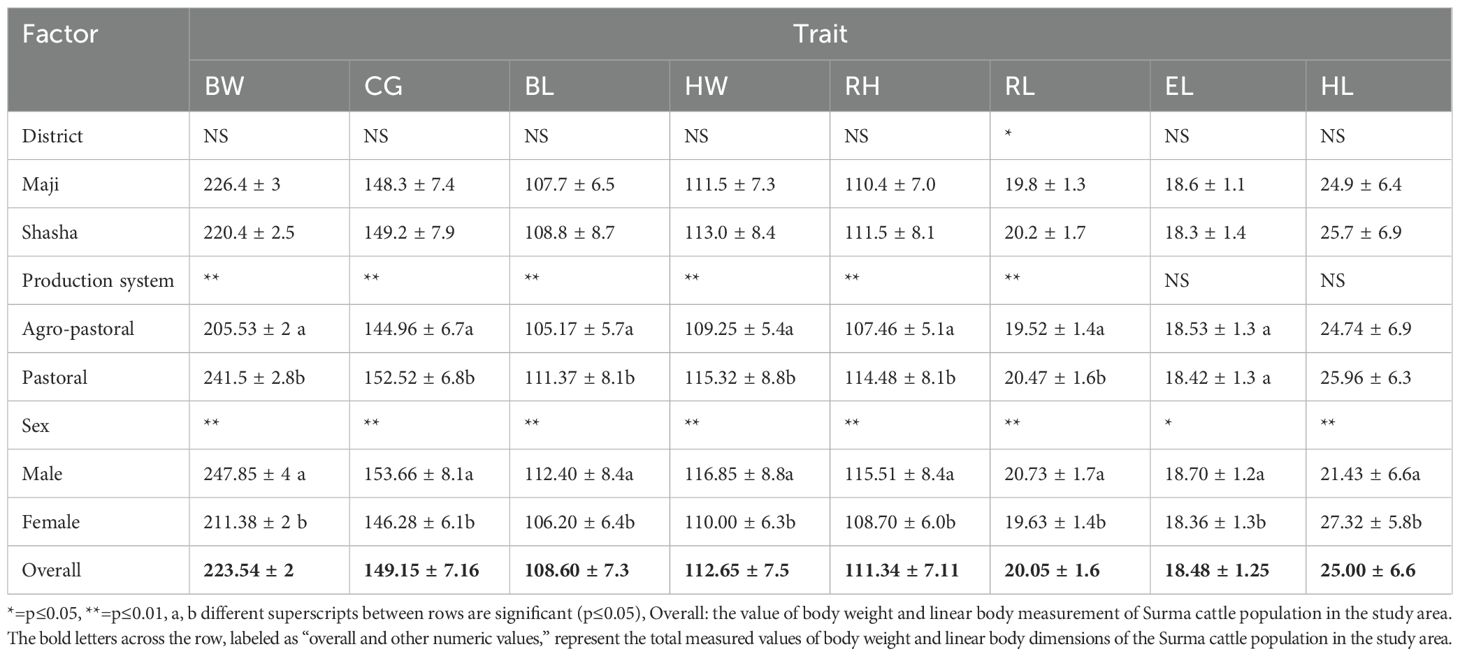
Table 4. Body weight and linear body measurements (in centimeters) of the adult local cattle population in the study area.
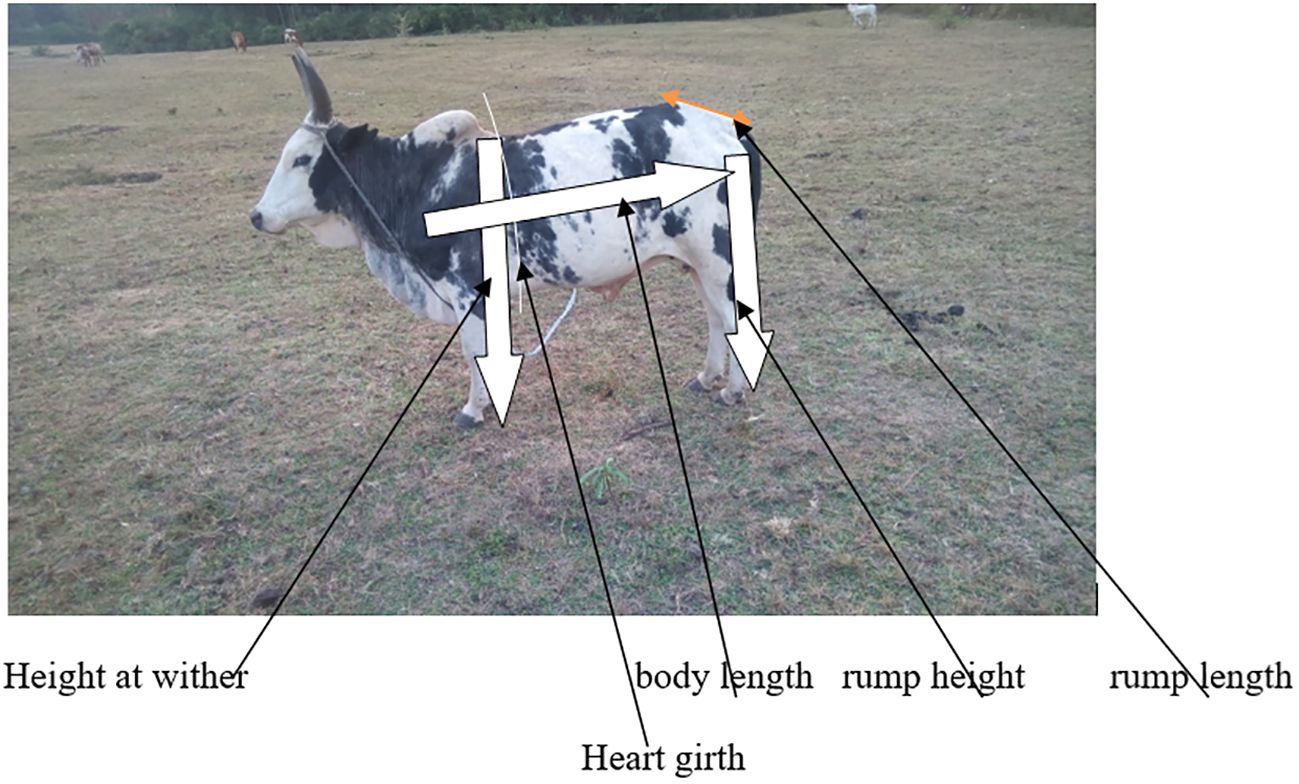
Figure 2. Physical dimension measurements of Surma cattle.
3.2.1 Effect of districts
The effect of districts in the study area is presented in Table 4. Except for body weight (BW) and RL, there were no significant differences in the BW, CG, BL, HW, RH, EL, and HL measurements between districts. The values for BW, CG, BL, HW, RH, RL, EL, and HL were 226.4 ± 3, 148.3 ± 7.4, 107.7 ± 6.5, 111.5 ± 7.3, 110.4 ± 7.0, 19.8 ± 1.3, 18.6 ± 1.1, and 24.9 ± 6.4 in Maji and were 220.4 ± 2.5, 149.2 ± 7.9, 108.8 ± 8.7, 113.0 ± 8.4, 111.5 ± 8.1, 20.2 ± 1.7, 18.3 ± 1.4, and 25.7 ± 6.9 in Menit Shaha, respectively. These non-significant differences between districts may be due to the combined effects of agroecology, production system, and the similar handling system of the cattle owners in the study area. However, the results of this study are not consistent with those from the indigenous cattle population in West Gondar, Ethiopia, where significant differences were found among districts in terms of the BL, WH, and CG of the cattle population (Emru et al., 2020).
3.2.2 Effect of production system
Livestock production systems in Ethiopia are categorized into pastoral, agro-pastoral, mixed crop–livestock, urban and peri-urban, and specialized intensive farming. A livestock production system comprises a group of farm operations with approximately the same characteristics of climatic conditions and farming practices (Esmael Ahmed et al., 2019). In Ethiopia, the pastoral and agro-pastoral areas cover approximately 63% of the country’s landmass and are characterized by variable and unpredictable agroecology and resource attributes (Gelan, 2014).
3.2.3 The pastoral system
Pastoralists live in arid and semi-arid regions of the country that are not beneficial to rainfed agriculture (Abdulkadr, 2019). Livestock are the main economic sources of pastoralists, and they derive most of their income or sustenance from keeping livestock, where most of the feed is natural forage rather than cultivated fodders and pastures (Cervigni and Morris, 2016).
3.2.4 The agro-pastoral system
The agro-pastoral production system is practiced mainly in semi-arid areas, and livelihood is derived from joint crop–livestock operations. The majority lives within the marginal areas of the country, on the fringes of the pastoral zone. Cattle and cropping are complementary enterprises in the agro-pastoral system. As in the pastoral community, large herds are a repository of savings and confer status and security to the owners. Crops, on the other hand, provide residues that are used to feed cattle during the drier periods of the year (Pathot, 2020).
In this study, the production systems of animals had a significant effect (p< 0.01) on the linear body measurements and live body weight, except for EL and HL (Table 4). In the pastoral production system, the values of BW (241.5), CG (152.52), BL (111.37), HW (115.32), RH (114.48), and RL (20.47) of the cattle population were higher compared with those of the cattle population in the agro-pastoral production system. The production systems affect the body weight and the linear body measurements of animals. In different production systems, there are different feeding schemes and availability of animal feed, which is inconsistent with seasonal variations (Ayele et al., 2021). In the agro-pastoral production system, the animals obtain feed from natural grazing land and crop residues, while the animals in the pastoral production system obtain feeds from natural grass, shrubs, and tree seed pods (Tolera and Abebe, 2007). However, crop residues are characterized by a low-quality nutritional composition, such as higher fiber contents. The feeding system had a significant influence on most of the features analyzed, such as the average daily gain, carcass yield, and conformation (Avilés et al., 2015). Therefore, animals from pastoral production systems exhibit better quantitative measurements compared with those from the agro-pastoral production system.
3.2.5 Effect of sex
The quantitative characteristics of cattle showed variations (p< 0.01 and p< 0.05) based on sex of cattle (Figure 2). Male cattle had better (p< 0.01) BW, CG, BL, HW, RH, RL, HL, and EL (p< 0.05) metric values than the female population, while female cattle had better HL, BW, CG, BL, HW, RH, RL, and EL metric values than the male population. The variations can also show the marked differences between male and female cattle, as evidence for sexual dimorphism, with the males (as expected) exhibiting greater measurements (Lomillos and Alonso, 2020). Sex influences the growth and composition of body tissues. As livestock mature, sex-related differences in terms of muscle weight distribution emerge. Bulls typically have a higher muscle-to-bone ratio compared to both male and female calves (Firdaus et al., 2024a).
The metric values of CG, BL, HW, EL, and HL of the male and female cattle in the study area were greater than those of the cattle population in northern Ethiopia (Belayhun et al., 2024); however, male and female cattle had lower metric values of BL, HW, EL, and HL and higher metric values of CG compared with similar sex of the Raya cattle population in northern Ethiopia (Mustefa et al., 2021). In addition, the CG, BL, RH, and EL of the male and female cattle in this study had lower values. However, the HL values were higher than those in the male and female cattle populations, whereas the HW values were higher in male cattle and lower in the female cattle population than those of the indigenous cattle breed in the Borana Zone of Oromia Regional State, Ethiopia (Hussien et al., 2024). The metric value differences between sexes in the quantitative characterization of this study might be due to hormonal differences, such as the estrogen and testosterone in the animal body, including the effect of reproductive physiology on body size (Texada et al., 2020). The Boran cattle population comprises one of the best cattle populations for meat production in Ethiopia (Mummed and Webb, 2019a). In this study, the Surma cattle population had better HL and HW (male) than the Boran cattle population. Therefore, these Surma cattle may contribute to the production of beef since improved beef cattle fattening practices and profit-oriented fattening systems are not adopted in the study areas and the administrative zone (Milikias and Gebre, 2024a).
Different lowercase letters between rows are significant (p ≤ 0.05).
BW, body weight; CG, chest girth; BL, body length; HW, height at the withers; RH, rump height; RL, rump length; EL, ear length; HL, horn length; NS, non-significant
*p ≤ 0.05, **p ≤ 0.01
3.3 Correlation of body measurement traits
Quantitative trait correlations for female and male Surma cattle (Table 5) showed low negative to high positive values. In the female sample population, the strongest degree of relationship was seen between BW and CG (r = 0.928), followed by HW and RH (r = 0.922). There was also a strong relationship between BL and RH (r = 0.824), BL and HW (r = 0.832), CG and RH (r = 0.795), CG and HW (r = 0.744), CG and RL (r = 0.684), CG and BL (r = 0.630), and BW and RL (r = 625). The correlations between RH and RL (r = 0.591) and between HW and RL (r = 0.532) were moderate. The implication of these correlations is that an improvement in one parameter will give a positive response to the other parameter. The correlation of the linear body measurements can be used as a selection index to rank cattle based on the comparative assessments of their growth rate or performance for morphological traits (Yahaya et al., 2020).
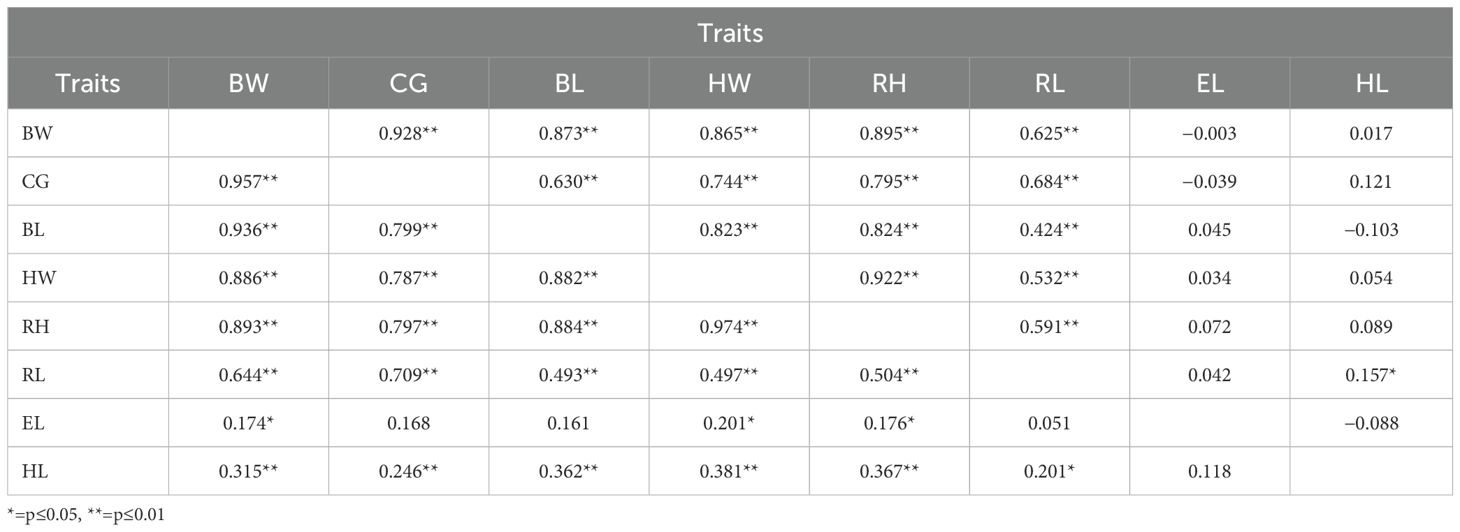
Table 5. Correlations of the quantitative traits of Surma cattle (above diagonal for female cattle and below diagonal for male cattle).
In male cattle, the strongest degree of relationship was observed between HW and RL (r = 0.974), followed by BW and CG (r = 0.957), BW and BL (r = 0.936), BW and RH (r = 0.893), and BW and HW (r = 0.886). There were also strong correlations between RH and BL (r = 0.884), HW and BL (r = 0.882), CG and BL (r = 0.799), CG and RH (r = 0.797), CG and HW (r = 0.787), and CG and RL (r = 0.709). High and positive correlations between traits are an important implication for simultaneous trait selection in breeding programs and for synergetic improvement of traits in cattle (Beavis et al., 2023).
There was a strong and significant (p< 0.05) correlation between several linear body measurement traits, suggesting that either of these variables or their combinations could provide a good estimation for the Surma cattle population for the prediction of body weight traits from others. The correlations between the CG, BL, HW, RH, and RL obtained in this study were higher compared with the values reported in Tenagne et al, 2016. Similarly, Dereje (2015) found moderate and significant (p< 0.001) positive correlations among the linear body measurements for the Bako Tibe and Gobu Sayo cattle. In this study, the correlations between the linear body measurements can be effectively utilized to predict body weight and improve the breeding strategies for the Surma cattle population in the Bench Maji Zone.
4 Conclusion
It can be concluded from the findings of this study that the predominant coat color pattern of the studied Surma cattle is spotted followed by patchy and plain. Surma cattle have a predominantly red and white spotted coat color distribution, followed by white and black spotted, with other diverse colors including fawn, dark red, and red and spotted. The sex of the animals and the production system (agro-pastoral and pastoral) had a significant effect on the body measurements. Thus, the mean values of most of the quantitative variables were significantly different between production systems, except for HL and EL, and all of the measurements were significant between sexes. Therefore, this study demonstrates that the Surma breed has a good and well-framed body size in both male and female animals, which indicates that this breed may be used for beef breed improvement. However, conservation should be done to protect this cattle population prior to breeding activities.
Data availability statement
The raw data supporting the conclusions of this article will be made available by the authors, without undue reservation.
Ethics statement
The animal study was approved by Debre Markos, Debre Markose University. The study was conducted in accordance with the local legislation and institutional requirements.
Author contributions
GF: Conceptualization, Data curation, Formal analysis, Investigation, Methodology, Resources, Software, Visualization, Writing – original draft, Writing – review & editing. WA: Supervision, Validation, Writing – review & editing. DK: Supervision, Validation, Writing – review & editing. TD: Conceptualization, Data curation, Methodology, Visualization, Writing – original draft, Writing – review & editing.
Funding
The author(s) declare that no financial support was received for the research and/or publication of this article.
Acknowledgments
The author acknowledges the Ministry of Agriculture, Rural Development and Surma farmers for their strong participation in field work.
Conflict of interest
The authors declare that the research was conducted in the absence of any commercial or financial relationships that could be construed as a potential conflict of interest.
Generative AI statement
The author(s) declare that no Generative AI was used in the creation of this manuscript.
Publisher’s note
All claims expressed in this article are solely those of the authors and do not necessarily represent those of their affiliated organizations, or those of the publisher, the editors and the reviewers. Any product that may be evaluated in this article, or claim that may be made by its manufacturer, is not guaranteed or endorsed by the publisher.
References
Abdulkadr A. A. (2019). Benefits and challenges of pastoralism system in Ethiopia. Studia Mundi – Economica 6, 56–67. doi: 10.18531/Studia.Mundi.2019.06.03.56-67
Admasu Z. and Bayou E. (2024). Current population size and risk status of the indigenous endangered Sheko cattle breed in south-west Ethiopia. Sci. Temper 15, 1973–1978. doi: 10.58414/SCIENTIFICTEMPER.2024.15.2.02
Assefa A. and Hailu A. (2018). Ethiopian indigenous cattle breed’s diversity, distribution, purpose of keeping, and their potential threats. J. Biol. Innovation 7, 770–789. Available at: https://www.jbino.com/docs/Issue05_10_2018.pdf.
Avilés C., Martínez A. L., Domenech V., and Peña F. (2015). Effect of feeding system and breed on growth performance, and carcass and meat quality traits in two continental beef breeds. Meat Sci. 107, 94–103. doi: 10.1016/j.meatsci.2015.04.016
Ayele J., Tolemariam T., Beyene A., Tadese D. A., and Tamiru M. (2021). Assessment of livestock feed supply and demand concerning livestock productivity in Lalo Kile district of Kellem Wollega Zone, Western Ethiopia. Heliyon 7, e08177. doi: 10.1016/j.heliyon.2021.e08177
Bahbahani H., Afana A., and Wragg D. (2018). Genomic signatures of adaptive introgression and environmental adaptation in the Sheko cattle of southwest Ethiopia. PloS One 13, e0202479. doi: 10.1371/journal.pone.0202479
Baye G. G., Masho W., Begna R., and Admasu Z. (2022). Morphometric traits and structural indices of indigenous cattle reared in Bench Sheko zone, southwestern Ethiopia. Heliyon 8, e10188. doi: 10.1016/j.heliyon.2022.e10188
Bayou E., Haile A., Gizaw S., and Mekasha Y. (2014). Characterizing husbandry practices and breeding objectives of Sheko cattle owners for designing conservation and improvement strategies in Ethiopia. Livestock Res. Rural Dev. 26, 235. Available at: http://www.lrrd.org/lrrd26/12/bayo26235.html.
Beavis W. and Mahama A. A. (2023). “Plant Breeding Basics,” in Quantitative Genetics for Plant Breeding. Eds. Suza W. P. and Lamkey K. R. (Iowa State University Digital Press).
Belayhun T., Aseged T., Melak A., and Tafere M. (2024). Morphological and morphometric characterization of cattle population in northern Ethiopia. Ecol. Genet. Genomics 32, 100273. doi: 10.1016/j.egg.2024.100273
BMZLFDO. (2016). Annual report on climate characterization survey, Mizan Aman, Southwest Ethiopia: Bench Maji Zone Livestock and Fishery Development Office.
BMZLFDO. (2023). Annual report on climate characterization survey, Mizan Aman, Southwest Ethiopia: Bench Maji Zone Livestock and Fishery Development Office.
Central Statistical Agency (2007). Statistical report on population and housing census. Volume I (Addis Ababa).
Central Statistical Agency (2023). Agricultural sample survey report on livestock and livestock characteristics Vol. 2 (Addis Ababa: Federal Democratic Republic of Ethiopia), 194.
Cervigni R. and Morris M. (2016). Confronting Drought in Africa’s Drylands: Opportunities for Enhancing Resilience (The World Bank). doi: 10.1596/978-1-4648-0817-3
Dereje B. (2015). On farm phenotypic characterization of indigenous cattle and their production systems in Bako Tibe and Gobu Sayo districts of Oromia region, Ethiopia. MSc Thesis. Haramaya University, Ethiopia. Available at: http://ir.haramaya.edu.et/hru/bitstream/handle/123456789/3098/Dereje%20Bekele.pdf?sequence=1.
Desta T. T., Ayalew W., and Hegde B. P. (2011). Breed and trait preferences of Sheko cattle keepers in southwestern Ethiopia. Trop. Anim. Health Prod. 43, 851–856. doi: 10.1007/s11250-010-9772-2
Dinkissa A. F. (2023). Genetic basis of Abigar and Sheko cattle breed adaptations in the tsetse infested lowlands of Ethiopia: A review. Int. J. Biosci. Biochem. 5, 14–18. doi: 10.33545/26646536.2023.v5.i1a.34
Emru E., Abegaz S., Getu A., Mengistu A., and Fantahuni T. (2020). Phenotypic characterization of genetic resources of indigenous cattle in west Gondar zone of Ethiopia. Online J. Anim. Feed Res. 10, 240–248. doi: 10.51227/ojafr.2020.33
Esmael Ahmed Y., Bati Bukul B., Gizachew S., and Negase Sanbate A. (2019). Livestock Production System and Their Constraints in West Arsi Zone, Oromia National Regional State, Ethiopia. Int. J. Biomed. Sci. Eng. 7, 79. doi: 10.11648/j.ijbse.20190704.11
FAO. (2012). Phenotypic characterization of animal genetic resources. Rome: Food and Agriculture Organization of the United Nations. FAO Animal Production and Health Guidelines No. 11.
Fedlu H., Endashaw B., Workneh A., and Tadelle D. (2007). Genetic variability of five indigenous Ethiopian cattle breeds using RAPD markers. Afr. J. Biotechnol. 6, 2274–2279. doi: 10.5897/AJB2007.000-2356
Firdaus F., Atmoko B., Baliarti E., Widi T., Maharani D., and Panjono P. (2024). The meta-analysis of beef cattle body weight prediction using body measurement approach with breed, sex, and age categories. J. Adv. Vet. Anim. Res., 1. doi: 10.5455/javar.2023.j718
Gelan D. T. (2014). Pastoral Rangelands Policy and Institutional Concerns in Ethiopia. SSRN Electronic J. doi: 10.2139/ssrn.2524948
Hagose B. (2017). Ethiopian Cattle Genetic Resource and Unique Characteristics under a Rapidly Changing Production Environment-A Review. Int. J. Sci. Res. (IJSR) 6, 1959–1968. doi: 10.21275/ART20179194
Hussien B., Oneta A., AdemKumbe F. L., Bekele B., and Tashome D. (2024). “On-farm Phenotypic Characterization of Indigenous Cattle Breed in Borana Zone of Oromia Regional State, Ethiopia,” in Regional Review Workshop on Completed Research Activities, 38.
Lomillos J. M. and Alonso M. E. (2020). Morphometric Characterization of the Lidia Cattle Breed. Animals 10, 1180. doi: 10.3390/ani10071180
Milikias M. and Gebre M. (2024). Beef cattle fattening practices, marketing systems and challenges: The case of Bench Sheko and Sheka Zones of southwest Ethiopia. Heliyon 10. doi: 10.1016/j.heliyon.2024.e29790
MLFDO. (2016). District Annual Report on Climate Characterization Survey, Maji District, Bench Maji Administrative Zone, Southwest Ethiopia. Maji Livestock and Fishery Development Office.
MOARD. (2004). State of Ethiopia’s Animal Genetic Resources: Country Report. A Contribution to the First Report on the State of the World’s Animal Genetic Resources. Addis Ababa, Ethiopia: Institute of Biodiversity Conservation. Ministry of Agriculture and Rural Development. p. 90.
MSLFDO. (2016). District annual report on climate characterization survey. Meinit Shasha district, Bench Maji Administrative Zone, Southwest Ethiopia: Meinit Shasha Livestock and Fishery Development Office.
MSLFDO. (2023). District annual report on climate characterization survey, Meinit Shasha district, Bench Maji Administrative Zone, Southwest Ethiopia: Meinit Shasha Livestock and Fishery Development Office.
Mulugeta F. G. (2015). Production system and phenotypic characterization of begait cattle, and effects of supplementation with concentrate feeds on milk yield and composition of begait cows in humera ranch, western tigray, ethiopia.
Mummed Y. Y. and Webb E. C. (2019). Carcass Weight, Meat Yield and Meat Cuts From Arado, Boran, Barka, Raya Cattle Breeds in Ethiopia. J. Agric. Sci. 11, 45. doi: 10.5539/jas.v11n18p45
Mustefa A. (2023). Implication of phenotypic and molecular characterization to breed differentiation of Ethiopian cattle. A review. Ecol. Genet. Genomics 29, 100208. doi: 10.1016/j.egg.2023.100208
Mustefa A., Aseged T., Kenfo H., and Hunde K. (2024a). Phenotypic characterization of Guraghe and Jimma cattle breeds in Ethiopia: Implications for breed differentiation and in-situ conservation. PloS One 19, e0303559. doi: 10.1371/journal.pone.0303559
Mustefa A., Belayhun T., Melak A., Hayelom M., Tadesse D., Hailu A., et al. (2021). Phenotypic characterization of Raya cattle in northern Ethiopia. Trop. Anim. Health Prod. 53, 48. doi: 10.1007/s11250-020-02486-1
Mustefa A., Melak A., Kenfo H., Sinke S., Abdela A., and Hailu A. (2024b). Quantifying phenotypic relationships among Arsi, Bale and Jemjem cattle breeds of Ethiopia. Genet. Resour. 5, 53–64. doi: 10.46265/genresj.EPVO8349
Pathot Y. D. (2020). Assessment of livestock feed resources, feeding practices and coping strategies to feed scarcity in agro pastoral production system in itang district, gambella, ethiopia. J. Agri. Nat. Res. Sci. 7 (1). Available online at: http://www.journals.wsrpublishing.com/index.php/tjanrs/article/view/484.
Tenagne A., Mekuriaw G., and Kumar D. (2016). Phenotypic Characterization of Indigenous Cattle Populations in West Gojjam Administrative Zones, Amhara National Regional State, Ethiopia. J. Life Sci. Biomed. 6, 127–138. Available at: www.jlsb.science-line.com.
Texada M. J., Koyama T., and Rewitz K. (2020). Regulation of Body Size and Growth Control. Genetics 216, 269–313. doi: 10.1534/genetics.120.303095
Tolera A. and Abebe A. (2007). Livestock production in pastoral and agro-pastoral production systems of southern Ethiopia. Livestock Res. Rural Dev. 19, 4–7.
Vieira B. D. C. R., Alfaiate M. B., Madella-Oliveira A. D. F., Quirino C. R., Souza M. H., Oliveira A. P. G., et al. (2015). Caracterização fenotípica e diversidade genética de caprinos: Revisão. Pubvet 9. doi: 10.22256/pubvet.v9n1.38-44
Keywords: phenotype, qualitative, quantitative, characterization, Surma cattle
Citation: Fetene G, Alemayehu WK, Kebede D and Birara TD (2025) Qualitative and quantitative characterization of the Surma cattle population in the Bench Maji Zone, Southwest Ethiopia. Front. Anim. Sci. 6:1565748. doi: 10.3389/fanim.2025.1565748
Received: 23 January 2025; Accepted: 06 May 2025;
Published: 24 June 2025.
Edited by:
Regina Roessler, University of Kassel, GermanyReviewed by:
Habtamu Abera Goshu, Independent Researcher, Addis Ababa, EthiopiaLiga Paura, Latvia University of Agriculture, Latvia
Copyright © 2025 Fetene, Alemayehu, Kebede and Birara. This is an open-access article distributed under the terms of the Creative Commons Attribution License (CC BY). The use, distribution or reproduction in other forums is permitted, provided the original author(s) and the copyright owner(s) are credited and that the original publication in this journal is cited, in accordance with accepted academic practice. No use, distribution or reproduction is permitted which does not comply with these terms.
*Correspondence: Teshale Dereje Birara, ZGVyZWplX2JpcmFyYUBkbXUuZWR1LmV0