 Richard Vaquero Ribeiro1
 Welder Angelo Baldassini1,2Nara Regina Brandão Cônsolo3José Breno da Silva Moreira1
 Rodrigo de Nazaré Santos Torres2Jean Lucas Carvalho Galvão1
 Luis Artur Loyola Chardulo1,2
 Rogério Abdallah Curi1,2Gabriel Henrique Ribeiro4,5
 Luiz Alberto Colnago4
 Otávio Rodrigues Machado Neto1,2*
- 1School of Agricultural and Veterinary Sciences, São Paulo State University, Jaboticabal, SP, Brazil
- 2School of Veterinary Medicine and Animal Science, São Paulo State University, Botucatu, SP, Brazil
- 3Department of Animal Science, University of São Paulo, Pirassununga, SP, Brazil
- 4Brazilian Agricultural Research Corporation (EMBRAPA) Instrumentation, São Carlos, SP, Brazil
- 5Department of Chemistry, Federal University of Sao Carlos, São Carlos, SP, Brazil
This study evaluated the effects of different combinations of yeast products and antimicrobials during adaptation to high-grain feedlot diets on performance, feeding behavior, carcass traits, and the serum metabolome of feedlot Nellore bulls. One hundred twenty Nellore bulls were divided into two body weight groups and assigned within groups to 24 pens. The following dietary treatments were applied: MVY: monensin at 18 mg/kg of dry matter (DM) + virginiamycin at 15 mg/kg of DM + live yeast at 2 g/animal/day; NLY: narasin at 13 mg/kg of DM + live yeast at 2 g/animal/day; NYC: narasin at 13 mg/kg of DM + yeast culture at 7 g/animal/day; NDY: narasin at 13 mg/kg of DM + active dry yeast at 1 g/animal/day. Treatments were administered during the grain adaptation period (d1–d21). Blood samples were collected at the end of the grain adaptation period for serum metabolome profiling. During the 21-day grain adaptation period, bulls fed NYC tended (P = 0.09) to have a greater average daily gain than bulls fed MVY. Dry matter intake (DMI), final body weight, and feed efficiency were similar (P > 0.05) among treatments. During the finishing period, bulls fed NLY had a lower (P = 0.04) DMI as a percentage of body weight than bulls receiving MVY. There were no treatment effects (P > 0.05) on the carcass traits. Bulls fed NDY spent more time resting (P = 0.03) and tended (P ≤ 0.10) to have fewer meals per day and greater DMI per meal than animals fed MVY. Lactate was the most important serum metabolite for discriminating all treatment groups, with a higher concentration in the MVY group. The three most important metabolites for discriminating the MVY and NLY groups were lactate, creatine, and valine, whose concentrations were higher in the MVY group. The three most important metabolites for discriminating MVY and NYC were 3-phenylpropionate, hippurate, and betaine, whose concentrations were higher in the NYC group. Thus, narasin can replace the combination of monensin and virginiamycin in high-grain adaptation diets for Nellore bulls when administered together with yeast products, with the NYC combination showing great potential.
1 Introduction
The adaptation of feedlot cattle to high-concentrate diets is a crucial period; the optimization of dry matter intake (DMI) and weight gain during this period significantly influences overall animal performance (Brown et al., 2006; Silvestre et al., 2023). Hence, implementing dietary strategies that maximize DMI and average daily gain (ADG) during this period is important. As demonstrated by Silvestre et al. (2023), feed additives play a crucial role in modulating ruminal and post-ruminal fermentation, consequently impacting DMI, ADG, and feed efficiency. This fact highlights the importance of feed additives as key components of adaptation diets.
The ionophore sodium monensin (MON) is the feed additive most widely used in American and Brazilian feedlot operations (Samuelson et al., 2016; Silvestre and Millen, 2021). The impact of MON on gram-positive bacteria significantly alters ruminal fermentation and consequently the host’s metabolism (Russell and Strobel, 1989; Nagaraja, 2007). It is well established that MON increases ADG while decreasing DMI, thereby improving feed efficiency (Tedeschi et al., 2003; Duffield et al., 2012). Despite these general findings, the effect of MON on animal performance will vary depending on the dose used of this additive, the stage within the feedlot cycle, and combinations with other feed additives. According to Burrin et al. (1988), DMI decreases linearly with increasing MON inclusion level during the grain adaptation period. Furthermore, increasing MON intake during grain adaptation tends to decrease gain throughout the finishing period. Additionally, the combined use of MON and virginiamycin (VM) in high-grain adaptation diets has shown a positive effect on overall feedlot performance compared to exclusive MON supplementation (Rigueiro et al., 2020).
Another ionophore that has been studied in cattle is narasin (NAR). Although the mechanism of action of NAR is similar to that of MON, an in vitro study demonstrated that NAR is more effective in increasing ruminal propionate production and in controlling lactic acid concentration (Nagaraja et al., 1987). The inclusion of NAR in high-forage diets improves ruminal propionate production without altering DMI (Polizel et al., 2020; Limede et al., 2021). Additionally, feeding NAR at 13 mg/kg of dry matter (DM) during the grain adaptation of feedlot cattle improves DMI compared to MON at 25 mg/kg of DM (Baggio et al., 2023).
Although the effects of yeast product supplementation on feedlot cattle performance are inconsistent due to the high variability among products, these feed additives show promising benefits, particularly in high-fiber diets (Crossland et al., 2019).Yeast products such as live yeast, yeast cell wall and yeast culture can be classified as prebiotic, probiotic or postbiotic, respectively (Scarpellini et al., 2021). The potential of these feed additives is primarily related to their ability to stimulate the growth of rumen cellulolytic and lactate-utilizing bacteria; however, their effectiveness depends on the product type, strain, and dose (Chaucheyras et al., 1996; Callaway and Martin, 1997). Thus, different yeast products were tested in combination with antimicrobials to identify the most effective combination.
Metabolomics is an emerging powerful tool in omics science that, coupled with multivariate analysis, has enabled comprehensive metabolic exploration of animals, plants, and microbes over the past decade (Goldansaz et al., 2017). Metabolites are the end products of complex reactions that are regulated by genomic and environmental factors and are therefore sensitive indicators of nutritional modulation (Goldansaz et al., 2017; Cônsolo et al., 2020).
Given the complementary benefits of NAR, which does not limit feed intake, and yeast products, which have the potential to enhance fiber digestion, their potential synergistic effects should be investigated to improve animal performance during the challenging grain adaptation period. The effects of the combination of MON and VM in diets for feedlot cattle are well-documented in the literature (Rigueiro et al., 2020; Ceconi et al., 2022; Estrada-Angulo et al., 2022) but few studies have investigated the effect of combining antimicrobials and yeast products in adaptation diets for Bos indicus cattle. Within this context, the current study aimed to evaluate the effects of different combinations of MON, VM, and NAR with yeast products in high-grain adaptation diets on feedlot performance, carcass traits, and feeding behavior, as well as to use the serum metabolome to further understand phenotypic outcomes in Nellore cattle.
2 Material and methods
2.1 Animals and treatments
All animal procedures were approved by the Animal Use Ethics Committee (CEUA – protocol 0585/2023) of the São Paulo State University, on February 9, 2024.
A total of 120 Nellore bulls with an average initial body weight (BW) of 386.89 ± 16.73 kg and age of 22 to 24 months were used in this experiment conducted at the School of Veterinary Medicine and Animal Science, São Paulo State University, Botucatu, São Paulo, Brazil. Upon arrival at the feedlot, the animals were treated for endo- and ectoparasites (Dectomax, Zoetis, SP, Brazil; TopLine, Boehringer Ingelheim, SP, Brazil), clostridiosis (Fortress 7; Zoetis, SP, Brazil), bovine infectious rhinotracheitis, and bovine viral diseases (Bovi-Shield Gold One Shot, Zoetis, SP, Brazil) and were ear-tagged. During the first seven days before the start of the trial, the animals were fed corn silage ad libitum to acclimate to the facilities and feeding management. On d0, bulls were weighed to determine the initial BW, which was used to divide the animals into two blocks (light and heavy). Bulls were randomly assigned to 24 pens (5 × 5.35 m; 5 bulls/pen) equipped with automatic waterers and feed bunks, providing 1 m of bunk space per bull. Pens within blocks were randomly allocated to one of the following four treatments: MVY: MON at 18 mg/kg of DM (Rumensin 100, Elanco Brazil, São Paulo, SP, Brazil) + VM at 15 mg/kg of DM (V-Max, Phibro Animal Health Corporation, Guarulhos, SP, Brazil) + live yeast at 2 g/animal/day (Saccharomyces cerevisiae strain NCYC 996 Procreatin-7, Phileo Lesaffre Animal Care, Campinas, SP, Brazil); NLY: narasin at 13 mg/kg of DM (Zimprova 100, Elanco Brazil, São Paulo, SP, Brazil) + live yeast at 2 g/animal/day; NYC: narasin at 13 mg/kg of DM + yeast culture at 7 g/animal/day (Postbiotic, XPC-Ultra®, Diamond V, Cedar Rapids, IA) (for composition, see Supplementary Table S2); NDY: narasin at 13 mg/kg of DM + active dry yeast at 1 g/animal/day (Saccharomyces cerevisiae boulardii strain CNCM I-1079, ProTernative®, Lallemand Animal Nutrition, Montreal, Quebec, Canada). The treatments were added to the mineral-vitamin supplement.
Dietary treatments were provided only during the grain adaptation period (d1 – d21) and through transition (d22 – d33) and finishing (d34 – d115) all animals were fed the same diets, with the inclusion of MON at 28 mg/kg of DM. The experiment lasted 115 days.
2.2 Diets and feeding management
The animals were fed ad libitum, twice daily at 9:00 and 15:00 hours, providing equal amounts on each occasion. The daily adjustment of dietary supply was based on the DMI of the previous days, targeting refusal levels at 3–5%. The orts were removed daily, weighed, sampled by pen weekly, and dried (100°C for 24 h) for the determination of DMI. Feed samples were collected weekly, stored at −18°C, and composited at the end of the trial for nutrient analysis (Table 1).
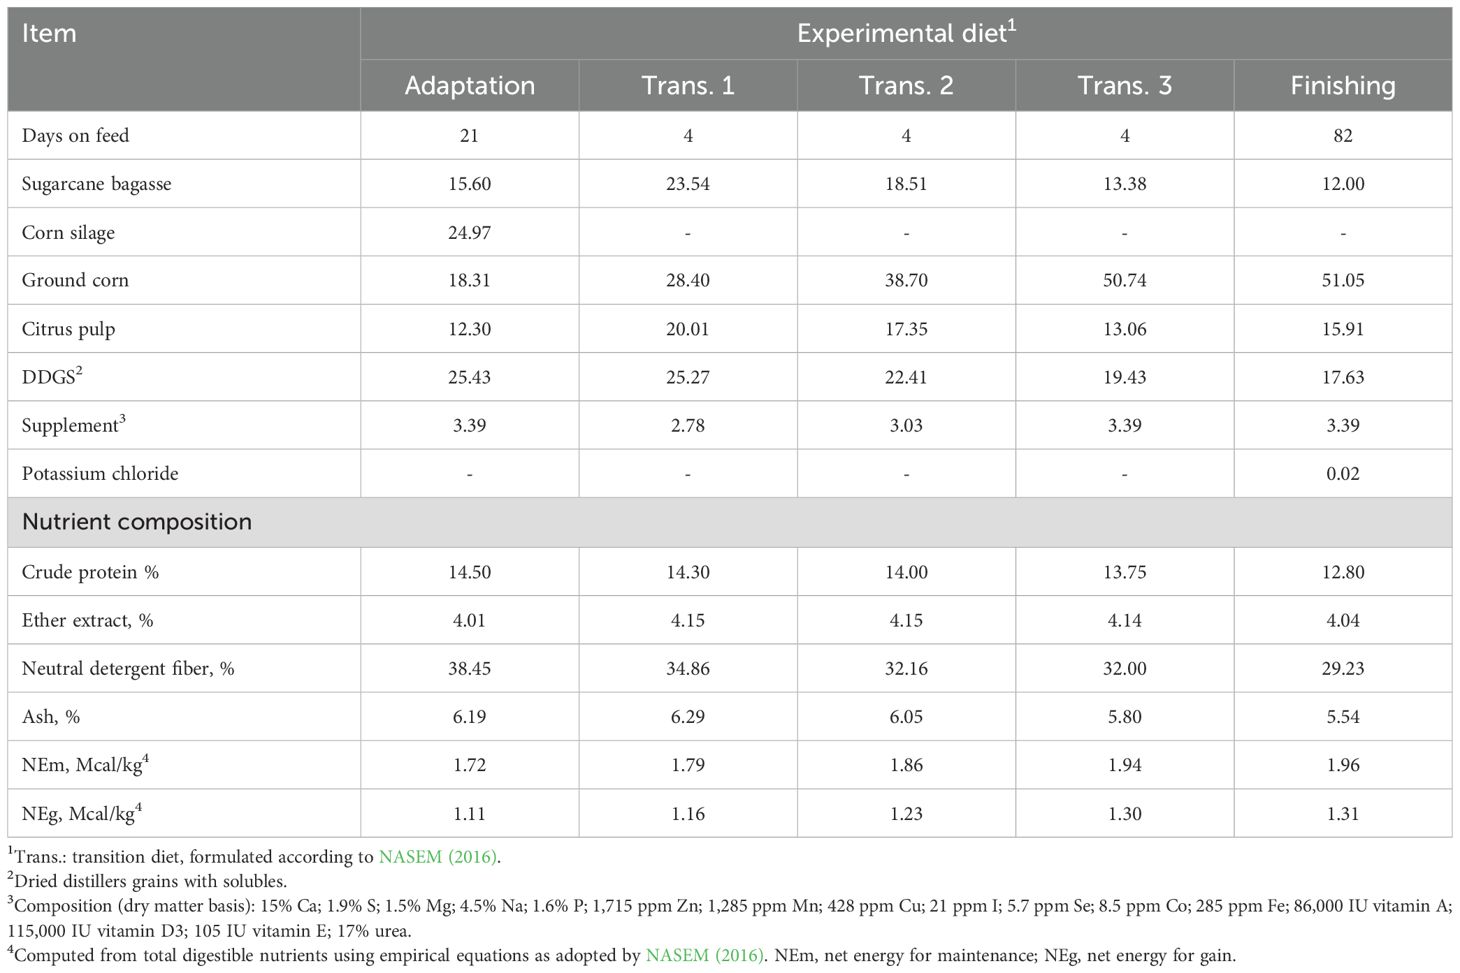
Table 1. Composition (%, dry mater basis) of the experimental diets.
Feed samples were dried in a forced-air oven at 60°C for 72 h, grounded in a Willey mill (1-mm screen), and analyzed for moisture (# 934.01), crude protein (# 976.05, N * 6.25), ash (# 942.05), and ether extract (# 920.39) (AOAC, 2005). Neutral detergent fiber (NDF) was analyzed according to Mertens (2002), adding heat-stable α-amylase and sodium sulfite. Additionally, NDF content was adjusted for ash.
2.3 Performance and carcass traits
Bulls were weighed at the beginning of the experiment (d0), at the end of the adaptation period (d22), and at the end of the trial (d116), following a 16-h fasting period. Thus, feedlot performance and DMI were reported for the adaptation, finishing, and total periods. To calculate the observed dietary net energy (NE) of the adaptation period, net energy requirements for gain (NEg) and for maintenance (NEm) were estimated according to the equations proposed for Bos indicus bulls by Chizzotti et al. (2008). The observed dietary NE was then calculated as described by Zinn and Shen (1998).
On d105, fat thickness at the 12 rib, Biceps femoris (BF) fat thickness, and ribeye area (REA) were measured using an Aloka SSD-1100 Flexus RTU ultrasound unit (Aloka, Tokyo, Japan) equipped with a 3.5-MHz probe (17.2 cm), as described by Pinheiro et al. (2011). Images were digitized and analyzed by an experienced technician using the Echo Image Viewer 1.0 software (Pie Medical Equipment B.V., Maastricht, The Netherlands). At the end of the experiment, the animals were shipped to a commercial slaughterhouse (~500 km). On the following day, bulls were stunned by brain concussion using a captive dart gun and the hot carcass weight (HCW) was obtained from all animals after hide removal and evisceration. Carcass daily gain (CDG) was calculated using the following equation: CDG = (final HCW – (initial BW × 50%))/experimental period (115 days). The dressing percentage was calculated by dividing HCW by final BW.
2.4 Feeding behavior
Bulls were visually observed on d7 and d19 of the adaptation period to evaluate feeding behavior. The observations were conducted at fixed intervals (instantaneous sampling) of 5 minutes over 24 h (Altmann, 1974). The following behavioral categories were recorded according to Robles et al. (2007): eating, ruminating, and resting. The number of meals was calculated from eating behavior data, using criteria to define them based on the minimum time required to consider two periods of eating activity as separate events. The DMI per meal was calculated by dividing the total DMI by the number of meals. The meal length (minutes per day) was calculated by dividing the total time spent eating by the number of meals. Feed and orts were sampled for NDF analysis as previously described to calculate the eating and rumination rates of DM and NDF according to Niehues et al. (2022).
2.5 Blood sample collection and preparation for metabolomic analyses
Blood samples were collected once at the end of the adaptation period (d22) from 40 randomly chosen bulls: 20 per block and 10 per treatment group. Approximately 10 mL of blood was sampled by puncture of the coccygeal blood vessels into evacuated tubes without anticoagulant (BD Vacutainer, São Paulo, SP, Brazil). The tubes were placed on ice, transported to the laboratory within 30 min of sampling, and centrifuged at 2000×g for 15 min at 4°C. The supernatant (serum) was transferred to labeled plastic tubes and stored at −80°C until analysis.
Prior to nuclear magnetic resonance spectroscopy (1H-NMR), samples were processed to remove serum proteins. Ultra-15 centrifugal filter units (3-kDa cutoff, Amicon, Merck Millipore Ltd., Ireland) were rinsed five times each with 0.5 µL of Milli-Q water, centrifuged at 13,000×g for 5 min at 4°C, and once with the filter inverted at 7,500×g for 1 min to eliminate any residue of glycerol bound to the filter membranes and Milli-Q water. Next, 500 µL of each serum sample was transferred to the washed filters and centrifuged at 13,000×g for 30 min at 4°C to remove macromolecules (primarily protein and lipoproteins). The filtered content was then vacuum centrifuged and stored at −80°C.
2.6 Nuclear magnetic resonance spectroscopy (1H-NMR)
On the day of 1H-NMR analysis, the dried residues were solubilized in 550 µL of phosphate buffer (D2O-based PBS; 0.1 M, pH = 7.4) containing 0.5 mM of 3-(trimethylsilyl)-2,2’,3,3’-tetradeuteropropionic acid (TMSP-d4) used as internal NMR standard. The solution of each sample was then transferred to a standard 5-mm NMR tube for NMR measurements.
1D 1H-NMR experiments were performed on a Bruker Avance III 14.1 T spectrometer (Bruker Corporation, Karlsruhe, Baden Württemberg, Germany) fitted with a 5-mm Broadband Observe (BBO) probe with ATMA® (Automatic Tuning Matching), a z-field gradient, a BCU-I variable temperature unit, a field gradient generator unit, and a Sample-Xpress™ automatic sample changer. Standard 1H spectra were acquired at 298.15 K using a NOESY-1D pulse sequence (named noesypr1d in the TopSpin Bruker software), with water signal suppression by irradiation at 2821.88 Hz (O1). The acquisition parameters were as follows: number of scans (ns) of 256, spectral width (sw) of 12019 Hz (20.0276 ppm), 90° pulse (P1) of 14.85 µs, acquisition time (aq) of 4.50 s, relaxation delay (d1) of 4 s, data points (TD) of 108170 (106 K), mixing time (d8) of 5 ms, and dummy scans (ds) of 4.
Spectra were processed with line broadening of 0.3 Hz using the TopSpin™ 3.6.1 software (Bruker BioSpin, Germany). Phase and baseline corrections were performed manually using the Chenomix NMR Suite 8.4 (Chenomix Inc., Edmonton, Canada). The metabolites were manually identified in the 1D 1H-NMR spectra using the in-built compounds library on the Chenomix Profiler tool. For metabolite quantitation, TMSP (signal at 0.00 ppm) was used as the internal standard of known concentration (0.5 mM).
2.7 Statistical analysis and bioinformatics
All phenotypic traits were analyzed using the SAS software (SAS Institute Inc., Cary, NC). Residual normality was verified using the Shapiro-Wilk test in PROC UNIVARIATE, and outliers were identified based on externally studentized residuals (module) > 2.5. Homogeneity of variances was verified using the Box-Cox test. Data that did not show a normal distribution (DMI adaptation, 12th rib fat, BF fat thickness) were transformed using PROC RANK (SAS 9.4). The data were analyzed in a completely randomized block design using the PROC MIXED, where the pen was the experimental unit, treatments were the fixed effects, and block and pen were random effects. The model can be written as:
where Y = dependent variable, µ = overall mean, Bi = random effect of block, Aj = random effect of pen, Pt = fixed effect of treatment, and eijt = experimental error.
The results were reported as least square means (LSMEANS statement). When significant main effects were identified, a post-hoc Tukey test was applied to assess differences between means. Significance was set as P ≤ 0.05 and trends were considered at 0.05 < P ≤ 0.10.
Metabolomic data were analyzed using the R 4.4.0 software (R Found., Vienna, Austria) and MetaboAnalyst 6.0. The metabolite concentration data were uploaded to MetaboAnalyst and cubic transformation and Pareto scaling were applied before analysis. Supervised (partial least-squares discriminant analysis, PLS-DA) data analysis was performed. The PLS-DA model was cross-validated using the leave-one-out cross-validation method and the performance measure ‘accuracy’. The variable importance in the projection (VIP) plot was used to rank the metabolites based on their importance in discriminating groups. Metabolites with the highest VIP values are the most powerful group discriminators. Typically, VIP values > 1 are significant and VIP values > 2 are highly significant (Mehmood et al., 2012). Pathway analyses were conducted on the metabolite quantification datasets according to group using the Bos taurus library (KEGG). Given the exploratory nature of this study, we classified pathways with a raw P < 0.1 as being of high impact and interest.
3 Results
3.1 Intake, performance and carcass traits
During the 21-day adaptation period, bulls fed NYC tended (P = 0.09) to have a greater ADG (2.097 ± 0.46 kg) than bulls fed MVY (1.750 ± 0.52 kg) (Table 2). There was no treatment effect (P > 0.05) on DMI, final BW, or feed efficiency. During the finishing period (d22 to d115), bulls fed NLY during adaptation had a lower (P = 0.04) DMI as a percentage of BW (1.92 ± 0.09%) than bulls submitted to the MVY treatment (2.05 ± 0.11%). Consequently, bulls fed NLY tended (P = 0.09) to have a lower overall DMI as a percentage of BW (2.01 ± 0.09%) throughout the total feedlot period compared to bulls fed MVY (2.11 ± 0.11%), with no negative impact on performance. Feed efficiency and final BW were similar among treatments (P ≥ 0.14) for all periods. The effects of the treatments on observed NE and observed/expected NE ratio are shown in Table 3. Neither observed NE nor observed/expected NE ratio differed among treatments (P > 0.05).
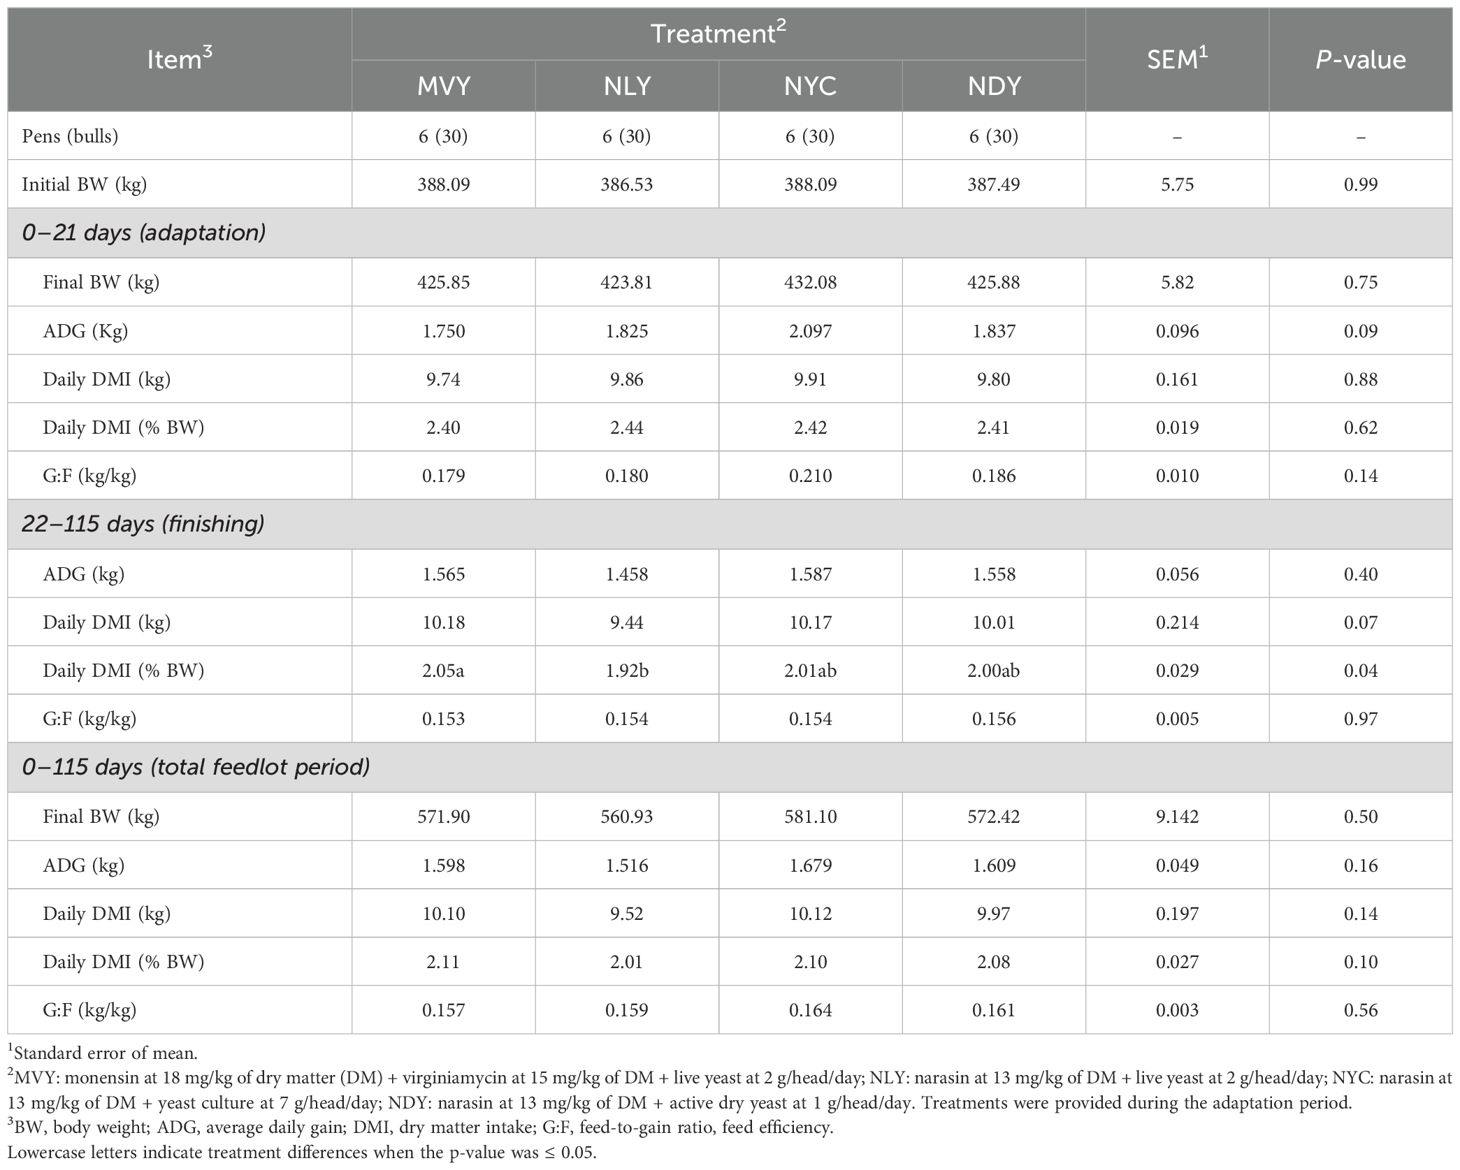
Table 2. Feedlot performance, intake, and efficiency of Nellore bulls fed different combinations of yeast products with antimicrobials during the grain adaptation period.
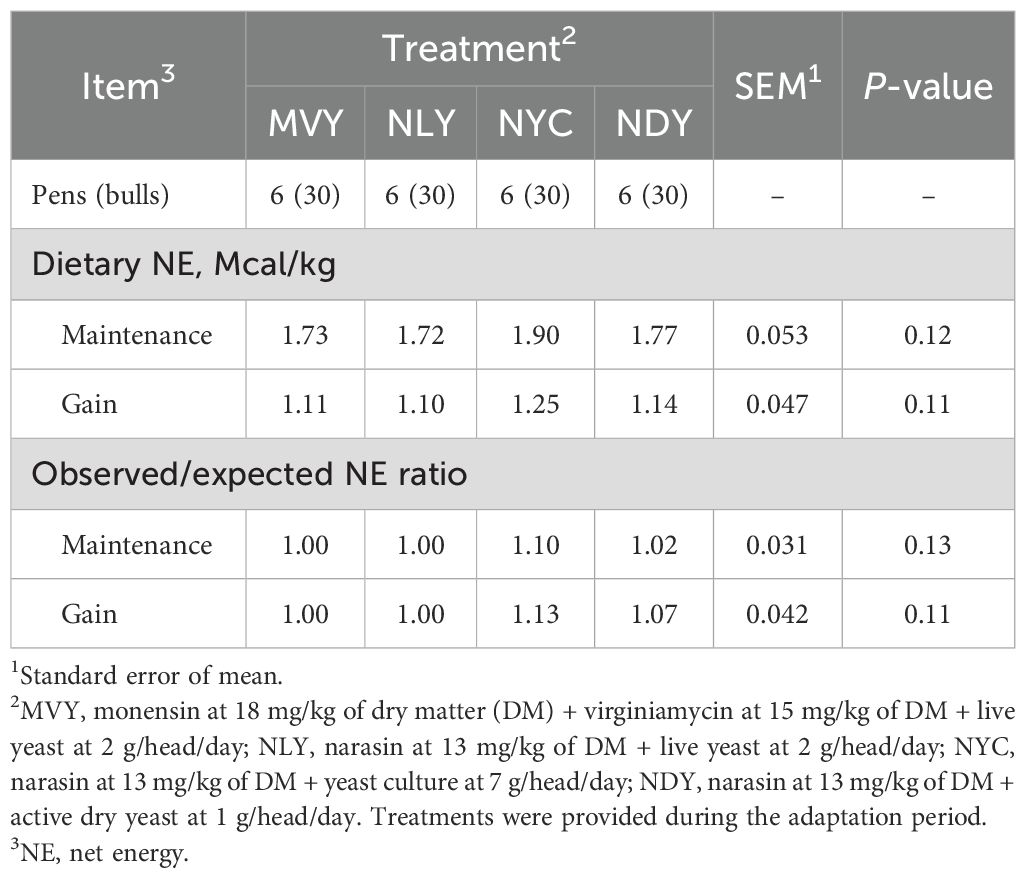
Table 3. Observed dietary net energy (adaptation diet) of feedlot Nellore bulls fed different combinations of yeast products with antimicrobials during the grain adaptation period.
Most carcass traits were not influenced (P > 0.05) by treatment (Table 4). However, bulls fed NYC tended (P = 0.07) to have a greater REA (75.47 ± 9.81 cm²) than bulls fed NLY (69.45 ± 9.94 cm²). Additionally, bulls fed MVY tended (P = 0.07) to have a greater 12th rib fat thickness (4.68 ± 1.21 mm) than bulls fed NDY (3.78 ± 1.23 mm). HCW, CDG, dressing percentage, or BF fat thickness did not differ among treatments (P ≥ 0.16).
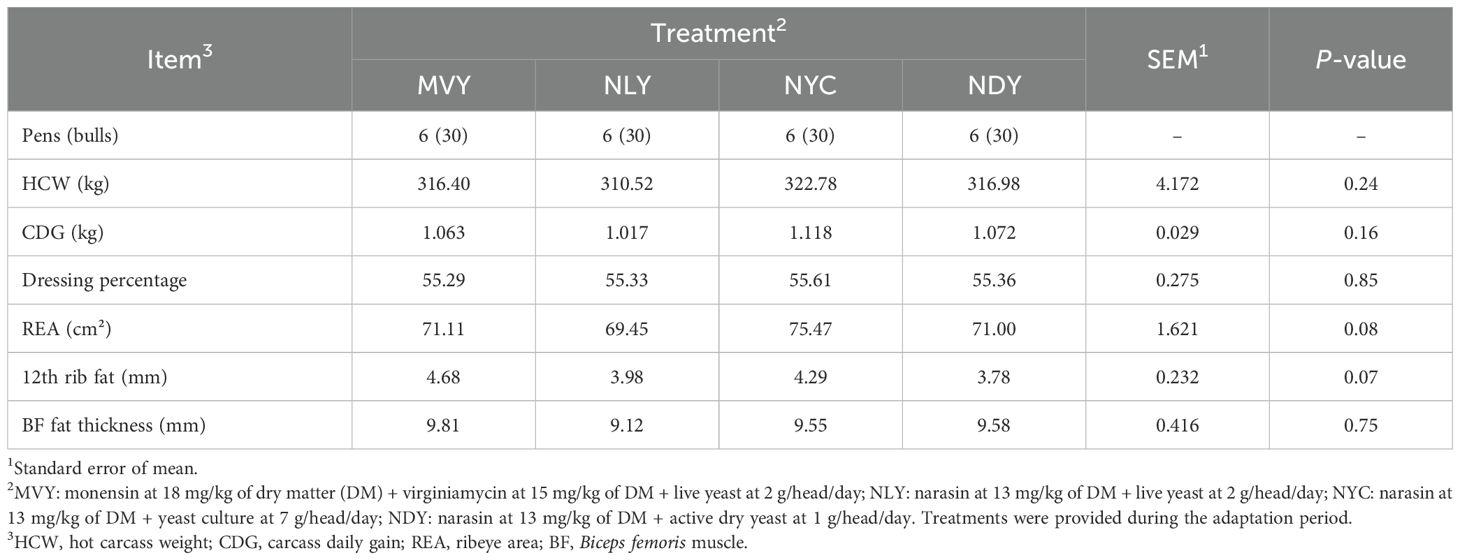
Table 4. Carcass traits of feedlot Nellore bulls fed different combinations of yeast products with antimicrobials during the grain adaptation period.
3.2 Feeding behavior
Nellore bulls fed NDY spent (P = 0.03) more time resting (949.27 ± 26.24 min) than bulls fed MVY (899.06 ± 32.82 min) (Table 5). On the other hand, animals that received NDY tended (P = 0.06) to have fewer meals per day (16.55 ± 3.62) compared to those submitted to the MVY (19.69 ± 3.62) and NLY (19.84 ± 5.84) treatments. Accordingly, animals fed NDY tended (P = 0.09) to have a greater DMI per meal (0.64 ± 0.30 kg) than those fed MVY (0.54 ± 0.10 kg). The time spent ruminating and eating, meal length, DMI, NDF intake, and eating and rumination rates of DM and NDF were similar among treatments (P ≥ 0.23).
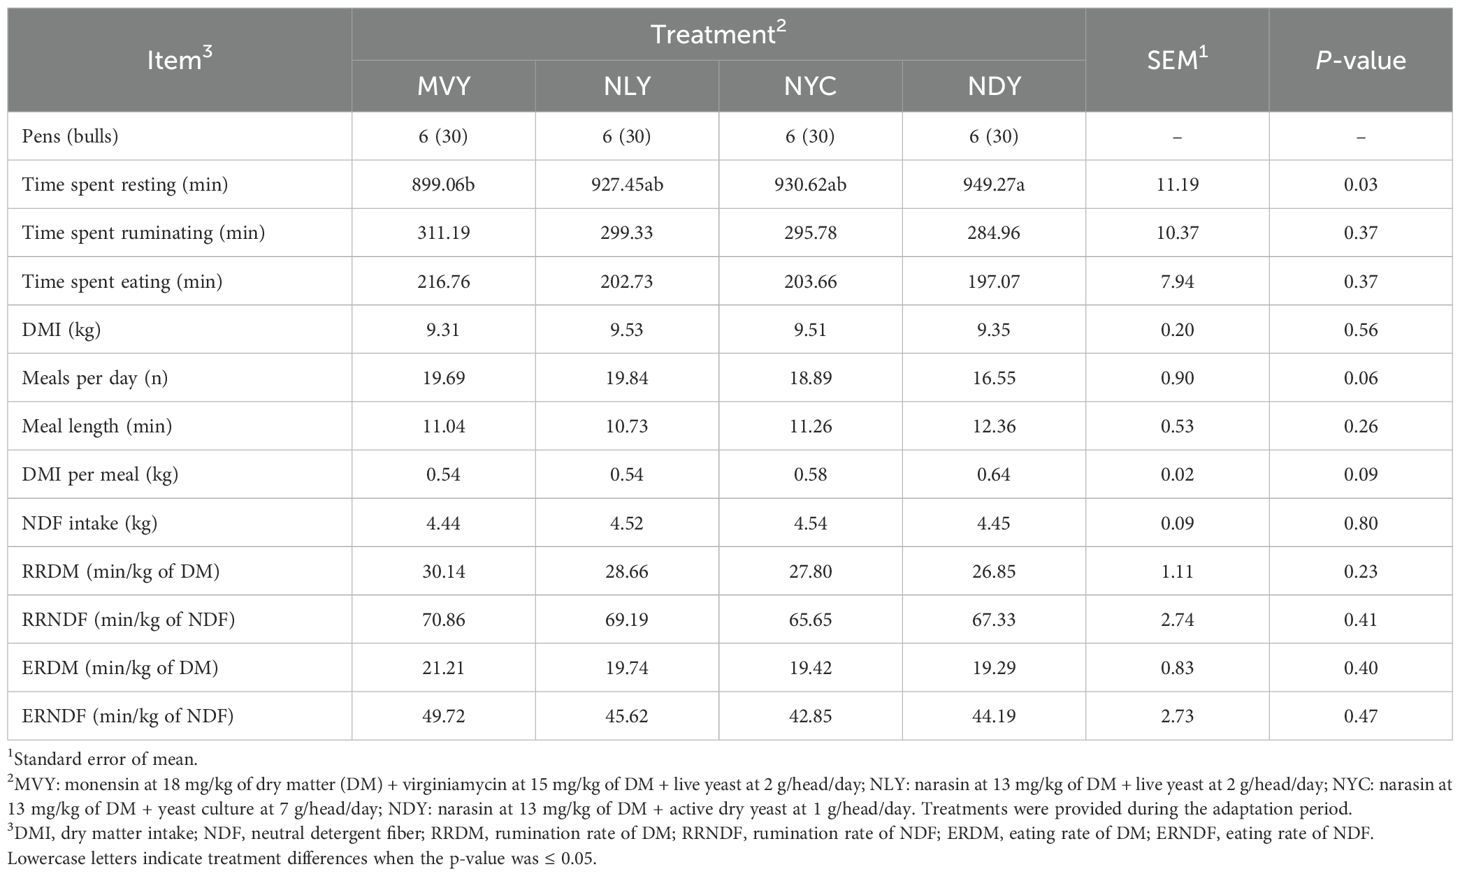
Table 5. Feeding behavior of feedlot Nellore bulls fed different combinations of yeast products with antimicrobials during the grain adaptation period.
3.3 Serum metabolomics profiling
Forty-seven metabolites were identified in the NMR spectra of serum samples from Nellore bulls, including essential and nonessential amino acids, small peptides, amino acid derivatives, organic acids, nucleic acids, sugar, vitamins, and cellular antioxidants (Supplementary Table S1). PLS-DA was performed to visualize differences in metabolite profiles among the four treatment groups. The variate1/variate2 score plot (Figure 1) shows no clear distinction among the NAR-fed groups (NLY, NYC, NDY), indicating similarities in their serum metabolome. However, there was a clear distinction between the MVY and NYC groups, indicating that their metabolite profiles differ. Furthermore, the MVY group showed a slight overlap with NYC and NLY, suggesting certain similarities despite the overall difference in their serum metabolomes. Since the metabolite profiles of the NAR-fed groups appeared to differ from those of the MVY group, overall and pairwise comparisons using a PLS-DA model and subsequent VIP scores were performed across the four treatments and between MVY vs. NLY and MVY vs. NYC to elucidate specific metabolite differences. The VIP score plots including the top metabolites that discriminate the four treatment groups, as well as MVY from NLY and MVY from NYC, are shown in Figures 2A–C.
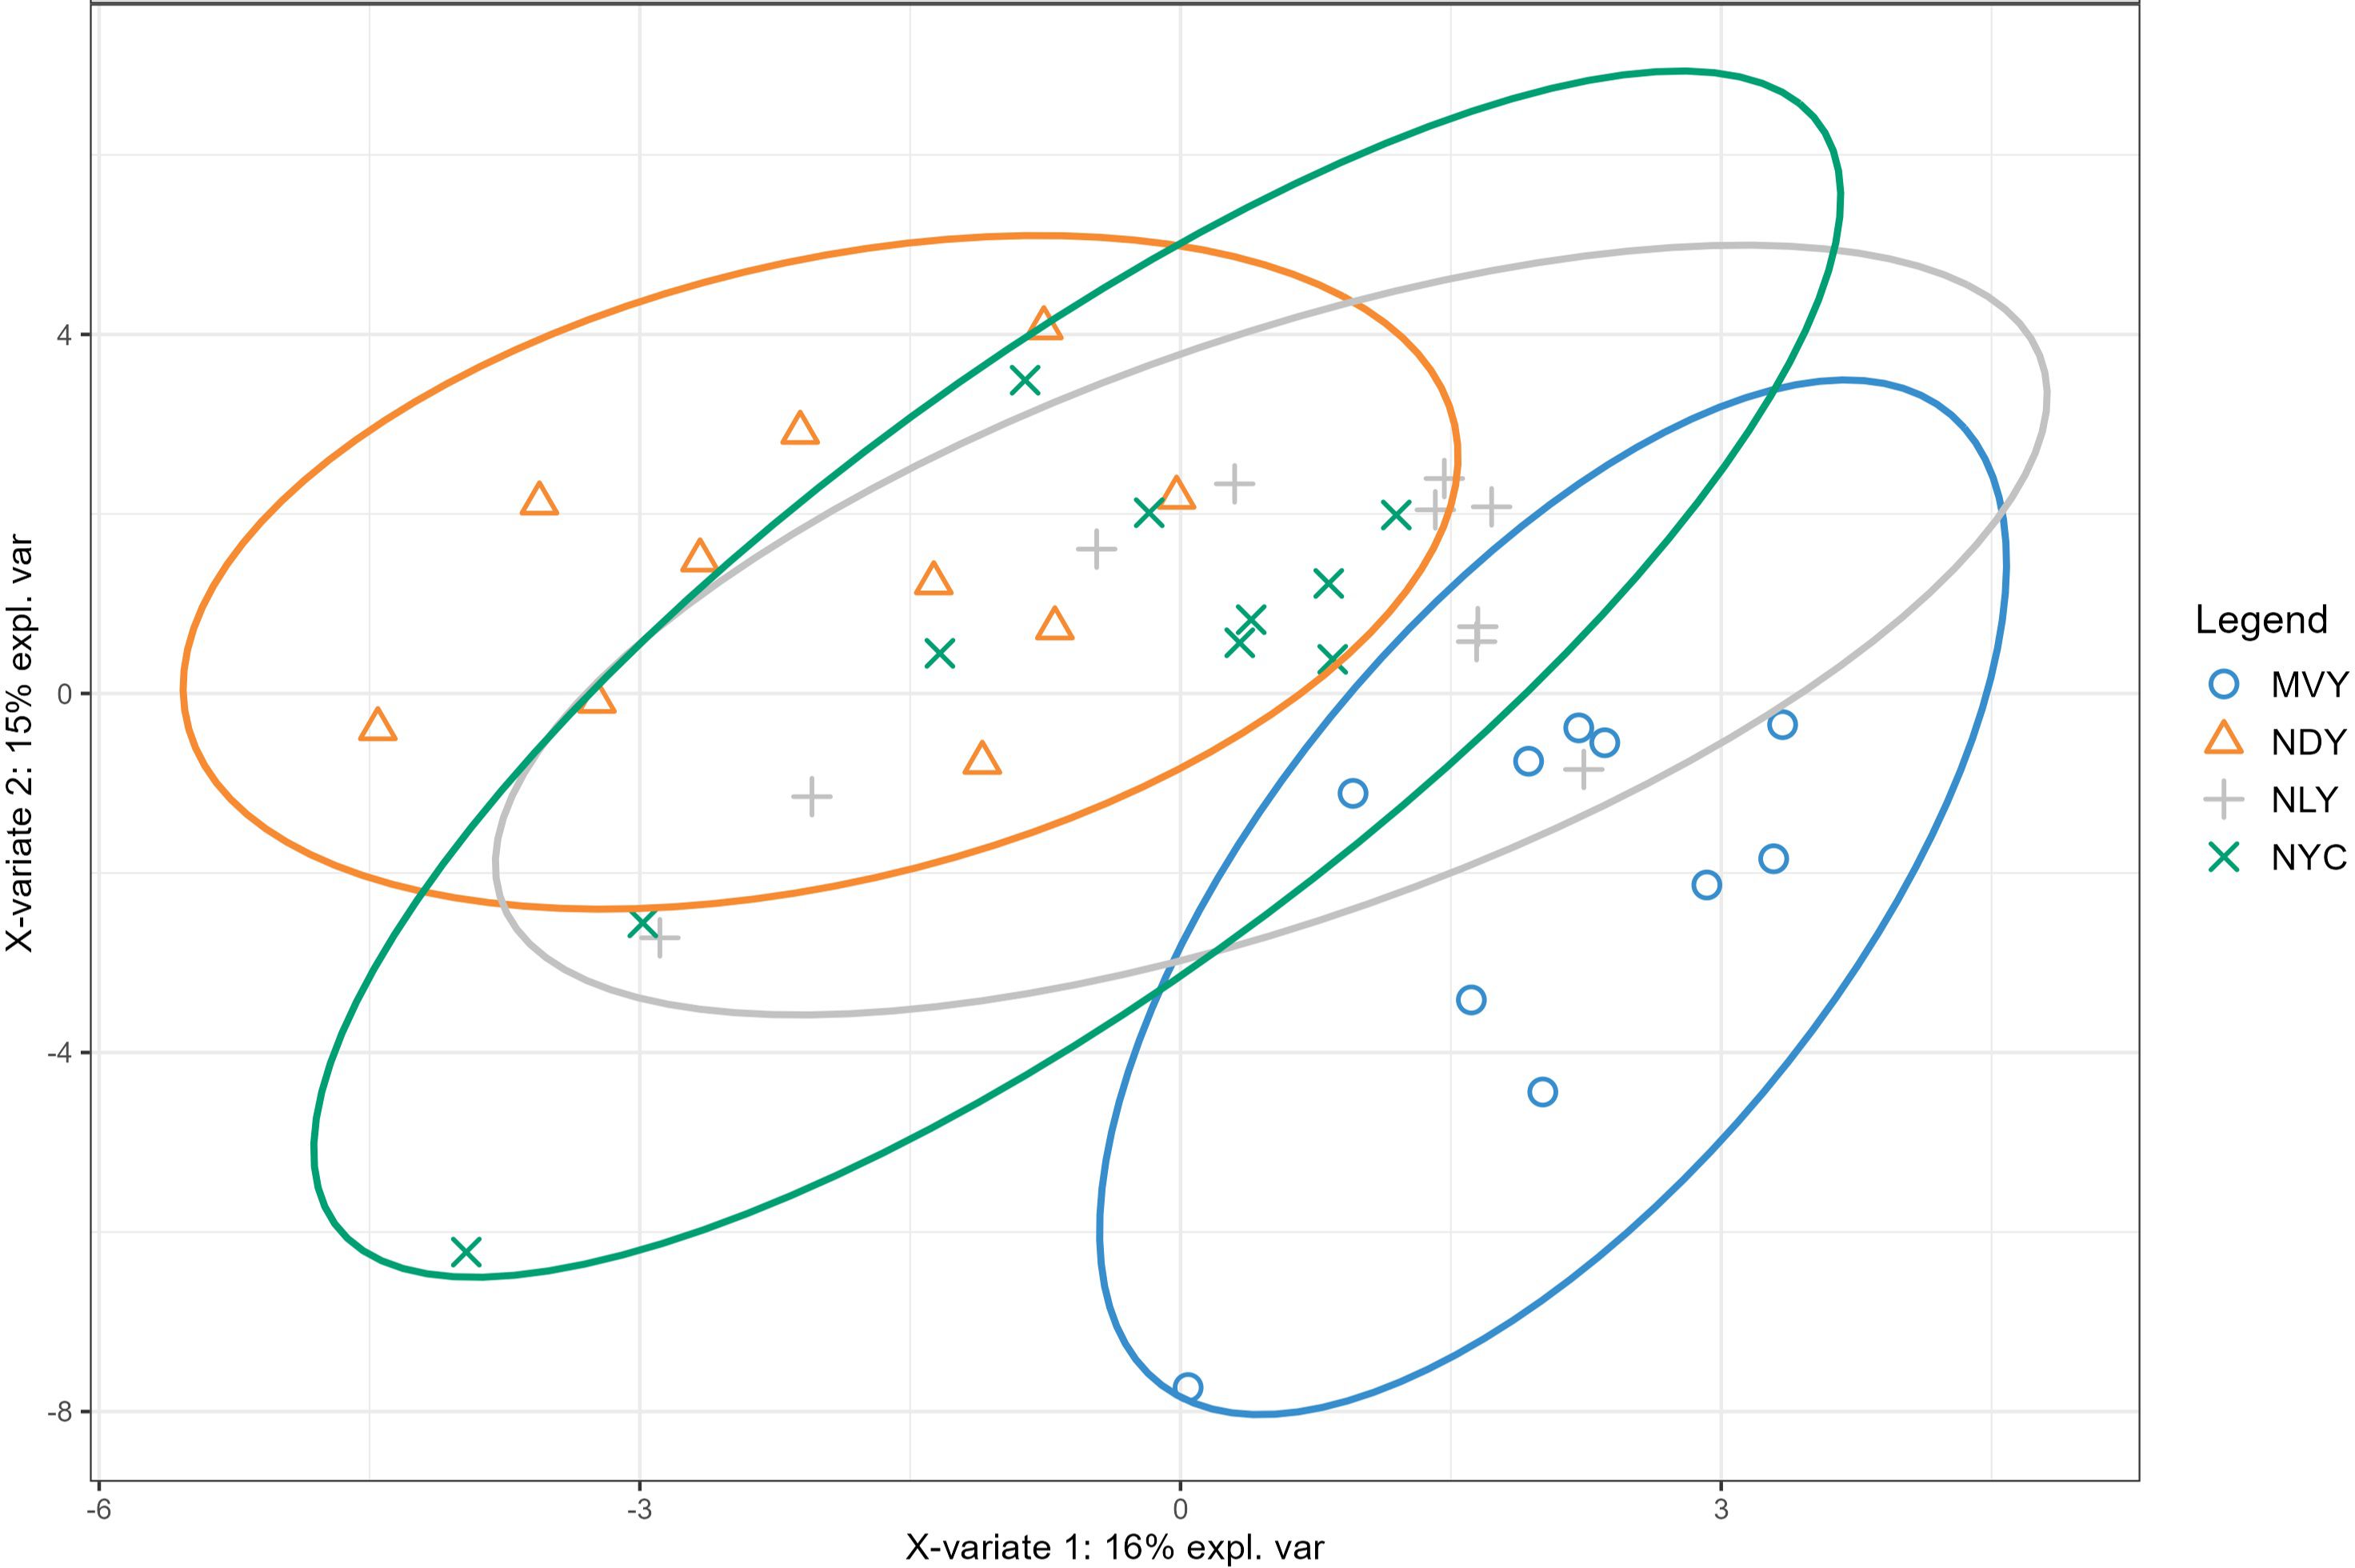
Figure 1. Partial least squares discriminant analysis (PLS-DA) score plot of serum metabolite distribution according to treatment. MVY, monensin + virginiamycin + live yeast; NLY, narasin + live yeast; NYC, narasin + yeast culture; NDY, narasin + active dry yeast.
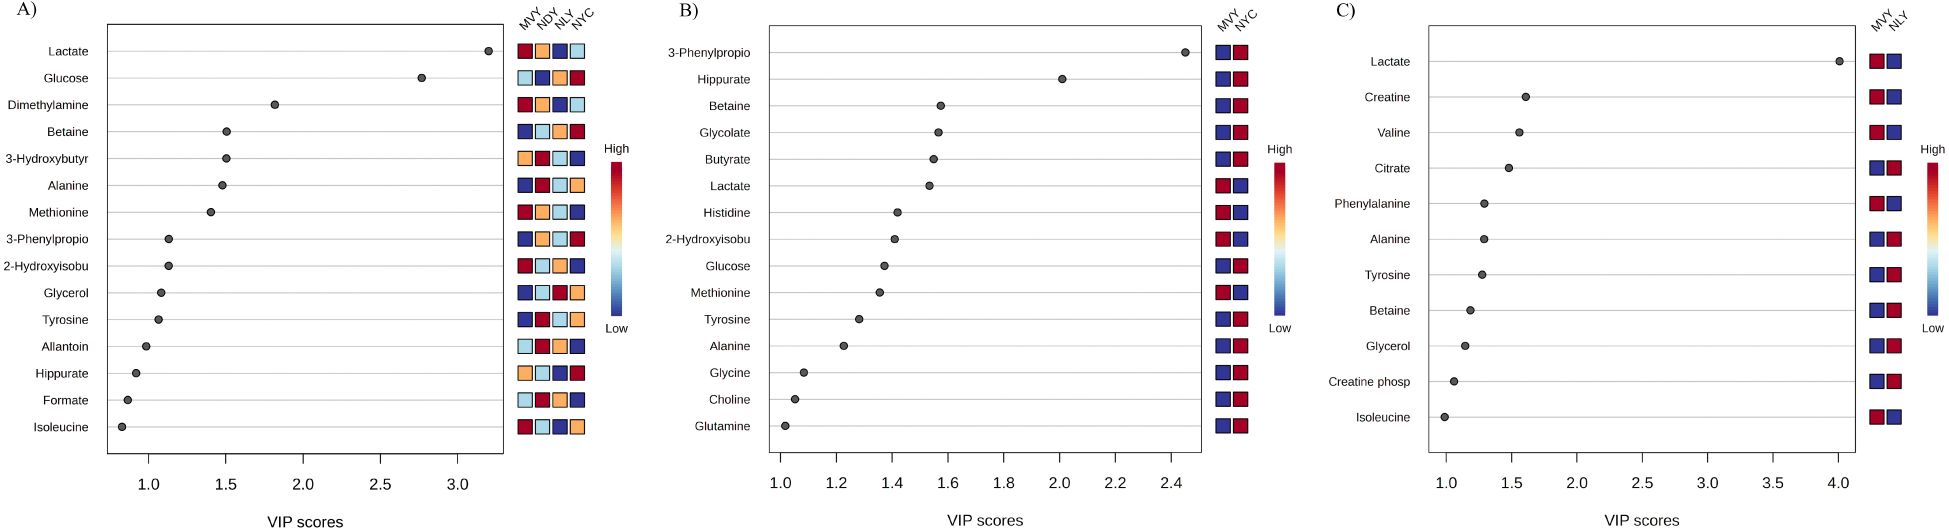
Figure 2. Variable importance in the projection (VIP) analysis ranking the top metabolites whose relative serum levels differ between treatment groups. (A) monensin + virginiamycin + live yeast (MVY), narasin + active dry yeast (NDY), narasin + live yeast (NLY), narasin + yeast culture (NYC) (R2 = 0.99 and Accuracy = 0.28); (B) monensin + virginiamycin + live yeast (MVY), narasin + yeast culture (NYC) (R2 = 0.91 and Accuracy = 0.66); (C) monensin + virginiamycin + live yeast (MVY), narasin + live yeast (NLY) (R2 = 0.94 and Accuracy = 0.55).
Lactate was the most important metabolite for discriminating all treatment groups (Figure 2A) and MVY from NLY (Figure 2C), as well as the sixth most important for discriminating MVY from NYC (Figure 2B), with consistently higher concentrations in the MVY group. Glucose, dimethylamine, betaine, 3-hydroxybutyrate, alanine, methionine, 3-phenylpropionate, 2-hydroxyisobutyrate, glycerol, tyrosine, and allantoin exhibited VIP scores > 1.0 and were identified as key metabolites for differentiating the four treatment groups (Figure 2A). Comparing the MVY and NYC groups, the latter showed higher concentrations of 3-phenylpropionate, hippurate, betaine, glycolate, butyrate, glucose, tyrosine, alanine, glycine, choline, and glutamine, whereas higher concentrations of lactate, histidine, 2-hydroxyisobutyrate, and methionine were observed in the former (Figure 2B). Comparing the MVY and NLY groups, the latter showed higher concentrations of citrate, alanine, tyrosine, betaine, glycerol, and creatine phosphate, whereas the former exhibited higher concentrations of lactate, creatine, valine, phenylalanine, and isoleucine (Figure 2C).
The pathway enrichment plots discriminating MVY from NYC and MVY from NLY are shown in Figures 3A, B. The three most relevant pathways differentiating MVY from NYC were methylhistidine metabolism, gluconeogenesis, and sphingolipid metabolism (Figure 3A). The three most relevant pathways differentiating MVY from NLY were pyruvate metabolism, catecholamine biosynthesis, and thyroid hormone synthesis (Figure 3B).
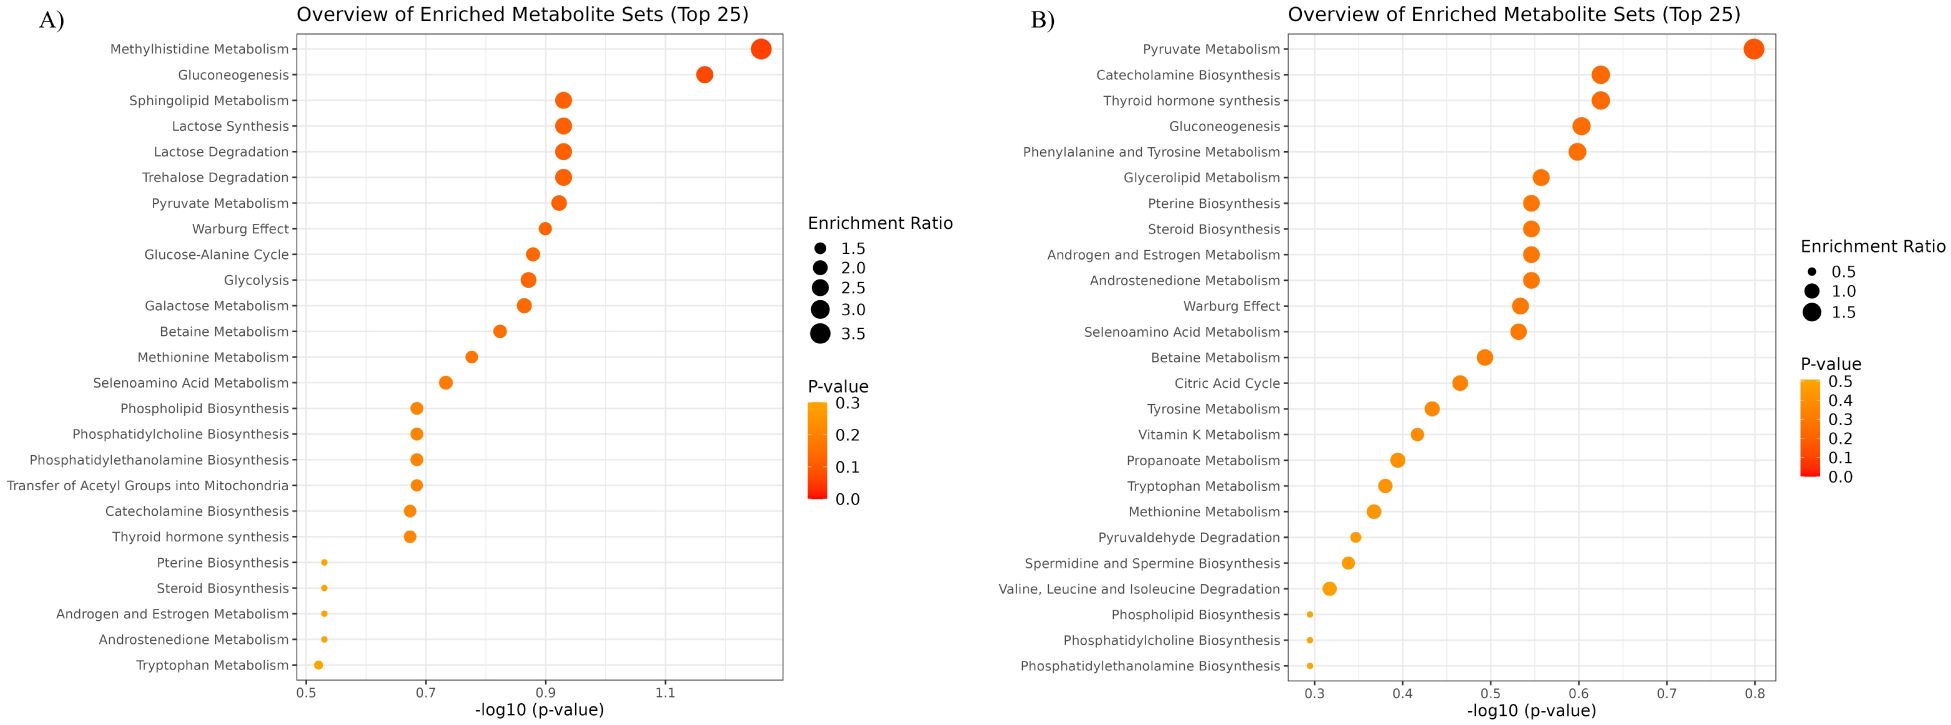
Figure 3. Overview of quantitative enrichment analysis showing the top 25 pathways according to P-value. (A) monensin + virginiamycin + live yeast (MVY) vs. narasin + yeast culture (NYC); (B) monensin + virginiamycin + live yeast (MVY) vs. narasin + live yeast (NLY).
4 Discussion
The present study investigated the effects of different combinations of yeast products (live yeast, yeast culture, and active dry yeast) with antimicrobials (MON, VM, and NAR) during adaptation of feedlot Nellore bulls. The results indicated that feeding NYC during the adaptation period tended to improve performance compared to MVY, without any noticeable effects during the post-adaptation period. Animals fed NLY had a lower DMI during the post-adaptation period than those fed MVY. Considering that both treatments contain the same yeast product, the different antimicrobials may have influenced rumen kinetics and, consequently, rumen development differently. Within this context, metabolomics was used to better understand the phenotypic differences between treatments. As previously described by Cônsolo et al. (2022), this study also demonstrated the potential of applying metabolomics to bio-fluids for a better understanding of beef cattle metabolism and behavior, associating the findings with nutritional modulation. Overall, the serum metabolite data suggest differences in energy and protein metabolism between the MVY and NAR-fed groups.
Although some studies have included yeast products in ruminant nutrition, the effect of yeast supplementation on ruminal parameters, digestibility and performance of beef cattle will vary depending on product type, strain, dose, and diet (Sartori et al., 2017; Cagle et al., 2020). Shen et al. (2018) found that, compared to 330 mg MON/day, ruminal yeast culture supplementation increased ruminal acetate concentration and organic matter and NDF digestibility and tended to reduce the time ruminal pH remained below 5.6 in heifers fed high-grain diets. Similarly, Geng et al. (2016) demonstrated that yeast culture supplementation increased the molar percentage of acetate compared to active dry yeast in finishing bulls fed diets containing 31% forage. Both supplements were combined with MON. In the present study, since DMI was similar among treatments, the trend of the NYC treatment to provide greater ADG compared to MVY might be related to a potential increase in fiber digestibility, enhanced by the yeast culture. Although amino acids are not essential for mixed rumen bacteria, aromatic amino acids such as tyrosine and phenylalanine can stimulate the fermentation rate and microbial growth yield (Cotta and Russell, 1982; Guliye et al., 2005). Atasoglu et al. (2001) reported that phenylalanine can be limiting for certain species of cellulolytic ruminal bacteria, including Fibrobacter succinogenes. In addition to minerals, vitamins and NDF, the yeast culture of the NYC treatment contained amino acids such as tyrosine, phenylalanine, glycine, proline, and leucine (Supplementary Table S2). Tyrosine can be synthesized from phenylalanine by rumen microorganisms and both metabolites can be converted to phenylpropionic acid, which is similarly beneficial for improving cellulose degradation by stimulating the growth of Ruminococcus albus (Hungate and Stack, 1982; Khan et al., 1999). The metabolites 3-phenylpropionate and tyrosine were important for the discrimination of the NYC and MVY groups, with higher serum concentrations in the NYC group. These findings suggest that the yeast culture in the NYC treatment may have enhanced fiber digestibility. Given the high fiber content of adaptation diets, this potential enhancement of fiber digestibility may have contributed to the increase in ADG observed in the NYC group.
Megasphaera elsdenii is the most important ruminal bacteria that utilizes lactic acid and therefore plays a key role in preventing ruminal lactic acid accumulation (Nagaraja and Titgemeyer, 2007). According to Russell (2002), M. elsdenii is an ammonia producer but can only use a limited number of amino acids for hydrolysis, such as serine and threonine, highlighting the importance of these amino acids for the growth of this bacteria. Accordingly, Rossi et al. (2004), assessing the effects of peptides fractions from yeast culture on the growth and metabolism of M. elsdenii, found that the hydrophilic peptide fraction, which is rich in serine and threonine, stimulated cell growth and the production of butyrate (+100%) and valerate (+76.1%), as well as lactate fermentation (+16.9%). The higher concentration of amino acids in the yeast culture in NYC may have enhanced the growth of M. elsdenii, supported by the higher serum levels of butyrate and lower levels of lactate in this group compared to MVY.
The second most important metabolite to differentiate NYC from MVY was hippurate, which is related to the most important metabolite for this differentiation, 3-phenylpropionate. Hippurate is a glycine conjugate of benzoic acid and a component normally found in the urine of animals, which is strongly associated with diet and microbiota (Lees et al., 2013). Pagella et al. (1997) found that most of the 3-phenylpropionic acid infused into the rumen of sheep is absorbed across the mucosal epithelium and transported to the liver, where it undergoes oxidative reactions and is converted to benzoic acid. The latter is then conjugated with glycine to form hippuric acid, which is subsequently excreted (Chesson et al., 1999). Thus, the increase in 3-phenylpropionate observed in the NYC group may have contributed to the higher serum hippurate levels in bulls of this group, confirming that yeast culture composition positively contributes to increasing the ruminal concentration of these important metabolites for fiber digestibility.
Lactate was important for discriminating the four treatments, with higher levels in the MVY group. Oliveira Júnior et al. (2023) found that, compared to exclusive MON supplementation, the combined use of MON and VM in feedlot diets increased serum D-lactate levels, upregulated the expression of pyruvate carboxylase and lactate dehydrogenase, and tended to increase the expression of propionyl-CoA carboxylase in the liver. These changes indicated higher ruminal metabolic activity in the MON and VM groups, increasing ADG compared to the exclusive MON group (Oliveira Júnior et al., 2023). Increased lactate dehydrogenase expression suggests that, along with D-lactate, serum L-lactate may also be elevated (Ewaschuk et al., 2005). Hence, the higher serum lactate levels in the MVY group could be associated with increased ruminal production of D- and L-lactate, as well as endogenous L-lactate.
One-carbon (methyl) metabolism is a complex network of interrelated biochemical reactions involving the transfer of one-carbon groups, which plays a pivotal role in biological methylation and nucleotide synthesis (Mason, 2003). The two main methyl donors in animal metabolism are betaine and S-adenosylmethionine (SAM), metabolites derived from choline and methionine metabolism, respectively (Pinotti et al., 2002). Since choline is extensively degraded in the rumen, the contribution of dietary choline to the choline body pool is neglectable (Baldi and Pinotti, 2006). For that reason, methionine synthase, the enzyme responsible for the de novo synthesis of methionine methyl groups, plays an important role in maintaining the methyl supply of ruminants (Dawson et al., 1981; Pinotti et al., 2002). According to Zeisel and Blusztajn (1994), when methionine and SAM levels are adequate, the latter will increase the level of S-adenosylhomocysteine, which limits the endogenous synthesis of choline through the phosphatidylethanolamine N-methyltransferase pathway. In this context, the higher levels of methionine in the MVY group would explain the lower levels of choline and betaine compared to the NYC group. It is reasonable to believe that there was an increase in microbial protein synthesis due to a potential increase in rumen metabolic activity in the MVY group as mentioned above, elevating the supply of methionine (Schwab and Broderick, 2017). This suggestion is supported by the elevated levels of other essential amino acids such as histidine, isoleucine, phenylalanine, and valine in the MVY group, which can be synthesized by ruminal bacteria (Schwab, 1995), as well as by enrichment analysis, in which the over-represented pathways were mostly correlated with amino acid metabolism (Figure 3A). Although the MVY treatment appears to enhance the uptake of essential amino acids, it was insufficient to improve animal performance compared to the NYC treatment.
Given the lack of substantial effects of the MVY and NLY treatments on DMI and performance during the adaptation period, the lower DMI of animals fed NLY during the finishing period may be linked to changes in ruminal fermentation patterns and in the serum metabolome. Overall, differences in serum metabolites between these groups were correlated with changes in energy and protein metabolism. Accordingly, the over-represented pathways in serum were correlated with energy metabolism, including pyruvate metabolism and gluconeogenesis (Figure 3B). Cônsolo et al. (2021) found higher serum concentrations of citrate and creatine phosphate in cattle that are more efficient in terms of residual feed intake, suggesting that the higher levels of these metabolites in NLY may represent a metabolic adaptation to substrate uptake. Additionally, in accordance with Dias Batista et al. (2024), who reported a linear increase in branched-chain volatile fatty ruminal concentration with an increase in VM dose in feedlot diets, the higher levels of certain branched-chain amino acids, such as valine and isoleucine, in the MVY group compared to NLY may reflect the impact of this molecule on rumen dynamics, potentially promoting rumen development and thereby explaining the greater DMI observed in MVY compared to NLY post-adaptation. Furthermore, serum lactate may also reflect the occurrence of some alterations in rumen pH and consequently in feeding behavior. According to González et al. (2012), increasing the distribution and reducing the size of meals throughout the day can help control rumen pH since it improves the synchronization between the production and uptake or neutralization of volatile fatty acids. The trend toward increasing meals per day in the MVY group compared to NDY, along with a numerical increase in the time spent ruminating and reduced resting time, may be a response to controlling rumen acidification.
5 Conclusion
The serum metabolome data revealed that Nellore bulls fed NYC during the adaptation period had a higher concentration of metabolites associated with fiber digestion compared to the other treatments, which likely contributed to the enhanced animal performance during grain adaptation period. Further research should investigate the effect of combining antimicrobials and yeast culture on rumen fermentation and diet digestibility in feedlot cattle during the grain adaptation period.
Data availability statement
The raw data supporting the conclusions of this article will be made available by the authors, without undue reservation.
Ethics statement
The animal studies were approved by All animal procedures were approved by the Animal Use Ethics Committee (CEUA – protocol 0585/2023) of the São Paulo State University, on February 9, 2024. The studies were conducted in accordance with the local legislation and institutional requirements. Written informed consent was obtained from the owners for the participation of their animals in this study.
Author contributions
RR: Conceptualization, Data curation, Formal analysis, Investigation, Writing – original draft. WB: Conceptualization, Writing – review & editing. NC: Writing – review & editing, Formal analysis. JM: Writing – review & editing, Investigation, Validation. RT: Formal analysis, Methodology, Writing – review & editing. JG: Writing – review & editing, Investigation. LCh: Writing – review & editing. RC: Writing – review & editing. GR: Writing – review & editing, Investigation, Methodology. LCo: Writing – review & editing. OM: Project administration, Supervision, Visualization, Writing – review & editing.
Funding
The author(s) declare that financial support was received for the research and/or publication of this article. This work was funded by Elanco Animal Health and Cargill-Nutron Animal Nutrition. This study also received financial support from the Coordenação de Aperfeiçoamento de Pessoal de Nível Superior (CAPES) – Finance Code 001. Additionally, this work was supported by the São Paulo Research Foundation (FAPESP) (Grant 2023/05002-3).
Acknowledgments
This work was funded by Elanco Animal Health and Cargill-Nutron Animal Nutrition. This study received financial support from Coordenação de Aperfeiçoamento de Pessoal de Nível Superior (CAPES) – Finance Code 001.
Conflict of interest
The authors declare that the research was conducted in the absence of any commercial or financial relationships that could be construed as a potential conflict of interest.
The author(s) declared that they were an editorial board member of Frontiers, at the time of submission. This had no impact on the peer review process and the final decision.
Generative AI statement
The author(s) declare that no Generative AI was used in the creation of this manuscript.
Publisher’s note
All claims expressed in this article are solely those of the authors and do not necessarily represent those of their affiliated organizations, or those of the publisher, the editors and the reviewers. Any product that may be evaluated in this article, or claim that may be made by its manufacturer, is not guaranteed or endorsed by the publisher.
Supplementary material
The Supplementary Material for this article can be found online at: https://www.frontiersin.org/articles/10.3389/fanim.2025.1574871/full#supplementary-material
References
Altmann J. (1974). Observational study of behavior: sampling methods. Behaviour 49, 227–266. doi: 10.1163/156853974X00534
AOAC (2005). Official Methods of Analysis of AOAC International. Washington DC: Association of Official Analysis Chemists International.
Atasoglu C., James Newbold C., John Wallace R. (2001). Incorporation of [15N] Ammonia by the Cellulolytic Ruminal Bacteria Fibrobacter succinogenesBL2, Ruminococcus albus SY3, and Ruminococcus flavefaciens 17. Appl. Environ. Microbiol. 67, 2819–2822. doi: 10.1128/AEM.67.6.2819-2822.2001
Baggio M., Gouvêa V. N., Barroso J. P. R., Miszura A. A., Limede A. C., Soares L. C. B., et al. (2023). Different combinations of monensin and narasin on growth performance, carcass traits, and ruminal fermentation characteristics of finishing beef cattle. Front. Vet. Sci. 10. doi: 10.3389/FVETS.2023.1117639/BIBTEX
Baldi A., Pinotti L. (2006). Choline metabolism in high-producing dairy cows: Metabolic and nutritional basis. Can. J. Anim. Sci. 86, 207–212. doi: 10.4141/A05-061
Brown M. S., Ponce C. H., Pulikanti R. (2006). Adaptation of beef cattle to high-concentrate diets: Performance and ruminal metabolism. J. Anim. Sci. 84, E25–E33. doi: 10.2527/2006.8413_SUPPLE25X
Burrin D. G., Stock R. A., Britton R. A. (1988). Monensin level during grain adaption and finishing performance in cattle. J. Anim. Sci. 66, 513–521. doi: 10.2527/JAS1988.662513X
Cagle C. M., Fonseca M. A., Callaway T. R., Runyan C. A., Cravey M. D., Tedeschi L. O. (2020). Evaluation of the effects of live yeast on rumen parameters and in situ digestibility of dry matter and neutral detergent fiber in beef cattle fed growing and finishing diets. Appl. Anim. Sci. 36, 36–47. doi: 10.15232/AAS.2019-01888
Callaway E. S., Martin S. A. (1997). Effects of a saccharomyces cerevisiae culture on ruminal bacteria that utilize lactate and digest cellulose. J. Dairy Sci. 80, 2035–2044. doi: 10.3168/JDS.S0022-0302(97)76148-4
Ceconi I., Viano S. A., Méndez D. G., González L., Davies P., Elizalde J. C., et al. (2022). Combined use of monensin and virginiamycin to improve rumen and liver health and performance of feedlot-finished steers. Transl. Anim. Sci. 6, txac154. doi: 10.1093/TAS/TXAC154
Chaucheyras F., Fonty G., Bertin G., Salmon J. M., Gouet P. (1996). Effects of a strain of Saccharomyces cerevisiae (Levucell SC1), a microbial additive for ruminants, on lactate metabolism in vitro. Can. J. Microbiol. 42, 927–933. doi: 10.1139/M96-119
Chesson A., Provan G., Russell W. R., Scobbie L., Richardson A. J., Stewart C. (1999). Hydroxycinnamic acids in the digestive tract of livestock and humans. J. Sci. Food Agric. 79, 373–378. doi: 10.1002/(SICI)1097-0010(19990301)79:3
Chizzotti M. L., Tedeschi L. O., Valadares Filho S. C. (2008). A meta-analysis of energy and protein requirements for maintenance and growth of Nellore cattle. J. Anim. Sci. 86, 1588–1597. doi: 10.2527/JAS.2007-0309
Cônsolo N. R. B., Buarque V. L. M., Silva J., Poleti M. D., Barbosa L. C. G. S., Higuera-Padilla A., et al. (2021). Muscle and liver metabolomic signatures associated with residual feed intake in Nellore cattle. Anim. Feed Sci. Technol. 271, 114757. doi: 10.1016/J.ANIFEEDSCI.2020.114757
Cônsolo N. R. B., da Silva J., Buarque V. L. M., Higuera-Padilla A., Barbosa L. C. G. S., Zawadzki A., et al. (2020). Selection for growth and precocity alters muscle metabolism in nellore cattle. Metabolites 10, 58. doi: 10.3390/METABO10020058
Cônsolo N. R. B., Silva J., Buarque V. M., Barbosa L. C., H. Padilla A., Colnago L. A., et al. (2022). Metabolomic signature of genetic potential for muscularity in beef cattle. Anim. Biotechnol. 33, 1308–1317. doi: 10.1080/10495398.2021.1894164
Cotta M. A., Russell J. B. (1982). Effect of peptides and amino acids on efficiency of rumen bacterial protein synthesis in continuous culture. J. Dairy Sci. 65, 226–234. doi: 10.3168/JDS.S0022-0302(82)82181-4
Crossland W. L., Cagle C. M., Sawyer J. E., Callaway T. R., Tedeschi L. O. (2019). Evaluation of active dried yeast in the diets of feedlot steers. II. Effects on rumen pH and liver health of feedlot steers. J. Anim. Sci. 97, 1347–1363. doi: 10.1093/JAS/SKZ008
Dawson R. M. C., Grime D. W., Lindsay D. B. (1981). On the insensitivity of sheep to the almost complete microbial destruction of dietary choline before alimentary-tract absorption. Biochem. J. 196, 499–504. doi: 10.1042/BJ1960499
Dias Batista L. F., Rivera M. E., Fonseca M. A., Tedeschi L. O. (2024). The influence of virginiamycin on digestion and ruminal parameters under feedlot conditions. Transl. Anim. Sci. 8, txae019. doi: 10.1093/TAS/TXAE019
Duffield T. F., Merrill J. K., Bagg R. N. (2012). Meta-analysis of the effects of monensin in beef cattle on feed efficiency, body weight gain, and dry matter intake. J. Anim. Sci. 90, 4583–4592. doi: 10.2527/JAS.2011-5018
Estrada-Angulo A., Mendoza-Cortez D. A., Ramos-Méndez J. L., Arteaga-Wences Y. J., Urías-Estrada J. D., Castro-Pérez B. I., et al. (2022). Comparing blend of essential oils plus 25-hydroxy-vit-D3 versus monensin plus virginiamycin combination in finishing feedlot cattle: growth performance, dietary energetics, and carcass traits. Animals 12, 1715. doi: 10.3390/ANI12131715
Ewaschuk J. B., Naylor J. M., Zello G. A. (2005). D-lactate in human and ruminant metabolism. J. Nutr. 135, 1619–1625. doi: 10.1093/JN/135.7.1619
Geng C. Y., Meng Q. X., Ren L. P., Zhou Z. M., Zhang M., Yan C. G. (2016). Comparison of ruminal fermentation parameters, fatty acid composition and flavour of beef in finishing bulls fed active dry yeast (Saccharomyces cerevisiae) and yeast culture. Anim. Prod. Sci. 58, 841–847. doi: 10.1071/AN15501
Goldansaz S. A., Guo A. C., Sajed T., Steele M. A., Plastow G. S., Wishart D. S. (2017). Livestock metabolomics and the livestock metabolome: A systematic review. PloS One 12, e0177675. doi: 10.1371/JOURNAL.PONE.0177675
González L. A., Manteca X., Calsamiglia S., Schwartzkopf-Genswein K. S., Ferret A. (2012). Ruminal acidosis in feedlot cattle: Interplay between feed ingredients, rumen function and feeding behavior (a review). Anim. Feed Sci. Technol. 172, 66–79. doi: 10.1016/J.ANIFEEDSCI.2011.12.009
Guliye A. Y., Atasoglu C., Wallace R. J. (2005). Assessment of amino acid requirements for optimum fermentation of xylan by mixed micro-organisms from the sheep rumen. Anim. Sci. 80, 353–360. doi: 10.1079/ASC41730353
Hungate R. E., Stack R. J. (1982). Phenylpropanoic acid: growth factor for ruminococcus albus. Appl. Environ. Microbiol. 44, 79–83. doi: 10.1128/AEM.44.1.79-83.1982
Khan R. I., Onodera R., Amin M. R., Mohammed N. (1999). Production of tyrosine and other aromatic compounds from phenylalanine by rumen microorganisms. Amino Acids 17, 335–346. doi: 10.1007/BF01361659/METRICS
Lees H. J., Swann J. R., Wilson I. D., Nicholson J. K., Holmes E. (2013). Hippurate: The natural history of a mammalian-microbial cometabolite. J. Proteome Res. 12, 1527–1546. doi: 10.1021/pr300900b
Limede A. C., Marques R. S., Polizel D. M., Cappellozza B. I., Miszura A. A., Barroso J. P. R., et al. (2021). Effects of supplementation with narasin, salinomycin, or flavomycin on performance and ruminal fermentation characteristics of Bos indicus Nellore cattle fed with forage-based diets. J. Anim. Sci. 99, 1–11. doi: 10.1093/JAS/SKAB005
Mason J. B. (2003). Biomarkers of nutrient exposure and status in one-carbon (Methyl) metabolism. J. Nutr. 133, 941S–947S. doi: 10.1093/JN/133.3.941S
Mehmood T., Liland K. H., Snipen L., Sæbø S. (2012). A review of variable selection methods in Partial Least Squares Regression. Chemo. Intell. Lab. Syst. 118, 62–69. doi: 10.1016/J.CHEMOLAB.2012.07.010
Mertens D. R. (2002). Gravimetric determination of amylase-treated neutral detergent fiber in feeds with refluxing in beakers or crucibles: collaborative study. J. AOAC Int. 85, 1217–1240. doi: 10.1093/jaoac/85.6.1217
Nagaraja T. G. (2007). Ionophores and antibiotics in ruminants. Biotechnol. Anim. Feeds Anim. Feed. 174, 173–204. doi: 10.1002/9783527615353.CH9
Nagaraja T. G., Taylor M. B., Harmon D. L., Boyer J. E. (1987). In vitro lactic acid inhibition and alterations in volatile fatty acid production by antimicrobial feed additives. J. Anim. Sci. 65, 1064–1076. doi: 10.2527/JAS1987.6541064X
Nagaraja T. G., Titgemeyer E. C. (2007). Ruminal acidosis in beef cattle: the current microbiological and nutritional outlook. J. Dairy Sci. 90, E17–E38. doi: 10.3168/JDS.2006-478
NASEM. (2016). Nutrient Requirements of Beef Cattle, Eighth Revised Edition. Washington, DC: National Academy Press. doi: 10.17226/19014
Niehues M. B., de Aquino Tomaz L., Ferreira M. S., Baldassini W. A., Chardulo L. A. L., Sartor A. B., et al. (2022). Assessment of corn wet distillers grains fed to crossbred bulls on feeding behavior, rumen morphology, liver abscesses and blood parameters. PloS One 17, e0271461. doi: 10.1371/JOURNAL.PONE.0271461
Oliveira Júnior J. M., Homem B. G. C., Cunha D., Lima Í. B. G., Rodrigues A. C., Maciel F. C., et al. (2023). Effect of the combined use of monensin with virginiamycin or bacitracin on beef cattle performance, liver gluconeogenesis, lipid metabolism and intramuscular fat content. Anim. Feed Sci. Technol. 304, 115735. doi: 10.1016/J.ANIFEEDSCI.2023.115735
Pagella J. H., Chen X. B., Macleod N. A., Ørskov E. R., Dewey P. J. S. (1997). Excretion of benzoic acid derivatives in urine of sheep given intraruminal infusions of 3-phenylpropionic and cyclohexanecarboxylic acids. Br. J. Nutr. 77, 577–592. doi: 10.1079/BJN19970058
Pinheiro T. R., Mercadante M. E. Z., Albuquerque L. G., Cyrillo J. N. S. G., Branco R. H. (2011). Phenotypic and genetic parameters compared during repeated measures of longissimus muscle area and subcutaneous fat thickness in Nelore cattle. Genet. Mol. Res. 10, 2944–2952. doi: 10.4238/2011.NOVEMBER.29.5
Pinotti L., Baldi A., Dell’Orto V. (2002). Comparative mammalian choline metabolism with emphasis on the high-yielding dairy cow. Nutr. Res. Rev. 15, 315–332. doi: 10.1079/NRR200247
Polizel D. M., Cappellozza B. I., Hoe F., Lopes C. N., Barroso J. P., Miszura A., et al. (2020). Effects of narasin supplementation on dry matter intake and rumen fermentation characteristics of Bos indicus steers fed a high-forage diet. Transl. Anim. Sci. 4, 118–128. doi: 10.1093/TAS/TXZ164
Rigueiro A. L. N., Pereira M. C. S., Squizatti M. M., Ferreira M. M., Dondé S. C., Luiz F. P., et al. (2020). Different combinations of sodium monensin and virginiamycin during feedlot finishing of Nellore cattle. Anim. Prod. Sci. 60, 1061–1072. doi: 10.1071/AN18657
Robles V., González L. A., Ferret A., Manteca X., Calsamiglia S. (2007). Effects of feeding frequency on intake, ruminal fermentation, and feeding behavior in heifers fed high-concentrate diets. J. Anim. Sci. 85, 2538–2547. doi: 10.2527/JAS.2006-739
Rossi F., Di Luccia A., Vincenti D., Cocconcelli P. S. (2004). Effects of peptidic fractions from Saccharomyces cerevisiae culture on growth and metabolism of the ruminal bacteria Megasphaera elsdenii. Anim. Res. 53, 177–186. doi: 10.1051/ANIMRES:2004009
Russell J. B. (2002). Rumen microbiology and its role in ruminant nutrition (Ithaca, NY: Department of Microbiology, Cornell University, Department of Microbiology, Cornell University).
Russell J. B., Strobel H. J. (1989). MINIREVIEW Effect of lonophores on Ruminal Fermentation. Appl. Environ. Microbiol. 55, 1–6. Available at: https://journals.asm.org/journal/aem.
Samuelson K. L., Hubbert M. E., Galyean M. L., Löest C. A. (2016). Nutritional recommendations of feedlot consulting nutritionists: The 2015 New Mexico State and Texas Tech University survey. J. Anim. Sci. 94, 2648–2663. doi: 10.2527/JAS.2016-0282
Sartori E. D., Eugênia M., Canozzi A., Zago D., Prates Ê. R., Velho J. P., et al. (2017). The effect of live yeast supplementation on beef cattle performance: A systematic review and meta-analysis. J. Agric. Sci. 9, p21. doi: 10.5539/JAS.V9N4P21
Scarpellini E., Rinninella E., Basilico M., Colomier E., Rasetti C., Larussa T., et al. (2021). From pre- and probiotics to post-biotics: A narrative review. Int. J. Environ. Res. Public Health 2022 19, 37. doi: 10.3390/IJERPH19010037
Schwab C. G. (1995). Protected proteins and amino acids for ruminants. Biotechnol. Anim. Feeds Anim. Feed. 141, 115–141. doi: 10.1002/9783527615353.CH7
Schwab C. G., Broderick G. A. (2017). A 100-Year Review: Protein and amino acid nutrition in dairy cows. J. Dairy Sci. 100, 10094–10112. doi: 10.3168/JDS.2017-13320
Shen Y., Wang H., Ran T., Yoon I., Saleem A. M., Yang W. (2018). Influence of yeast culture and feed antibiotics on ruminal fermentation and site and extent of digestion in beef heifers fed high grain rations. J. Anim. Sci. 96, 3916–3927. doi: 10.1093/JAS/SKY249
Silvestre A. M., Millen D. D. (2021). The 2019 Brazilian survey on nutritional practices provided by feedlot cattle consulting nutritionists. Rev. Bras. Zootecnia 50, 1–25. doi: 10.37496/RBZ5020200189
Silvestre A. M., Souza J. M., Millen D. D. (2023). Adoption of adaptation protocols and feed additives to improve performance of feedlot cattle. J. Appl. Anim. Res. 51, 282–299. doi: 10.1080/09712119.2023.2191679
Tedeschi L. O., Fox D. G., Tylutki T. P. (2003). Potential environmental benefits of ionophores in ruminant diets. J. Environ. Qual. 32, 1591–1602. doi: 10.2134/JEQ2003.1591
Zeisel S. H., Blusztajn J. K. (1994). Choline and human nutrition. Annu. Rev. Nutr. 14, 269–296. doi: 10.1146/ANNUREV.NU.14.070194.001413/CITE/REFWORKS
Keywords: antimicrobials, adaptation, beef cattle, feed additive, feedlot
Citation: Ribeiro RV, Baldassini WA, Cônsolo NRB, Moreira JBdS, Torres RdNS, Galvão JLC, Chardulo LAL, Curi RA, Ribeiro GH, Colnago LA and Machado Neto OR (2025) Effects of combining yeast products with antimicrobials in grain adaptation diets for feedlot Nellore bulls on performance, behavior, and metabolome. Front. Anim. Sci. 6:1574871. doi: 10.3389/fanim.2025.1574871
Received: 11 February 2025; Accepted: 14 April 2025;
Published: 12 May 2025.
Edited by:
Thiago Bernardes, Universidade Federal de Lavras, BrazilReviewed by:
Jéssica Gusmão, Agro Pastoril Paschoal Campanelli, BrazilLuiz Fernando Dias Batista, Bovine Dynamics, Australia
Copyright © 2025 Ribeiro, Baldassini, Cônsolo, Moreira, Torres, Galvão, Chardulo, Curi, Ribeiro, Colnago and Machado Neto. This is an open-access article distributed under the terms of the Creative Commons Attribution License (CC BY). The use, distribution or reproduction in other forums is permitted, provided the original author(s) and the copyright owner(s) are credited and that the original publication in this journal is cited, in accordance with accepted academic practice. No use, distribution or reproduction is permitted which does not comply with these terms.
*Correspondence: Otávio Rodrigues Machado Neto, b3RhdmlvLm1hY2hhZG9AdW5lc3AuYnI=